1. Introduction
A typhoon is a cyclonic vortex that commonly occurs in tropical oceans. When the maximum wind speed at its center reaches or exceeds 12 levels (32.7 m/s), it is called a typhoon [
1]. Statistics show that about 80 tropical cyclones occur worldwide each year [
2]. The occurrence of typhoons is usually accompanied by strong winds and heavy rains, making it a disastrous weather system [
3]. When a typhoon makes landfall, it can cause secondary disasters such as mudslides, landslides, and flash floods in areas with fragile environments, posing a threat to lives and causing economic losses, with strong destructive power [
4]. For example, Hurricane Katrina in 2005 caused severe damage to the New Orleans area in the United States, demonstrating the destructive power of typhoons [
5].
When a typhoon passes, it causes significant disturbance to the upper ocean. The upper ocean responds to the typhoon, resulting in changes in temperature, salinity, and the mixed layer, while the ocean also provides energy for the development of the typhoon [
6]. Therefore, the thermal structure of the ocean is an important factor affecting typhoons [
7]. Studies have shown that warm sea surface temperatures can significantly enhance the intensity of typhoons, causing them to rapidly upgrade to strong typhoons in a short time [
8]. For example, Typhoon Pamela in 2015 rapidly intensified over a warm sea surface [
9]. Accurately observing typhoon intensity and achieving accurate predictions of typhoon development trends are crucial for disaster prevention and social and economic progress, attracting widespread attention from researchers worldwide [
10].
The impact of typhoons on coastal areas is particularly significant. Strong winds and heavy rains can trigger storm surges, floods, and landslides, causing great damage to coastal infrastructure, agricultural production, and residents’ lives [
11]. Therefore, understanding and predicting the impact of typhoons on the thermal structure of the ocean is crucial for reducing disaster risks in coastal areas [
12].
In recent years, deep learning techniques, such as convolutional neural networks (CNNs) and transformer models, have been increasingly applied to the study of typhoon dynamics and ocean thermal structures. For instance, studies have shown that CNNs can effectively extract complex spatiotemporal features from satellite data [
13]. Additionally, Transformers, known for their attention mechanisms, have demonstrated potential in handling multi-source datasets and reconstructing three-dimensional thermal structures [
14]. These models excel in analyzing complex datasets, such as satellite observations and Argo float measurements, enabling accurate predictions of ocean–typhoon interactions, crucial for improving typhoon intensity forecasts and mitigating their impacts.
Moreover, news reports play a crucial role in documenting typhoon events and disseminating disaster prevention information. In this study, we apply text mining and natural language processing (NLP) techniques to analyze a large corpus of news reports, extracting key information such as affected regions, disaster severity, and preventive measures. By quantifying the data from these reports, we reveal the spatiotemporal distribution of typhoon events, identifying patterns in media coverage across different regions and time periods, and offering valuable insights into public perception and disaster preparedness [
15,
16].
Furthermore, we integrate the news reports with actual data from satellite observations and oceanographic models to assess discrepancies between media coverage and the real impacts of typhoons [
17,
18]. This comprehensive analysis helps to identify biases in reporting and provides scientific evidence to improve disaster prevention and response strategies in coastal areas, offering a more complete understanding of typhoon impacts.
The main contributions of this study are twofold. First, we apply deep learning techniques, particularly CNNs and transformer models, to reconstruct the three-dimensional thermal structure of the ocean in regions affected by typhoons. These models are capable of processing multi-source datasets, including satellite observations and Argo float measurements, to accurately predict the interactions between the ocean and typhoons. Second, we integrate the analysis of news reports on typhoon events to explore their impact and assess how well the media reflects the spatial and temporal distribution of these natural disasters. By combining physical oceanographic modeling with media analysis, this interdisciplinary approach provides valuable insights for improving typhoon forecasting accuracy and enhancing disaster preparedness.
The structure of this paper is organized as follows:
Section 2 introduces the data sources used in this study;
Section 3 provides a detailed description of the research methodology;
Section 4 evaluates the accuracy of the results and discusses the findings; finally,
Section 5 concludes with the main conclusions drawn from the study.
2. Data
This study harnesses a diverse array of satellite data and in-situ observations from several authoritative sources to construct and calibrate a high-precision ocean temperature prediction model. Central to this research are sea level anomaly (SLA) and sea surface temperature (SST) data, which are sourced from the Copernicus Marine Environment Monitoring Service (CMEMS). The SLA dataset, characterized by a spatial resolution of 0.25°, spans from January 1993 to June 2023, providing over thirty years of critical data necessary for comprehensive sea level trend analysis. This extensive temporal coverage allows for the identification of both short-term fluctuations and long-term trends, which are essential for understanding the dynamic processes governing sea level changes. In parallel, the SST data, with its finer spatial resolution of 0.05°, offers a detailed depiction of sea surface temperature variations, which is crucial for the study of ocean thermal processes, including heat distribution and exchange with the atmosphere.
Moreover, the wind field data, which include the u and v components of wind, are derived from the cross-calibrated multi-platform (CCMP) Level 4 dataset. This sophisticated dataset integrates satellite observations with reanalysis data to generate comprehensive global ocean vector wind fields. The multi-source data fusion employed in the CCMP ensures that the wind field data maintain both extensive spatial coverage and high precision. This makes it a vital resource for simulating wind-driven ocean processes, such as upwelling, circulation patterns, and the transportation of heat and nutrients across vast oceanic expanses. The high spatial and temporal resolution of the CCMP dataset is particularly advantageous for capturing the nuanced variations in wind fields, which can have significant impacts on ocean dynamics and subsequently on marine ecosystems and climate.
To enhance the accuracy of our model’s temperature predictions, we incorporated in-situ observations from Argo floats, which were provided by the French Research Institute for Exploitation of the Sea (IFREMER). These observations include global ocean temperature and salinity profiles, characterized by high spatial and temporal resolution, thereby offering a robust foundation for model calibration. The widespread distribution and continuous observational capabilities of the Argo float network provide invaluable data that are essential for capturing the complex vertical and horizontal structures of the ocean. These data not only inform the model of current oceanic conditions but also enable the accurate simulation of temperature variations and heat content across different ocean layers, from the surface down to the deep ocean.
Typhoon data were obtained from the China Meteorological Administration’s Tropical Cyclone Data Center, specifically the Satellite Analyzed Tropical Cyclone Dataset (version 3.0). This dataset provides six-hourly updates on the position, intensity, and scale of typhoons in the Northwest Pacific, derived entirely from satellite observations. In this study, data from a total of 135 typhoon events that occurred in China and the Northwest Pacific region from 2011 to 2020 were utilized. Typhoons, as intense meteorological phenomena, have profound impacts on the marine environment, influencing factors such as oceanic heat content, salinity, and even the distribution of marine species. The dataset offers critical insights into the behavior of typhoons, including their formation, trajectory, and the resultant effects on oceanic processes. Understanding these impacts is essential for developing predictive models that can simulate the response of ocean conditions to typhoon events, thereby improving the accuracy of forecasts during extreme weather conditions.
Additionally, this study references news report data from the “China National Knowledge Infrastructure (CNKI)–China Important Newspapers Full-text Database”, covering a period from 1 January 2011 to 31 December 2020. Through meticulous content analysis of typhoon-related news, this study categorizes reporting topics into economic, ecological, political, and scientific domains, and conducts a detailed quantitative analysis of 1622 news reports. These reports provide a rich contextual background that is instrumental in examining the societal impacts of typhoons, as well as the media’s role in shaping public perception and policy responses. The inclusion of this qualitative data enriches the research by offering insights into the broader implications of typhoon events beyond the physical and environmental effects, encompassing social, economic, and political dimensions as well.
By integrating these diverse and authoritative data sources, our model has undergone rigorous training, enabling it to provide accurate temperature predictions in complex ocean environments. These datasets encompass various critical aspects, from sea level and sea surface temperature to wind fields and typhoon activity, offering comprehensive support for model development. Additionally, the inclusion of news data not only provides valuable insights into the societal impacts of typhoons but also aids in analyzing how media coverage shapes public perception and influences policymaking. By integrating data from CMEMS, IFREMER’s Argo floats, the China Meteorological Administration, and CNKI, we ensure that the model is grounded in high-quality, reliable data, thereby enhancing the scientific validity and robustness of our research outcomes. In summary, these diversified data sources not only strengthen the foundation of this study but also allow us to gain a more comprehensive understanding of oceanic processes and their interactions with atmospheric and terrestrial systems, while also revealing the broad societal and political impacts of typhoon events.
3. Method
This section outlines the methodologies employed in this study, which are foundational to the successful achievement and validation of the research objectives. This research utilizes advanced deep learning techniques to reconstruct ocean subsurface temperature anomalies and systematically explores the communication content related to typhoon impacts using content analysis methods from journalism. By integrating these diverse methodologies, the study aims to provide a comprehensive understanding of both the physical processes in oceanography and the narrative frameworks in journalism that shape public and policy responses.
3.1. Model Architecture for Temperature Anomaly Reconstruction
In the field of deep learning, this study introduces a fully connected transformer network (FCT), an advanced deep learning architecture that seamlessly integrates fully connected layers with the transformer model. This architecture is specifically designed to address the complex task of reconstructing ocean subsurface temperature anomalies (STAs), particularly in regions affected by typhoons. The FCT is intended to capture the intricate relationships between surface wind patterns and subsurface thermal structures, making it a powerful tool in oceanographic research. As illustrated in
Figure 1, the model’s input consists of wind vector data, where the u component (uvel) and v component (vvel) represent the zonal and meridional components of horizontal wind speed, respectively. These wind vectors are crucial for understanding how surface winds influence subsurface ocean temperatures, especially under extreme weather conditions such as typhoons.
The wind vector data are first subjected to feature extraction through a sophisticated encoder module within the FCT. Each component of the wind vector—uvel and vvel—is processed independently by two distinct encoders. These encoders are designed to extract key features from the input data, capturing the essential dynamics that drive the interaction between atmospheric forces and oceanic responses. The use of independent encoders allows the model to separately analyze the influence of each wind component, leading to a more nuanced and accurate mapping to the ocean temperature profile.
Following the initial feature extraction, the model proceeds to enhance and integrate these features through a series of critical processing steps, which are crucial for developing a comprehensive understanding of multi-scale oceanographic data. Firstly, normalization layers are employed to standardize the output features from the encoders. This standardization is essential for eliminating numerical scale differences inherent in the data, which can arise due to the varying magnitudes of the wind components and other factors. By normalizing the features, the model not only improves training stability but also enhances the effectiveness of feature representation, allowing for more precise learning of the underlying physical processes.
The model then utilizes a multi-head attention mechanism (MHA), a key innovation in the transformer architecture. The MHA allows the model to compute multiple attention distributions in parallel, enabling it to focus on different aspects of the input data simultaneously. This mechanism is particularly beneficial for capturing the complex and often non-linear relationships between wind vector data and the ocean temperature profiles. The ability to consider multiple perspectives in parallel allows the FCT to effectively model the interactions between surface winds and subsurface thermal structures, even in the presence of highly dynamic and turbulent conditions associated with typhoons.
Subsequent to the attention mechanism, the features are further processed by a feed-forward network (FFN), which applies nonlinear transformations to the attention-processed features. The FFN consists of multiple fully connected layers, which are designed to explore the complex patterns within the data, capturing higher-order interactions that are critical for accurate temperature reconstruction. By passing the features through these nonlinear transformations, the model enhances its capacity to understand the intricate thermal dynamics that occur beneath the ocean surface, especially in response to atmospheric disturbances like typhoons.
Ultimately, the model integrates these multi-scale features, which include sea level anomaly (SLA) and sea surface temperature (SST), through a fully connected layer (FC) to generate the final reconstructed temperature profile output. The integration of these diverse features ensures that the model considers all relevant factors, from surface conditions to deeper oceanic responses, in its reconstruction of the subsurface temperature anomalies.
The training of the FCT model is grounded in high-quality observational data from Argo floats, specifically temperature profile data collected from the Western Pacific region between 2011 and 2020. This dataset is particularly valuable as it spans a full decade, providing a comprehensive view of temperature variations across different ocean depth levels, ranging from 5 m to 1000 m across 46 distinct depth layers. The data underwent rigorous quality control and filtering processes to ensure its accuracy and reliability, which are critical for the model’s ability to learn and generalize effectively.
By utilizing this extensive and carefully curated dataset, the FCT model was able to learn the complex characteristics of ocean temperature variations across different depths, enhancing its capability to accurately reconstruct three-dimensional thermal structures, even under the disruptive influence of typhoons. The final model output successfully reconstructed the three-dimensional thermal structure characteristics of the Western Pacific region. To validate the accuracy and reliability of the model’s inversion results, the reconstructed temperature profiles were compared against independent Argo observations from regions directly affected by typhoons. These validation data were selected based on precise typhoon location information, ensuring that the evaluation of the model’s performance was both rigorous and contextually relevant.
3.2. Content Analysis in Journalism Studies
In the field of journalism studies, this research employs content analysis as a method, aiming to provide an objective, systematic, and quantitative description of textual content, thereby overcoming the inherent subjectivity and uncertainty present in qualitative research. Throughout the study, individual news reports were used as the fundamental units of analysis. We systematically undertook the selection of analysis units, the determination of classification codes, the refinement of evaluation records, and the quantitative analysis of materials, ultimately constructing three categories of analytical indicators: reporting topics, reporting subjects, and news types. Reporting topics were divided into four categories: “economic topics”, which involve the impact of typhoons on economic aspects such as the stability of social security systems and fluctuations in household income; “ecological topics”, which focus on the environmental impacts caused by typhoons; “political topics”, which cover the various measures and related meetings undertaken by the government in response to typhoons; and “scientific topics”, which concentrate on popularizing the formation mechanisms, structural characteristics, and future trajectories of typhoons.
Regarding the classification of reporting subjects and news types, the research further refined the analytical framework. Reporting subjects were divided into two main categories: “humans” and “objects”. The “humans” category includes five subcategories: “experts”, “the public”, “government officials”, “enterprises”, and “media”. The “objects” category encompasses six subcategories: “animal groups”, “buildings and transportation facilities”, “natural landscapes”, “agricultural crops and livestock”, “typhoons”, and “technology”. In terms of news types, reports that primarily explore and explain the underlying causes, impacts, developmental trends, and deeper meanings behind news facts were classified as “explanatory news”, while reports that reconstruct news events on-site through detailed descriptions were classified as “descriptive news”.
4. Results and Discussion
4.1. Typhoon-Induced Temperature Anomaly and Model Validation
This model reconstructs the impact of typhoons on ocean temperatures at various depths over the decade from 2011 to 2020. While Typhoon Lekima is used as a representative case study due to its distinct characteristics, the model was trained and validated using data from numerous typhoon events between 2011 and 2020, ensuring the robustness and generalizability of the findings. Specifically, 80% of the data was utilized for model training and 20% for validation, allowing for comprehensive evaluation across multiple years and regions.
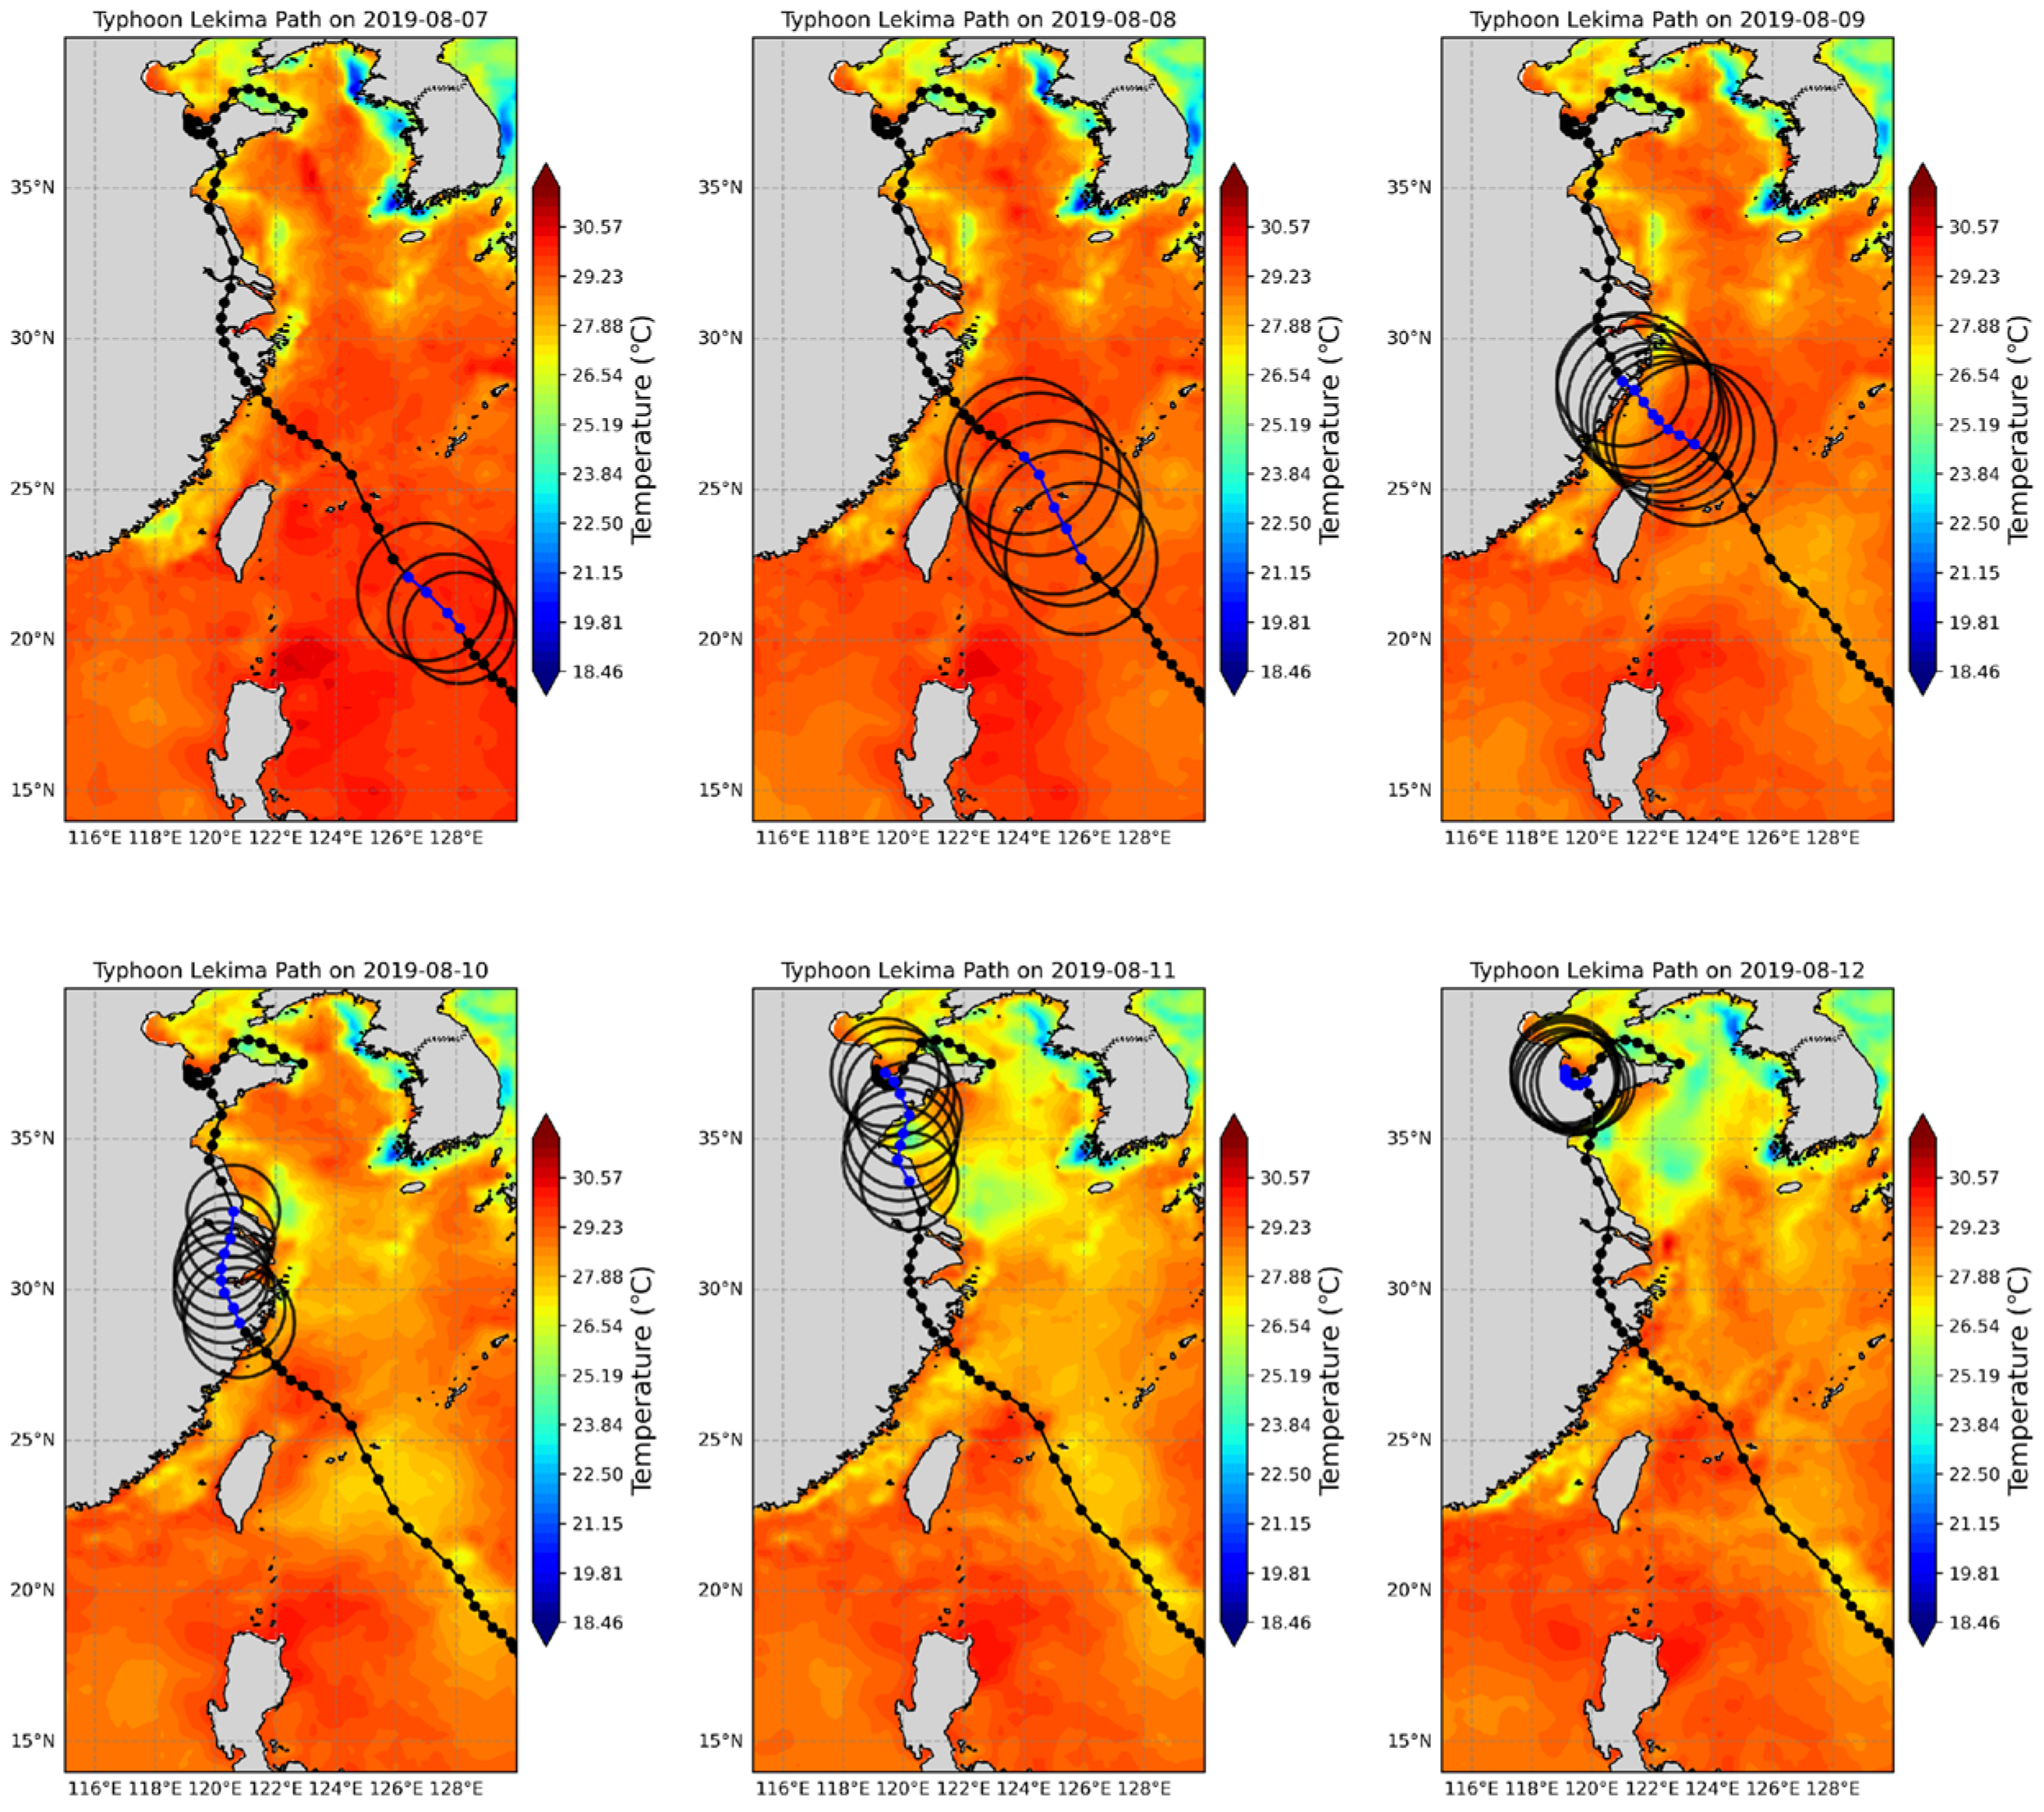
Figure 2 depicts the path of Typhoon Lekima from 7 August to 12 August 2019, along with its corresponding gale force wind radius. The background shows the ocean temperature distribution at a depth of 50 m, derived from the FCT model. The colors in the figure indicate different temperature levels: warm colors (such as orange and red) represent higher temperatures, while cool colors (such as blue) denote lower temperatures. The color bar on the right clearly marks the temperature scale. The black solid line traces the typhoon’s path, black circles represent the radius of gale force winds around the typhoon’s center, and black dots indicate the typhoon’s center at various times, with blue dots highlighting its position on specific days.
As Typhoon Lekima moved from the western Pacific towards China’s eastern coast, significant changes in the temperature distribution at a depth of 50 m were observed. The ocean temperature on the western side of the typhoon’s path was higher, while the eastern side exhibited relatively lower temperatures. This pattern reflects the substantial influence of the typhoon’s strong winds and precipitation on the ocean environment. The intense wind field not only sustained higher sea surface temperatures on the western side but also induced strong ocean mixing on the eastern side. In particular, the strong winds and heavy rainfall caused vertical disturbances, bringing cooler deep water to the surface and leading to a pronounced “upwelling” effect, resulting in a noticeable cold band [
19].
The cooling effect along the typhoon’s path was especially pronounced. As the typhoon advanced, the combination of strong winds and heavy precipitation caused significant mixing of the upper ocean layers, pulling cooler deep water to the surface. This led to a marked decrease in sea surface temperature along the typhoon’s central path, forming what is known as a “cold wake” [
20]. This cooling effect was driven not only by upwelling but also potentially by the typhoon’s blocking of solar radiation and the dispersal of cooler water due to heavy rainfall, resulting in a distinct cold band along the typhoon’s trajectory.
After reconstructing the three-dimensional thermal structure of the ocean under the influence of a typhoon, we employed Argo observational data within the affected region to rigorously assess the accuracy of our predictions.
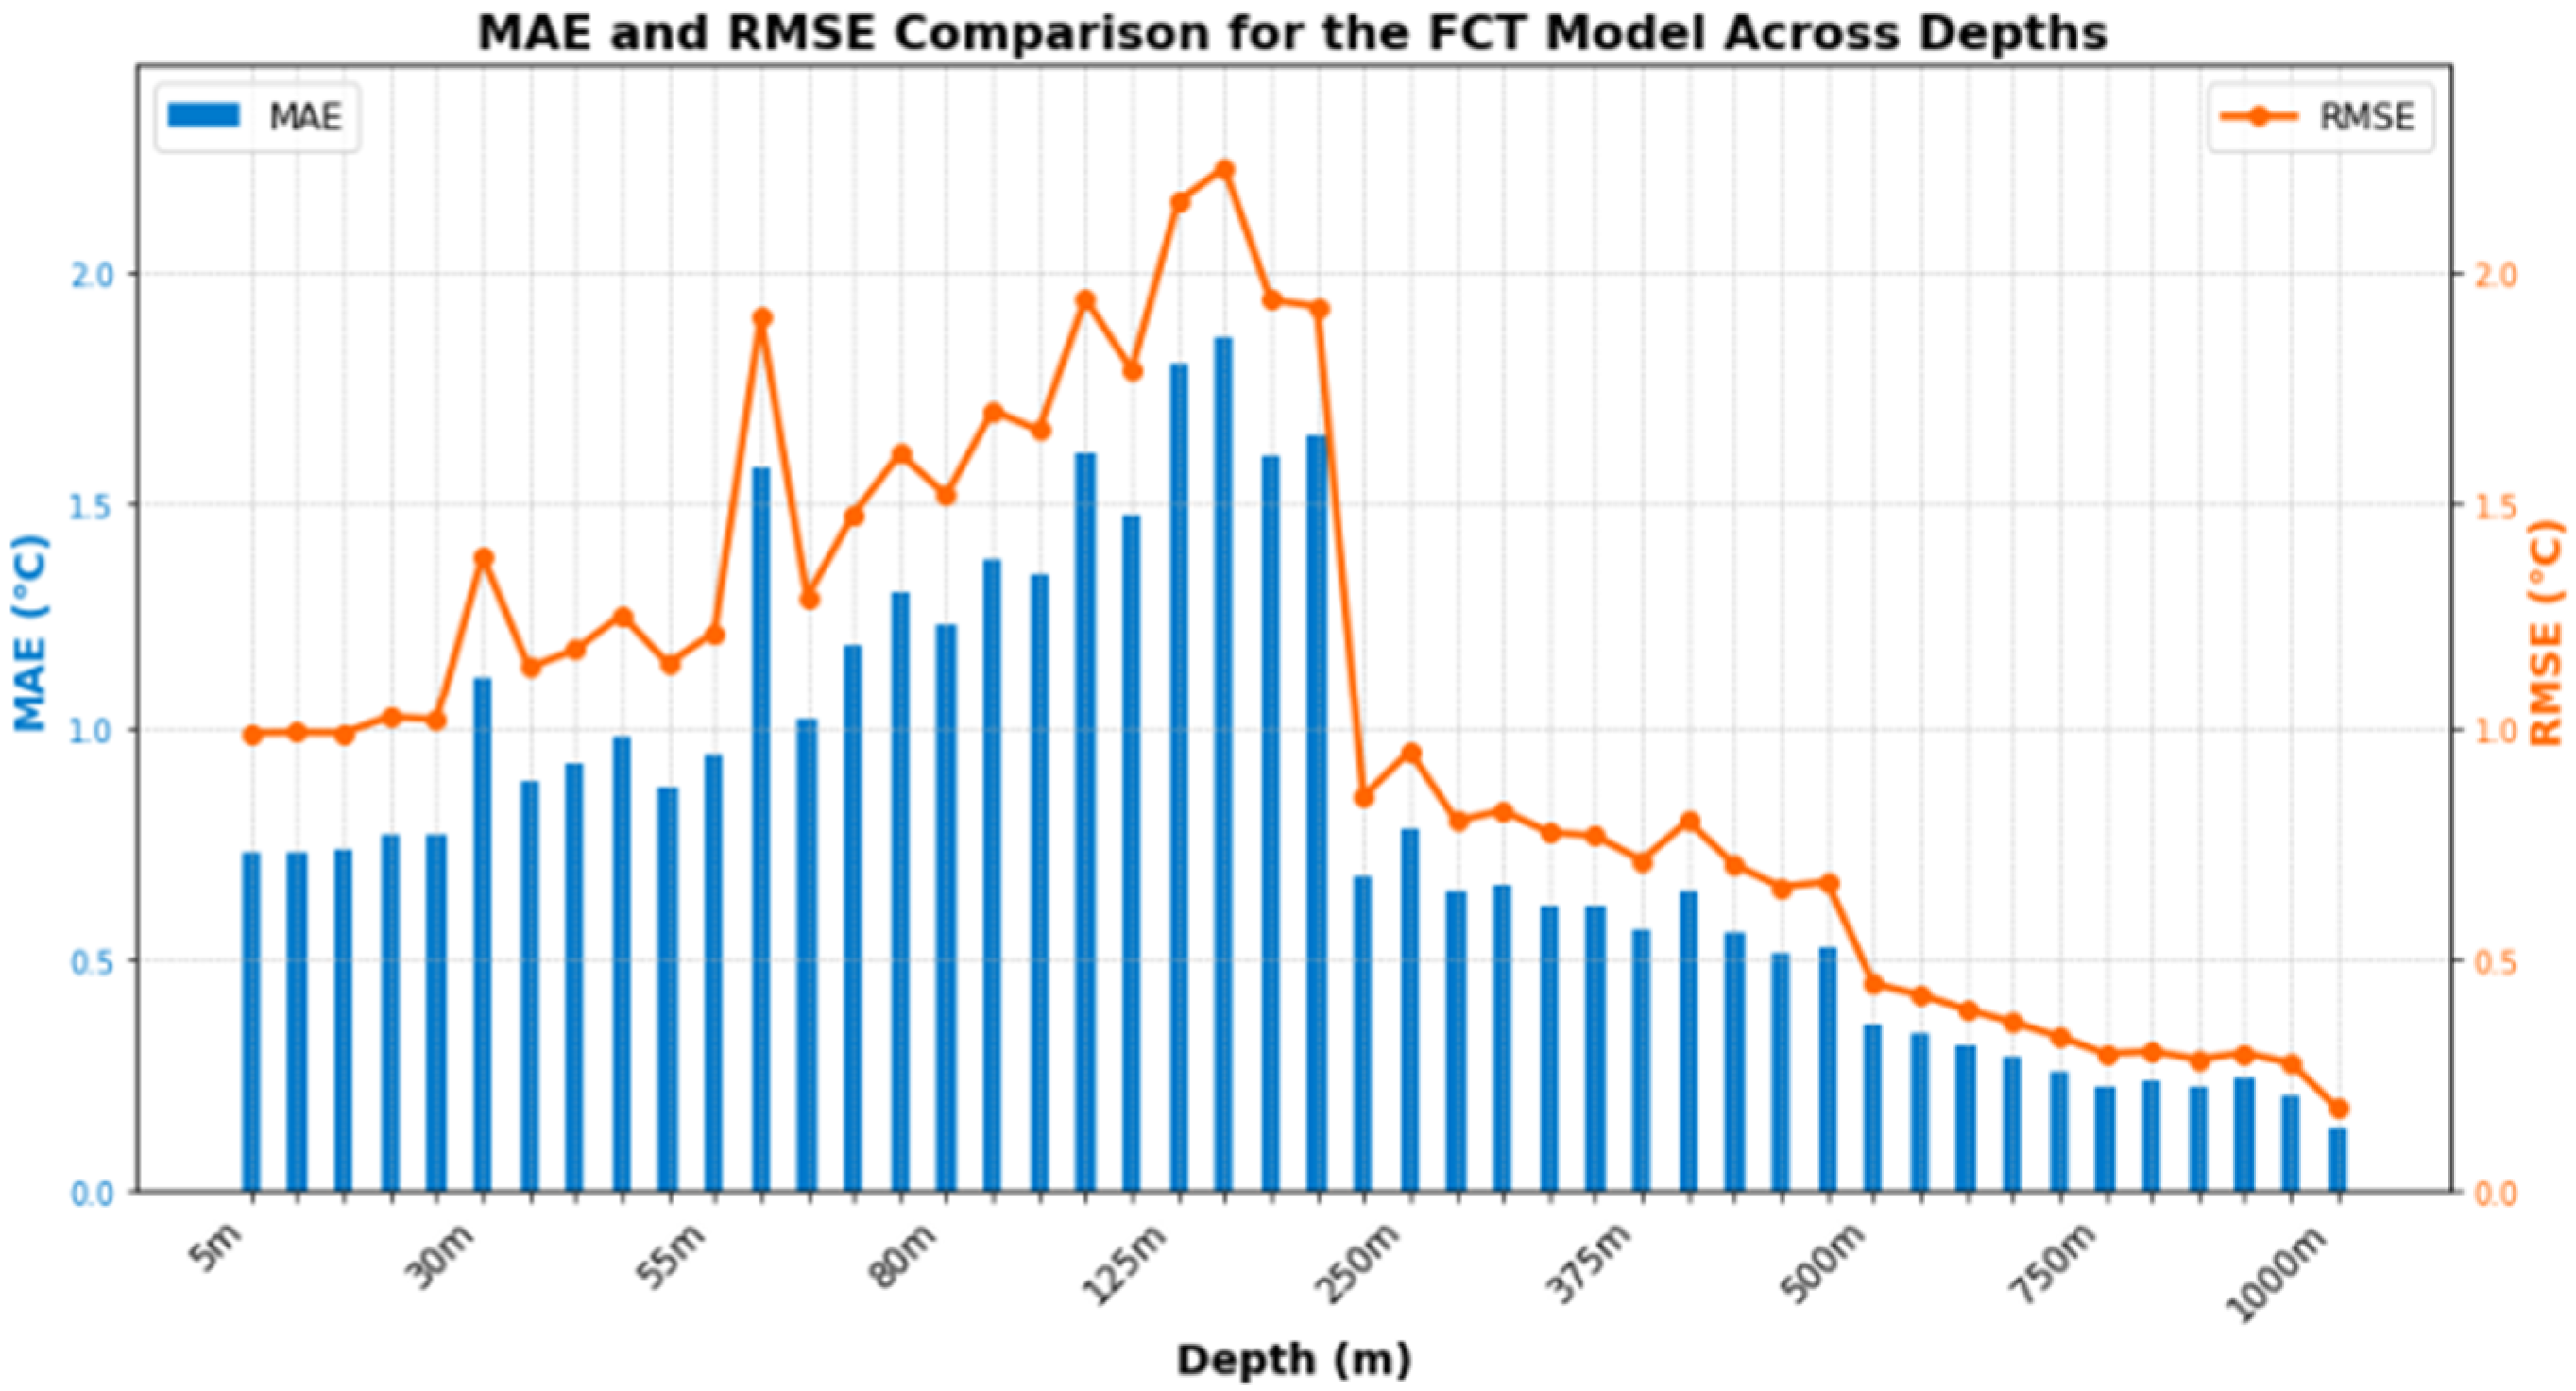
Figure 3 displays the prediction errors of ocean temperatures at various depths during the typhoon event as modeled by the fully connected transformer network (FCT). This figure offers a detailed comparison of the variation trends of the mean absolute error (MAE) and root mean squared error (RMSE) with depth, providing critical insights into the model’s performance. The blue bars represent the MAE values at each depth, while the orange line delineates the corresponding RMSE values. On average, the model exhibits an MAE of 0.8283 °C and an RMSE of 1.0338 °C, reflecting the overall predictive accuracy of the FCT model.
In the upper ocean layers, particularly between 5 and 50 m, the model shows robust predictive capabilities, as evidenced by the relatively low MAE, which ranges between 0.4 °C and 0.6 °C, and the RMSE, which remains close to 0.5 °C. This level of accuracy is anticipated because shallow waters tend to respond more rapidly to surface wind forcing, making temperature variations more predictable. However, as depth increases—particularly between 100 and 250 m—both the MAE and RMSE show a notable rise. The RMSE peaks at around 2.2 °C near 125 m, while the MAE reaches approximately 1.5 °C in this range. These increases in error metrics align with the presence of more complex oceanographic dynamics in intermediate depths, such as the thermocline and the mixed layer. According to Li et al. (2015), thermocline dynamics play a pivotal role in subsurface thermal structures, where deeper thermoclines can weaken the influence of subsurface variability on sea surface temperature [
21]. This can lead to reduced prediction accuracy, as seen in our results, where the presence of strong thermal gradients in the thermocline significantly contributes to higher prediction errors. The variations in thermocline depth and strength, coupled with the dynamic behavior of internal waves and stratification processes, further exacerbate the model’s difficulty in capturing temperature changes at these depths.
At greater depths, notably at 500 m and beyond, both the MAE and RMSE show a marked decrease, eventually stabilizing. By the time the model reaches 1000 m, the MAE and RMSE have dropped to approximately 0.2 °C. This reduction in error indicates that deeper ocean temperatures exhibit less variability and are less directly influenced by typhoon-induced disturbances. The stability of temperature variations at these depths results in a higher level of prediction accuracy by the model, reflecting the more consistent and predictable nature of deep ocean thermal structures.
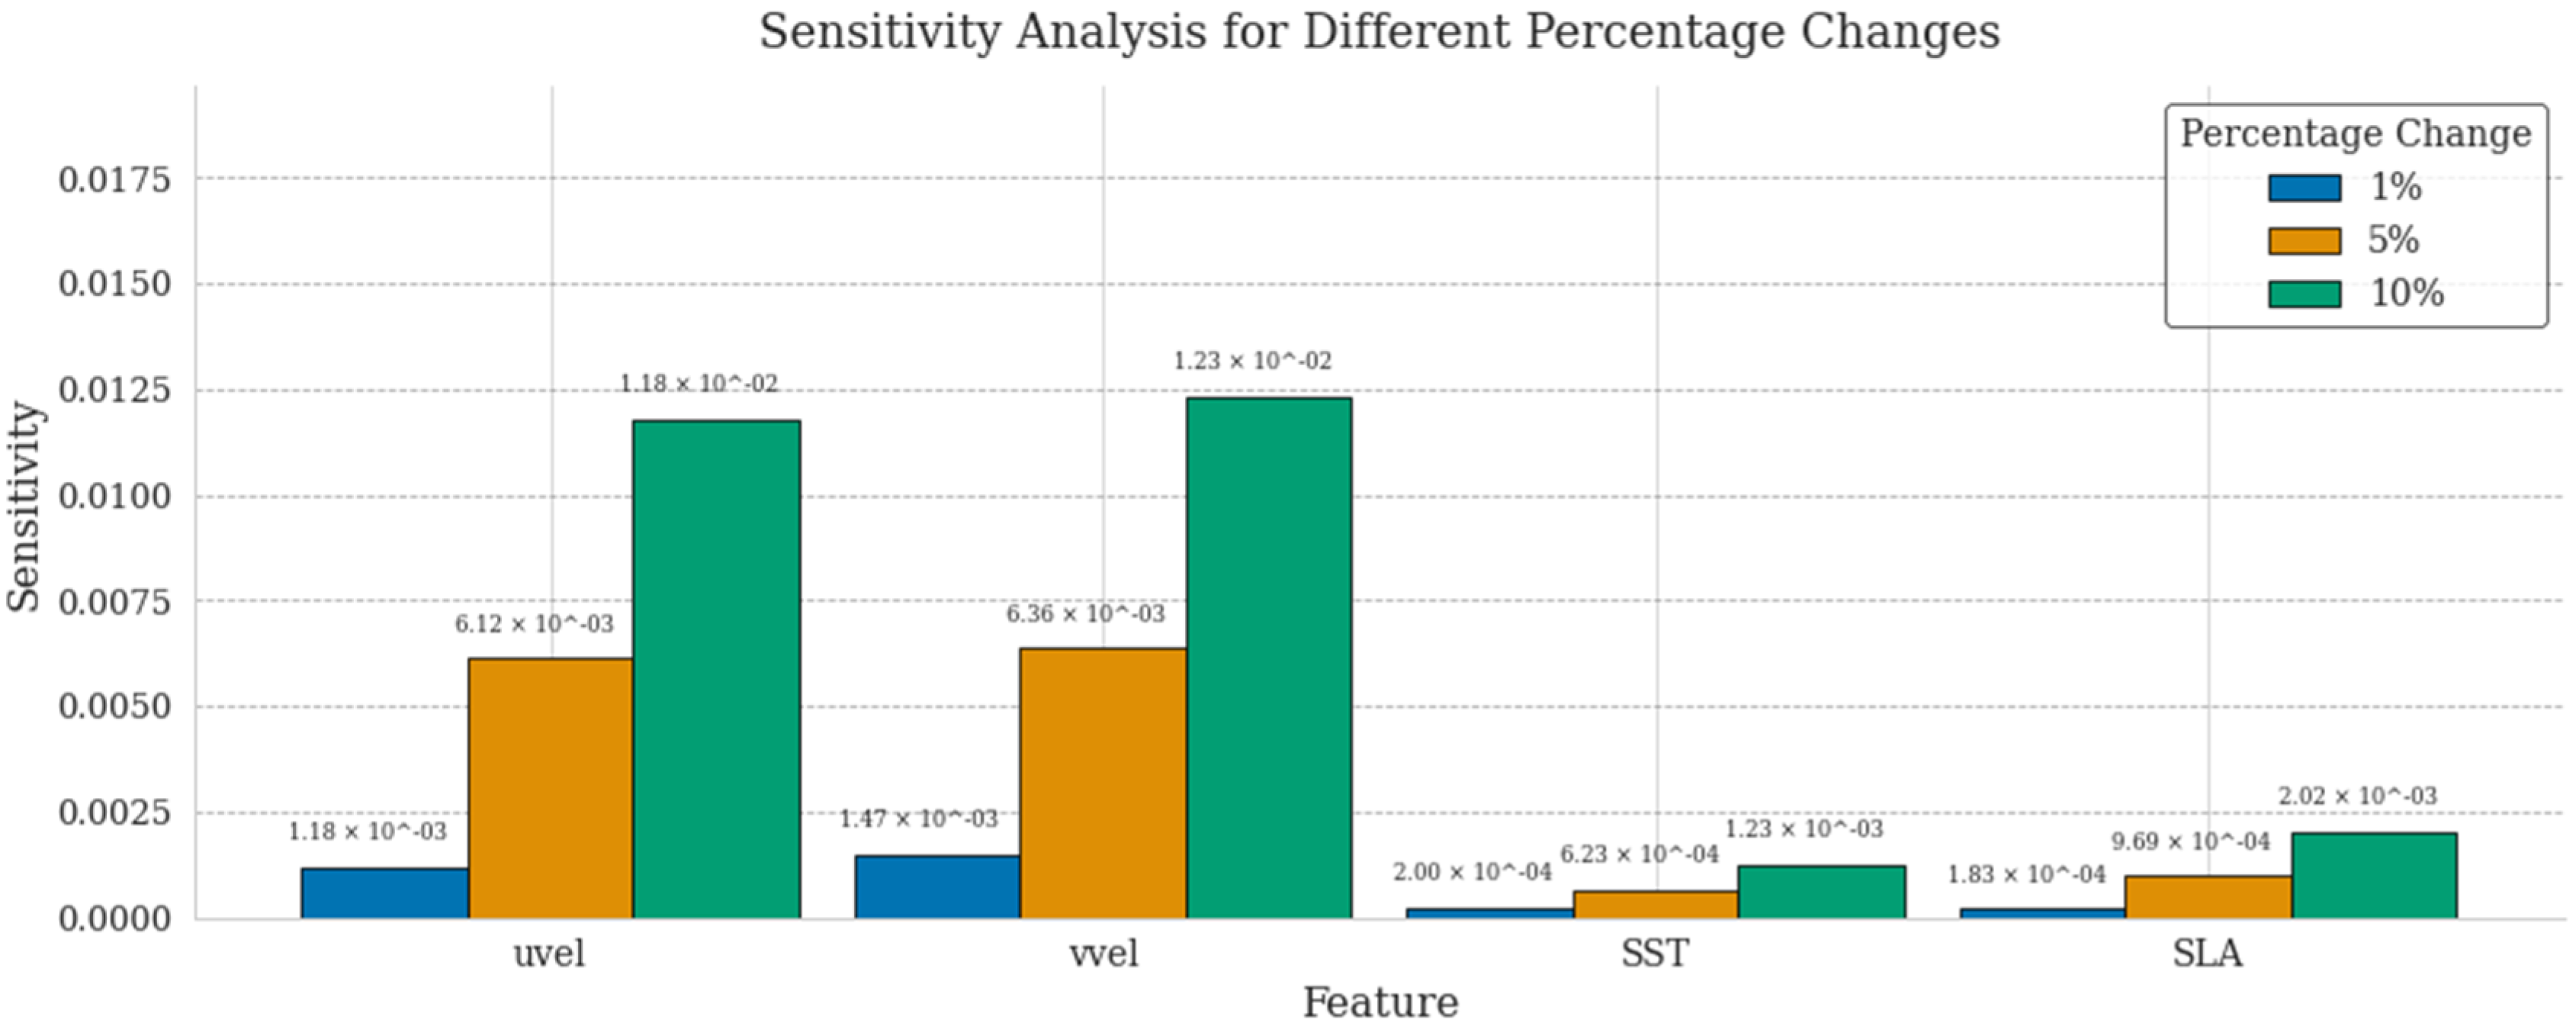
To evaluate the sensitivity of the model to variations in key input features, we conducted a detailed sensitivity analysis focusing on uvel, vvel, SST, and SLA, which are crucial for modeling the dynamic interactions between atmospheric forces and oceanic responses, especially under typhoon conditions. Each variable was independently perturbed by 1%, 5%, and 10% to assess its impact on the model’s output. As illustrated in
Figure 4, even with perturbations as high as 10%, the sensitivity values remained low, with a maximum of 1.230 × 10
−2, indicating the robustness of the model despite moderate fluctuations in the input data. Such robustness is vital for accurately reconstructing ocean temperature profiles in highly dynamic and turbulent environments triggered by typhoons. These findings align with the work of Wang et al. (2017), who identified the sensitivity of atmospheric and oceanic models to parameters such as ocean stratification and wind stress coefficients [
22]. Their optimization strategy demonstrated that these parameters are essential in influencing model performance in dynamic settings, which supports our results showing that the model maintains strong predictive capacity despite variations in input conditions.
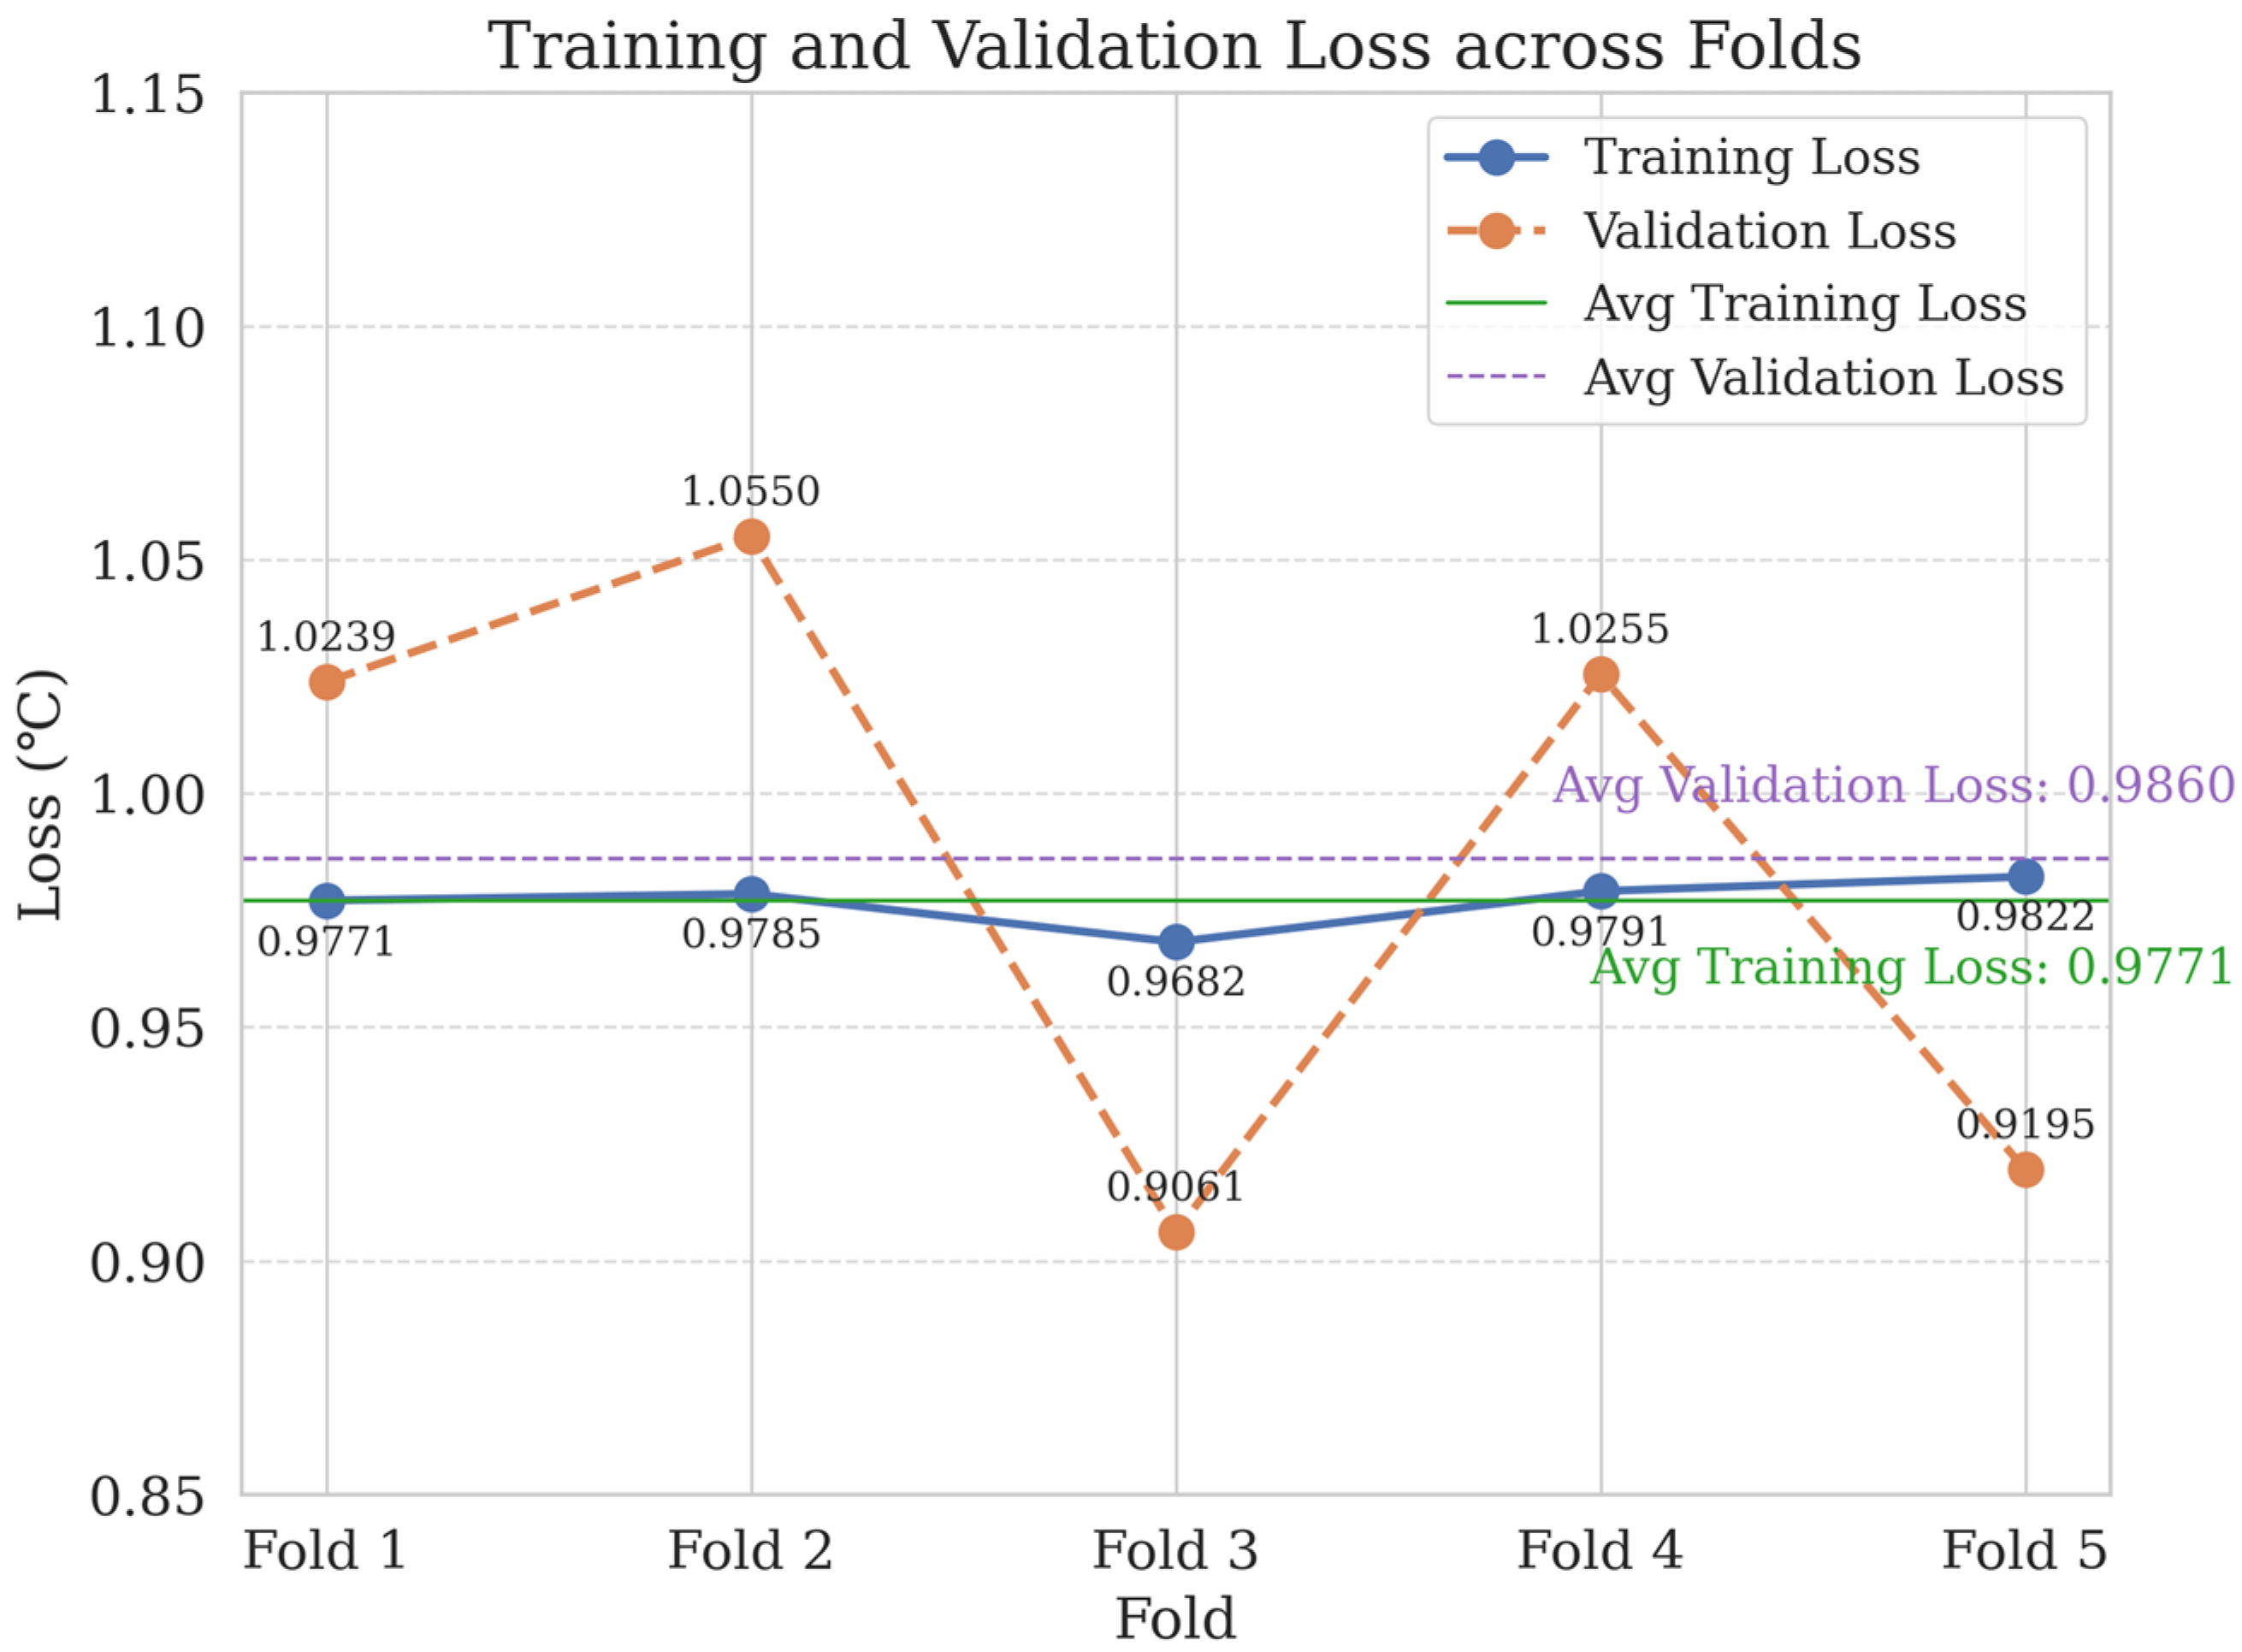
In order to demonstrate the robustness of the model validation process, five-fold cross-validation was employed, as shown in
Figure 5. This approach divides the dataset into five subsets, with each subset sequentially serving as the validation set while the remaining four subsets are used for training. The figure clearly demonstrates both training and validation losses (measured in degrees Celsius) across all folds. The training loss remains consistently low, averaging 0.977 °C, while the validation loss shows slight variations between folds, peaking at 1.055 °C in fold 2 and reaching a minimum of 0.906 °C in fold 3. These fluctuations in validation loss reflect the model’s sensitivity to different data partitions, though they remain within acceptable limits, highlighting the model’s ability to generalize across diverse data subsets. Furthermore, the inclusion of average training and validation loss lines emphasizes the model’s overall stability, with an average validation loss of 0.986 °C, reinforcing its reliability when applied to unseen data. This cross-validation technique plays a crucial role in preventing overfitting, ensuring that the model’s performance is not overly dependent on any specific subset, thereby enhancing its generalizability and robustness [
23].
4.2. Comprehensive Analysis of Typhoon-Induced Oceanic and Societal Impacts
Based on the news retrieval from the “China National Knowledge Infrastructure (CNKI)–China Important Newspapers Full-text Database”, the distribution of topics in typhoon news reports from 2011 to 2020 exhibits a marked imbalance, reflecting the extensive impact of typhoons on various domains, including society, economy, and politics. As previously discussed, typhoons, as extreme meteorological events, not only exert profound effects on the marine environment but also significantly influence multiple aspects of society, a fact that is clearly reflected in the media coverage.
Figure 6 illustrates that political topics dominate the majority of typhoon-related news reports. These reports predominantly focus on government responses and decisions in the wake of typhoon disasters, including the convening of important meetings, policy implementation, public statements by leaders, as well as government-led rescue and post-disaster reconstruction efforts. Such coverage highlights the central role of the government in disaster management, underscoring the dominance of political power in handling typhoon-related crises.
Although economic topics rank second in terms of coverage, they remain a critical component of the reporting. Economic reports often center on the direct financial losses caused by typhoons and the subsequent progress of reconstruction efforts. This is closely related to the significant impact of typhoons on economic systems, particularly within industries such as insurance, agriculture, and telecommunications. The reports also emphasize the social responsibility and actions of these sectors during disaster recovery, echoing the earlier discussion of the far-reaching economic impacts of typhoons.
In contrast, ecological and scientific topics receive relatively less coverage, yet they are crucial for understanding the ecological and scientific implications of typhoons. Ecological reports typically address the impacts of typhoons on meteorological conditions, the implementation of ecological flood control measures, and the application of meteorological monitoring technologies. This aligns with the earlier discussion on the effects of typhoons on ocean heat content, salinity, and other related aspects, further elucidating how typhoons influence the natural environment through complex physical processes. Scientific topics, on the other hand, primarily focus on the analysis of typhoon formation mechanisms, structural characteristics, and path prediction, providing scientific insights for the public and policymakers that are essential for a deeper understanding of the complexities and multifaceted impacts of typhoons.
Between 2011 and 2020, the distribution of subjects in typhoon news reports shows a significant imbalance, reflecting the widespread impact of typhoons on social, economic, and political domains. As mentioned earlier, typhoons, as extreme meteorological phenomena, have profound effects on ocean temperature distribution and thermal structures, particularly in shallow and deep ocean layers. Correspondingly, the impact of typhoons on society is also clearly reflected in news coverage.
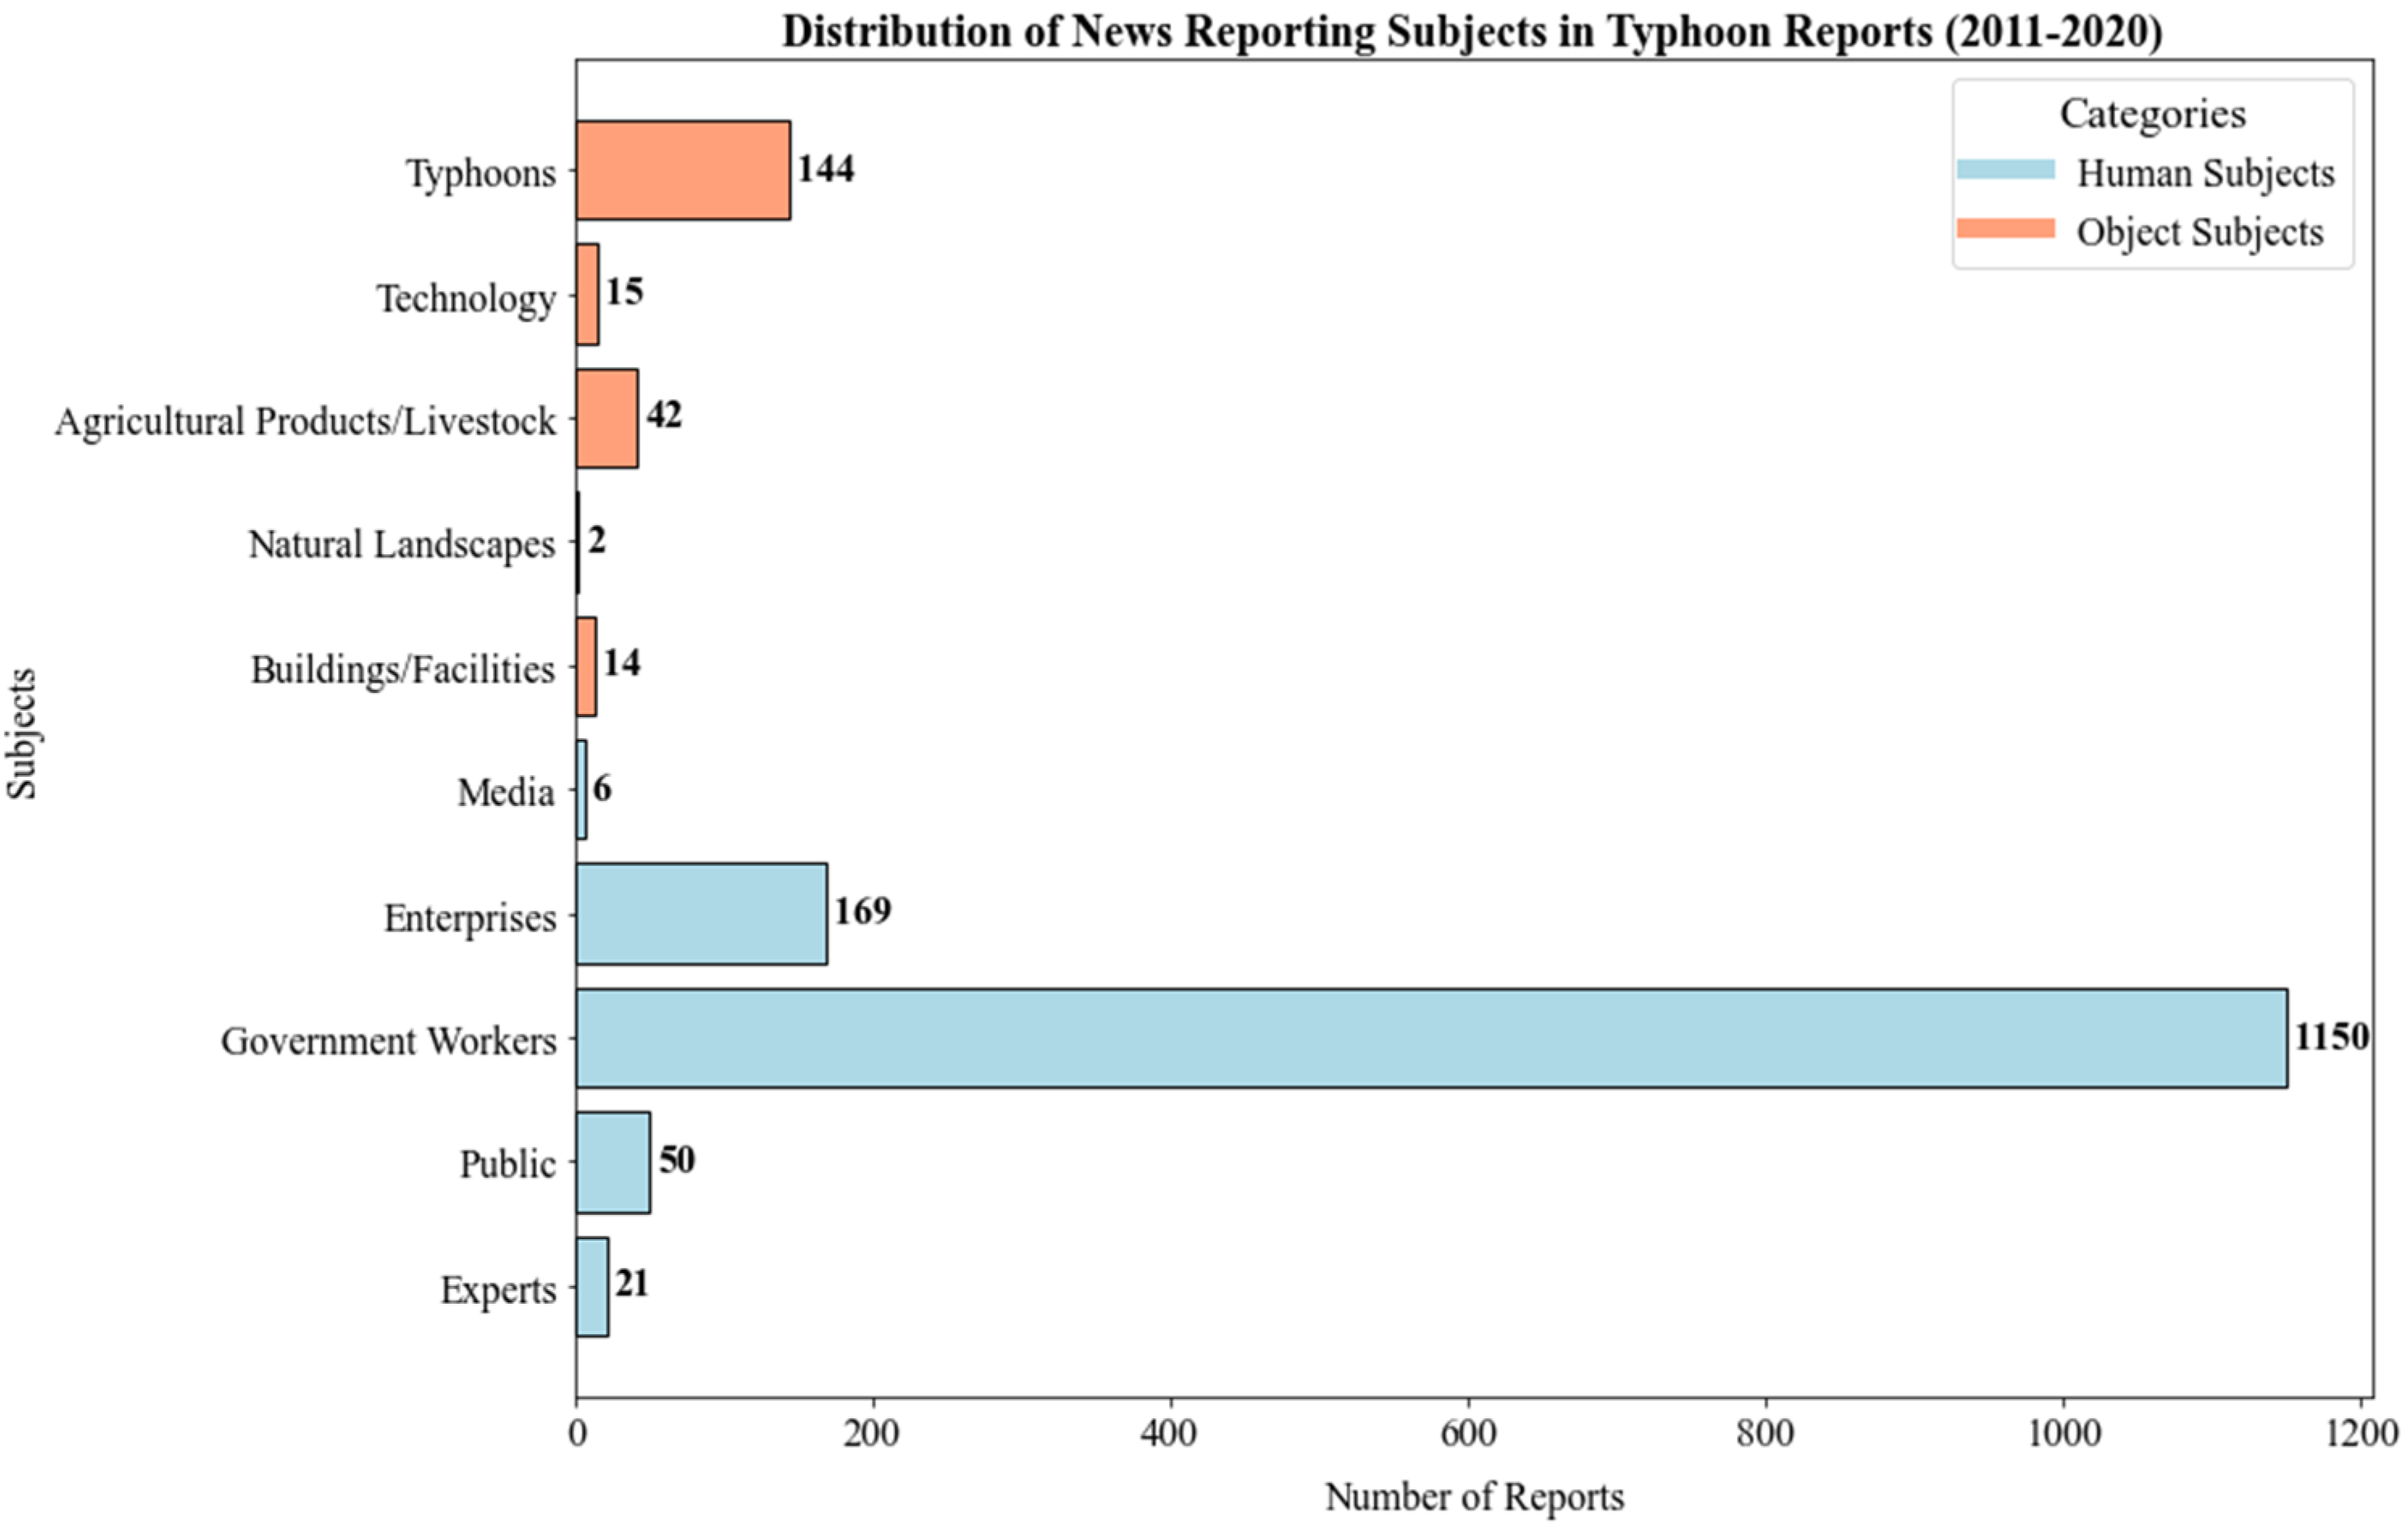
The distribution of subjects in typhoon news reports reveals that “human” subjects overwhelmingly dominate the coverage, comprising 86.07% of the total, with a sum of 1396 reports.
Figure 7 illustrates this, showing that government workers are the most frequently reported group, with 1150 reports, representing 70.9% of the total. These reports primarily focus on government decisions, meetings, and policy implementation in response to typhoons, highlighting the central role of the government in disaster management and its leadership in post-disaster reconstruction and emergency response. Enterprises are the second most reported group, with 169 reports, accounting for 10.4% of the total, mainly concentrated on political and economic topics, reflecting their social responsibility and economic influence in disaster recovery and economic rebuilding.
In contrast, news reports on “object” subjects account for 13.4% of the total, with 218 reports. Among these, typhoons themselves are the most prominent, with 144 reports, accounting for 8.8% of the total. These reports are often associated with ecological and scientific topics, discussing the formation mechanisms of typhoons, path prediction, and their impact on the natural environment. As previously discussed, typhoons influence the ocean environment through complex physical processes, including significant changes in ocean temperature and the formation of “cold wakes”. These reports further emphasize the media’s focus on typhoon scientific research and ecological impacts. Additionally, agricultural products and livestock, as subjects, appear in 42 reports, primarily in economic topics, accounting for 2.5% of the total, highlighting the deep impact of typhoons on agricultural production and rural economies.
By combining the themes of news reports with the impact of typhoons on the ocean and society, this study not only reveals the narrative strategies of the media in disaster events but also showcases the roles and influence of different stakeholders in typhoon events. More importantly, this analysis underscores the comprehensive role of typhoons in multiple domains, including the dynamic changes in physical oceanography and societal responses, providing new perspectives for understanding the overall impact of typhoons.
5. Conclusions
This paper presents an innovative approach to reconstructing the three-dimensional thermal structure of the ocean, particularly under typhoon conditions, by utilizing a fully connected transformer network (FCT). By effectively integrating multi-scale ocean dynamical features, the model successfully reconstructs ocean temperature profiles at various depths. The study’s findings indicate that the FCT model demonstrates high predictive accuracy under extreme weather conditions, as validated by its application to Typhoon Lekima in 2019, with an overall RMSE of 1.03 °C and MAE of 0.83 °C. The robustness of the model was further confirmed through five-fold cross-validation, where the validation loss remained stable across folds, with minor fluctuations averaging 0.986 °C. Sensitivity analysis also revealed that the model is resilient to input variability, showing minimal changes in output even with perturbations of up to 10% in input variables. These results suggest that the FCT model can effectively capture trends in ocean temperature variations, especially under the influence of extreme weather events like typhoons, while maintaining stability and generalizability across different data partitions.
Moreover, this study combines content analysis of typhoon-related news reports from 2011 to 2020, systematically exploring media narrative strategies and the roles of various stakeholders in disaster events. The analysis reveals that news coverage not only reflects the extensive impact of typhoons on the marine environment but also highlights the central roles of government and enterprises in disaster management. Government actions, including policy decisions and implementation, received significant attention in the news, underscoring the government’s critical role in responding to typhoon disasters. Similarly, the contributions of enterprises in post-disaster economic recovery and their social responsibilities were prominently reported. By examining these reports, we gain a deeper understanding of societal responses and role distributions during disaster events.
By integrating the reconstruction of ocean thermal structures with news report analysis, this study provides a comprehensive perspective on the impact of typhoons, addressing both physical processes and societal responses. Changes in ocean heat content not only directly influence the intensity and trajectory of typhoons but also affect public and policy responses as mediated through news coverage. This dual analytical approach enhances our understanding of the dynamics of oceanography under typhoon influence and provides critical scientific insights for improving typhoon prediction models and developing more effective disaster response strategies.
Future research could focus on further optimizing the FCT model and exploring its potential applications in other ocean basins and under different extreme weather conditions. Additionally, continued investigation into how news reporting influences public risk perception and response strategies could provide valuable data to improve public communication during disasters. These efforts will contribute to enhancing our overall disaster response capabilities, ultimately mitigating the destructive impact of extreme weather events like typhoons on society and the environment.
Author Contributions
Conceptualization, Y.Z. and Z.G.; methodology, F.Y.; software, Z.G. and R.F.; validation, F.Y.; formal analysis, X.Z. and J.T.; investigation, F.Y.; writing—original draft preparation, Y.Z.; writing—review and editing, Z.G. and R.F.; visualization, Z.G.; supervision, G.C. and F.Y.; project administration, G.C. All authors have read and agreed to the published version of the manuscript.
Funding
This work is supported by Laoshan Laboratory (Nos. LSKJ202201405-1, LSKJ202204304, LSKJ202201602 and LSKJ202201302-5), Marine Science and Technology Innovation Demonstration Project of Qingdao (23-1-3-hysf-2-hy), Key Research and Development Program of Shandong Province (No. 2021SFGC0701) and the Taishan Scholar Foundation of Shandong Province (No. tstp20231213).
Institutional Review Board Statement
Not applicable. This study did not involve humans or animals.
Informed Consent Statement
Not applicable. This study did not involve humans.
Data Availability Statement
The data presented in this study are available on request from the corresponding author.
Conflicts of Interest
The authors declare no conflict of interest.
References
- Emanuel, K. Tropical Cyclones. Annu. Rev. Earth Planet. Sci. 2003, 31, 75–104. [Google Scholar] [CrossRef]
- Knutson, T.; Camargo, S.J.; Chan, J.C.L.; Emanuel, K.; Ho, C.H.; Kossin, J.; Mohapatra, M.; Satoh, M.; Sugi, M.; Walsh, K.; et al. Tropical Cyclones and Climate Change Assessment: Part I: Detection and Attribution. Bull. Am. Meteorol. Soc. 2019, 100, 1987–2007. [Google Scholar] [CrossRef]
- Murakami, H.; Delworth, T.L.; Cooke, W.F.; Zhao, M.; Xiang, B.; Hsu, P.C. Detected Climatic Change in Global Distribution of Tropical Cyclones. Proc. Natl. Acad. Sci. USA 2020, 117, 10706–10714. [Google Scholar] [CrossRef] [PubMed]
- Kossin, J.P.; Knapp, K.R.; Olander, T.L.; Velden, C.S. Global Increase in Major Tropical Cyclone Exceedance Probability over the Past Four Decades. Proc. Natl. Acad. Sci. USA 2020, 117, 11975–11980. [Google Scholar] [CrossRef] [PubMed]
- McTaggart-Cowan, R.; Bosart, L.F.; Gyakum, J.R.; Atallah, E.H. Hurricane Katrina (2005). Part I. Complex Life Cycle of an Intense Tropical Cyclone. Mon. Weather Rev. 2007, 135, 3905–3926. [Google Scholar] [CrossRef]
- D’Asaro, E.; Black, P.G.; Centurioni, L.R.; Chang, Y.T.; Chen, S.S.; Foster, R.C.; Graber, H.C.; Harr, P.; Hormann, V.; Lien, R.C.; et al. Impact of Typhoons on the Ocean in the Pacific. Bull. Am. Meteorol. Soc. 2014, 95, 1405–1418. [Google Scholar] [CrossRef]
- Lin, I.I.; Goni, G.J.; Knaff, J.A.; Forbes, C.; Ali, M.M. Ocean Heat Content for Tropical Cyclone Intensity Forecasting and Its Impact on Storm Surge. Nat. Hazards 2013, 66, 1481–1500. [Google Scholar] [CrossRef]
- Sun, Y.; Zhong, Z.; Li, T.; Yi, L.; Hu, Y.; Wan, H.; Chen, H.; Liao, Q.; Ma, C.; Li, Q. Impact of Ocean Warming on Tropical Cyclone Size and Its Destructiveness. Sci. Rep. 2017, 7, 8154. [Google Scholar] [CrossRef]
- Sukhanovskii, A.; Popova, E. The Importance of Horizontal Rolls in the Rapid Intensification of Tropical Cyclones. Bound.-Lay. Meteorol. 2020, 175, 259–276. [Google Scholar] [CrossRef]
- Deo, A.A.; Ganer, D.W.; Nair, G. Tropical Cyclone Activity in Global Warming Scenario. Nat. Hazards 2011, 59, 771–786. [Google Scholar] [CrossRef]
- Rappaport, E.N. Fatalities in the United States from Atlantic Tropical Cyclones: New Data and Interpretation. Bull. Am. Meteorol. Soc. 2014, 95, 341–346. [Google Scholar] [CrossRef]
- Wahl, T.; Jain, S.; Bender, J.; Meyers, S.D.; Luther, M.E. Increasing Risk of Compound Flooding from Storm Surge and Rainfall for Major US Cities. Nat. Clim Chang. 2015, 5, 1093–1097. [Google Scholar] [CrossRef]
- Xu, X.-Y.; Shao, M.; Chen, P.-L.; Wang, Q.-G. Tropical Cyclone Intensity Prediction Using Deep Convolutional Neural Network. Atmosphere 2022, 13, 783. [Google Scholar] [CrossRef]
- Tian, W.; Lai, L.; Niu, X.; Zhou, X.; Zhang, Y.; Lim Kam Sian, K.T.C. Estimation of Tropical Cyclone Intensity Using Multi-Platform Remote Sensing and Deep Learning with Environmental Field Information. Remote Sens. 2023, 15, 2085. [Google Scholar] [CrossRef]
- Landsea, C.W.; Franklin, J.L. Atlantic Hurricane Database Uncertainty and Presentation of a New Database Format. Mon. Weather Rev. 2013, 141, 3576–3592. [Google Scholar] [CrossRef]
- Hu, L.; Wen, T.; Shao, Y.; Wang, Q.; Fang, W.; Yang, J.; Liu, M.; Wang, X.; Zhang, H.; Bi, J.; et al. Economic Impacts of Tropical Cyclone-Induced Multiple Hazards in China. Earth’s Future 2023, 11, e2022EF002987. [Google Scholar] [CrossRef]
- Webster, P.J.; Holland, G.J.; Curry, J.A.; Chang, H.R. Changes in Tropical Cyclone Number, Duration, and Intensity in a Warming Environment. Science 2005, 309, 1844–1846. [Google Scholar] [CrossRef]
- Trenberth, K.E.; Fasullo, J.T.; Shepherd, T.G. Attribution of Climate Extreme Events. Nat. Clim Chang. 2015, 5, 725–730. [Google Scholar] [CrossRef]
- Mei, W.; Pasquero, C.; Primeau, F. The Effect of Translation Speed upon the Intensity of Tropical Cyclones over the Tropical Ocean. Geophys. Res. Lett. 2012, 39, L07801. [Google Scholar] [CrossRef]
- Di Lorenzo, E.; Miller, A.J.; Schneider, N.; McWilliams, J.C. The Warming of the California Current System: Dynamics and Ecosystem Implications. J. Phys. Oceanogr. 2005, 35, 336–362. [Google Scholar] [CrossRef]
- Li, G.; Xie, S.P.; Du, Y. Monsoon-induced biases of climate models over the tropical Indian Ocean. J. Clim. 2015, 28, 3093–3101. [Google Scholar] [CrossRef]
- Wang, Q.; Tang, Y.; Dijkstra, H.A. An Optimization Strategy for Identifying Parameter Sensitivity in Atmospheric and Oceanic Models. Mon. Weather Rev. 2017, 145, 3293–3305. [Google Scholar] [CrossRef]
- Durden, S.L. Evaluation of IMERG Data over Open Ocean Using Observations of Tropical Cyclones. Remote Sens. 2024, 16, 2028. [Google Scholar] [CrossRef]
| Disclaimer/Publisher’s Note: The statements, opinions and data contained in all publications are solely those of the individual author(s) and contributor(s) and not of MDPI and/or the editor(s). MDPI and/or the editor(s) disclaim responsibility for any injury to people or property resulting from any ideas, methods, instructions or products referred to in the content. |
© 2024 by the authors. Licensee MDPI, Basel, Switzerland. This article is an open access article distributed under the terms and conditions of the Creative Commons Attribution (CC BY) license (https://creativecommons.org/licenses/by/4.0/).

