1. Introduction
Effective management of hazardous substance releases is a cornerstone of industrial safety. In recent years, crisis management tools, such as ALOHA (Areal Locations of Hazardous Atmospheres), have become indispensable for predicting and modelling the spread of chemical hazards, providing critical data for emergency responses. However, despite the widespread adoption of these tools, several challenges persist in ensuring they fully address the complexities of real-world scenarios [
1].
One of the primary challenges lies in the precision of the models used. Real-world scenarios are influenced by a myriad of factors, including fluctuating weather conditions, diverse terrains, and unpredictable human activity, all of which can significantly alter the spread of hazardous substances [
2]. While ALOHA is highly effective for modelling short-term incidents, it often encounters limitations when addressing long-term health risks from exposure, as well as potential environmental impacts that may arise following a release [
3,
4]. For example, long-term exposure to low concentrations of ammonia in the environment, especially in enclosed or poorly ventilated areas, can lead to chronic respiratory issues and other health complications. From an environmental perspective, the accumulation of ammonia in soil and water sources can lead to the degradation of water quality and damage to local ecosystems. These gaps create a critical shortfall in comprehensive risk management, particularly in industrial settings where both immediate and long-term risks must be considered.
Another significant challenge in crisis management is the integration of various tools and technologies. Tools such as Geographic Information Systems (GIS) and real-time environmental monitoring provide enormous potential to enhance the capabilities of current models [
5,
6]. However, the current level of integration remains insufficient, slowing down decision-making during time-critical situations [
7]. Moreover, many software systems, including ALOHA, rely heavily on accurate input data, which may not always be available in real time, further complicating crisis management efforts [
8].
ALOHA has proven particularly valuable for modelling chemical releases, such as ammonia, providing reliable predictions of danger zones and supporting evacuation planning. Its adaptability in incorporating meteorological and chemical data makes it a preferred tool in industrial safety [
9,
10]. Nevertheless, its strength in modelling short-term, localised incidents raises questions about its efficacy in long-duration or large-scale accidents [
11]. For example, long-term contamination from a persistent ammonia release could result in delayed toxic effects on the environment, including contamination of water sources and soil, with negative impacts on ecosystems and public health. This study seeks to address these concerns by expanding ALOHA’s application, integrating not only immediate hazard assessments but also long-term risk management.
One of ALOHA’s key features is its dual-layered approach: the offline component allows for detailed pre-incident planning, providing a framework for simulating potential emergency scenarios [
12]. This offers emergency personnel a foundation for preparedness, enabling them to model various outcomes and develop evacuation strategies before an incident occurs. On the other hand, ALOHA’s real-time online component allows dynamic adjustment of predictions as new data emerges during a crisis. By combining pre-event simulations with real-time updates, ALOHA helps refine decision-making during emergencies [
13,
14].
In this study, we explore the role of ALOHA not only in immediate crisis management but also in long-term risk mitigation. We address both acute risks associated with chemical releases and the long-term environmental and health consequences of such incidents. The research emphasises the importance of real-time data integration, improving user accessibility, and enhancing the accuracy of long-term hazard predictions. These improvements will allow ALOHA to meet the growing demands of industrial safety and ensure its continued effectiveness in a rapidly evolving technological landscape [
15,
16].
2. Problem Statement
In industrial settings that involve hazardous chemicals, such as ammonia, effective risk assessment and crisis management are critical for safeguarding public safety and mitigating environmental hazards. Tools such as ALOHA have proven valuable in predicting the dispersion of hazardous substances and informing emergency response efforts. However, despite its widespread use, ALOHA demonstrates limitations when applied to complex, real-world scenarios. Specifically, the software’s current version lacks the ability to incorporate real-time atmospheric data, dynamically adjust to fluctuating meteorological conditions, and accurately model leak behaviour in diverse geographic terrains. Moreover, the predictive models within ALOHA often fail to account for long-term health risks and broader environmental impacts, which introduces a gap in comprehensive risk assessment and management.
This research underscores the importance of addressing these limitations by critically evaluating ALOHA’s performance across multiple ammonia leakage scenarios. In doing so, the study highlights the need for integrating advanced technologies, such as Artificial Intelligence (AI), Geographic Information Systems (GIS), and drones, to enhance the software’s real-time data processing and predictive accuracy. Although these technologies are not yet integrated within the current framework of ALOHA, their potential for improving the emergency response and risk management is substantial. Incorporating these advancements would allow for more timely, accurate predictions and improved decision-making in crisis situations.
Furthermore, this research emphasises the necessity of validating theoretical simulations through real-world case studies. Such validation would bridge the gap between theoretical models and practical applications, ensuring that the proposed enhancements to ALOHA are both functional and relevant in addressing the complex challenges of industrial hazard management.
3. Materials and Methods
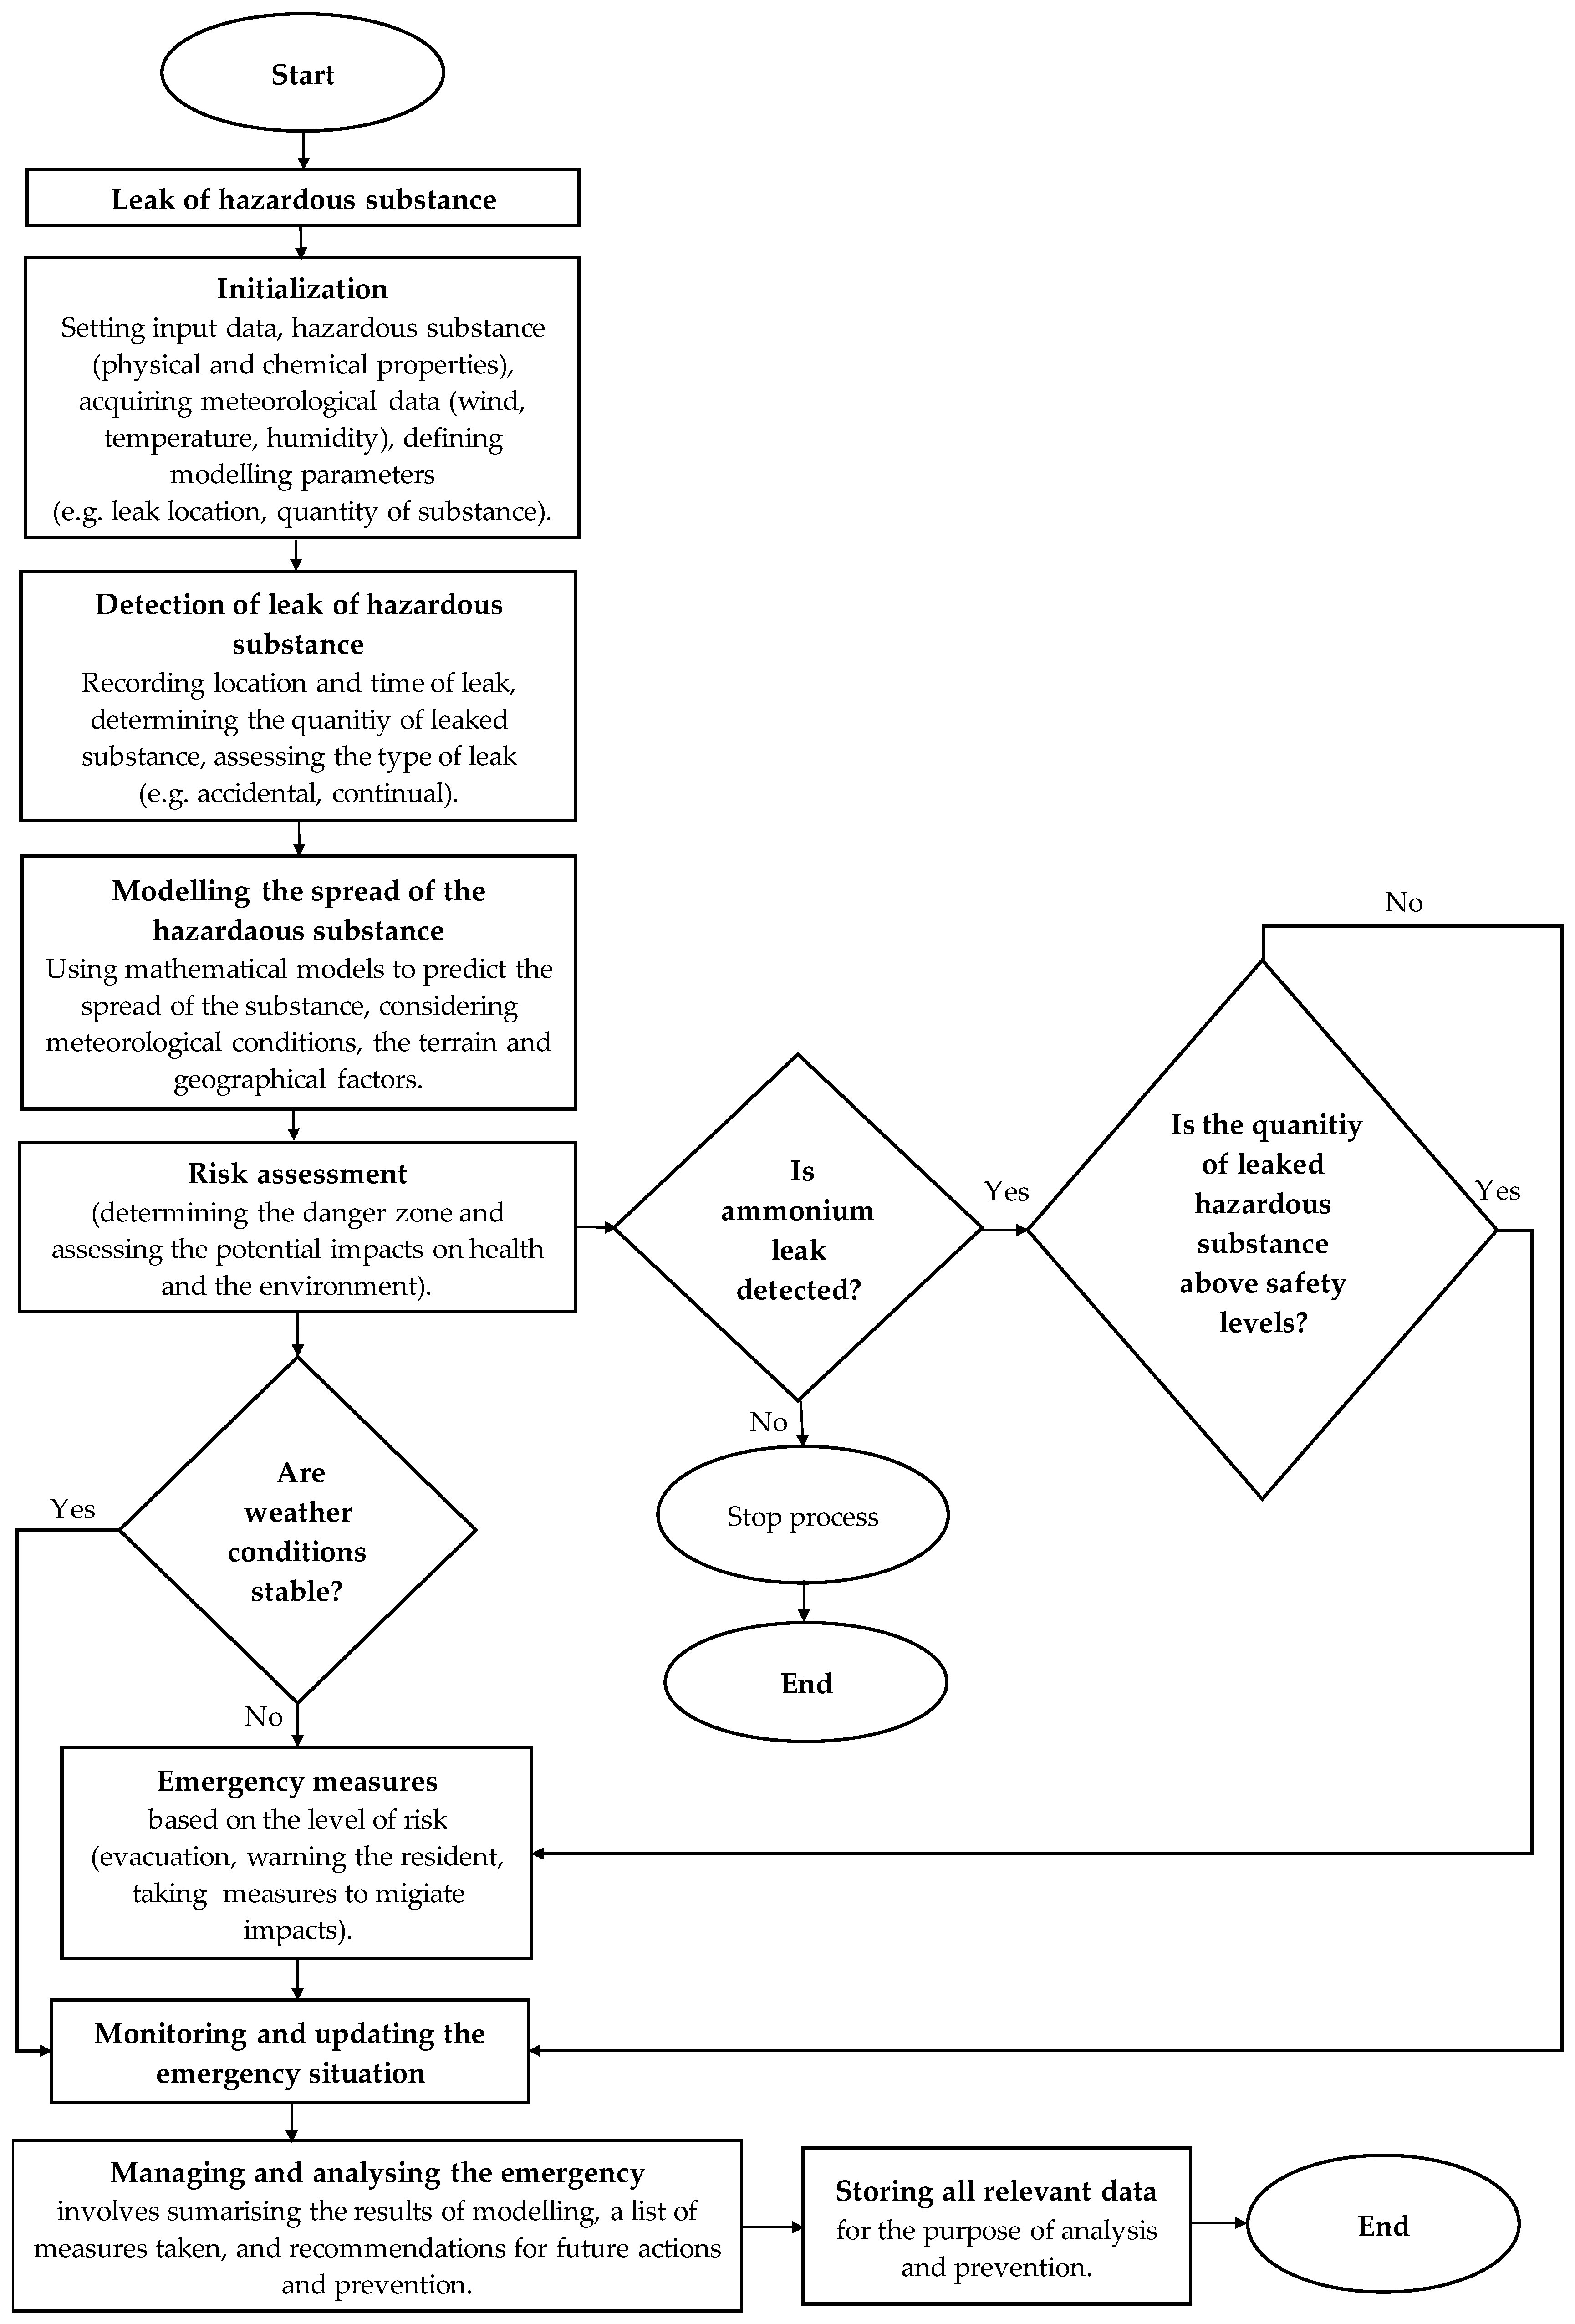
The process of investigating and managing industrial accidents involving the release of hazardous substances is inherently complex, requiring a series of critical steps to effectively mitigate the consequences. The initial response focuses on ensuring the safety of personnel and the public through rapid evacuation and isolation of the affected area.
Once immediate safety measures are in place, the collection of evidence begins at the accident site. This involves determining the origin of the leak, identifying the hazardous substance involved, evaluating the conditions that led to the incident, and gathering data about the equipment that was in use at the time. Collaboration with chemical experts, safety engineers, and other relevant specialists is essential to conduct a thorough analysis of the accident’s circumstances.
After evidence collection, a detailed analysis is carried out, often incorporating simulations. In this study, the ALOHA 5.4.7 (Areal Locations of Hazardous Atmospheres) program, part of the CAMEO 4.1 software suite, was employed to model the spread of hazardous substances and predict potential danger zones.
Figure 1 provides a structured overview of this investigative process, outlining each phase from the detection and assessment of leaks through modelling, risk assessment, and emergency response actions. Each step aims to ensure systematic management of the situation, integrating immediate safety measures with ongoing monitoring and assessment.
The ALOHA models the dispersion of hazardous substances based on key input variables, such as wind speed,
V, temperature,
T, and the volume of the released substance,
M. The fundamental equation governing substance dispersion is represented as:
where
C(
x,
y,
t) represents the concentration of the substance as a function of distance
x,
y, and time
t. This model enables the estimation of hazardous substance
C(
x,
y,
t) at various points within the danger zone and simulates the influence of meteorological conditions on their spread.
Wind speed,
V, plays a significant role in determining the size of the danger zone, which expands proportionally with the increasing wind speed:
Similarly, temperature, T, affects the rate of evaporation of the substance, leading to higher C of vapours near the source of the leak.
ALOHA simulates the release of substances through the following function:
where the resulting
C depends on the input variables v,
T, and
M. Any changes to input data require manual updates to the model, as ALOHA does not automatically adjust to new data in real time. This approach works well in predefined scenarios or under stable environmental conditions but presents challenges when meteorological factors, such as wind speed and direction, fluctuate rapidly.
To assist emergency responders, ALOHA generates color-coded hazard zones, Z(x,y), based on different substances, C(x,y), helping to identify the most hazardous areas and facilitating the planning of evacuation routes.
While ALOHA remains a highly effective tool for pre-incident planning and response under stable conditions, its reliance on manual data updates can limit its responsiveness in dynamic scenarios. In cases where environmental conditions change rapidly, ALOHA would benefit from integration with real-time monitoring systems that continuously feed updated meteorological data into the model. Although manual input would still be required, such integration could enable faster recalculations, enhancing the utility of ALOHA in fast-evolving situations.
The following mathematical notations were used in this study to model the dispersion of hazardous substances:
C(x,y,t)—Concentration of the hazardous substance at a given point (x,y) and time t.
v—Wind speed (m.s−1).
T—Temperature (°C).
M—Volume of the released substance (kg or m3).
A—Area of the danger zone (m2).
Z(x,y)—Color-coded hazard zone at point (x,y).
Despite the versatility of ALOHA, certain limitations must be recognised, particularly in dynamic, rapidly changing environments. ALOHA depends on manual input for crucial environmental parameters, such as wind speed, temperature, and the quantity of the released substance. While this manual input ensures precise simulations under stable conditions, it introduces challenges when conditions shift unexpectedly.
In situations where environmental factors change suddenly—such as rapid alterations in wind speed or direction—ALOHA cannot automatically adjust to the new data. Users are required to manually update the input parameters and rerun the model to account for these changes.
This formula provides a direct link between the amount of hazardous material and the extent of the danger zone, which is crucial for defining evacuation perimeters and ensuring the safety of personnel. While simple, this relationship gives us a clear first estimate of the area potentially impacted by the release.
While this approach is sufficient for predefined scenarios or environments with relatively stable conditions, it becomes less practical in fast-changing scenarios, where real-time adaptability is essential.
Nevertheless, ALOHA remains a robust tool for pre-incident planning and response in predictable or stable conditions, allowing emergency responders to simulate potential hazard zones and assess risks in advance. This capability enables the preparation of evacuation plans and safety protocols. However, in scenarios where environmental conditions change in real time, ALOHA’s reliance on manual updates can limit its effectiveness.
In dynamic situations, ALOHA could be greatly enhanced by real-time data integration, continuously feeding updated meteorological data into the model. Although manual input would still be necessary, this integration would allow for quicker recalculations and improve the model’s applicability in fast-evolving incidents.
Automatic model retraining based on live data remains beyond ALOHA’s current capabilities, but future research could explore opportunities to enhance ALOHA by incorporating advanced data streams or collaborating with platforms that support real-time recalibration of hazard models. Such advancements would enable ALOHA to better respond to rapidly changing conditions during an incident, providing emergency teams with more accurate and timely information.
3.1. Integration of Advanced Technologies in Risk Assessment
The integration of advanced technologies, including Artificial Intelligence (AI), Geographic Information Systems (GIS), and drones, into the ALOHA software framework is paramount for elevating ammonia leak risk assessments. While ALOHA is a powerful tool in its own right, the complexity of modern industrial hazards necessitates an adaptive approach to crisis management.
AI can transform data analysis by rapidly processing vast amounts of information, yielding real-time insights into gas dispersion and potential impact zones. This capability is crucial for making informed decisions during emergencies. Coupling AI with GIS provides a spatial dimension, allowing emergency responders to visualise hazardous areas clearly and strategically allocate resources.
Furthermore, the deployment of drones equipped with advanced sensors enhances situational awareness, offering immediate aerial data on environmental conditions and gas concentrations. This integration allows for timely interventions and precise assessments of affected areas, improving response strategies significantly.
Embracing these technological advancements not only streamlines ALOHA’s operational capabilities but also fortifies public safety and environmental protection. As the risks associated with ammonia leaks continue to evolve, it is essential for ALOHA to adapt, ensuring that emergency services can respond swiftly and effectively to mitigate potential hazards.
3.2. Comparison of ALOHA with Other Risk Assessment Tools
In evaluating the efficacy of ALOHA software for ammonia leak risk assessments, it is crucial to place it within the broader context of available risk assessment tools. ALOHA, primarily designed for analysing chemical releases and modelling dispersion patterns, offers unique strengths, such as its user-friendly interface and integration of emergency response guidelines.
However, other tools, such as PHAST 6.7 (Process Hazard Analysis Software) and CAMEO 4.1 (Computer-Aided Management of Emergency Operations), provide complementary functionalities. For instance, PHAST excels in detailed quantitative risk assessments, incorporating extensive databases of chemical properties and advanced modelling capabilities, which may enhance the depth of analysis when paired with ALOHA’s dispersion modelling.
Moreover, CAMEO integrates a robust planning framework, including hazardous materials’ tracking and real-time monitoring features, which could significantly augment ALOHA’s existing functionalities. The incorporation of these tools into the workflow could facilitate a more holistic approach to risk management, ensuring that decision-makers have comprehensive insights for effective emergency preparedness.
Thus, while ALOHA remains a valuable tool in the field of risk assessment, it is essential to recognise its limitations and consider integration with other advanced tools. Such a multidimensional approach would not only enhance the robustness of risk assessments but also ensure a more thorough analysis of potential hazards in real-world scenarios.
4. Model Situation
For a model situation, a year-round skating arena was chosen, in the city centre, which serves the local population for sports events. Its capacity is 1619 seats, and the dimensions of the ice surface are 61 × 26 metres. According to the scenario of the IRS units, aimed at practicing the leakage of a hazardous substance, there was a malfunction of the cooling equipment in the engine room of the aforementioned skating arena and a subsequent ammonia leak.
The cooling system of the skating arena consists of an engine room and a closed ammonia cooling circuit. The cooling engine room is located next to the skating arena area in a new separate building, from where there is a channel for the skating arena piping.
The monitoring system for detecting ammonia leaks in the cooling plant relies on a set of sensors. The sensors are integrated into a monitoring system that constantly monitors ammonia C (H1, H2, and H3). These sensors are designed to detect specific thresholds of ammonia C, which trigger various safety mechanisms depending on the severity of the leak.
The stated values of 60 ppm (H1) and 120 ppm (H2) were chosen based on internationally recognised standards for detecting and managing ammonia leaks in industrial facilities. These limits are defined to trigger preventive measures. At a C of 60 ppm (H1), optical signals and ventilation are activated to minimise the risk of further C increases. At 120 ppm (H2), compressors are additionally shut down, and acoustic signals are triggered to prevent ammonia levels from reaching even more dangerous thresholds. These thresholds are crucial for timely warnings and the protection of public health.
Table 1 specifies, in more detail, the provision of warning and notification in the event of an extraordinary event associated with an ammonia leak at a skating arena. If the ammonia leak reaches an emergency state, the
H3 signalling is triggered, and the civil protection siren is activated. In the process of emergency ventilation, there is extraction from the cooling plant and from the distribution channel. Here, however, it is desirable to proceed to measurements of the
C of ammonia in the vicinity of the cooling plant and in the building of the skating arena, together with the monitoring of ammonia vapours.
Emergency leakage of partial amounts of ammonia in these conditions poses a major risk to the population around the skating arena. Accidental leakage of ammonia most often occurs due to a malfunction of the safety valve on the ammonia circuit or due to the loss of integrity of this circuit. Most ammonia is in a liquid state under the given conditions at a pressure of 0.2–1.35 MPa. Its low boiling point (−33 °C) at atmospheric pressure causes an intense boil in an emergency leak, leading to the formation of a gaseous cloud of ammonia. In the evaluation and calculations, the analysis of the spread and dispersion of ammonia in the area with civilian amenities, especially in the vicinity of the skating arena, was crucial.
In areas with cooling equipment that uses NH3 refrigerant, ventilation in accordance with STN EN 378 is observed. Ventilation is provided by a mechanical ventilation fan. The engine room is equipped with emergency ventilation, which changes the air at least 15 times per hour through the air conditioning ducts.
4.1. Results of Models of Individual Scenarios
Under the scenario of an extraordinary event of NH3 leakage from the skating arena, an employee of the engine room was informed about the leakage of a dangerous substance by an SMS message from the monitoring system, about the H1 warning level being exceeded in the engine room. Immediately after this notification, an emergency was declared and reported to the permanent service of the building, which reported the situation to the emergency line.
The population was alerted through various mass media, but especially the city announcement system and the loud AsV Bavián siren, the sound of which lasted 2 min and had a fluctuating tone, which indicates a general threat. The next step was followed by a voice announcement informing the population about the ammonia leak, the amount of the leaked substance, the predetermined affected area, and how residents should proceed in this situation.
An authorised employee conducted a survey in the engine room using a special chemical suit and autonomous breathing apparatus to determine the extent of the damage.
To achieve the set goal and purpose of the study, it was planned to use ALOHA 5.4.7 software, which was used to simulate the leakage of a hazardous substance in the vicinity of the skating arena building.
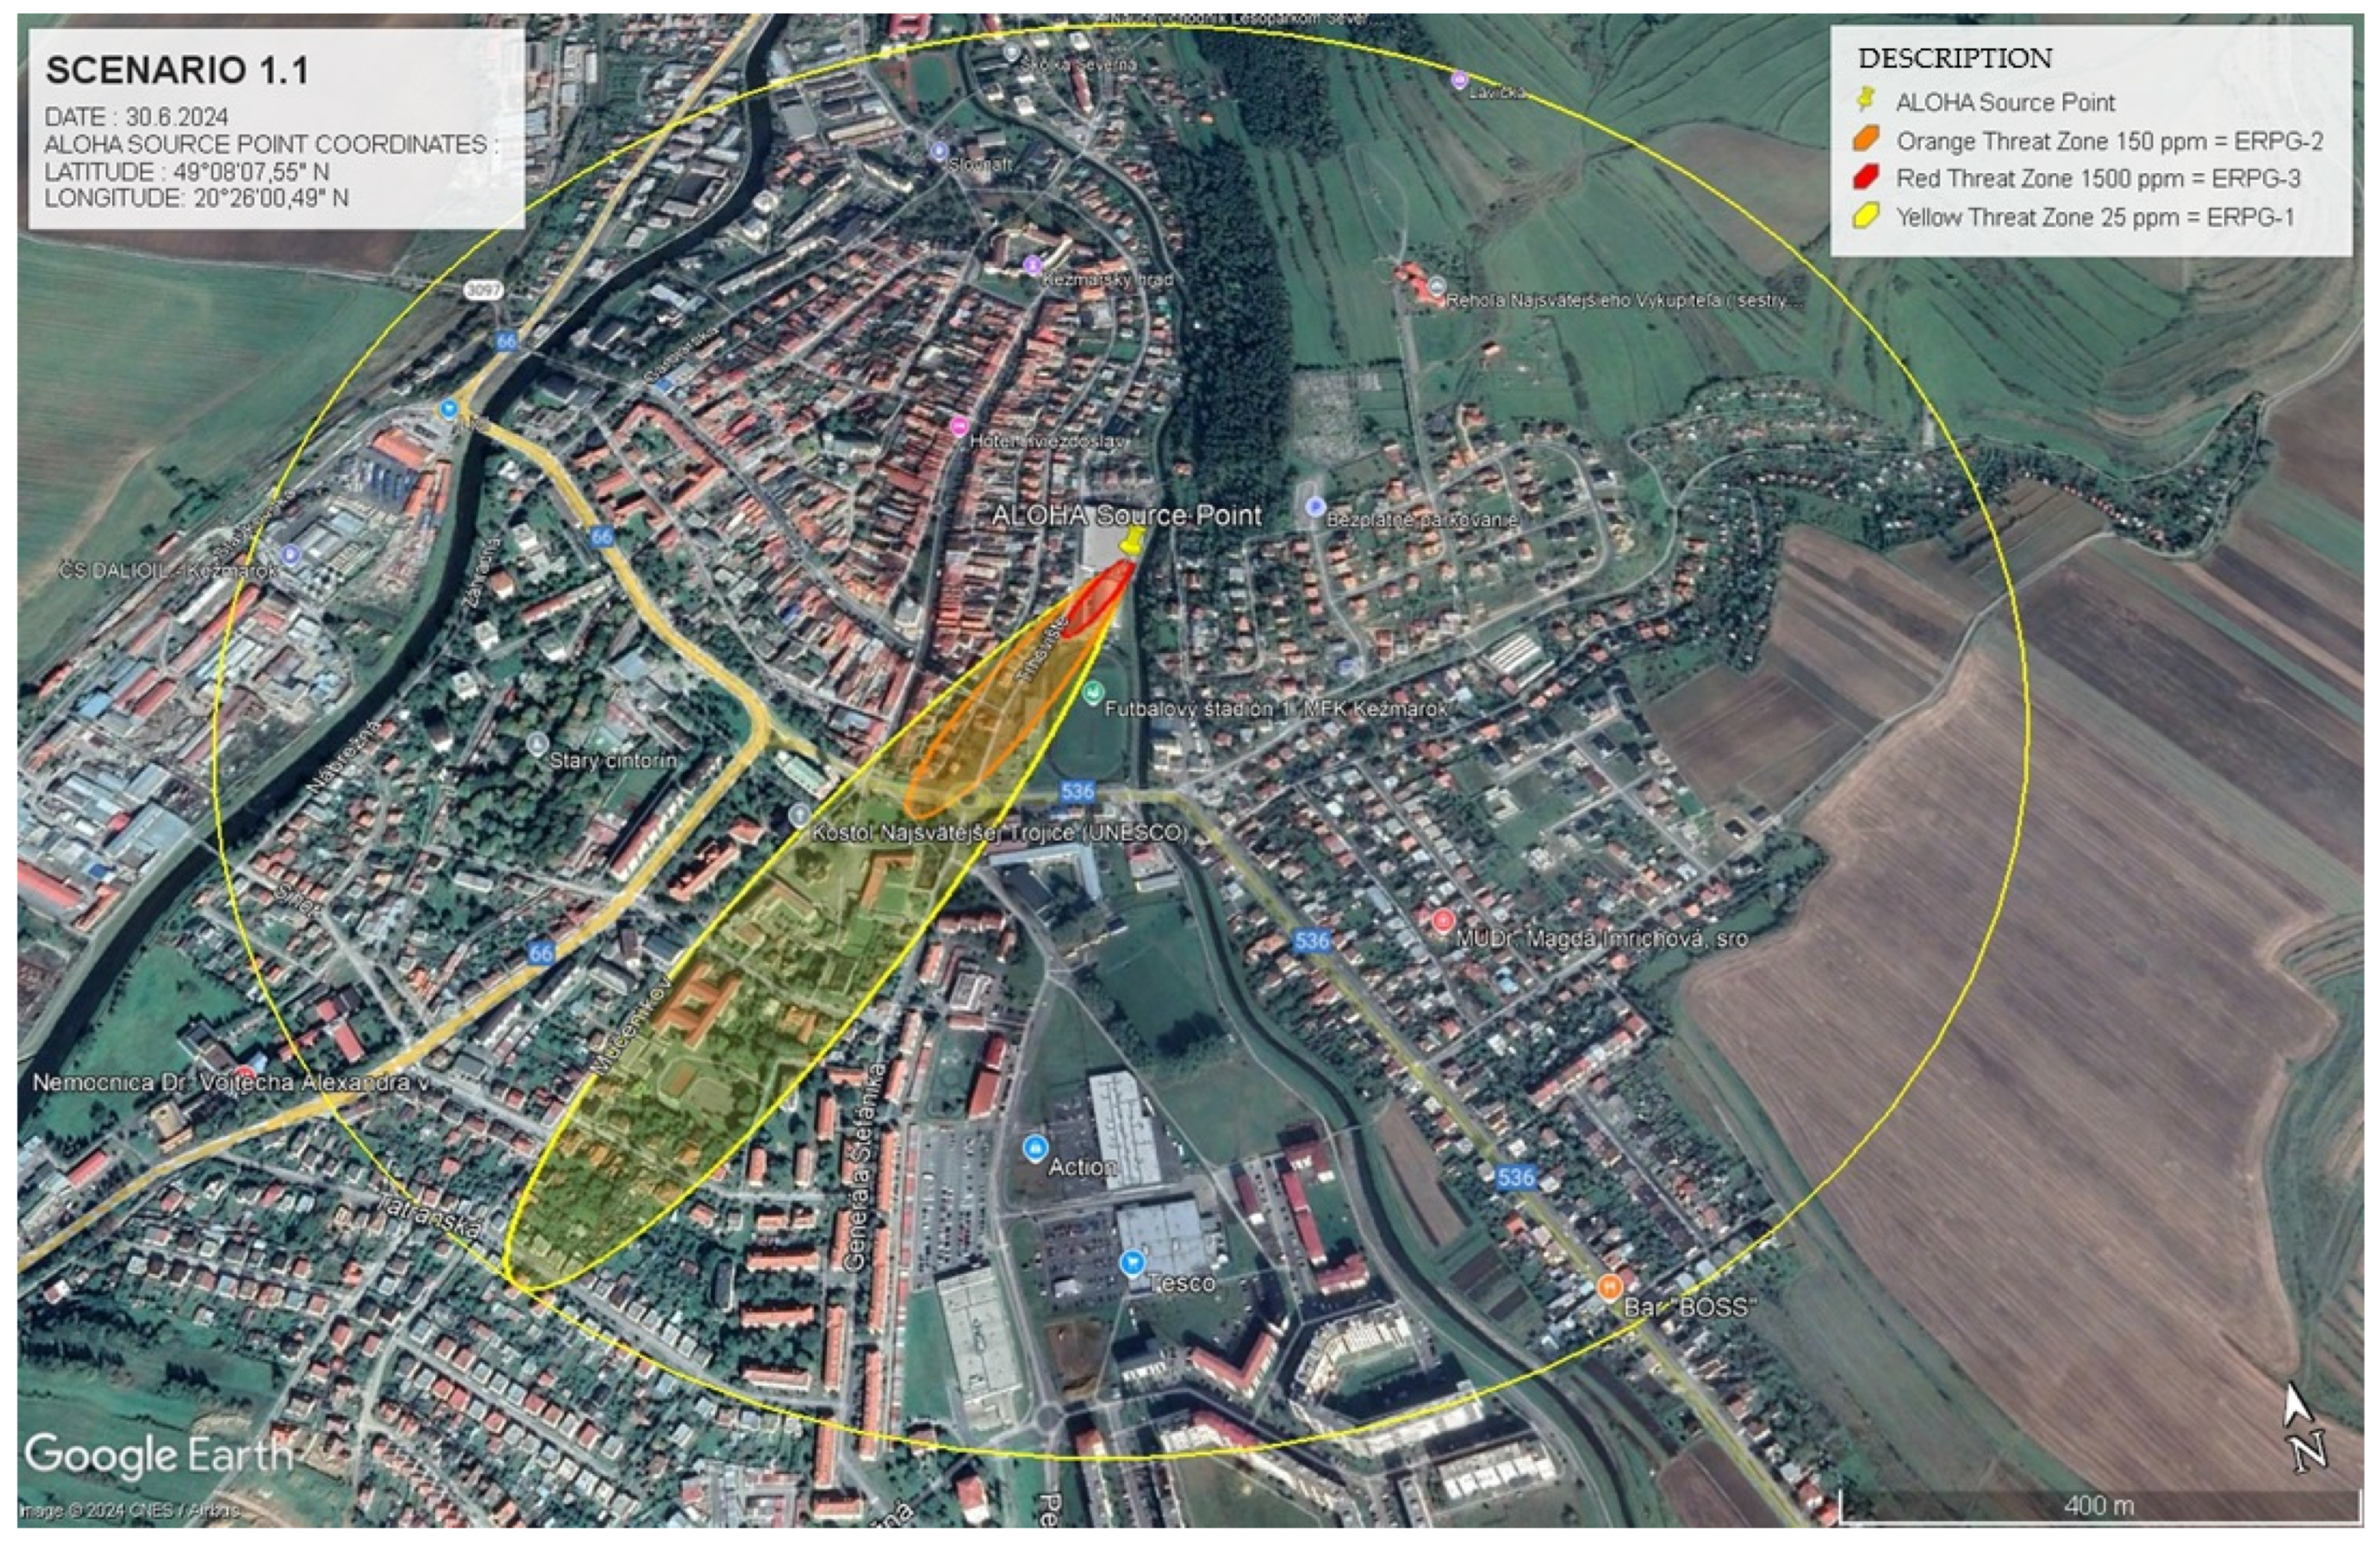
4.1.1. Scenario 1.1. Ammonia Leak under Stable Atmospheric Conditions
In this scenario, an ammonia leak was simulated using ALOHA 5.4.7, incorporating critical geographical data (GPS: 49.135727, 20.433323) alongside atmospheric variables typical of summer conditions. With a low wind speed of v = 1 m.s−1 and a temperature of t = 25 °C, the model accounted for the slower dispersion of ammonia, concentrating the gas near the source. The chemical properties of ammonia, specifically its molecular weight of 17.03 g.mol⁻1, were essential in predicting the potential hazard zones.
By integrating these data into ALOHA, the software utilised the Emergency Response Planning Guidelines (ERPG) to delineate risk zones based on ammonia concentrations at various locations over time. Under stable conditions, the simulation identified three distinct danger zones, each defined by specific concentration thresholds and associated health risks:
ERPG-1 zone (25 ppm ≤
C(
x,
y,
t) < 150 ppm) involves exposure that may cause mild irritation but poses no serious health risks (yellow zone in
Figure 2).
ERPG-2 zone (150 ppm ≤
C(
x,
y,
t) < 750 ppm) presents significant health risks, requiring immediate protective actions (orange zone in
Figure 2).
ERPG-3 zone (
C(
x,
y,
t) ≥ 750 ppm) represents the highest concentration of 1500 ppm, where exposure can lead to serious health risks. Prolonged exposure may cause severe respiratory issues, requiring immediate intervention to prevent life-threatening conditions (red zone in
Figure 2).
The model identified that under calm conditions (v = 1 m.s−1), the ERPG-3 zone extended approximately 110 m from the source. However, this changed significantly under increased wind speeds (v = 5 m.s−1), as the hazard zone expanded to over 450 m for ERPG-2. This highlights how meteorological variables, such as wind speed, dramatically influence the extent of hazardous zones, underscoring the importance of incorporating real-time environmental data during emergencies.
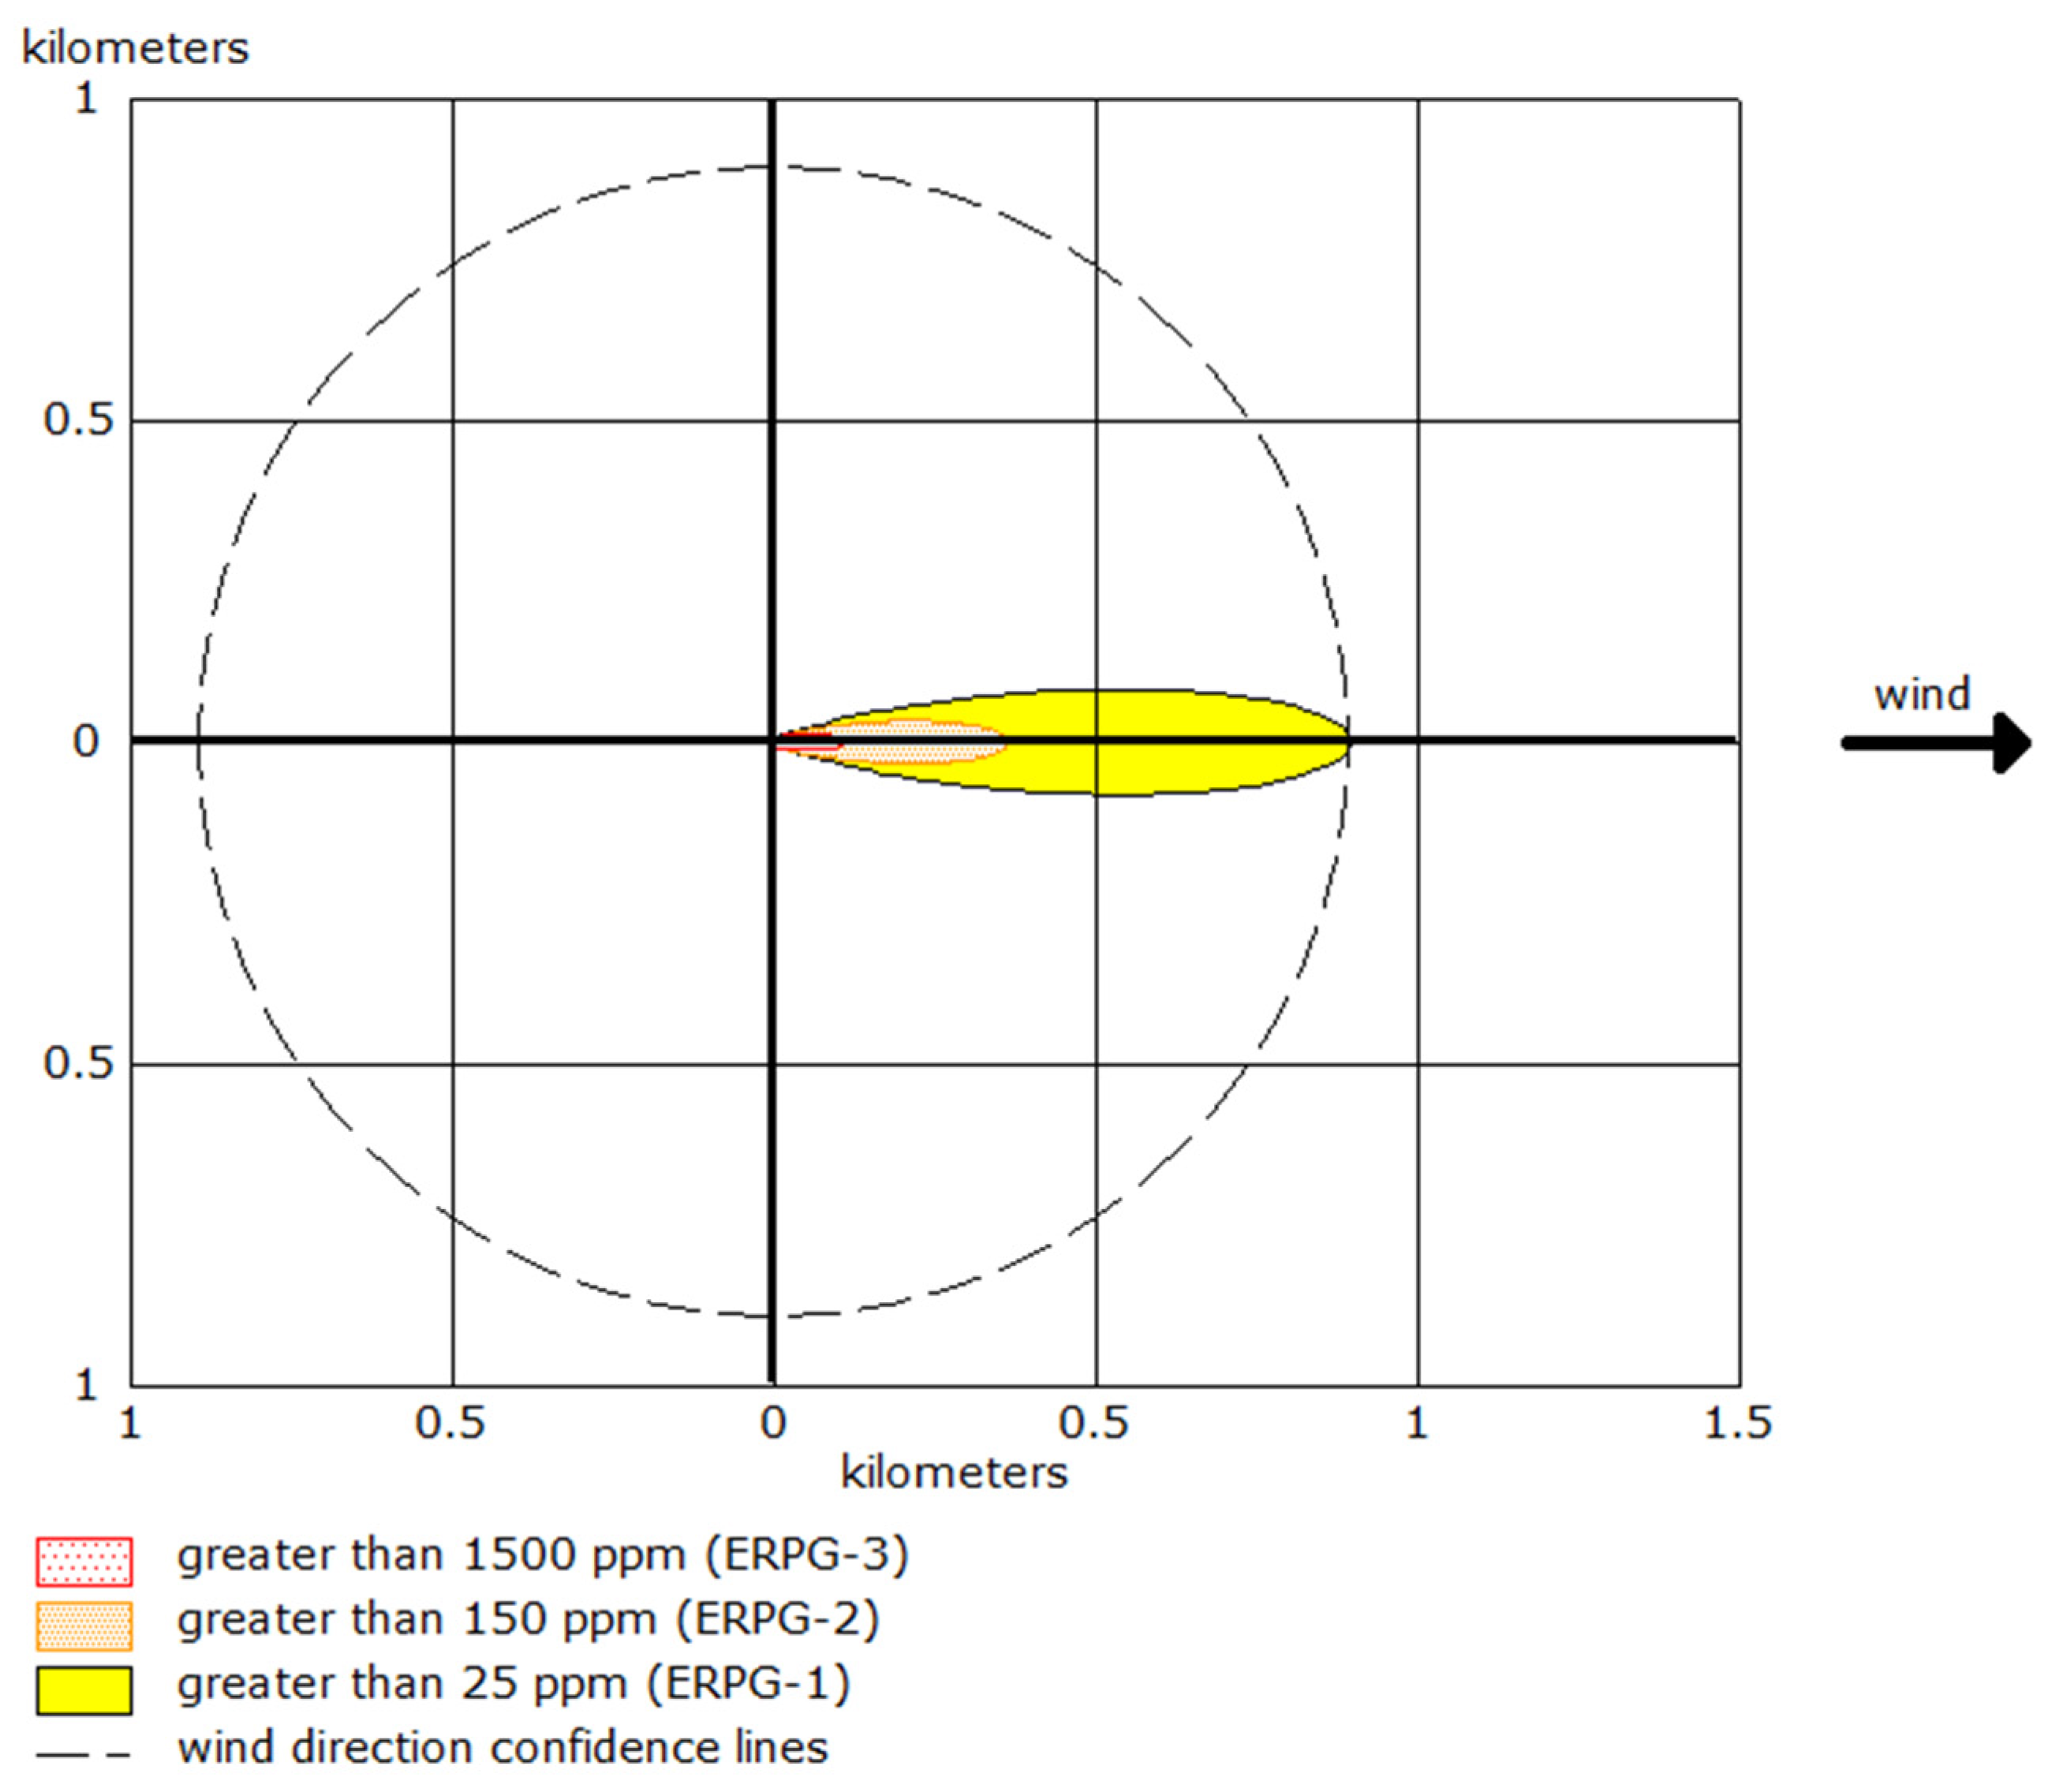
In
Scheme 1, a simplified schematic of the ammonia dispersion pattern is presented, showing the concentration levels as a function of distance and wind direction. The dashed lines represent wind direction confidence intervals, which account for variability in meteorological conditions that could affect the spread of the gas.
Table 2 summarises the numerical data for each danger zone under different wind conditions.
These data, visualised through integration into Google Earth (
Figure 2), assist emergency planners by providing spatially precise predictions of the affected areas.
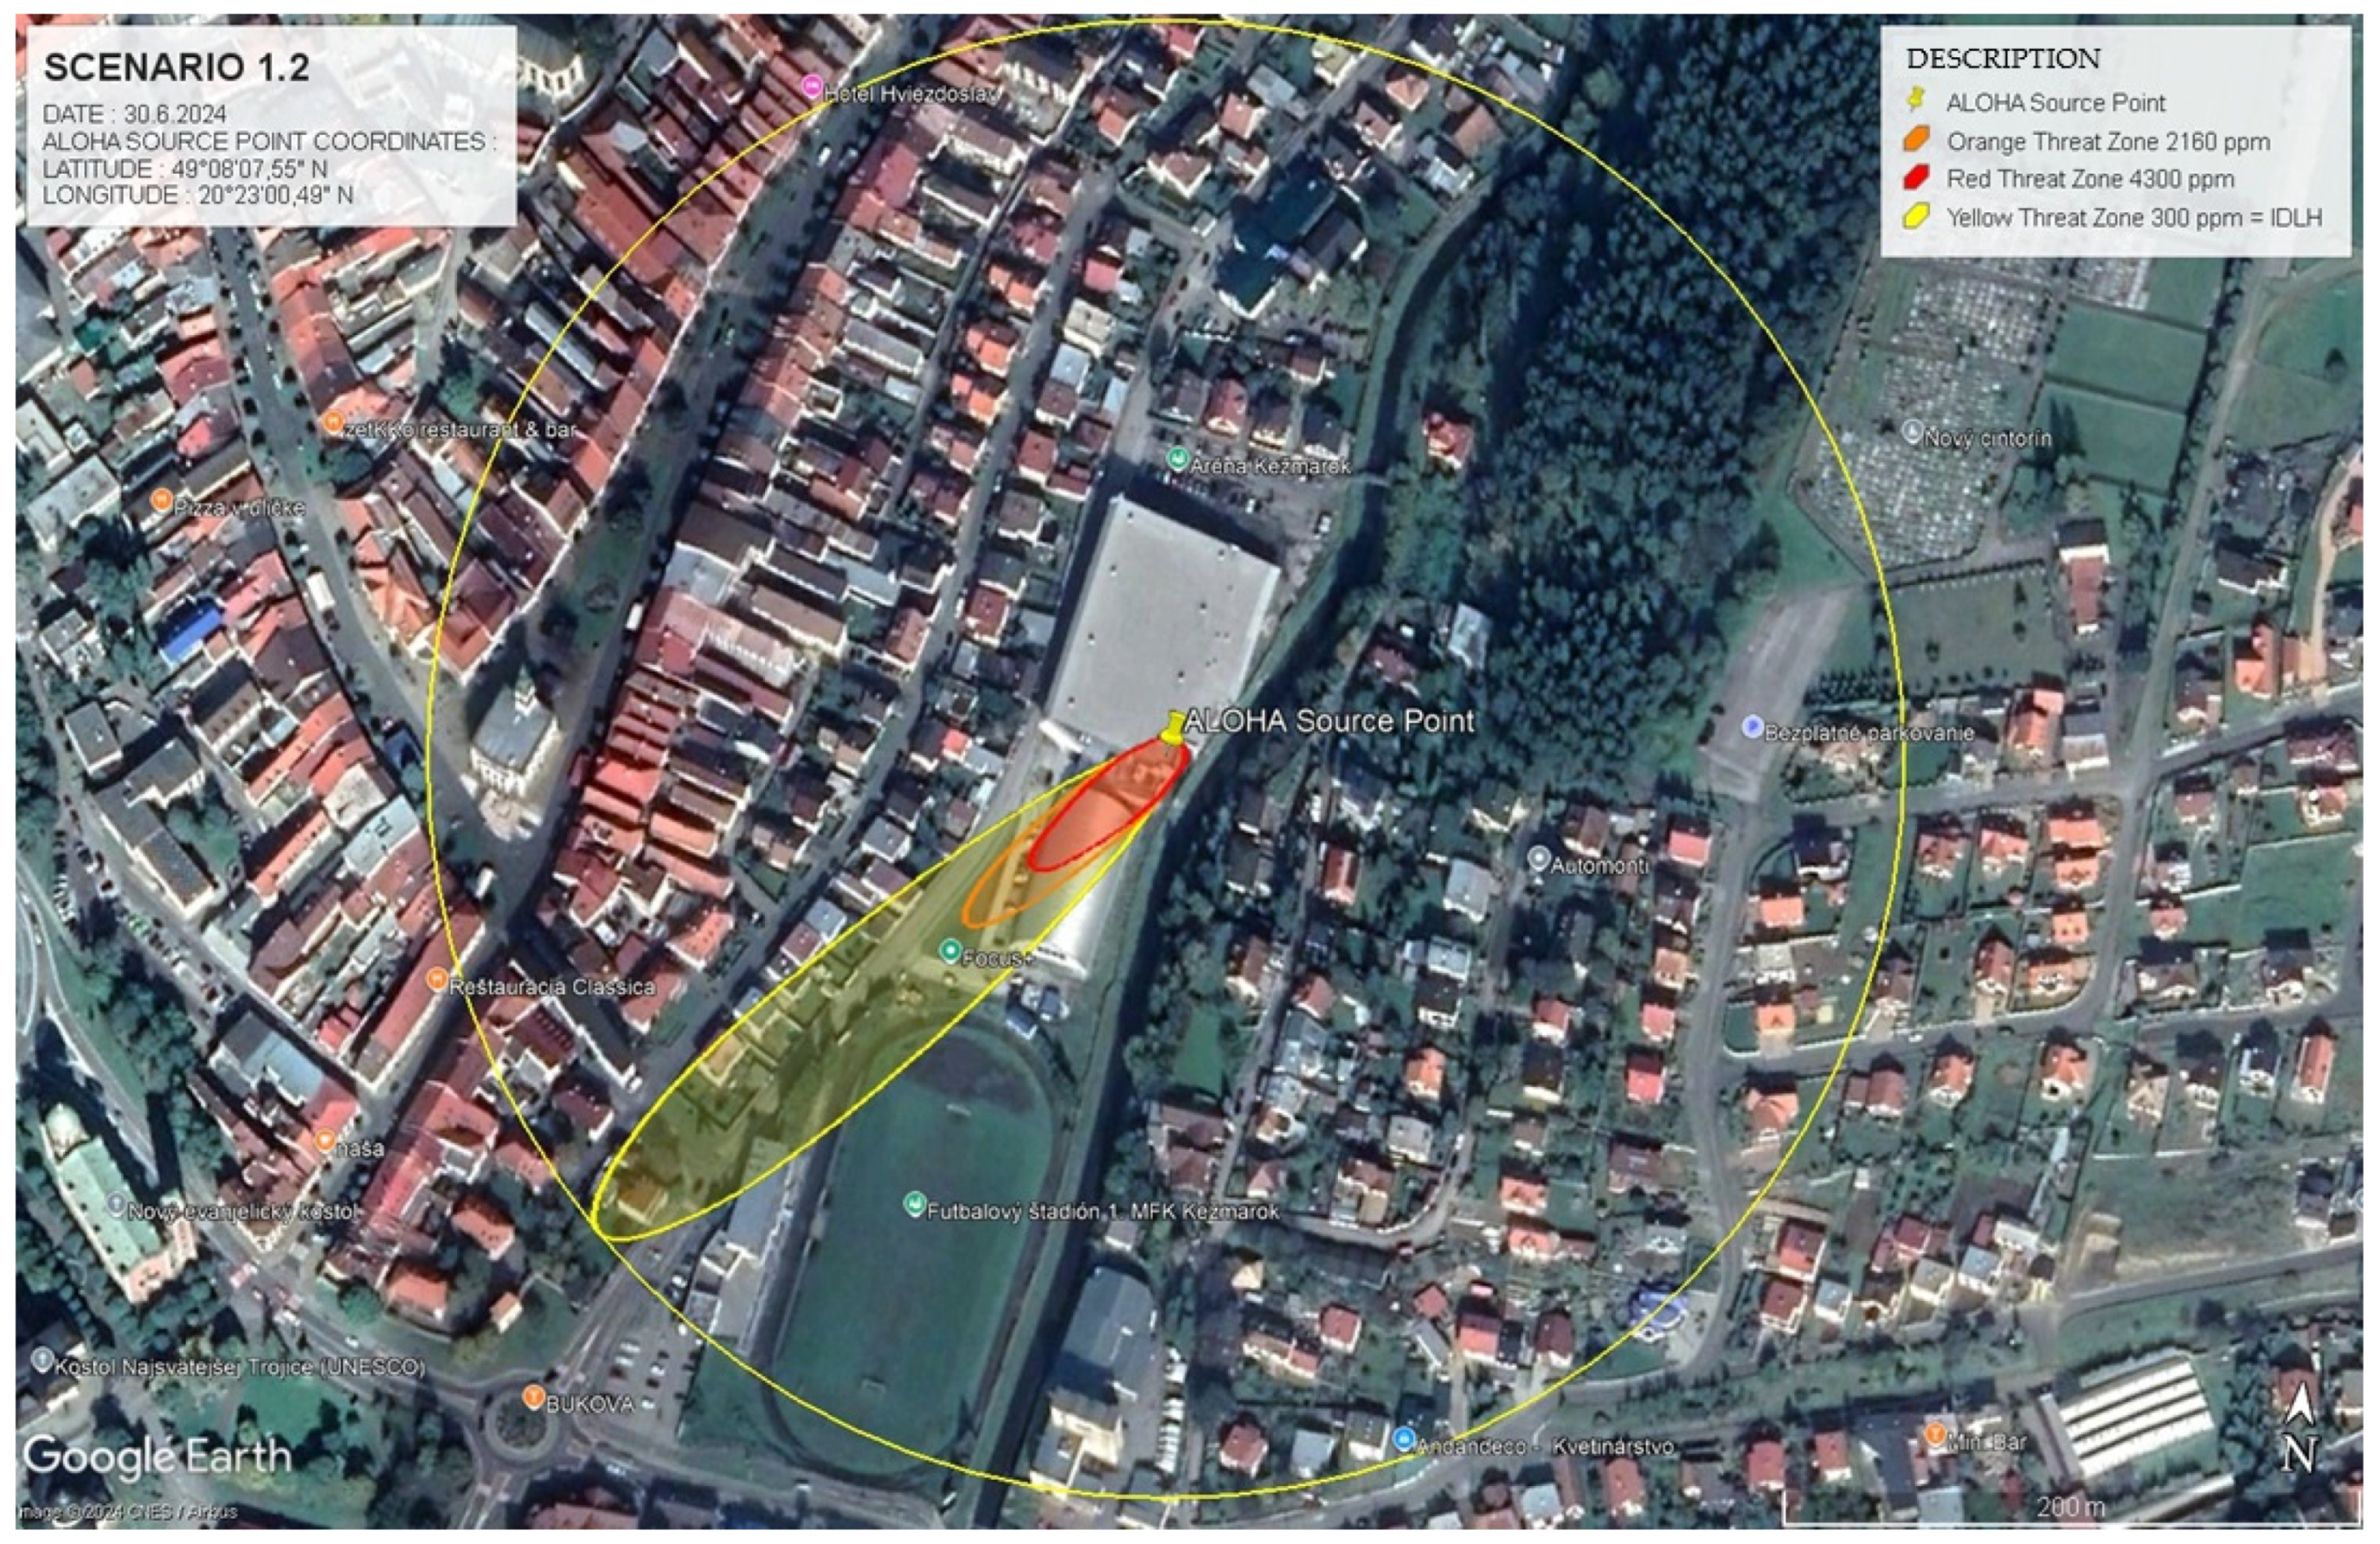
4.1.2. Scenario 1.2. High-Concentration Ammonia Leak with Fatal Consequences
The model for this scenario was constructed by simulating a high-concentration ammonia leak under stable atmospheric conditions, designed to emphasise a more extreme hazard situation than Scenario 1.1. This simulation considered atmospheric conditions (t = 25 °C, v = 1 m.s−1) and the geographic location (GPS: 49.135727, 20.433323). Ammonia’s molecular weight (17.03 g.mol−1) and boiling point (−33 °C) were also factored into the calculations. Using the ALOHA 5.4.7 software, danger zones were defined based on ERPG thresholds, with dispersion patterns modelled accordingly.
Scenario 1.2 simulates an ammonia leak occurring under stable atmospheric conditions but with a significantly higher leakage rate compared to Scenario 1.1. While both scenarios were conducted under comparable atmospheric conditions, Scenario 1.2 models a considerably higher ammonia concentration due to the elevated release rate and restricted dispersion dynamics, resulting in more severe exposure risks. The concentration difference between these two scenarios can be attributed to the proximity of the leak source to enclosed areas, which restricts the dispersal of ammonia. As a result, higher concentrations accumulate near the leak source, creating more hazardous conditions.
The ALOHA model identified three primary zones of risk, with a focus on life-threatening ammonia concentrations, as follows:
ERPG-1 zone (300 ppm ≤ C(x,y,t) < 2160 ppm) presents a lower immediate risk compared to ERPG-2 and ERPG-3 but still carries significant health hazards if exposure is prolonged. Within this concentration range, individuals may experience respiratory discomfort and irritation, with the potential for long-term health effects if not evacuated in time. Although the urgency for evacuation is not as critical as in higher zones, protective measures must be implemented to prevent adverse health outcomes over extended periods of exposure.
ERPG-2 zone (2160 ppm ≤ C(x,y,t) < 4300 ppm) covers an area where exposure lasting around 30 min can result in serious health issues, including respiratory tract damage, lung injury, and cardiovascular complications. Although the health risks in this zone are lower than in the ERPG-3 zone, the possibility of life-threatening consequences persists if timely intervention is not undertaken. Emergency response teams need to act swiftly to mitigate the dangers posed by this high concentration of ammonia.
ERPG-3 zone (C(x,y,t) ≥ 4300 ppm) poses an extreme and immediate threat. At this concentration level, exposure can lead to fatal health effects within minutes due to rapid and severe impacts on the respiratory system and other vital functions. The urgency for evacuation in this zone is heightened by the elevated concentration, which drastically reduces the available time for safe evacuation and intervention. Immediate and coordinated action is critical to prevent casualties.
This scenario emphasises the necessity for rapid evacuation and timely intervention, as the higher concentration levels leave minimal room for error. In contrast to Scenario 1.1, where the risk zones were more widespread, the hazard in Scenario 1.2 is highly concentrated near the leak point, increasing the likelihood of life-threatening exposure within a relatively short distance. This difference further underscores the impact of environmental and physical conditions, such as the enclosed space, on the dispersion and accumulation of hazardous substances (
Table 3).
The IDLH (Immediately Dangerous to Life or Health) zone in this scenario includes areas where ammonia concentrations exceed critical values, posing an immediate threat to life and health. The mathematical relationship between exposure time (
t) and concentration (
C) can be described as inversely proportional in life-threatening situations:
This relationship illustrates that as the concentration of ammonia increases, the time available for safe exposure decreases rapidly. Emergency response teams must account for this dynamic when planning evacuations and interventions.
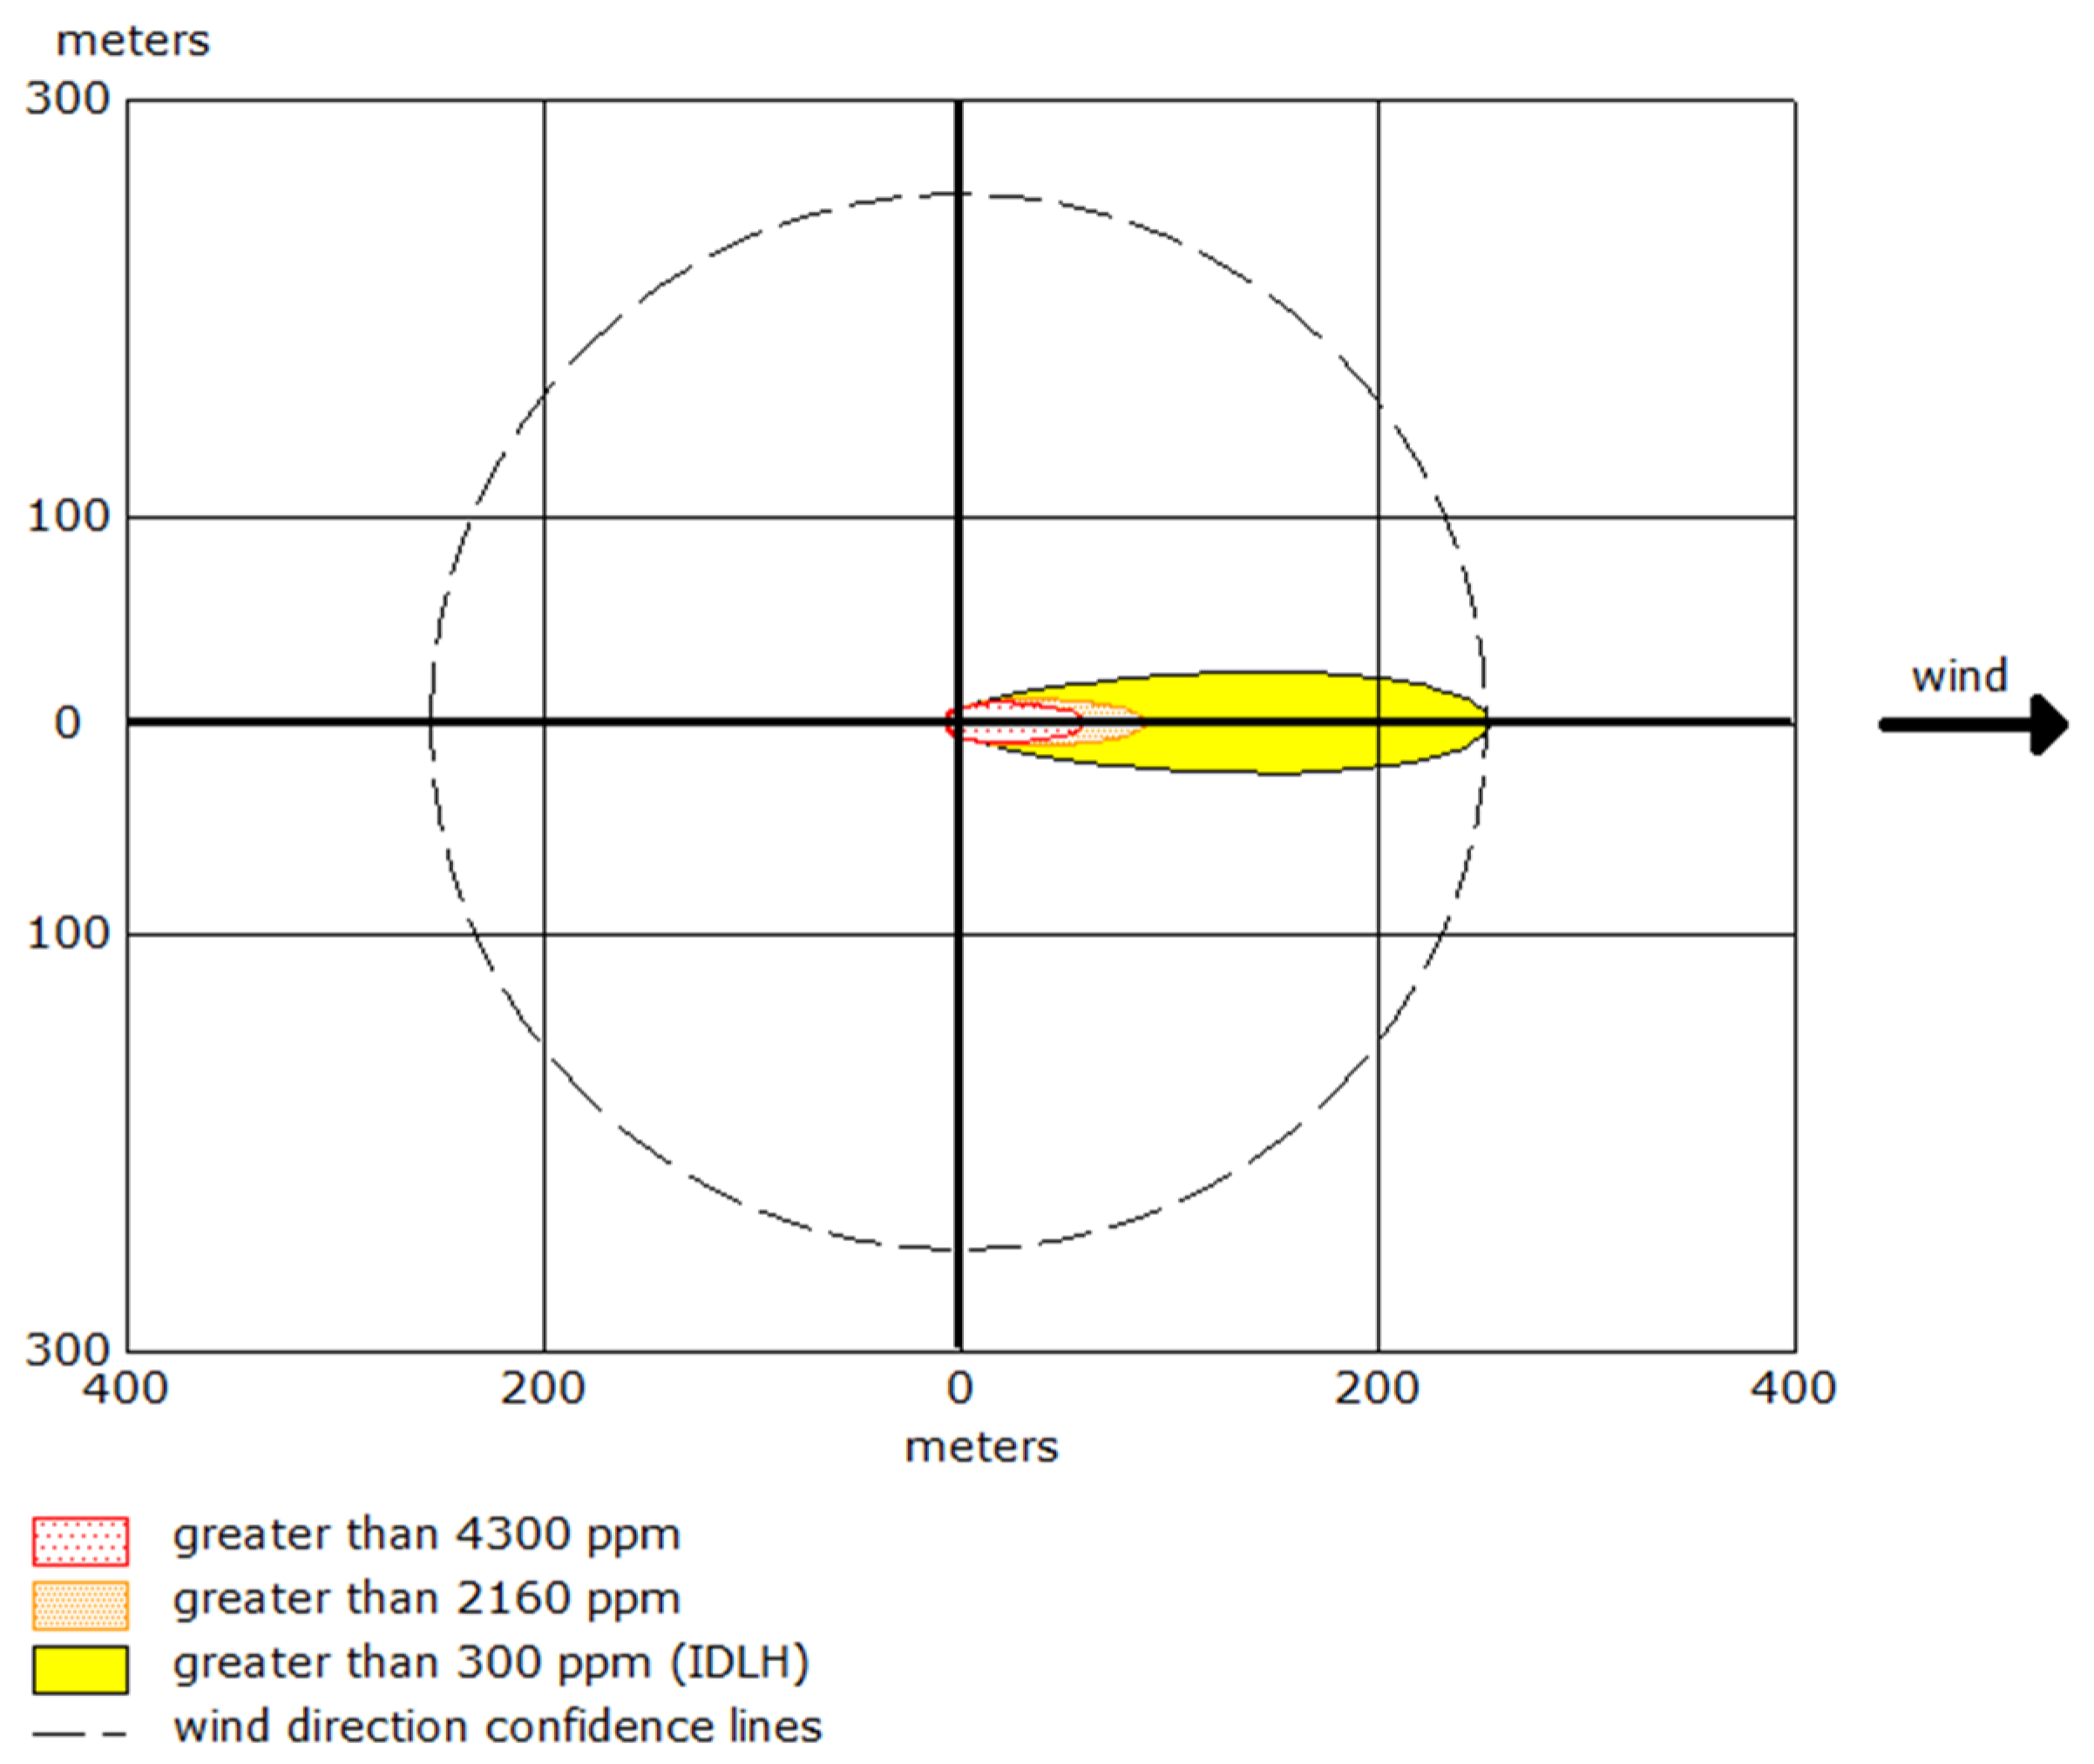
Scheme 2 and
Figure 3 show the dispersion patterns of ammonia for Scenario 1.2, with color-coded zones representing varying levels of risk. These visual models clearly demonstrate that, under the conditions of Scenario 1.2, the elevated concentrations necessitate immediate evacuation and the swift deployment of specialised emergency units.
The modelling results for Scenario 1.2 highlight the importance of prompt intervention and evacuation, especially as ammonia concentrations reach hazardous levels. The data presented in
Table 3 delineate the ranges of danger zones and their associated risks, illustrating the necessity for precise, timely response strategies in this scenario.
Scheme 2 provides a graphical representation of the ammonia dispersion zones for Scenario 1.2, illustrating concentration levels across the affected areas.
Figure 3, showing a geospatial model of hazard zones, employs color-coded areas (red, orange, and yellow) to visually represent the varying levels of risk. The red ERPG-3 zone represents the highest level of danger, while the orange ERPG-2 and yellow ERPG-1 zones indicate progressively lower risks.
The use of Google Earth for visualisation, as depicted in
Figure 3, helps emergency planners precisely identify critical areas, enabling them to implement protective measures promptly and efficiently.
Table 4 consolidates data from both Scenario 1.1 and Scenario 1.2, providing an overview of hazard zones. The table includes essential variables, such as wind speed, air temperature, leak duration, and the mass of leaked ammonia, which were key factors in the ALOHA software simulations. These comprehensive data support emergency response teams in tailoring their interventions to the specific conditions of each scenario.
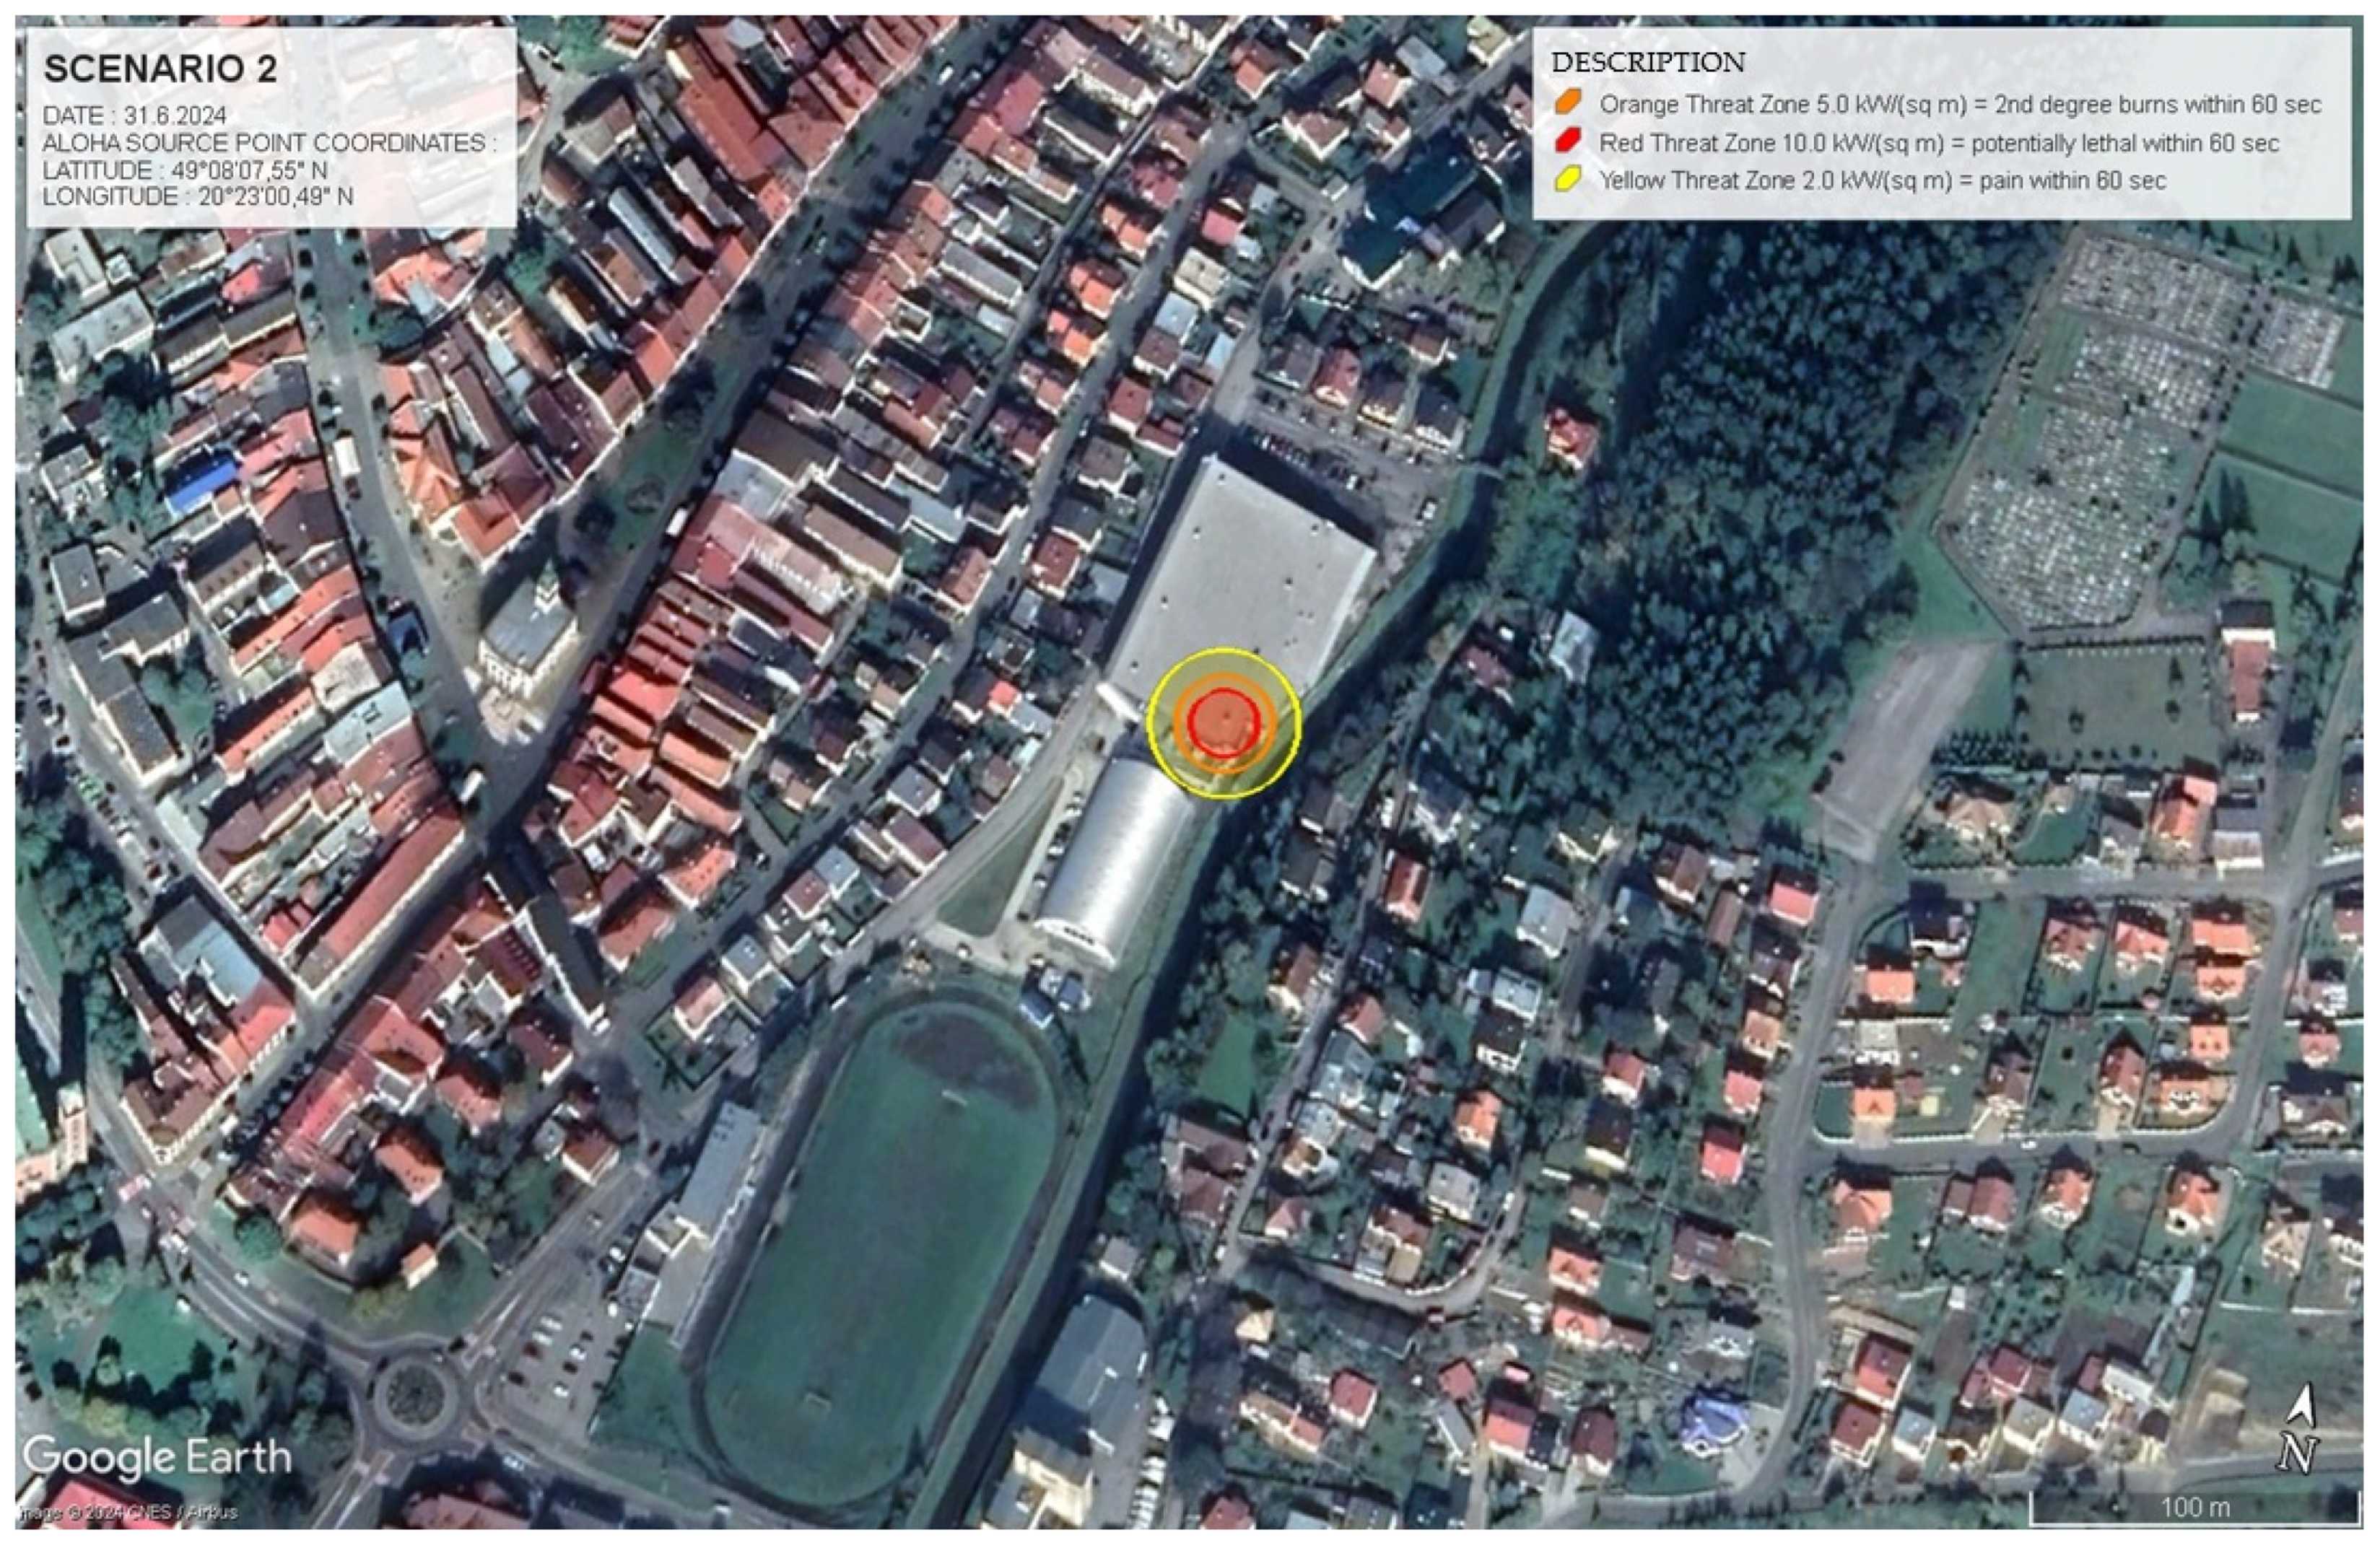
4.1.3. Scenario 2. Pool Fire with Thermal Radiation Hazards
The model for this scenario was meticulously constructed to simulate a pool fire involving ammonia, placing particular emphasis on the resulting thermal radiation and its profound effects on surrounding areas. This simulation incorporated atmospheric conditions, specifically a temperature of t = 20 °C and a wind speed of v = 1 m.s−1, alongside the geographic location (GPS: 49.135727, 20.433323). Critical chemical properties of ammonia, including its molecular weight of 17.03 g.mol−1 and boiling point of −33 °C, were integral to the calculations. By utilising ALOHA 5.4.7 software, danger zones were established based on thermal radiation thresholds, as defined by the Emergency Response Planning Guidelines (ERPG).
Several factors contributed to the potential ignition of ammonia in this scenario, including improper storage conditions, equipment malfunctions, and external heat sources. Such conditions can lead to a pool fire when ammonia vapours come into contact with flames or elevated temperatures, thus creating a significant hazard.
The ALOHA model identified three primary risk zones (ERPG-1, 2, and 3) detailed in Scenario 1.2, each highlighting life-threatening thermal radiation levels.
This scenario highlights the importance of understanding both the thermal radiation risks associated with pool fires and the specific response strategies necessary to manage these unique hazards effectively. The relationship between thermal radiation intensity (
q) and distance (
r) can be quantitatively described using the inverse square law for radiative heat transfer, as follows:
This expression indicates that the intensity of thermal radiation decreases with the square of the distance from the fire, underscoring the necessity for precise calculations to identify safe zones during a fire incident. The creation of this scenario also aimed to prepare for various types of emergency responses. While gas leaks present hazards primarily associated with inhaling toxic substances, fire incidents involve additional risks from thermal radiation and the potential for secondary fires. By simulating Scenario 2, tailored responses to the unique risks posed by each type of emergency can be effectively developed.
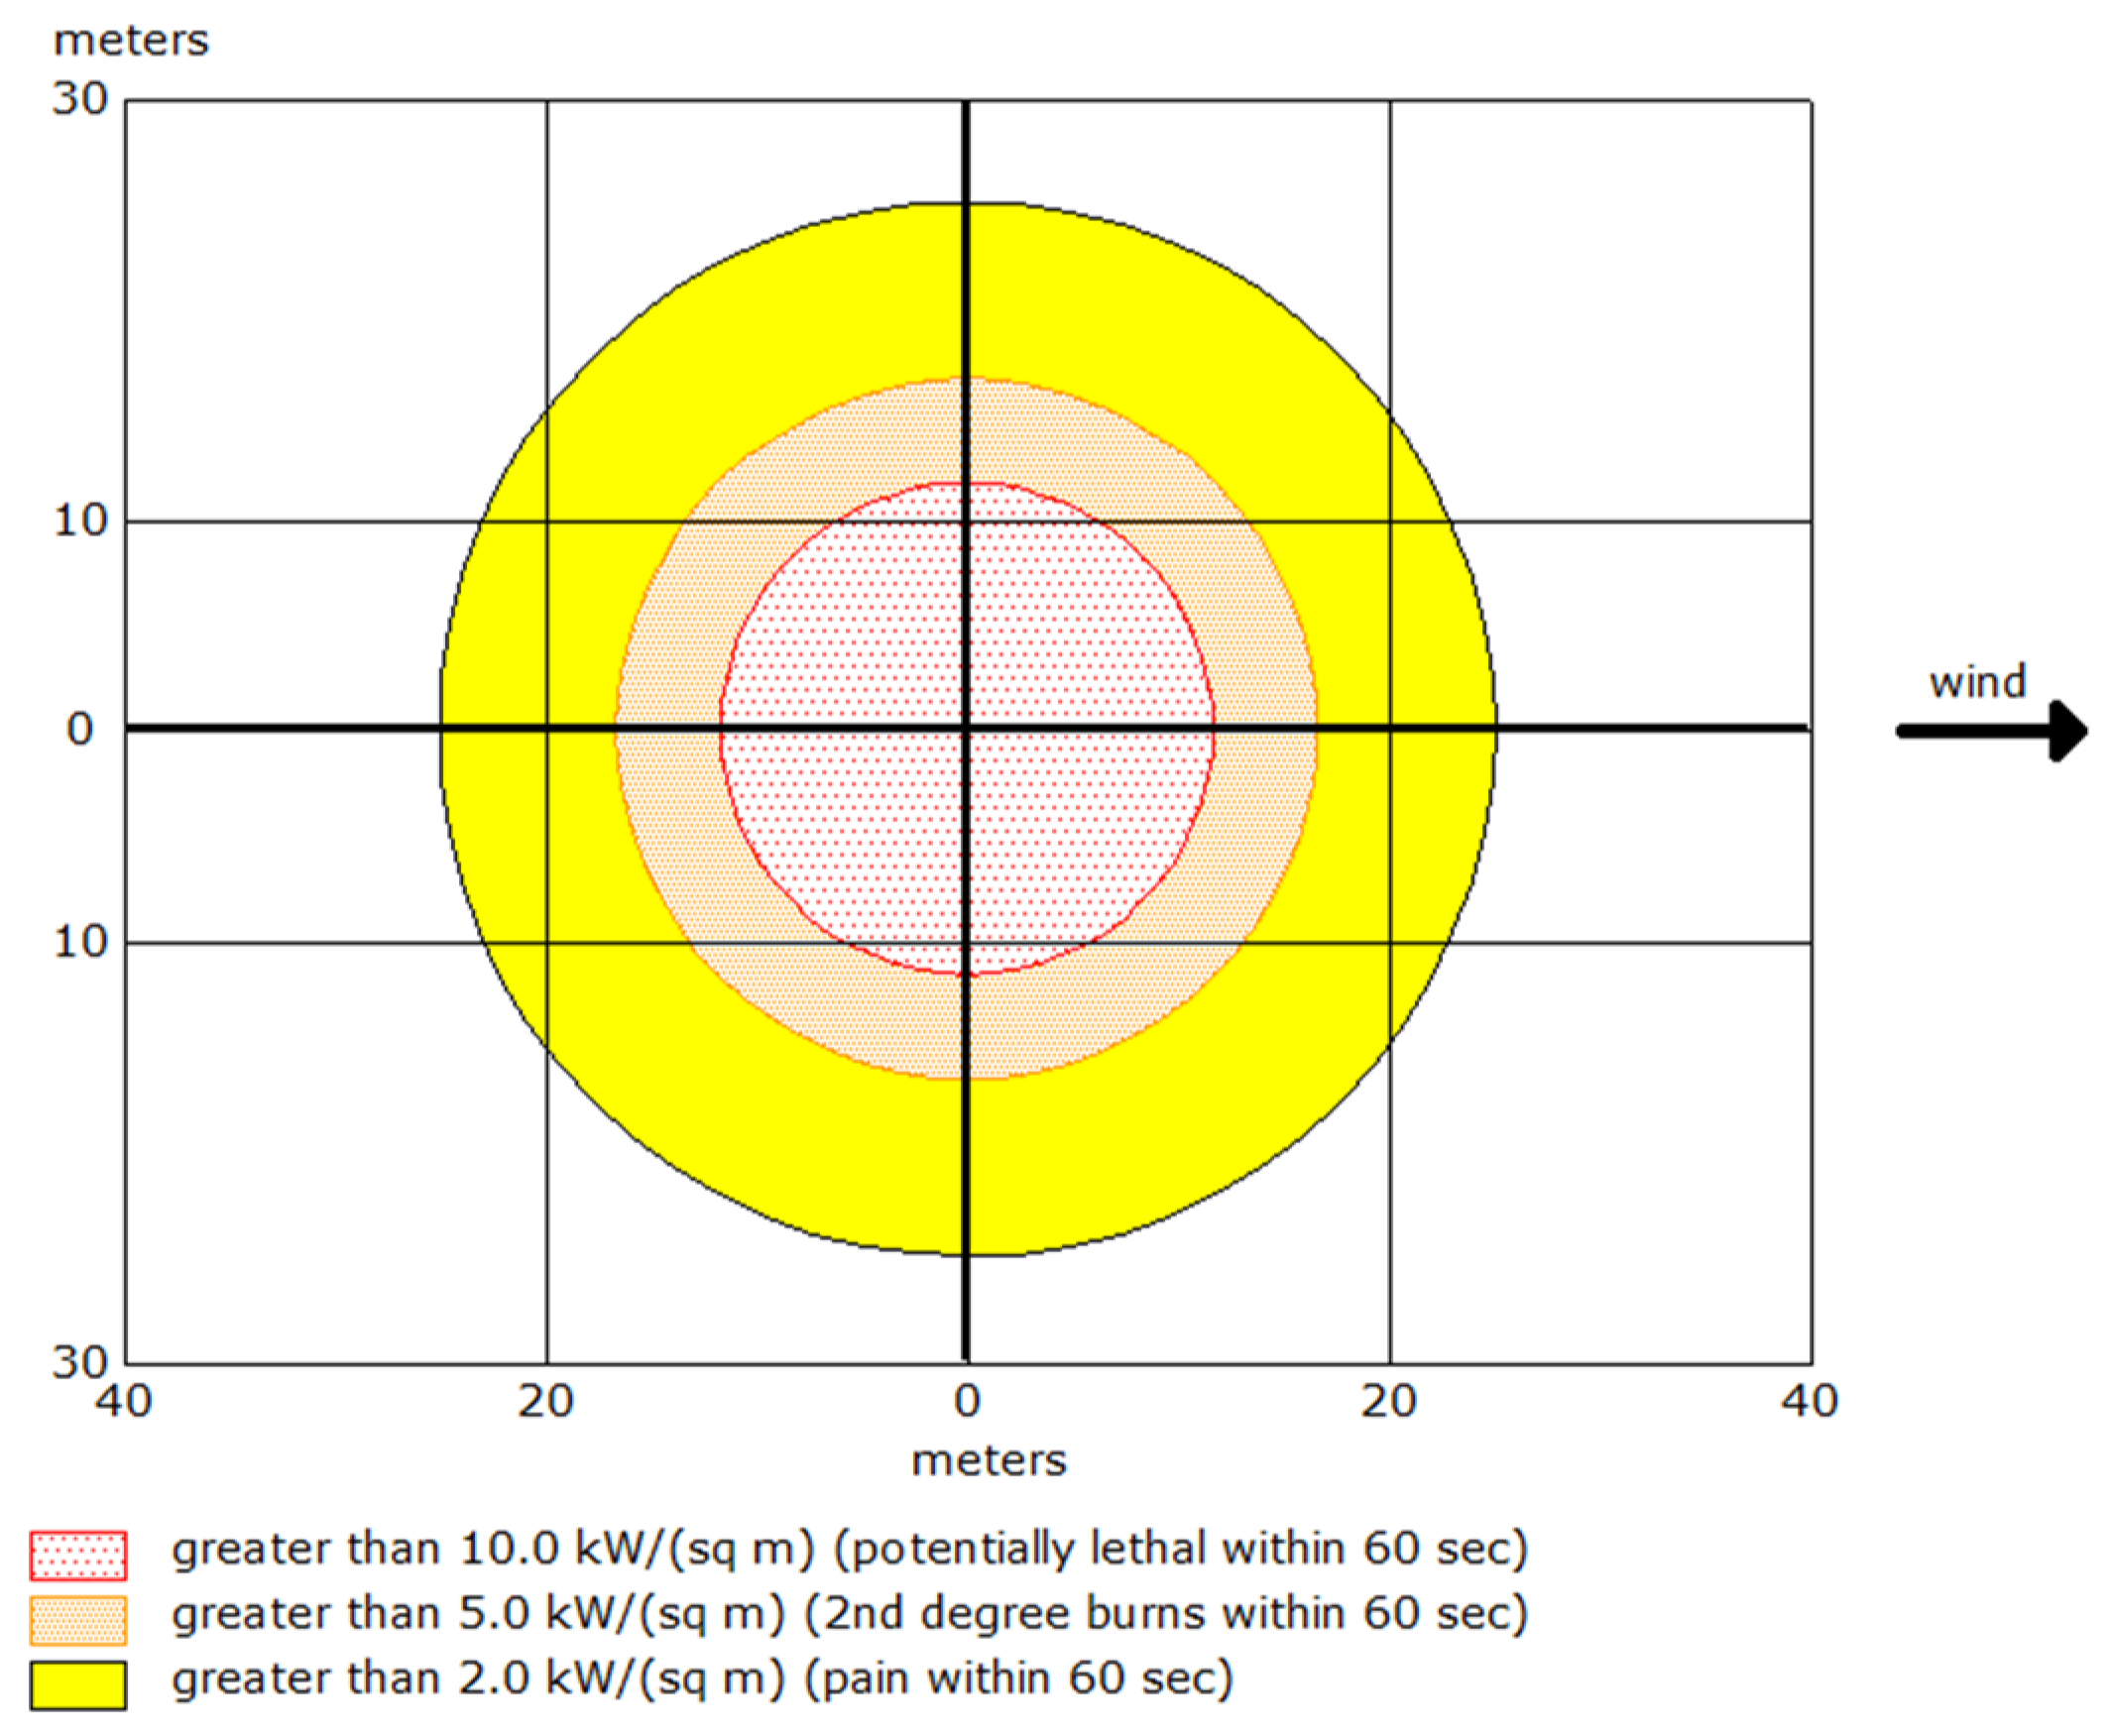
4.1.4. Thermal Radiation Intensity and Hazard Zones
In Scenario 2, the analysis emphasises thermal radiation emitted from the pool fire, with each color-coded zone delineating specific levels of thermal radiation intensity, q (measured in kW.m−2), and the associated risk, as follows:
ERPG-3 zone defined as q ≥ 10.0 kW.m−2 extends to a distance of 12 m from the fire source, where exposure for 60 s is potentially fatal due to the intense heat.
ERPG-2 zone includes radiation levels ranging from 5.0 to 10.0 kW.m−2 and extends up to 17 m from the fire source, where exposure for 60 s can result in second-degree burns.
ERPG-1 zone indicates radiation levels between 2.0 and 5.0 kW.m−2, reaching up to 25 m, where exposure may cause pain within 60 s.
The total thermal energy absorbed over time,
E, is expressed as:
This relationship highlights that the severity of thermal effects escalates with prolonged exposure or elevated thermal radiation levels, underscoring the critical need for timely evacuation in hazardous situations.
Scheme 3 illustrates the danger zones for Scenario 2, demonstrating the dispersion patterns of thermal radiation.
Figure 4 provides a vulnerability and risk model for the affected area, showcasing the areas impacted by the ammonia leak (export of data from
Scheme 3 to Google Earth for Scenario 2).
The data presented in
Table 5 quantify the size and extent of these hazard zones, offering a structured framework for planning effective emergency responses during a pool fire incident.
The parameters for the ammonia leak and resulting pool fire simulation are summarised in
Table 6. These parameters are essential for modelling and analysing the risks associated with hazardous substance releases.
These data underscore the significance of utilising accurate, real-time environmental data within the ALOHA software to effectively predict the spread and intensity of hazards during industrial incidents. The simulations clearly demonstrate the critical need for continuous monitoring and adaptable response strategies to manage ammonia leaks in industrial environments proficiently.
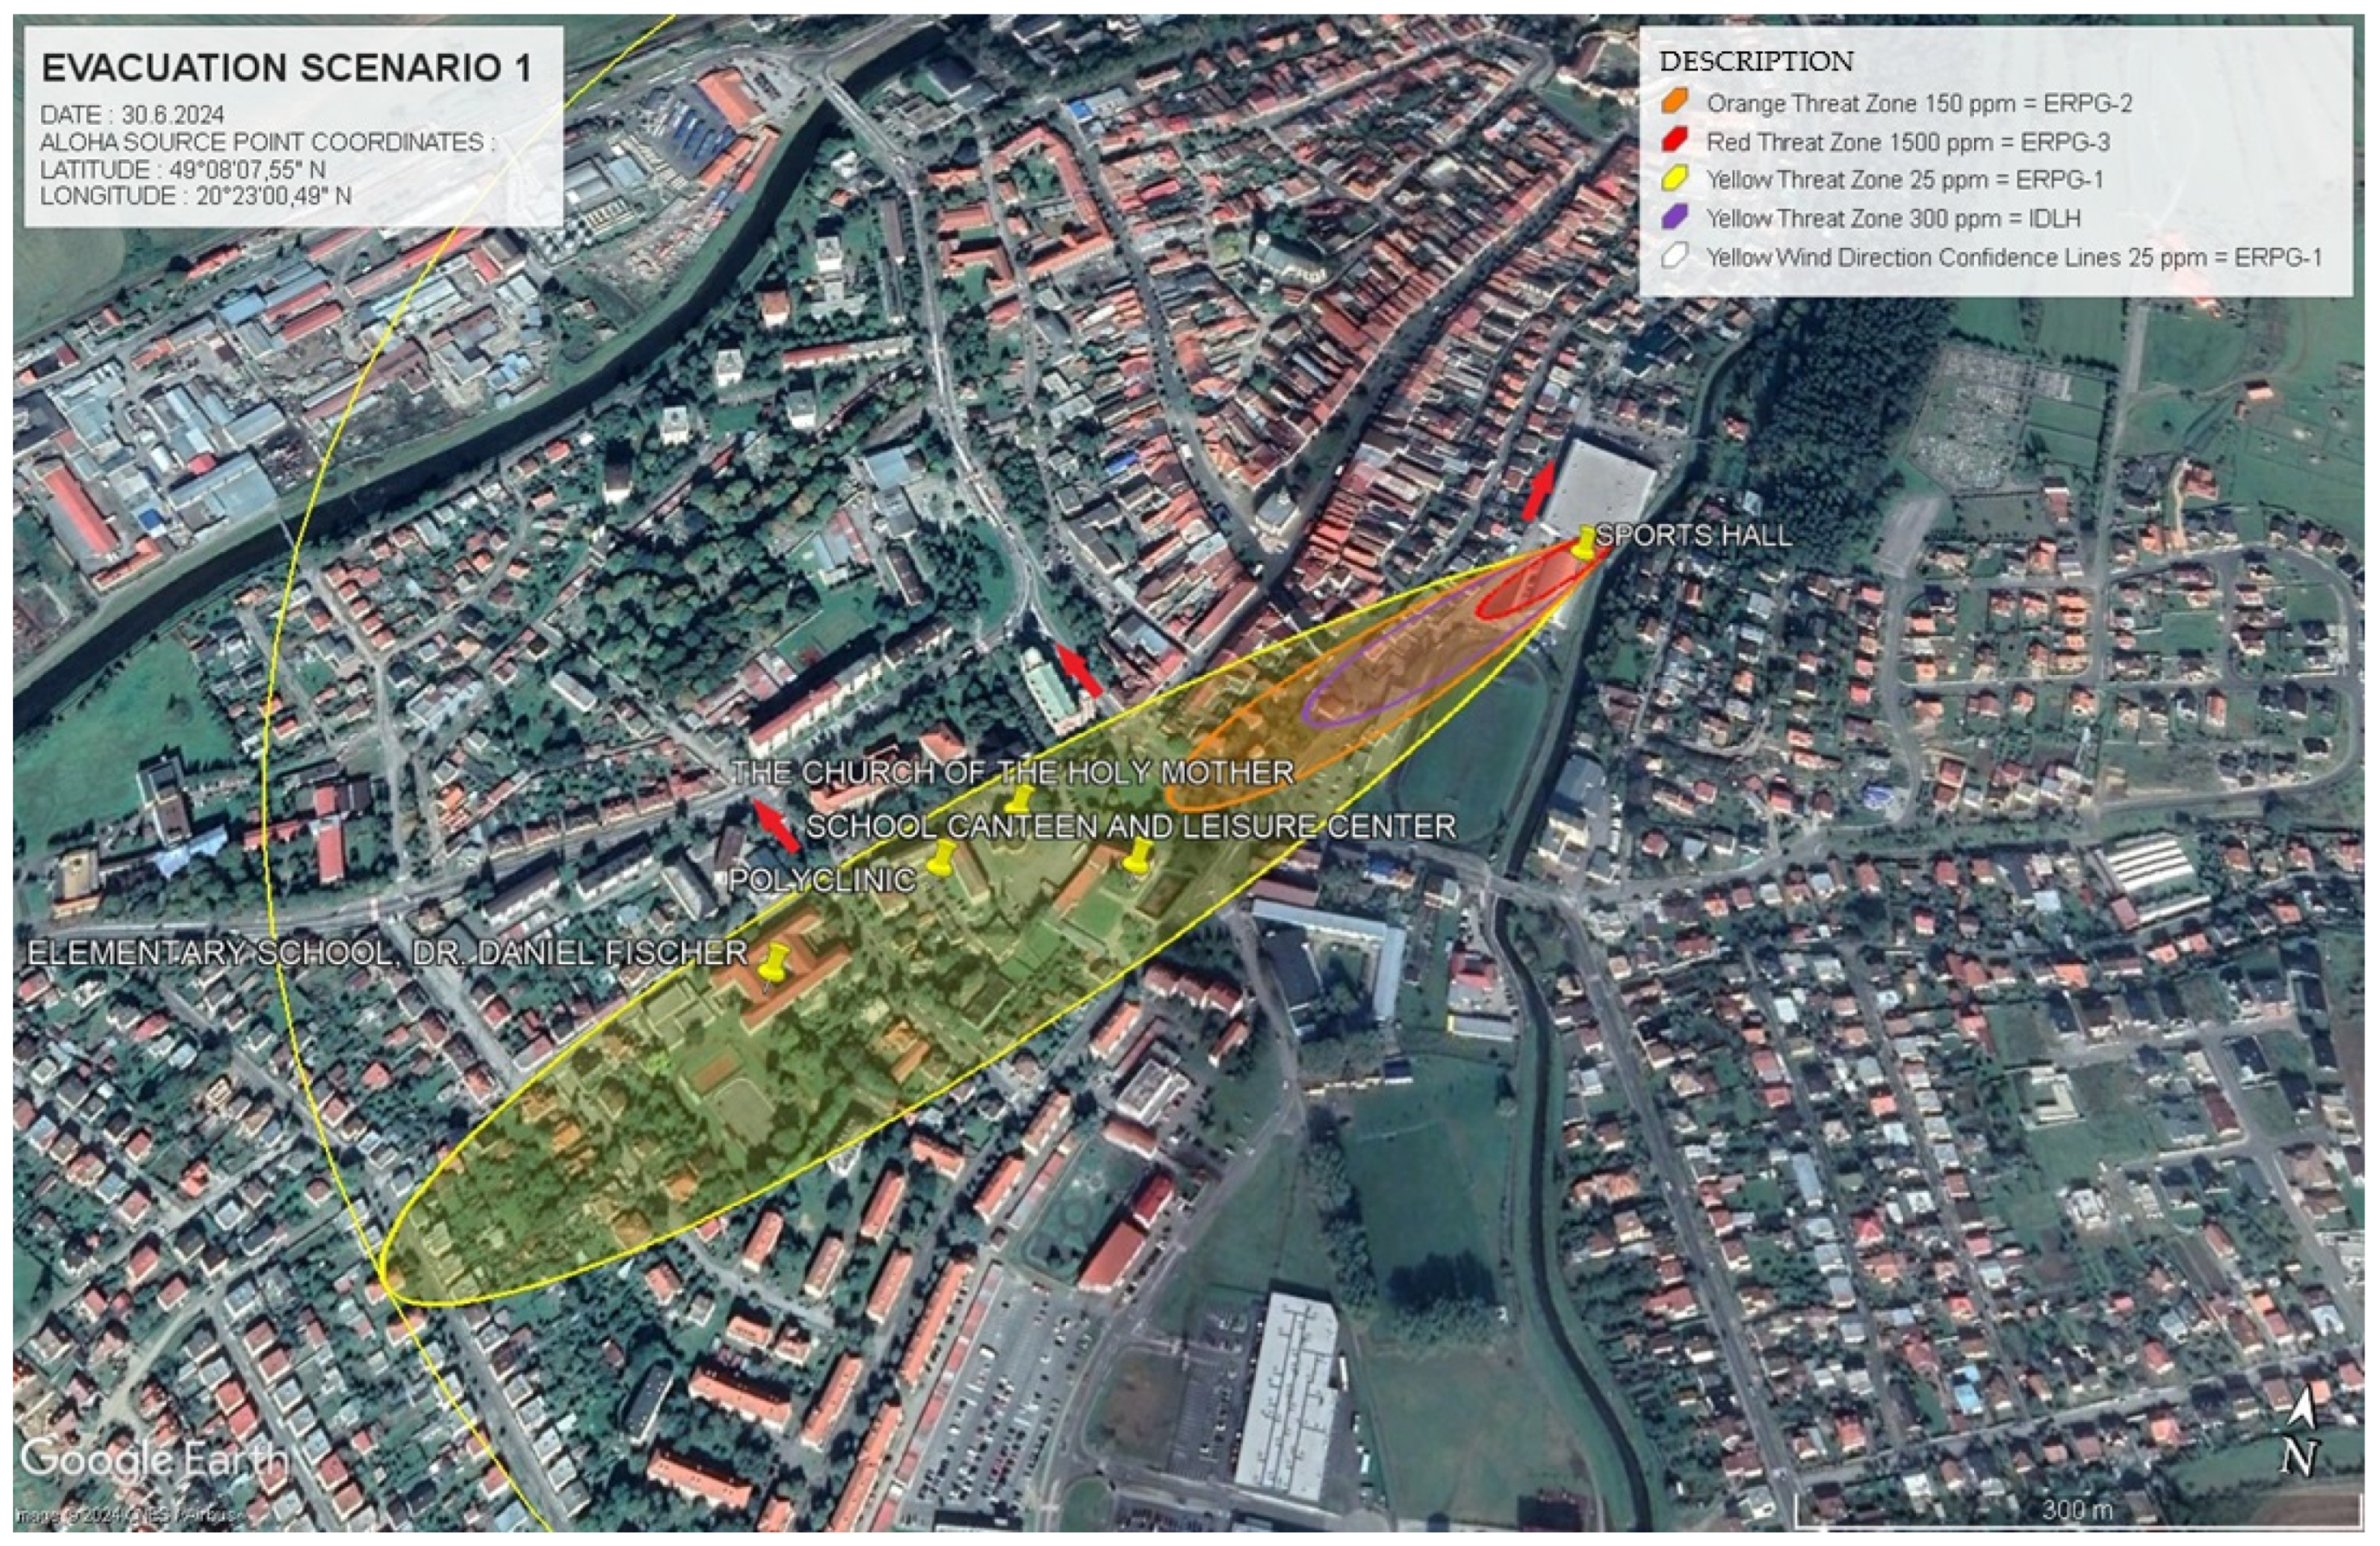
4.2. Results of Evacuation Models for Each Scenario
The ALOHA software simulations provided a comprehensive analysis of ammonia leak scenarios, producing color-coded risk zones that showed varying levels of ammonia concentration in the air. These simulations are vital tools in the field of crisis management, enabling planners to develop effective evacuation strategies based on real-time data and predicted hazard distributions. These simulations are critical for determining evacuation zones and planning optimal evacuation routes based on the predicted spread of the hazardous substance. Furthermore, the software offers time-based data, predicting how ammonia concentrations evolve over time, aiding emergency services in effectively planning their responses to critical exposure levels.
In Scenario 1, the simulation revealed key danger zones based on the concentration of ammonia in different areas. The evacuation models were tailored according to these concentrations, with rapid evacuations necessary in ERPG-3 zones, where ammonia concentrations reached 1500 ppm. Within these zones, the population needed to evacuate within 10 min to avoid severe health impacts. In ERPG-2 zones, where concentrations reached 150 ppm, evacuation could be delayed by up to 30 min without risking serious long-term health effects. Such detailed hazard assessment is crucial for informing decision-makers and enhancing community preparedness for potential ammonia leak incidents. These insights emphasise the value of early warnings and accurate modelling in optimising evacuation routes and timing, ensuring minimal exposure to harmful concentrations.
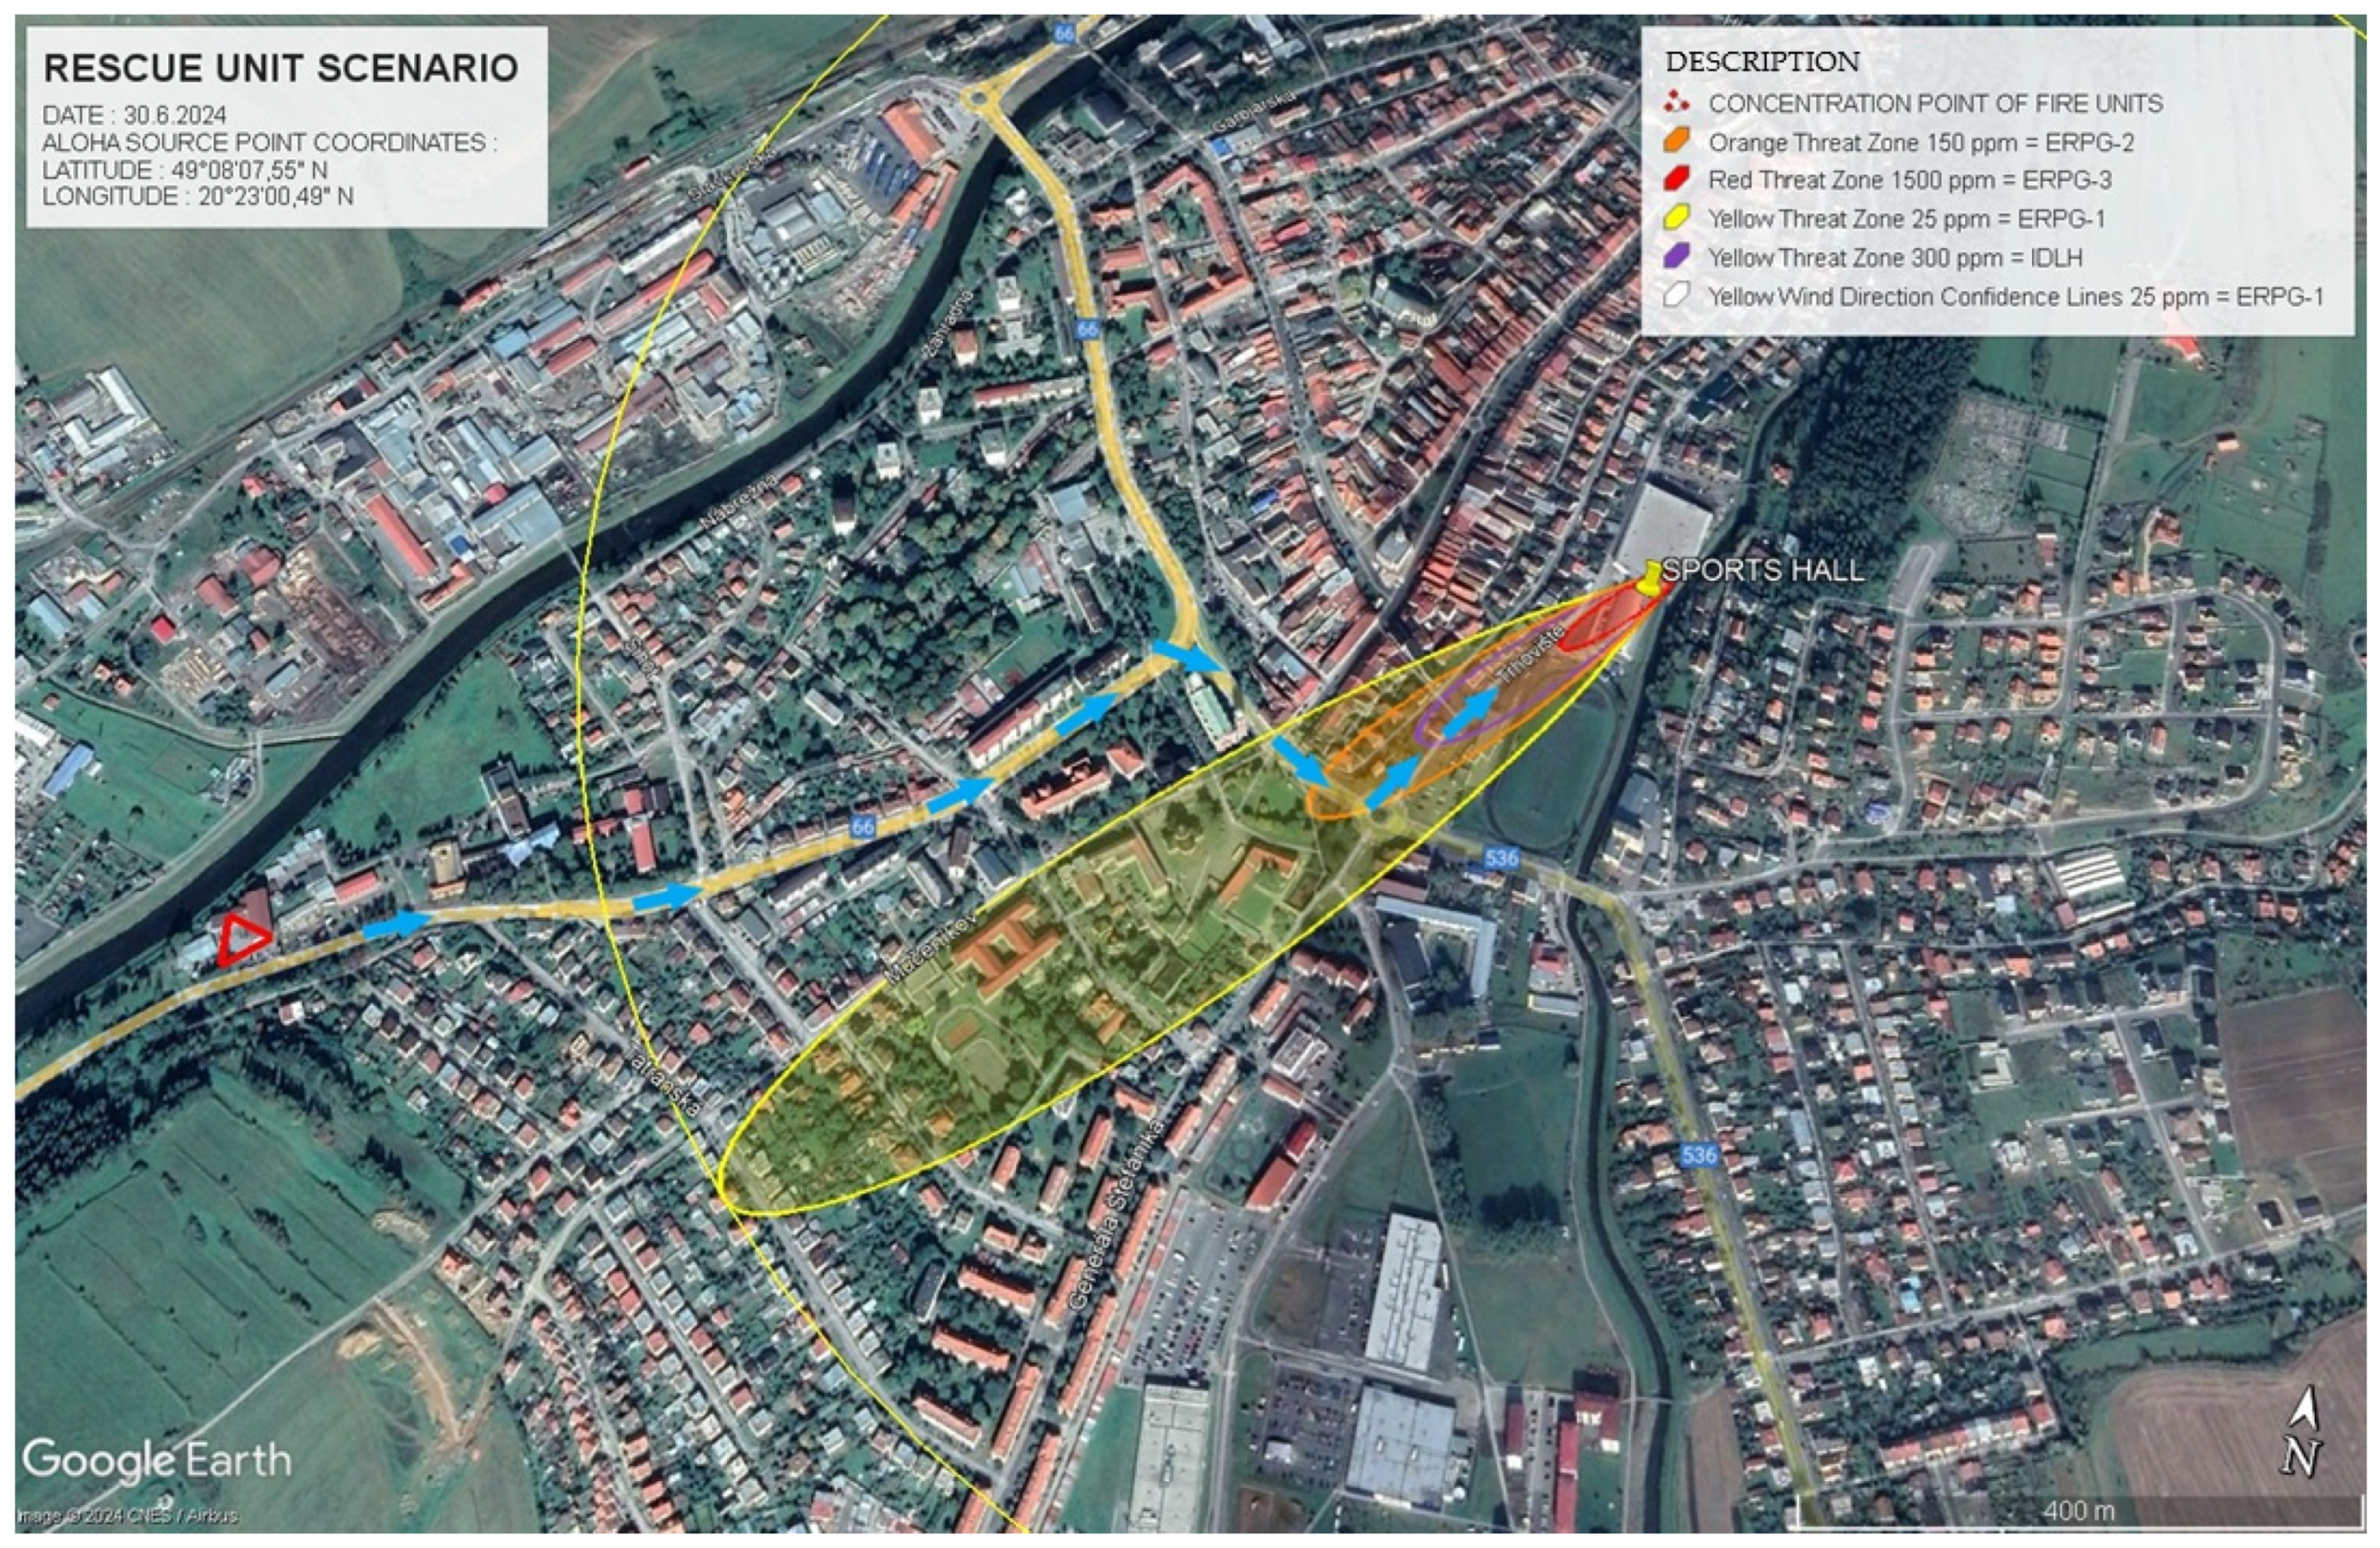
In
Figure 5, the evacuation simulation for Scenario 1 is displayed. This figure outlines the primary evacuation directions (represented by red arrows), and the critical buildings marked for evacuation (indicated by yellow pins). The simulation assists emergency planners in identifying areas that must be evacuated to minimise the risk of exposure to hazardous ammonia concentrations.
The data in
Table 7 provide specific details about the danger zones for Scenario 1. In ERPG-3, where ammonia concentrations reached 1500 ppm, the zone extended 110 m from the source. This zone represents the most dangerous area where exposure can cause serious health effects. The ERPG-2 zone extended to 362 m with concentrations of 150 ppm, presenting a serious health risk. Finally, ERPG-1, the least severe zone, spanned 895 m with concentrations of 25 ppm, where health risks are lower but still present.
Figure 6 presents the driving route for rescue services in Scenario 1, as modelled in ALOHA. This figure is crucial for planning the approach of rescue teams, optimising their routes to avoid exposure to hazardous substances. The red triangle marks the location of the fire and rescue units, with blue arrows indicating their route to the scene. Yellow pins mark important structures, including schools and medical centres, requiring immediate evacuation.
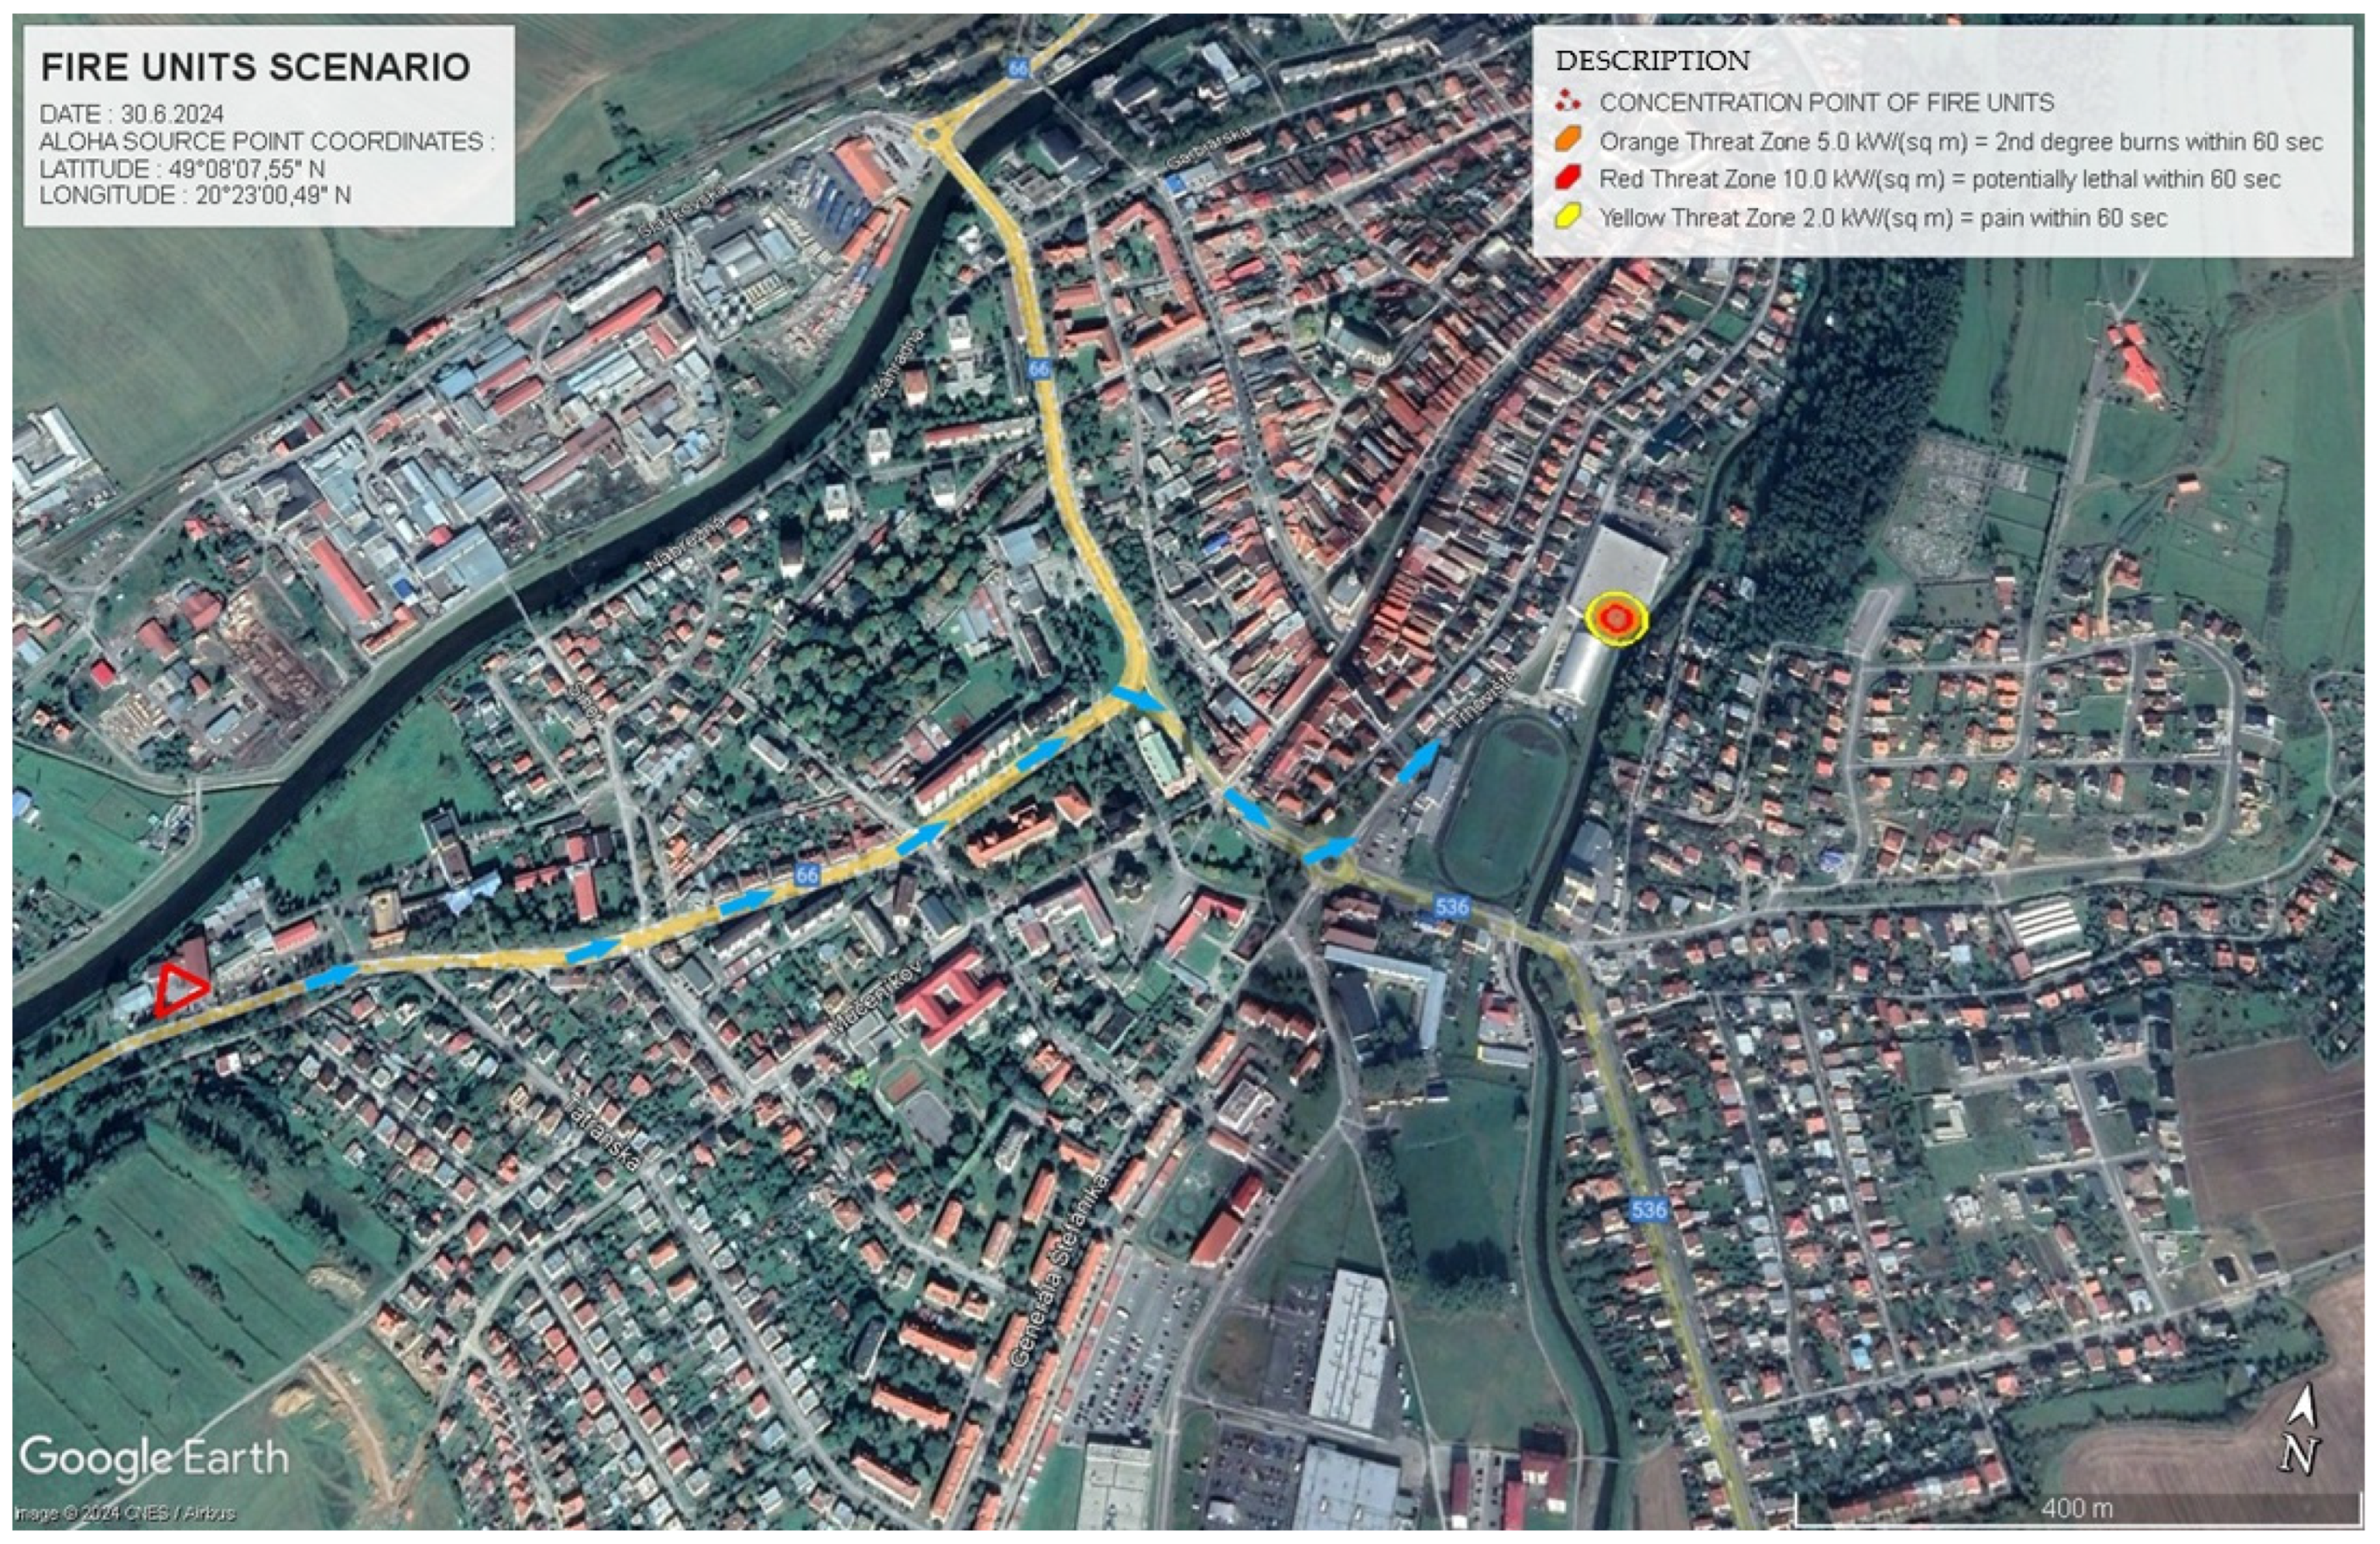
Under Scenario 2, the rescue route was designed to minimise exposure to thermal radiation from a pool fire of a hazardous substance.
Figure 7 illustrates this rescue route, which takes into account the need to avoid the most dangerous zones while allowing rapid access for emergency teams. The blue arrows indicate the optimal path for rescue units, while the critical areas for intervention are marked with relevant hazard zone data.
Table 8 provides specific data for the danger zones in Scenario 2, focusing on the intensity of thermal radiation. In the ERPG-3 zone (10.0 kW.m
−2), the zone extended 12 m from the fire source and presented a potentially fatal risk within 60 s. The ERPG-2 zone (5.0 kW.m
−2) extended 17 m and could cause second-degree burns within 60 s. The ERPG-1 zone (2.0 kW.m
−2) extended 25 m, where exposure would result in pain within 60 s.
The presented ammonia leak model for Scenario 1, combined with the pool fire risk in Scenario 2, emphasised the importance of precise evacuation planning and timely deployment of rescue services. The implications of these findings extend beyond theoretical modelling, offering practical insights for emergency response units tasked with safeguarding public health and safety. The model outputs, combined with real-time environmental data, enable rescue units to minimise exposure risks while ensuring efficient intervention strategies in hazardous situations. Ultimately, the integration of real-time environmental data with advanced modelling techniques fosters a more resilient approach to industrial safety management.
6. Discussion
The findings from this study confirmed the critical role of ALOHA in modelling hazardous substance releases and its application to emergency management strategies. Through detailed scenario analysis, ALOHA demonstrated its ability to predict the spread of ammonia in Scenario 1 and the thermal radiation risks posed by a pool fire in Scenario 2. The precise mapping of danger zones—ERPG-3 (C ≥ 1500 ppm), ERPG-2 (C ≥ 150 ppm), and ERPG-1 (C ≥ 25 ppm)—proved vital in informing evacuation protocols and protective measures. The accurate identification of these zones underscores ALOHA’s strength in assessing immediate risks, particularly in industrial settings where timely intervention is crucial [
19,
27,
28].
Scenario 2 highlighted ALOHA’s capability to model fire hazards, focusing on the effects of thermal radiation. The results delineated the most dangerous areas based on thermal radiation intensity, showing how evacuation routes and rescue interventions can be optimised to minimise exposure risks. The thermal radiation danger zones—ERPG-3 (q ≥ 10.0 kW.m
−2), ERPG-2 (5.0 kW.m
−2), and ERPG-1 (2.0 kW.m
−2)—provided clear guidance for the deployment of protective measures, ensuring safety in areas where heat could cause fatal injuries or burns within a short exposure time [
21,
24,
29,
30].
Despite its effectiveness, the study revealed several opportunities for enhancing ALOHA’s performance. One key area for improvement is the expansion of ALOHA’s chemical database, which would allow for more comprehensive risk assessments across a broader range of substances and scenarios. By extending the database, users could model a wider variety of industrial chemicals, thereby improving emergency preparedness across multiple sectors [
19,
25,
31]. This would also make ALOHA more versatile and applicable in diverse settings where different hazardous materials are in use [
21,
27,
28].
The integration of modern technologies, such as Geographic Information Systems (GIS), Artificial Intelligence (AI), and drones, represents another significant opportunity for enhancing ALOHA’s capabilities. GIS could provide real-time mapping of danger zones, enabling more dynamic visualisation and improved decision-making during emergencies. Combining GIS with ALOHA’s predictive models would allow responders to update evacuation routes and risk zones in real time, based on continuously changing environmental conditions [
13,
17,
31].
Furthermore, AI could improve the accuracy of ALOHA’s predictions by enabling real-time analysis of incoming data. By leveraging AI algorithms, ALOHA could continuously refine its hazard models as new environmental data—such as wind speed and temperature—become available, ensuring more adaptive and precise emergency responses [
22,
32]. Drones equipped with chemical sensors could further enhance real-time data collection, providing critical information from hazardous zones that would be otherwise difficult to access. This would allow ALOHA to incorporate real-time data into its simulations, increasing the accuracy of risk assessments and offering a more comprehensive view of the evolving situation [
17,
31].
However, ALOHA’s reliance on static input data, such as pre-configured meteorological conditions, remains a limitation, particularly in dynamic scenarios where environmental factors can change rapidly. Integrating real-time weather data, as well as more advanced monitoring systems, would significantly improve the reliability of ALOHA’s predictions. This would reduce the uncertainty in emergency scenarios where quick decision-making is essential to protect public health and infrastructure [
21,
29,
31].
Additionally, comparisons with other risk assessment tools, such as PHAST or SAFER, could provide further insights into ALOHA’s strengths and areas for improvement. While ALOHA excels in modelling atmospheric dispersion and fire hazards, other tools may offer features that could complement ALOHA’s capabilities, such as real-time incident monitoring or a broader chemical database. A thorough comparison would help to better contextualise ALOHA’s utility and identify where future improvements could enhance its performance across different emergency scenarios [
19,
30,
32].
In conclusion, ALOHA remains a powerful tool for modelling hazardous substance releases, offering precise predictions that are crucial for planning evacuations and minimising exposure risks. While the software is highly effective in its current form, the integration of new technologies and an expanded chemical database would further enhance its applicability and accuracy. These advancements would make ALOHA even more valuable in the increasingly complex landscape of industrial safety and crisis management [
17,
33,
34].
7. Conclusions
This study provided models of three scenarios created using ALOHA software. Each of these scenarios differed in the type of hazard being simulated and the conditions under which the hazardous substance was leaked, or a fire occurred.
Scenario 1.1 modelled a situation in which an ammonia leak occurred under stable atmospheric conditions, which are usually prevalent in the summer months. This scenario focused on the spread of ammonia in the air and identified danger zones with concentrations defined by ERPG-1, ERPG-2, and ERPG-3. The simulation results were transferred to Google Earth, which enabled the visualisation of danger zones in a real environment.
Scenario 1.2 was also modelled under similar atmospheric conditions as Scenario 1.1, but it focused on specific concentrations of ammonia that can have immediate fatal consequences. In this scenario, zones with concentrations of 4300 ppm and 2160 ppm were marked, with the IDLH zone being the most dangerous. The scenario highlighted the risk of dying within minutes in the 4300 ppm zone, and the life-threatening risk of thirty minutes of exposure in the 2160 ppm zone.
Scenario 2 differed from the previous ones in that it simulated a pool fire in a hazardous substance, focusing on thermal radiation. This scenario showed danger zones caused by thermal radiation, while also using Google Earth to visualise these zones in a real-world environment.
For Scenarios 1 and 2, the routes of the rescue services were simulated using ALOHA. These simulations were used to plan and optimise interventions in the event of a leak of hazardous substances, namely, ammonia, and in the event of a fire.
For Scenario 1, the emergency services’ driving route was designed to enable a quick and efficient response, taking into account critical buildings that needed to be evacuated, such as schools and medical centres. The simulation also considered danger zones based on ammonia concentrations.
In Scenario 2, a situation with a pool fire of a hazardous substance was simulated. The route of the rescue services was planned in such a way as to minimise exposure to thermal radiation and enable safe and effective intervention in the affected areas. The route also took into account weather conditions and wind direction to avoid hitting zones with high heat radiation.
Each of these scenarios focused on different aspects of the hazard and provided different perspectives on the possible risks associated with a leak or fire of a hazardous substance.
In conclusion, the future of ALOHA software will depend on its ability to constantly innovate and adapt to the changing needs of its users. In order for ALOHA software to remain relevant and effective in crisis management, development teams will need to invest in improving the software’s features, integrating new technologies, such as advanced simulations or Artificial Intelligence, and expanding its compatibility with modern data collection and analysis tools. Such steps will enable ALOHA to keep up with technological trends and increasing demands for accuracy and reliability in the field of emergency management.


