Article

Studying the Constitutive Model of Damage for a Stainless Steel Argon–Oxygen Decarburization Slag Mixture

School of Civil Engineering and Architecture, Guangxi University of Science and Technology, Liuzhou 545006, China
*
Author to whom correspondence should be addressed.
Appl. Sci. 2024, 14(21), 10006; https://doi.org/10.3390/app142110006
Submission received: 21 September 2024 / Revised: 29 October 2024 / Accepted: 31 October 2024 / Published: 1 November 2024

Abstract

:
The purpose of this study was to fully explore the mechanical properties of five different doses of an Argon–Oxygen Decarburization slag mixture in an unconfined compressive strength test. The peak stress, elastic modulus, and stress–strain curve of the mixture were studied for 90 days. Based on the experimental data and according to the theory of damage mechanics, the concept of damage threshold (t) was introduced to construct a damage constitutive model. Referring to the damage threshold of concrete, that of the mixture was determined to be 0.7 times higher than the peak strain, and the correlation coefficient between the established model and the test curve was above 0.85. These results indicate that the addition of AOD slag and fly ash can cause hydration reactions, increase the quantity of hydration products, and enhance the peak stress and elastic modulus of the mixture. The maximum increases were 94.9% and 43.1%, respectively. Parameters a and b reflect the peak stress and brittleness of the mixture, respectively. The incorporation of Argon–Oxygen Decarburization slag can make the mixture less brittle and improve its properties. The incorporation of Argon–Oxygen Decarburization slag can protect the mixture from damage. The maximum decrease is 40.2%.

1. Introduction

Roads are central to the economic development of nations, with low-grade road layers functioning as the load-bearing component, ensuring pavement stability. Commonly, the base materials are composed of a blend of cement and fly ash as inorganic binders. As economies rapidly expand, they are confronted with two issues: the depletion of natural resources and a rise in industrial waste and construction debris. As a major producer of stainless steel, China is expected to reach 50.05 million tons by 2035 [1]. Refined Argon–Oxygen Decarbonization (AOD) slag produced in steelmaking [2,3,4,5,6,7] after harmless treatment contains C2S and some cementitious substances similar to cement [8,9]. Other studies have shown that concrete with from 0% to 30% AOD slag has good mechanical properties [10]. Fly ash, an industrial byproduct, is extensively used as a binding agent. Some studies have shown that incorporating fly ash into steel slag can decrease the free lime dosage, significantly boosting the reactivity of steel slag [11,12]. Therefore, using AOD slag as a cementitious material for low-grade pavements has good prospects. Additionally, the utilization of Construction and Demolition Waste (CDW) not only meets the needs of road users [13,14], but also enhances the crack-resistant properties of roads [15,16,17], thereby offering the dual benefits of sustainability and infrastructure resilience.
Mechanical properties are the key indicators used to evaluate the performance of mixtures in practical road applications, directly reflecting the material’s behavior when subjected to various external loads. Establishing a correlation between the damage variables and macroscopic mechanical parameters enables the more precise evaluation of the degree of damage incurred by the material during loading processes. Thus, linking the damage variables with macroscopic mechanics is a crucial aspect of such research [18,19,20]. Qin et al. [21] successfully developed a damage evolution model for fiber-reinforced concrete, shedding light on the mechanisms by which fibers effectively enhance concrete properties, and providing a robust theoretical foundation for predicting the mechanical behavior of fiber-concrete composites. Fang et al. [22], through CT scan experiments, established a damage constitutive model that elucidated crack propagation in heterogeneous concrete under stress. Dinesh et al. [23] employed wavelet entropy to depict the evolution of concrete damage, offering a method for state monitoring during concrete construction. This research, whether CT scanning or wavelet entropy is employed, requires high-precision scanning equipment. Establishing a damage evolution model through studying the stress–strain relationship of materials is considered to be fast, efficient, and feasible. However, current research related to mixtures is limited.
In formulating damage evolution equations, the principal methodologies encompass micro-mechanical, phenomenological, energy-based, and probability distribution-based approaches. Among these, the latter ones, particularly those based on probability distributions, have been extensively applied in fields such as rock mechanics [24,25,26] and concrete engineering [27,28,29]. By incorporating probability distributions, these methods account for the randomness and uncertainty inherent in internal damage within materials, enabling the more accurate prediction of materials’ performance under loads. Liu [30] et al. constructed a damage constitutive model using a Weibull distribution to investigate the micro-damage evolution of rock mass grouting composite materials under a load. However, during this process, it was found that the dual-parameter model could not accurately describe the various stages of the composite materials. In their work, Han et al. [31] introduced the concept of a damage threshold (t), postulating an elastic phase during which no damage occurs. This provided the basis for using a three-parameter Weibull distribution. In the study of rock mechanical behavior, Li [32] observed the multi-stage nature of rock failure, with the introduction of the damage threshold facilitating the effective demarcation of these stages. Additionally, other researchers have determined that utilizing location within the three-parameter Weibull distribution as the damage threshold can effectively model the material’s strength data, thereby enhancing the precision and applicability of the damage evolution equation [33,34]. The above research indicates that the Weibull distribution can describe the different stages of material damage, but the main materials studied are rocks and concrete, and there is relatively little research on mixtures. In addition, the traditional dual-parameter Weibull distribution does not consider that the material is elastic during the initial compression stage, so it does not suffer damage at this time. Therefore, after considering the elasticity of the material, a three-parameter Weibull distribution model is proposed to describe the constitutive damage to the mixture.
In summary, this study took an AOD slag mixture as the research object and combined the damage mechanics theory [35] to conduct unconfined compression tests. Considering elasticity, a model was established based on probability distribution to study the damage evolution of the AOD slag mixture under unconfined compression.

2. Raw Materials and Sample Preparation

2.1. Raw Materials

The cement used was P.O 42.5 ordinary Portland cement produced by Guangxi Yufeng Cement Co., Ltd. (Liuzhou, China). All the indicators met the relevant requirements of GB.175-2020 [36] and JTG/T F20-2015 [37]. Secondary fly ash was produced by Henan Borun Casting Materials Co., Ltd. (Zhengzhou, China). All the indicators met the relevant requirements of JTG E51-2009 [38] and JTG/T F20-2015 [37]. Stainless steel AOD slag from Guangxi Liuzhou Iron & Steel (Group) Co., Ltd. (Liuzhou, China) was adopted, which becomes grayish-white after treatment. We measured the AOD slag using X-ray diffraction spectroscopy. The results are shown in Figure 1, and the chemical composition of the AOD slag is shown in Table 1, proving that it contains active minerals and can be used as an inorganic binder. The aggregate is made of waste concrete generated from a construction site in Liuzhou, which was crushed using a jaw crusher, and then screened to only include particles of 0.075~31.5 mm. A Zetasizernano particle size analyzer was used to test the fly ash and AOD slag, with average particle sizes of 34.42 µm and 24.77 µm, respectively. The results are shown in Figure 2.

2.2. Mix Proportion Design

In accordance with the requirements specified in this standard [37], we selected a cement dosage of 3%, with a cement-to-fly ash mass ratio of 1:4. A blend ratio of inorganic binder to aggregate (15%:85%) was determined. Through compaction tests, the optimal moisture dosage and maximum dry density at a 3% cement dosage were obtained. By replacing the fly ash with AOD slag, different substitution rates (0%, 3%, 6%, 9%, and 12%) were determined. The results are presented in Table 2.

2.3. Sample Preparation and Testing Instrument

In this experiment, the AOD slag quantity substituted was the variable parameter R, and five different AOD slag dosage mixtures were designed. According to this specification [38], each group was matched with three samples. In order to meet real-world engineering practice, the mixture was used for 90 days. Taking specimen A-3 as an example, ‘3’ indicates that the AOD slag mass dosage is 3%. Therefore, the different doses of AOD slag ranging from 0% to 12% correspond to A-0, A-3, A-6, A-9, and A-12, respectively.
This experiment was conducted in accordance with the specifications of JTG E51-2009 [38]. Cylindrical steel molds with dimensions Φ150 × 150 mm were employed. The specified amount of stabilized material mix was evenly poured into the test mold in 2–3 batches, and after each batch had been poured, it was gently compacted with a tamper rod. Compaction was carried out using a universal press machine at a loading rate of 1 mm/min, maintaining the pressure for 2 min after molding.
During specimen loading, the RMT-301 Rock (Instiute of Rock and Soil Mechanics, Chinese Academy of Sciences, Wuhan, China) and Concrete Mechanics Testing System was utilized, also applying a loading rate of 1 mm/min. The displacement control method with a loading rate of 1 mm/min was used for loading. When the bearing capacity of the mixture decreased to 15% of the peak stress, or when the mixture had been completely destroyed, the test was completed.
Hitachi Regulus8100 was used to perform SEM tests on the crushed specimen samples. The specimens were broken into powders of less than 0.075 mm after sampling, and the XRD tests were performed using Brook D8 advance.

3. Test Results and Analysis

3.1. Damage Phenomenon

During initial loading, the specimen is in an elastic stage, and there is no change on the surface. When the specimen reaches peak stress, the bearing capacity begins to decrease, and cracks begin to appear and gradually extend, as shown in Figure 3a. As stress further increases, the cracks’ width gradually expands, as shown in Figure 3b. During further loading, the central part of the specimen expands slowly, the surface of the specimen develops cracks, and the surface mortar and aggregate gradually fall off, as shown in Figure 3c. The specimen is completely destroyed, forming two concave cylinders with wide ends and narrow middles, as shown in Figure 3d. This test shows that the dosage of AOD slag has little effect on the failure of the mixture.

3.2. Stress–Strain Curve

Figure 4 shows the stress–strain curves of the different dosages of AOD slag. As shown in the figure, the initial addition of AOD slag greatly improves the strength of the mixture. However, when more AOD slag is added, the strength of the mixture gradually decreases. Following peak strain, the mixture gradually becomes weaker when more AOD slag is added. The addition of AOD slag can effectively inhibit the development of microcracks and reduce the brittleness of the mixture. This is because a secondary hydration reaction between the AOD slag and fly ash occurs [39], and hydration products are generated to make the mixture more compact and improve its mechanical properties.

3.3. Feature Analysis

As shown in Figure 5, there is a quadratic function relationship between the strength of the mixture and the dosage of AOD slag. The correlation coefficient (r2) reaches 0.90; however, the strength of the mixture with AOD slag is increased by 94.9%. The mechanical properties of the mixture with AOD slag and fly ash are better than those of the single-doped mixture.
The functional relationship between the elastic modulus (E) calculated using JTG D50-2017 [40] and R was established, and the results are shown in Figure 6. There is a quadratic function relationship between the elastic modulus and the dosage, and the correlation coefficient r2 = 0.93. The variation in elastic modulus is the same as that of peak stress, which increases first, and then decreases. The maximum increase in the elastic modulus of AOD slag is 43.1%.

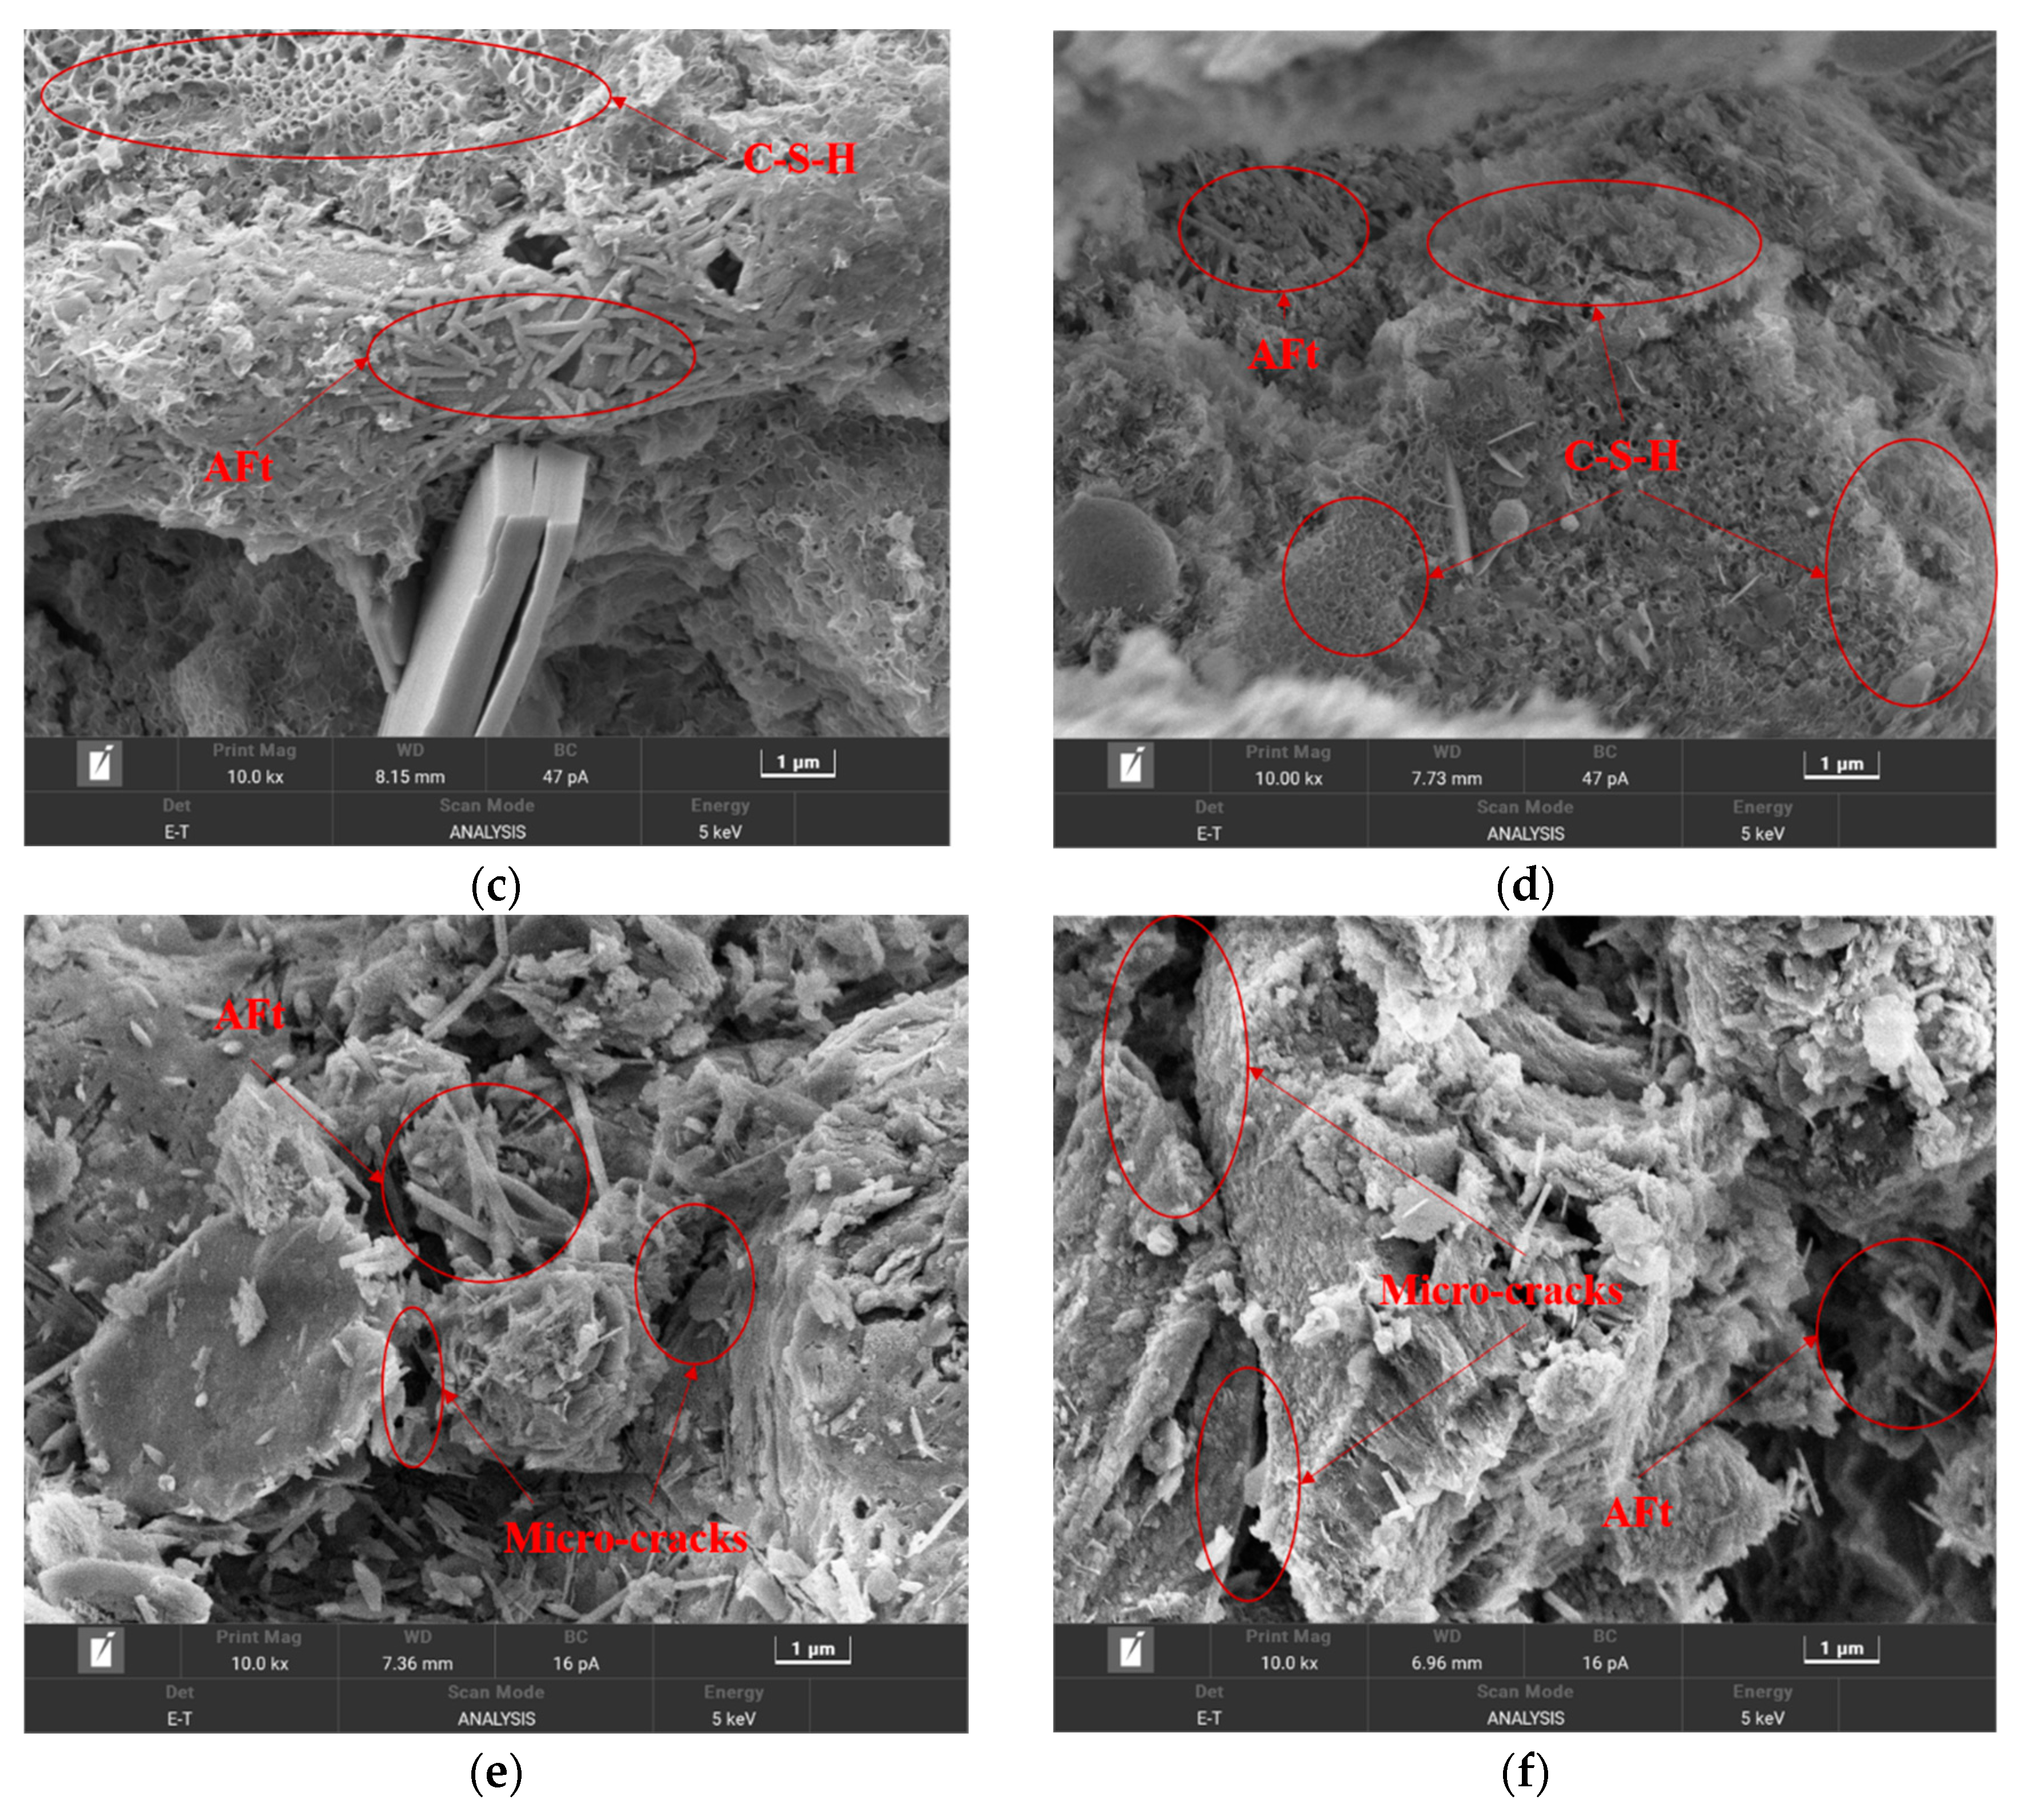
3.4. Microscopic Analysis

To further analyze the hydration products of AOD slag mixtures, X-ray diffraction (XRD) tests were conducted on the specimens aged 90 days (A-0, A-3, and A-12), with the outcomes presented in Figure 7. Comparing the silica (SiO2) dosage among the three groups revealed that the sample with R = 3% contained the least amount of SiO2, while exhibiting the highest strength. This confirms AOD slag provides an alkaline environment, facilitating a pozzolanic reaction between SiO2 and Ca(OH)2, leading to a reduction in SiO2 dosage and a corresponding increase in the quantities of hydration products, such as calcium hydroxide (CH), calcium silicate hydrate (C-S-H) gel, and ettringite (AFt). The highest SiO2 dosage observed at R = 0% primarily stems from the inherent chemical composition of fly ash. However, due to the lack of an alkaline environment provided by the AOD slag, there are relatively few hydration products. Conversely, at R = 12%, a similar scenario arises due to the deficiency of SiO2 typically supplied by fly ash. These experimental results illuminate precisely why AOD slag combined with fly ash is stronger than AOD slag or fly ash alone.
Building upon XRD analysis, Scanning Electron Microscopy (SEM) was employed for the microstructural analysis of the 90-day-old mixture specimens (A-0, A-3, and A-12), with the results illustrated in Figure 7. The comparative analysis of Figure 8a,b clearly shows that at R = 0%, fewer hydration products are present alongside incompletely hydrated spherical particles of C2S and C3S. Conversely, when R = 3%, flocculent C-S-H gel and needle-like AFt structures become more abundant. Deeper analysis integrating the XRD patterns reveals that as the hydration products from the pozzolanic reaction increase, the pores in the mixture are gradually filled by these products, densifying the structure. However, at R = 12%, with less fly ash, and consequently insufficient SiO2 to facilitate a pozzolanic reaction, there is a notable reduction in hydration products, leading to the reappearance of pores within the mixture. This negatively impacts the strength performance of the mixture, as depicted in Figure 8e,f.

4. Damage Constitutive Model

4.1. Deduction of Damage Constitutive Model

Lemaitre [41] proposed that the strain of nominal stress acting on damaged material is the same as the strain of effective stress acting on a non-damaged mixture during uniaxial compression. The expression is as follows:
σ = E ( 1 D ) ε
In this formula: ε denotes strain; σ represents effective stress; D stands for the damage variable; and E indicates the initial elastic modulus.
Given that the stress–strain curve of the AOD slag mixture under compression conforms to a Weibull distribution, it is inferred that the damage variable D also adheres to this distribution. Considering the inclusion of the damage threshold, a three-parameter Weibull distribution is adopted to describe the damage variable D, with the damage threshold designated as t. The equation is as follows:
D = 0 , x < t 1 exp [ ( ε t a ) b ] , x t
In this formula, a, b, and t are all non-negative numbers.
Substituting Equation (2) into Equation (1) yields
σ = E ε , x < t E ε exp [ ( ε t a ) b ] , x t
From the characteristics of the stress–strain curve, the following conditions can be derived: ① ε = 0, σ = 0; ② ε = 0, dσ/dε = E; ③ ε = εc, σ = σc; and ④ σ = σc; dσ/dε = 0. Among them, εc and σc correspond to the peak strain and stress values, respectively.
Differentiating Equation (3) leads us to
d σ d ε = E exp [ ( ε t a ) b ] [ 1 b ε ε t ( ε t a ) b ]
Due to E ≠ 0, exp [ ( ε t a ) b ] 0 ; then, [ 1 b ε ε t ( ε t a ) b ] = 0 can be used.
b ε ε t ( ε t a ) b = 1
By organizing this, it can be concluded that
a = ε c t ( ε c t b ε c ) 1 b
By substituting Equation (6) back into Equation (3) and incorporating Condition ③, we derive
b = ε c t ε c 1 ln ( E ε c σ c )

4.2. Model Parameter Analysis

In reference to the conventional range of damage threshold values for concrete, parameter t is typically 0.6 times higher than the peak stress value [42]. As illustrated in Figure 9, upon careful examination, we observe that, when parameter t is set to 0.7, it more accurately represents the stress–strain curve of the AOD slag mixtures, with the correlation coefficient approaching one more closely at this point. Consequently, we establish the damage threshold as 0.7 times more than the peak strength.
After determining parameter t, the physical meanings of parameters a and b are taken into consideration. Figure 10 illustrates the impact of altering parameters a and b on the stress–strain curves. Specifically, Figure 10a illustrates the value of parameter a when determining parameter b, elastic modulus E, and parameter t. As a increases, there is a conspicuous rise in both the peak stress and the corresponding peak strain. The ascending and descending slopes remain unchanged, suggesting that parameter a solely governs the peak stress and associated strain of the mixture, with a positive feedback relationship. Meanwhile, Figure 10b illustrates the value of parameter b when determining parameter a, elastic modulus E, and parameter t. As b increases, the peak stress and corresponding peak strain rise gradually, and the descending slope becomes notably steeper. Therefore, the size of control parameter b reflects the ductility or brittleness of the AOD slag mixture.

4.3. Model Establishment

To investigate the effect of the stainless steel slag dosage on the damage of the binder by utilizing Equation (3) in conjunction with the experimental stress–strain curves, the corresponding parameters were obtained through nonlinear regression using Matlab2022b. A detailed comparison of these calculated parameters with values derived from Equations (6) and (7) is presented in Table 3a. It is noteworthy that the small elastic modulus of the mixture resulted in variation coefficients exceeding one for parameters a and b, indicating a discrepancy between the calculated and fitted values. This incongruity suggests that the calculated parameters inadequately represent the experimental curves. Consequently, we decided to adopt the fitted parameters to accurately fit the experimental curves. Parameters E, a, b, and t were substituted into Equation (2) and compared with the experimental outcomes. The finalized constitutive model, which includes parameter t, is outlined in Table 3b.
Capitalizing on the fitted values from Table 3a, a quadratic function closely tied to R was derived. By observing the fitting result depicted in Figure 11, a clear correlation between parameters a and b with the dosage of AOD slag is evident, with the correlation coefficients surpassing 0.90 for both. Parameter a initially increases and then decreases with R, while an increase in R also leads to a gradual decline in parameter b. This pattern suggests that, as the dosage of AOD slag rises, the mixture’s becomes progressively less brittle. Table 3b shows the p-values of the parameters, from which we can conclude that parameters a and b have a significant impact on the equation.
It can be seen from Figure 12 that the derived constitutive model is similar to the test curve. Both the ascending and descending slopes fit the test curve, and r2 is above 0.85. This reflects the stress–strain relationship of the mixture. Because the mechanical properties of the mixture are mainly concentrated before peak stress, this damage constitutive model can better describe the mechanical properties of the AOD slag mixture.

4.4. Analysis of Changes in Damage Variables

Due to the existence of the threshold, the specimen does not initiate damage upon the onset of loading. Figure 13a illustrates that, prior to exceeding this threshold, the mixture remains undamaged. Once the force exerted on the mixture surpasses the threshold, damage accumulation commences, initially rising sharply and then gradually approaching unity, manifesting an “S” curve, with all the dosages adhering to this pattern. Figure 13b depicts the rate of increase in the damage variable.
When R = 0%, the rate of increase in the damage variable for the mixture escalates rapidly, and then promptly declines to zero after surpassing peak strain. Upon the introduction of AOD slag, more damage gradually occurs. At R = 6%, the rate of increase in the damage variable is the slowest. Beyond R = 6%, the rate begins to rise again. Compared with R = 0%, the peak damage growth rate decreased by 23.3%, 40.2%, 36.6%, and 15.2%, respectively, with an increase in AOD slag dosage. This suggests that adding an appropriate amount of AOD slag can inhibit the propagation of microcracks, thereby improving the internal structure of the mixture.
Through the damage variable, the destruction of the mixture can be segmented into three distinct phases:
  • Compaction Phase: In this initial phase, the mixture contains voids, preventing immediate damage upon the application of a load. During this loading period, no visible signs of distress are observed, and no microcracks form within the mixture. The material undergoes compaction as the voids are gradually eliminated under stress.
  • Crack Propagation Phase: As strain increases, cracks become visually apparent on the surface of the mixture, eventually extending vertically and penetrating throughout the entire body of the mixture. Corresponding to a decline in stress, aggregate particles on the surface begin to detach. This stage features the highest rate of increase in the damage variable, indicative of rapid crack development and material degradation.
  • Damage Phase: Even after the surface aggregates have detached, the mixture maintains some residual load-bearing capacity. Further loading leads to the gradual flattening of the stress–strain curve until the mixture ultimately fails. During this final stage, the rate of increase in the damage variable decelerates, gradually approaching and eventually reaching 1.0, signifying the completion of the damage process and the material’s total failure.

5. Conclusions

Based on the comparative analysis of the mixtures with varying dosages of AOD slag, in conjunction with the damage constitutive model established in this paper, the following conclusions are drawn:
  • Microscopic analysis shows that adding an appropriate amount of AOD slag to the mixture can cause hydration reactions and improve its mechanical properties.
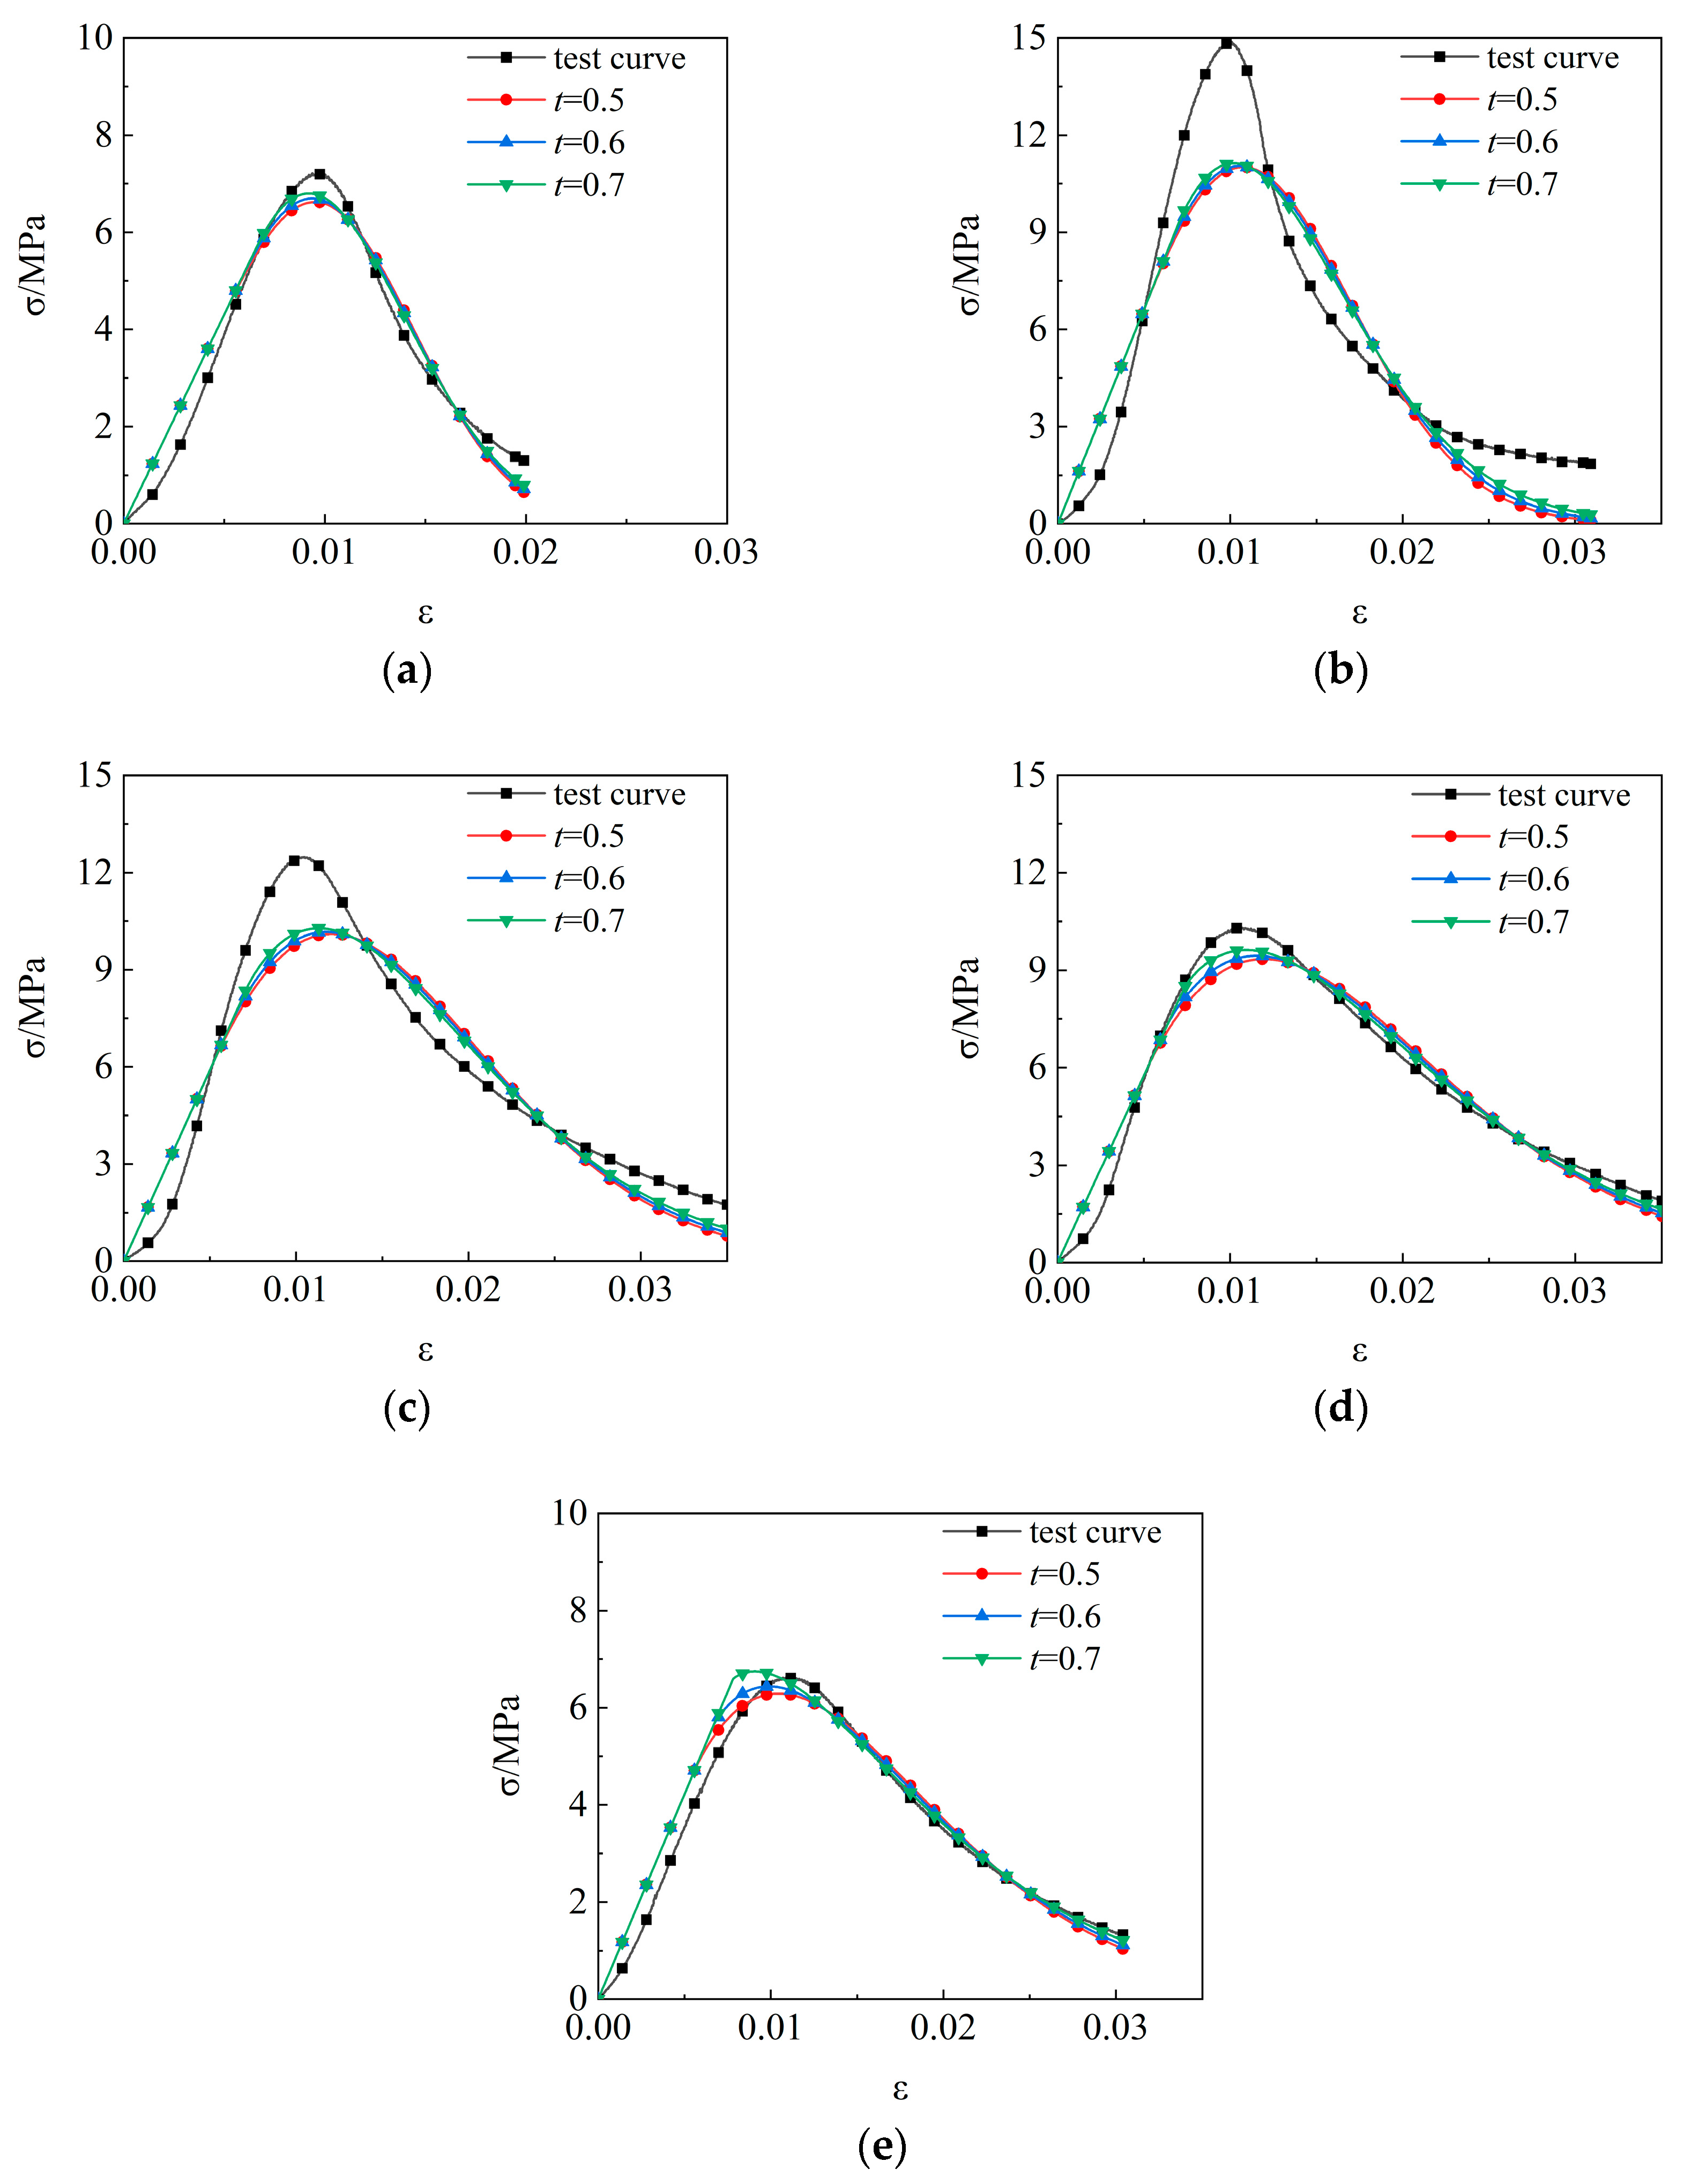
  • In this study, the damage constitutive model based on a three-parameter Weibull distribution and the Lemaitre strain equivalence principle could effectively describe the stress–strain relationship of the AOD slag mixtures under unconfined compression. The correlation coefficient is above 0.85.
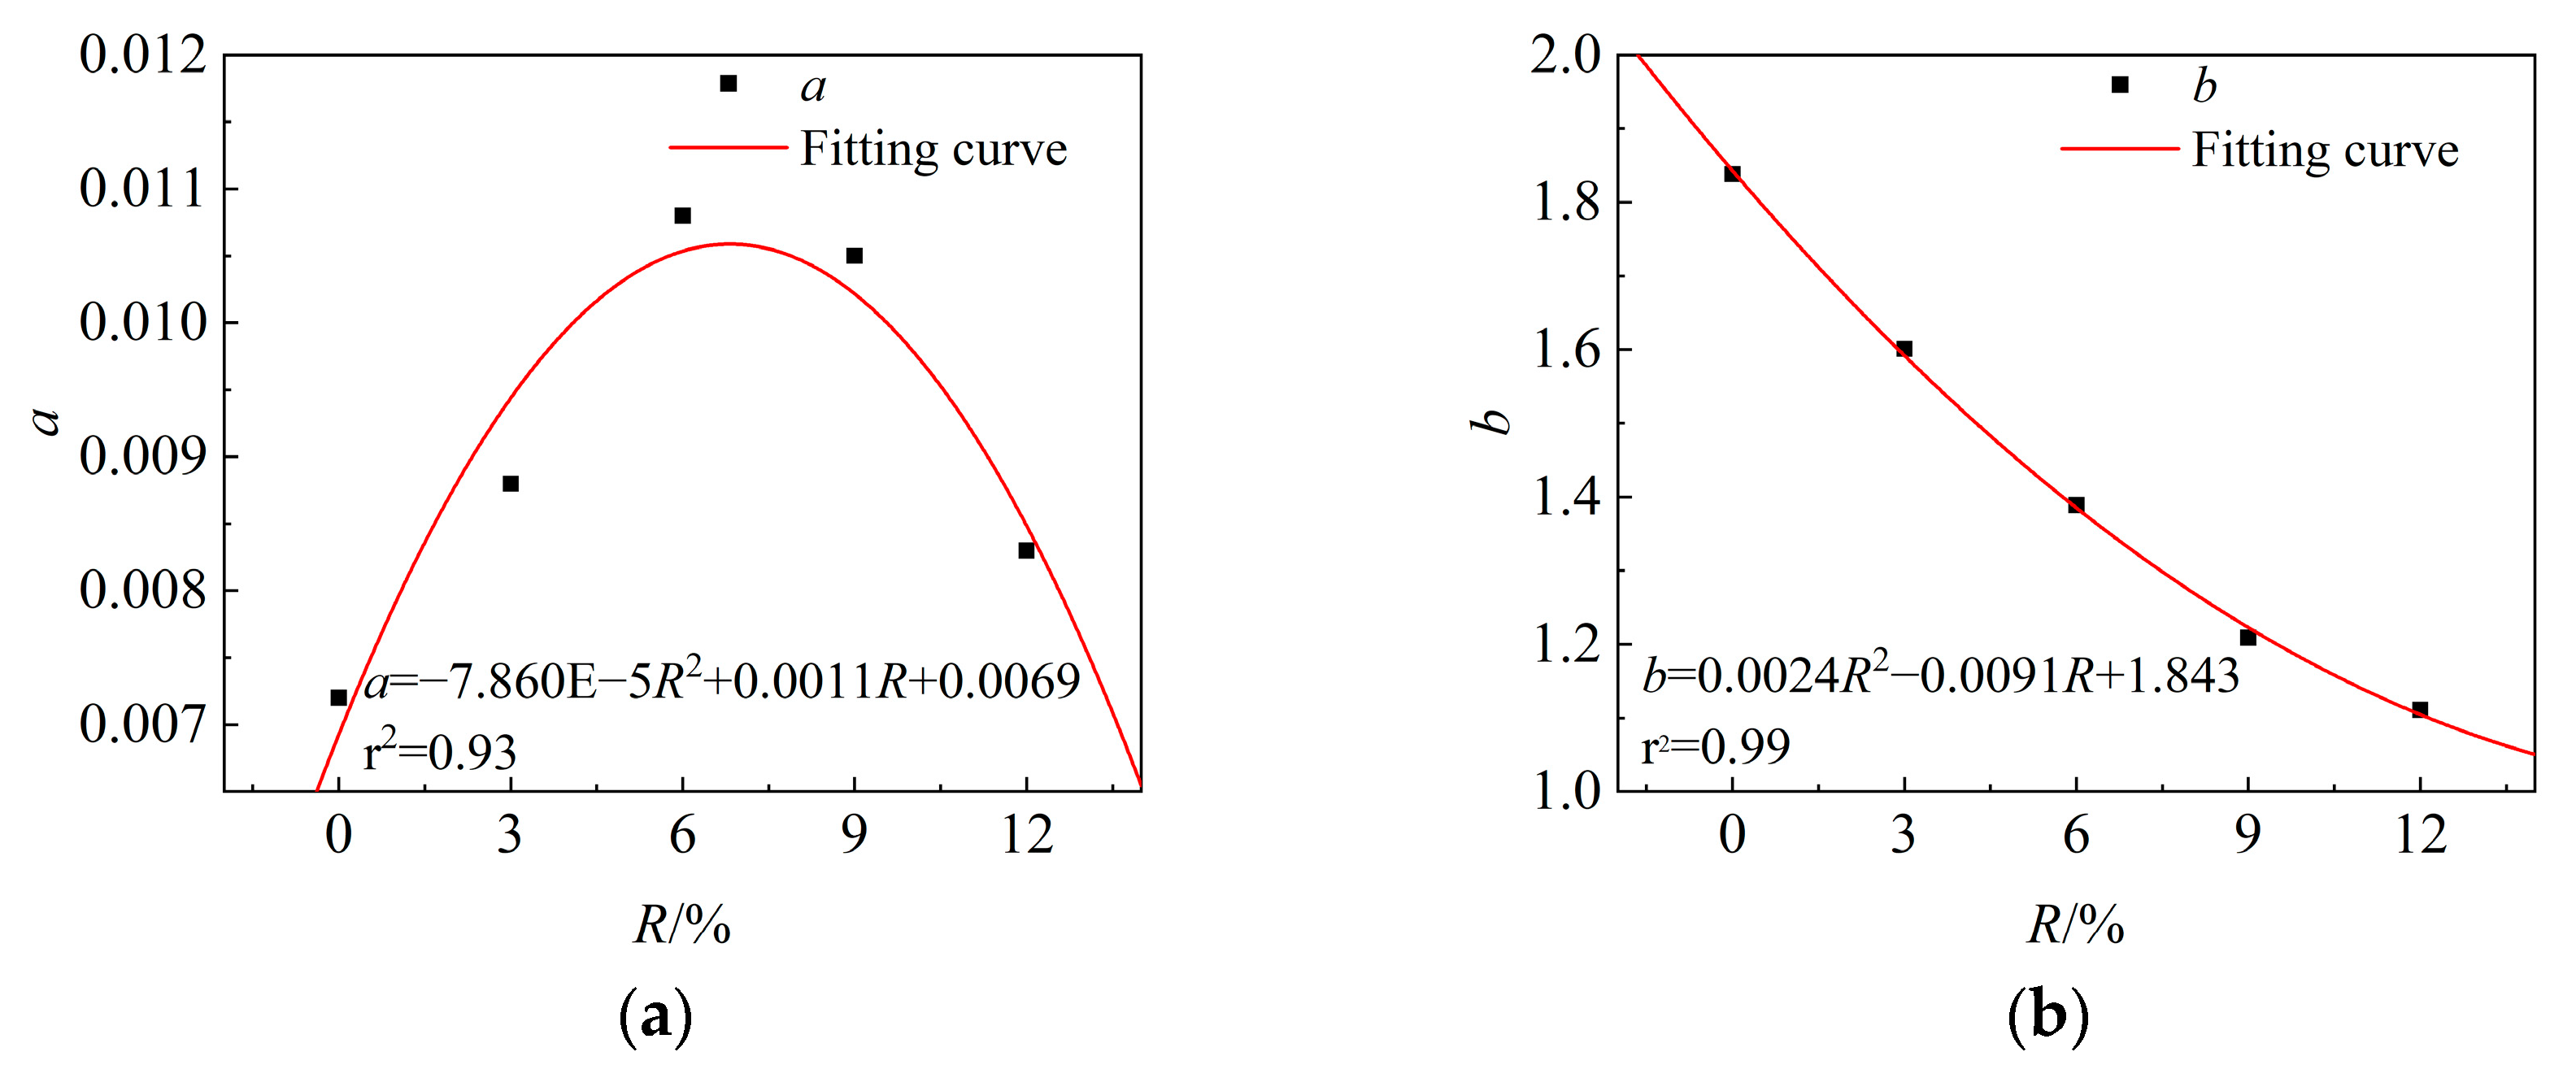
  • The parameters in the damage constitutive model have physical meanings, which reflect the mechanical properties of the mixture. Parameters a and b reflect the peak stress, strain, and brittleness of the mixture, respectively. Parameter t reflects strain at the beginning of cracking.
This research has achieved excellent results, but there are still the following shortcomings:
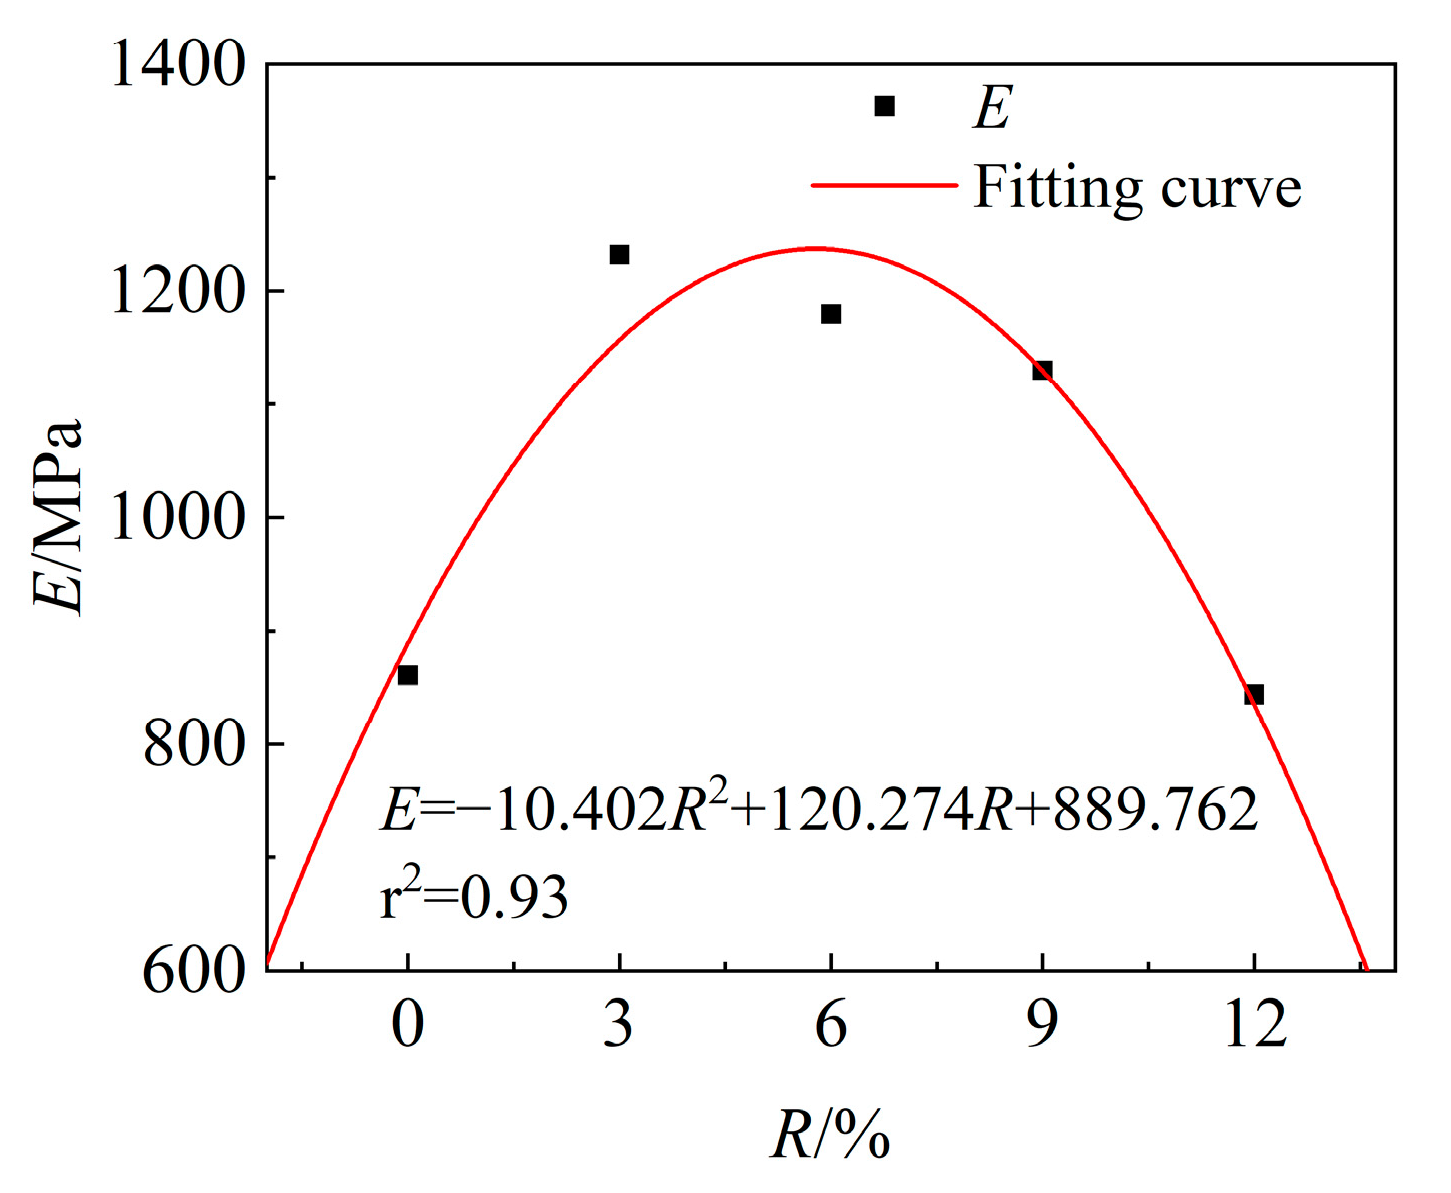
  • Because the increase in elastic modulus of AOD is less than the increase in strength, it is impossible to make a stronger mixture than A-3 and A-6. In the future, improving the constitutive model by adding new parameters can achieve better fitting.
  • Because of the difficulty of sample preparation, this paper only discusses AOD slag as an admixture. In the future, other mineral powders should be used as admixtures, and a damage constitutive model should be constructed for analysis.

Author Contributions

Conceptualization, L.H.; writing—original draft, Z.L. and L.H.; writing—review and editing, L.H., Z.L. and Y.C.; methodology, L.H., G.W. and Z.L.; data curation, Z.L., Y.C. and T.L.; supervision, L.H., Z.L. and G.W.; project administration, L.H. and Z.L.; funding acquisition, Y.C. All authors have read and agreed to the published version of the manuscript.

Funding

This research was funded by the National Natural Science Foundation of China (51908141) and the China Postdoctoral Science Foundation (2021M693854).

Institutional Review Board Statement

Not applicable.

Informed Consent Statement

Not applicable.

Data Availability Statement

The raw data supporting the conclusions of this article will be made available by the authors on request.

Conflicts of Interest

The authors declare no conflicts of interest.

References

  1. Zhang, Z.Z.; Pan, Z.S.; Che, D.; Yan, Q.; Wu, Q. Chromite ore resources characteristic and analysis of supply and demand situation from 2021 to 2035 in China. Geol. China 2023, 51, 1191–1209. [Google Scholar]
  2. Lan, S.W.; Zhang, Z.W.; Hong, O.W.; Wang, X.; Xu, H. Research Status of Comprehensive Utilization of Stainless Steel Slag. Metall. Eng. 2019, 6, 34–39. [Google Scholar]
  3. Li, X.M.; Li, W.F.; Wang, S.J.; Shi, L.G. Research status on comprehensive utilization of stainless steel slag. Hydrometall. China 2012, 31, 5–8. [Google Scholar]
  4. Zhang, H. Research on the current situation of urban construction waste treatment and resource utilisation. Green Environ. Prot. Build. Mater. 2021, 178, 31–32. [Google Scholar]
  5. Huang, F.; Zhu, W.W.; Yan, S.Y. Development and Analysis of Smelting Process of Stainless Steel. Heavy Cast. Forg. 2017, 178, 50–59. [Google Scholar]
  6. Rosales, J.; Cabrera, M.; Agrela, F. Effect of stainless steel slag waste as a replacement for cement in mortars. Mechanical and statistical study. Constr. Build. Mater. 2017, 142, 444–458. [Google Scholar] [CrossRef]
  7. Zhang, C.H.; Liao, J.L.; Qu, J.; Dang, Y.J. Treatment Process and Utilization Technology of Steel Slag in China and Abroad. J. Iron Steel Res. 2013, 25, 1–4. [Google Scholar] [CrossRef]
  8. Zhao, H.J.; Yu, Q.J.; Wei, J.X.; Li, J.X.; Gong, C.C. Influence on Composition and Morphology of Mineral of Steel Slag and Cementitious Property. J. Wuhan Univ. Technol. 2013, 25, 1–4. [Google Scholar]
  9. Dai, J.; Chen, P.; Zhao, Y.R.; Liu, R.J.; Wei, J.Z. Study on the coagulation properties of stainless steel AOD slag. Concrete 2019, 353, 94–96. [Google Scholar]
  10. Gupta, T.; Sachdeva, S.N. Laboratory investigation and modeling of concrete pavements containing AOD steel slag. Cem. Concr. Res. 2009, 44, 91–94. [Google Scholar] [CrossRef]
  11. Zhen, Y.P.; Zong, Y.B.; Cang, D.Q.; Chen, G.Y.; Ding, C.L. Study on Effects of Adding Fly Ash to Molten Steel Slag. Iron Steel 2009, 44, 91–94. [Google Scholar]
  12. Lin, Z.T.; Tao, H.Z.; Tu, C.H. Research for Increasing the Activation of Steel Slage and Fly Ash. J. Wuhan Univ. Technol. 2001, 23, 4–7. [Google Scholar]
  13. Huang, B.; Wang, X.; Kua, H.; Geng, Y.; Bleischwitz, R.; Ren, J. Construction and demolition waste management in China through the 3R principle. Resour. Conserv. Recycl. 2018, 21, 511–522. [Google Scholar] [CrossRef]
  14. Xiao, J.; Ma, H.F.; Wu, C.F.; Yang, M.; Zhang, J.S. Study on Performance of Construction and Demolition Waste Recycled Aggregate Base Mixture. J. Build. Mater. 2018, 21, 511–515+522. [Google Scholar]
  15. Hu, H.M.; Sun, Y.X. Experimental research on the design of the mix proportion of recycled cement-stabilized aggregates and the strength rule. J. Hefei Univ. Technol. (Nat. Sci.) 2009, 32, 238–240. [Google Scholar]
  16. Ehsan, Y.B.; Asmaa, A.T.; Mahd, D.F.; Sam, F.; Maurice, G.; Ernie, G. Cement and fly ash-treated recycled aggregate blends for backfilling trenches in trafficable areas. Transp. Geotech. 2023, 42, 101091. [Google Scholar]
  17. Ning, J.G. The developments of dynamice constitutive behavior of concrete. Adv. Mech. 2006, 36, 389–405. [Google Scholar]
  18. Jang, X.C.; Xie, H.P.; Zhou, H.W. Analysis of relationship between macro-scopic damage and mesoscopic damage variables for micro-crack damage of quasi-brittle materials under tension. Chin. J. Rock Mech. Eng. 2007, 26, 2648–2653. [Google Scholar]
  19. Feng, X.Q.; Yu, S.W. Mesoscopic Damage Mechanics of Quasi-Brittle Materials; China Higher Education Press: Beijing, China, 2002. [Google Scholar]
  20. Kai, C.; Roberto, C.; Andres, P. Assessment method for determining rock brittleness based on statistical damage constitutive relations. Geomech. Energy Environ. 2024, 37, 100517. [Google Scholar]
  21. Qin, F.F.; Cheng, J.X.; Sheng, D.F.; Chai, Z.Y.; Huo, X.W. A phenomenologically based dam age model for strain-softening fiber reinforced concrete. J. Build. Eng. 2023, 58, 105418. [Google Scholar]
  22. Fang, J.Y.; Yuan, Z.L.; Liang, J.Y.; Li, S.T.; Qin, Y. Research on compressive damage mechanism of concrete based on material heterogeneity. J. Build. Eng. 2023, 79, 107740. [Google Scholar] [CrossRef]
  23. Dinesh, K.S.; Sonalisa, R. Wavelet entropy-based damage characterization and material phase differentiation in concrete using acoustic emissions. Eng. Fail. Anal. 2024, 160, 108144. [Google Scholar]
  24. Ren, C.H.; Yu, J.; Liu, Z.Q.; Zhang, Z.Q.; Cai, Y.Y. Cyclic constitutive equations of rock with coupled damage induced by compaction and cracking. Int. J. Min. Sci. Technol. 2022, 32, 1153–1165. [Google Scholar] [CrossRef]
  25. Shen, P.W.; Tang, H.M.; Ning, Y.B.; Xia, D. A damage mechanics based on the constitutive model for strain-softening rocks. Eng. Fract. Mech. 2019, 216, 106521. [Google Scholar] [CrossRef]
  26. Dai, J.; Yang, Q.Q.; Zhang, M.; Jiang, H.X.; Wang, L.T. Constitutive Model of Granite Uniaxial Compression Damage under Microwave Irradiation. Sci. Technol. Eng. 2023, 23, 8350–8357. [Google Scholar]
  27. Ji, Y.C.; Wang, D.Y. Constitutive model of waste brick concrete based on Weibull strength theory. Case Stud. Constr. Mater. 2023, 18, e01738. [Google Scholar] [CrossRef]
  28. Huo, Y.; Qiu, J.S.; Feng, Z.P.; Yang, M.M.; Xiao, Q.H.; Guan, X. Acoustic emission characteristics of recycled brick-concrete aggregate concrete under freeze-thaw-load coupling action and damage constitutive model. J. Build. Eng. 2023, 79, 107930. [Google Scholar] [CrossRef]
  29. Wu, Q.Y.; Ma, Q.Y.; Zhang, J.S. Mechanical properties and damage constitutive model of concrete under low-temperature action. Constr. Build. Mater. 2022, 348, 128668. [Google Scholar] [CrossRef]
  30. Liu, Y.; Wang, Y.C.; Zhong, Z.B.; Li, Q.L.; Zuo, Q.L. Constitutive Model for Grouted Rock Mass by Macro-Meso Damage. Materials 2023, 16, 4859. [Google Scholar] [CrossRef]
  31. Han, Z.; Zhang, Y.S.; Qiao, H.X.; Feng, Q.; Xue, C.Z.; Shang, M.G. Study on axial compressive behavior and damage constitutive model of manufactured sand concrete based on fluidity optimization. Constr. Build. Mater. 2022, 345, 128176. [Google Scholar] [CrossRef]
  32. Li, B.; Chen, Z.K.; Wang, S.N.; Xu, L.H. A review on the damage behavior and constitutive model of fiber reinforced concrete at ambient temperature. Constr. Build. Mater. 2024, 412, 134919. [Google Scholar] [CrossRef]
  33. Kohout, J. Three-parameter Weibull distribution with upper limit applicable in reliability studies and materials testing. Microelectron. Reliab. 2022, 137, 114769. [Google Scholar] [CrossRef]
  34. Serkan, N. Three-parameter (3P) weibull distribution for characterization of strength of ceramics showing R-Curve behavior. Ceram. Int. 2021, 47, 2270–2279. [Google Scholar]
  35. Yu, S.W. Damage Mechanics; Tsinghua University Press: Beijing, China, 1997. [Google Scholar]
  36. GB.175-2020; Common Portland Cement. People’s Transport Publishing House: Beijing, China, 2020.
  37. JTG/T F20-2015; Technical Guidelines for Construction of Highway Roadbases. Ministry of Transport of the People’s Republic of China: Beijing, China, 2015.
  38. JTG E51-2009; Test Methods of Materials Stabilized with Inorganic Binders for Highway Engineering. Ministry of Transport of the People’s Republic of China: Beijing, China, 2009.
  39. Huang, L.Y.; Wei, G.G.; Lan, Z.Z.; Chen, Y.L.; Tun, L. Preparation and Mechanism Analysis of Stainless Steel AOD Slag Mixture Base Materials. Materials 2024, 17, 970. [Google Scholar] [CrossRef] [PubMed]
  40. JTG D50-2017; Design Specification for Asphalt Pavement of Highways. Ministry of People’s Transport Publishing House: Beijing, China, 2009.
  41. Lemaitre, J. How to use damage mechanics. Nucl. Eng. Des. 1984, 80, 233–245. [Google Scholar] [CrossRef]
  42. Xue, Y.L.; Li, Z.L.; Lin, F.; Xun, H.B. Study of damage constitutive model of SFRC considering effect of damage threshold. Rock Soil Mech. 2009, 30, 1987–1999. [Google Scholar]
Figure 1. XRD pattern of AOD.
Applsci 14 10006 g001
Figure 2. Grain size frequency and cumulative grain size distribution curves. (a) AOD. (b) Fly ash.
Applsci 14 10006 g002
Figure 3. The shapes of the specimens during the compression process. (a) Initial loading stage. (b) Crack germination stage. (c) Crack propagation stage. (d) After destruction.
Applsci 14 10006 g003
Figure 4. Stress–strain curve of AOD slag.
Applsci 14 10006 g004
Figure 5. Relationship between peak stress and dosage.
Applsci 14 10006 g005
Figure 6. Relationship between elastic modulus and dosage.
Applsci 14 10006 g006
Figure 7. XRD patterns of hydration products in mixtures at 90 days.
Applsci 14 10006 g007
Figure 8. SEM micro-morphology of AOD slag with different dosages. (a,b) A-0; (c,d) A-3; and (e,f) A-12.
Applsci 14 10006 g008aApplsci 14 10006 g008b
Figure 9. Comparison of test and model curves under different damage thresholds. (a) A-0; (b) A-3; (c) A-6; (d) A-9; and (e) A-12.
Applsci 14 10006 g009
Figure 10. Effect of parameters on damage constitutive model curves. (a) a; (b) b.
Applsci 14 10006 g010
Figure 11. Relationship between parameters and substitution rate. (a) a; (b) b.
Applsci 14 10006 g011
Figure 12. Test and model curves. (a) A-0; (b) A-3; (c) A-6; (d) A-9; and (e) A-12.
Applsci 14 10006 g012
Figure 13. Mixture damage variables. (a) Mixture damage variable curve; (b) damage growth rate.
Applsci 14 10006 g013
Table 1. Chemical composition of AOD slag.
CaO/(%)SiO2/(%)Fe2O3/(%)MgO/(%)TiO2/(%)Cr2O3/(%)MnO/(%)K2O/(%)SO3/(%)
47.3826.2013.805.293.392.311.220.180.11
Table 2. Optimum moisture dosage and maximum dry density of AOD slag mixtures.
Specimen Identification NumberInorganic Binder Blend RatioCement/(g)Fly Ash/(g)AOD Slag/(g)RA 1/(g)Optimum Moisture Dosage/(%)Maximum Dry Density/(g/cm3)
R = 0%1:4:0162.3649.20.04597.27.72.082
R = 3%1:3:1161.0483.0161.04562.08.72.066
R = 6%1:2:2160.0320.0320.04533.19.62.053
R = 9%1:1:3159.1159.1477.24506.610.22.041
R = 12%1:0:4158.20.0632.84482.310.92.030
1 RA: recycled aggregate.
Table 3. (a) Fitting and calculating values. (b) Damage constitutive model and correlation coefficients. (c) The p-value of the parameter.
(a)
Specimen Identification Numbera Fitted Valuea Calculated ValueRatiob Fitted Valueb Calculated ValueRatio
A-00.00720.06790.101.8382.6950.68
A-30.00880.05540.161.601−2.367−0.68
A-60.010817.29230.00061.389−40.601−0.03
A-90.01050.03110.341.2091.7050.71
A-120.00820.00581.431.1110.7171.55
Mean value
Coefficient of variation
0.41 0.45
1.28 1.69
(b)
Specimen Identification NumberDamage Constitutive Modeltr2RMSE 1
A-0 σ = 861 ε ε < 0.0066 861 ε exp ε 0.0066 0.0072 1.838 ε 0.0066 0.00660.9670.396
A-3 σ = 1232 ε ε < 0.0070 1232 ε exp ε 0.0070 0.0088 1.601 ε 0.0070 0.00700.8691.55
A-6 σ = 1180 ε ε < 0.0072 1180 ε exp ε 0.0072 0.0108 1.389 ε 0.0072 0.00720.9221.01
A-9 σ = 1130 ε ε < 0.0074 1130 ε exp ε 0.0074 0.0105 1.209 ε 0.0074 0.00740.9820.430
A-12 σ = 844 ε ε < 0.0078 844 ε exp ε 0.0078 0.0082 1.111 ε 0.0078 0.00780.9570.392
(c)
p-Value of ap-Value of b
A-07.1434 × 10−1535.8342 × 10−88
A-32.141 × 10−1621.0824 × 10−82
A-65.6294 × 10−2026.1464 × 10−130
A-95.0837 × 10−2821.6415 × 10−220
A-126.8385 × 10−2026.384 × 10−153
1 RMSE: Root mean squared error.
Disclaimer/Publisher’s Note: The statements, opinions and data contained in all publications are solely those of the individual author(s) and contributor(s) and not of MDPI and/or the editor(s). MDPI and/or the editor(s) disclaim responsibility for any injury to people or property resulting from any ideas, methods, instructions or products referred to in the content.

