Article

Probabilistic Analysis of Low-Emission Hydrogen Production from a Photovoltaic Carport

1
Department of Transportation and Informatics, WSEI University, 20-209 Lublin, Poland
2
Department of Power Engineering and Transportation, Faculty of Production Engineering, University of Life Sciences in Lublin, Głęboka 28, 20-612 Lublin, Poland
3
Department of Automation, Faculty of Mechanical Engineering, Lublin University of Technology, 20-618 Lublin, Poland
4
Mechanical Science Institute, Vilnius Gediminas Technical University-Vilnius Tech, Plytinės Str. 25, LT-10105 Vilnius, Lithuania
*
Authors to whom correspondence should be addressed.
Appl. Sci. 2024, 14(20), 9531; https://doi.org/10.3390/app14209531
Submission received: 31 August 2024 / Revised: 11 October 2024 / Accepted: 16 October 2024 / Published: 18 October 2024

Abstract

:
This article presents a 3D model of a yellow hydrogen generation system that uses the electricity produced by a photovoltaic carport. The 3D models of all key system components were collected, and their characteristics were described. Based on the design of the 3D model of the photovoltaic carport, the amount of energy produced monthly was determined. These quantities were then applied to determine the production of low-emission hydrogen. In order to increase the amount of low-emission hydrogen produced, the usage of a stationary energy storage facility was proposed. The Metalog family of probability distributions was adopted to develop a strategic model for low-emission hydrogen production. The hydrogen economy of a company that uses small amounts of hydrogen can be based on such a model. The 3D modeling and calculations show that it is possible to design a compact low-emission hydrogen generation system using rapid prototyping tools, including the photovoltaic carport with an electrolyzer placed in the container and an energy storage facility. This is an effective solution for the climate and energy transition of companies with low hydrogen demand. In the analytical part, the Metalog probability distribution family was employed to determine the amount of monthly energy produced by 6.3 kWp photovoltaic systems located in two European countries: Poland and Italy. Calculating the probability of producing specific amounts of hydrogen in two European countries is an answer to a frequently asked question: In which European countries will the production of low-emission hydrogen from photovoltaic systems be the most profitable? As a result of the calculations, for the analyzed year 2023 in Poland and Italy, specific answers were obtained regarding the probability of monthly energy generation and monthly hydrogen production. Many companies from Poland and Italy are taking part in the European competition to create hydrogen banks. Only those that offer low-emission hydrogen at the lowest prices will receive EU funding.

1. Introduction

Europe’s climate and energy transformation will require a considerable amount of cheap energy from renewable energy sources (RESs) and technologies in order to use it in numerous areas of life and in various branches of the economy [1]. The transport of people and goods is one of the largest sources of pollutant emissions into the atmosphere, primarily due to its scale [2,3]. Each of us uses public or private means of transport every day [4]. Goods are also transported over short and long distances using various means of transport: vehicles, ships and aircraft [5,6]. Powering these means of transport has so far been almost exclusively accomplished by using internal combustion engines and fossil fuels [7,8]. However, a revolution called electromobility has been present in the world for over a decade now. Currently, almost all automotive companies offer a full range or at least several models of electric vehicles powered by electricity from traction batteries on board [9]. These vehicles are characterized by good performance and a range of at least 500 km or even more on a single full charge [10]. In parallel with the development of electric vehicles and their increasing number in individual markets, the infrastructure needed to charge their batteries is still developing. Taking into account the requirements of the climate and energy transition, it would be best if the energy for charging electric vehicles came entirely from renewable energy sources. This would make it possible to completely avoid CO2 emissions and achieve climate neutrality by 2050 [11]. However, replacing vehicles with combustion engines with their electric counterparts is not easily achieved [12,13]. This process, which has already begun, will probably last for several decades [14]. A huge challenge in electromobility is generating very large amounts of energy from renewable energy sources that would meet the vehicles’ momentary energy demand. The power grid present in many European countries and around the world is not adapted to receive and emit such large amounts of energy and requires new techniques for balancing the energy contained in it. Scientific analyses and industrial practice lead to the conclusion that very large and low-cost methods of storing large amounts of energy are needed for both short (a few hours) and longer (a few days) periods of time. Stationary storage of very large amounts of energy is currently very expensive. However, despite this, energy storage facilities with energy capacities of over 10 MWh are already being built to support the local power grids. Their need results primarily from the cyclical and seasonal nature of electricity production by photovoltaic systems and wind farms. Scientists have found it economically justified and technologically possible to support energy storage in the form of hydrogen [15].
Currently, there are globally available technologies for the production of hydrogen and its use in various sectors of the economy, including transport [16,17]. Pure hydrogen produced by electrolytic methods can be safely stored, transported and, then, used to power various means of transport [18,19]. This is made possible by fuel cell technologies, which convert the chemical energy of hydrogen into electricity and heat [20] either in a stationary location or on board vehicles [21,22]. Many global vehicle manufacturers offer hydrogen vehicles using hydrogen in compressed or liquid form. As with electric vehicles, hydrogen vehicles also require infrastructure for their refueling [23]. In many European countries, such as Germany, Belgium, the Netherlands and Switzerland, there is fairly a large number of them. The first hydrogen vehicle refueling stations are also appearing in Italy and Poland [24]. The climate and energy transformation in the transport industry began with the public transport buses [25]. Due to the small number of kilometers traveled daily and the lack of dimensional restrictions for transporting large hydrogen tanks and heavy fuel cells, city buses were an excellent type of vehicle to convert to hydrogen [26]. At the same time, scientists and engineers in the automotive industry were working on the application of hydrogen technologies in commercial vehicles and passenger cars. Hydrogen as a fuel is also starting to power boats and ships, locomotives with many railway cars and airplanes. All of the above-mentioned means of transport require large amounts of hydrogen as fuel [27,28,29].
Scientific research conducted in the 21st century should have applications in industry and contribute to improving human life. The cooperation of science with business allows funds for research and development work as well as for the testing of the developed technologies in real conditions to be obtained. Cooperation with accredited research institutes at the level of individual countries enables the efficient approval of innovative products. It is necessary for the safe introduction of innovations to the common market of the European Union and the global market as well [30,31]. The dynamic development of hydrogen technologies is a natural place for start-ups and spin-off and spin-out companies [32,33]. Science and technology parks around the world support such initiatives and enable their efficient and dynamic development [34]. The climate and energy transition using hydrogen produced from renewable energy sources must take the form of user-friendly technologies that will gradually replace technologies using fossil fuels [35,36]. Individual countries will need different periods of time to achieve the required rates in replacing fossil energy sources with their green equivalents [37,38]. This will result from the prices and the availability of individual hydrogen technologies and the willingness to implement them [39,40,41]. Especially at the beginning of the transition, good examples of such activities and the dissemination of their results are needed [42,43,44]. In the era of ubiquitous social media, this seems to be effortless. However, it is not so in reality, and there are many challenges ahead of us that need to be overcome. Building a hydrogen ecosystem means building the entire economy from scratch [45]. This is due to the fact that it is often easier to build an innovative, pre-ecological production company than to carry out an unjustified cost for the transformation of an old company [46]. During the hydrogen revolution, completely new players may appear on the global market, just as was the case with the emergence of new automotive companies such as Tesla during the electromobility revolution. The key role in this revolution will not only be played by the producers of individual hydrogen technologies (electrolyzers, tanks, fuel cells, etc.), but specifically by the technology integrators [47]. To be a manufacturer of buses powered by hydrogen fuel cells, we do not have to be a manufacturer of any critical component. The situation is similar to the construction of hydrogen refueling infrastructure for transport purposes. Hydrogen systems are complex mechatronic systems that require the selection of key components and their approval testing, integration and effective control [48,49].
Articles address the problem of distributed hydrogen production for transport purposes [50,51]. They propose that photovoltaic carports are used to produce electricity needed for hydrogen production. These articles demonstrate that the amounts of energy produced by carports are sufficient to produce the hydrogen needed to travel even several hundred kilometers per day. An article presents the characteristics of individual components needed to produce hydrogen with the energy from a carport. The characteristics of the construction of the carport itself, the photovoltaic system with energy storage and electrolyzers are provided [52].
There are many advantages to building carports for electric and hydrogen vehicles [53]. Photovoltaic carports provide shade for the vehicles parked under them [54], which increases the comfort of people entering the car after several hours of it being parked, especially on very hot days [55]. In addition, electric and hydrogen vehicles parked under a carport do not have to use electricity or hydrogen to cool the interior of the car to a temperature suitable for driving. An obvious advantage of carports is the possibility of precisely setting them with an azimuth to the south or north (depending on the location in the northern or southern hemisphere) and avoiding shading [56]. The owner can also influence the exact location of the carport on their property by avoiding shadows from the buildings or trees. The carport designer can also choose the optimal tilt of the photovoltaic panels on the roof of the carport. The panels placed on a carport are located a few meters above the ground and are, therefore, better cooled than the panels placed on roofs or on the ground. The appearance of a photovoltaic carport with a vehicle during charging is shown in Figure 1.
The 3 kWp peak power carport designed and built by the authors in 2016 produces over 3 MWh of electricity annually. The data from their work constitute the teaching material for classes with students and for the publication of scientific articles [57].
The text of this article repeatedly emphasizes how to multiply the amount of energy produced and the amount of hydrogen produced. For the 3D modeling process itself, as well as for the calculations in the strategic model, components that could be easily combined and scaled for the amount of hydrogen produced were selected each time. The 3D modeling of a system for producing hydrogen from a photovoltaic carport in a quick way is presented in this article. It allows the estimation of the amount of land or space needed to carry out such an investment. Placing photovoltaic panels on a carport will save parking space for a hydrogen vehicle and also take advantage of many other benefits offered by carports. Placing hydrogen electrolyzers and energy storage in a compact container is a good practice in the construction of such systems [58].
The aim of this article is to determine the levels of monthly energy production by photovoltaic systems placed on a carport structure with accuracy in relation to the probability distribution in order to use it to produce low-emission hydrogen for transport purposes. For this purpose, 3D modeling and the Building Information Modeling (BIM) approach were used to determine the size and peak power of the carport. Then, the amount of energy produced and the probability of generating individual monthly energy levels and low-emission hydrogen production levels for systems located in Poland and Italy were compared. This article uses an approach not previously seen in the literature, combining known rapid prototyping techniques using 3D modeling in combination with the BIM approach and data processing using artificial intelligence (AI) algorithms. The specific peak power of the carport was assigned to the amounts of monthly energy production for carport locations in two European countries: Poland and Italy. Measurement data from real energy generation systems were processed using Genie software, containing the Metalog family of probability distributions.

2. Materials and Methods

In the field of architectural sciences, an approach called Building Information Modeling (BIM) has been observed in recent years. This article uses some BIM elements that combine the external design of a given component with technical parameters and quantitative data describing its properties. It means that each element of the low-emission hydrogen generation system [59,60] supplied with energy from the carport will have its physical representation in the form of a 3D model [61]. All components of the energy generation and hydrogen production system will allow for visualization of the entire system using rendering techniques. At the same time, scientists are engaged in acquiring and processing measurement data, which is necessary for the quantitative assessment of the generated power and energy produced by carports and the produced amounts of hydrogen. Figure 2 presents an example of the appearance of a hydrogen production system for transport purposes using the energy produced by the carport.
The Metalog family of probability distributions was used for quantitative calculations related to carport energy generation and low-emission hydrogen production [62,63]. The creators of Metalog have already used this complex family of probability distributions in numerous areas of life and in many branches of the economy, demonstrating its universality and usefulness [64]. The method of using the Metalog probability distribution family, as well as its application in the Genie software [65], will be described later in this article using specific examples.
The subsequent steps in the research implementation are shown in Figure 3.

3. Components of the Low-Emission Hydrogen Generation System

This section will present both the 3D models and the characteristics of the selected technologies currently available on the market that can be applied to produce green hydrogen [66,67] for transport purposes using the energy generated by the carports. Currently, there are technologies available on the market in the area of production, storage, transport and use of hydrogen in the automotive industry, which is confirmed by the information contained in the review article [68].

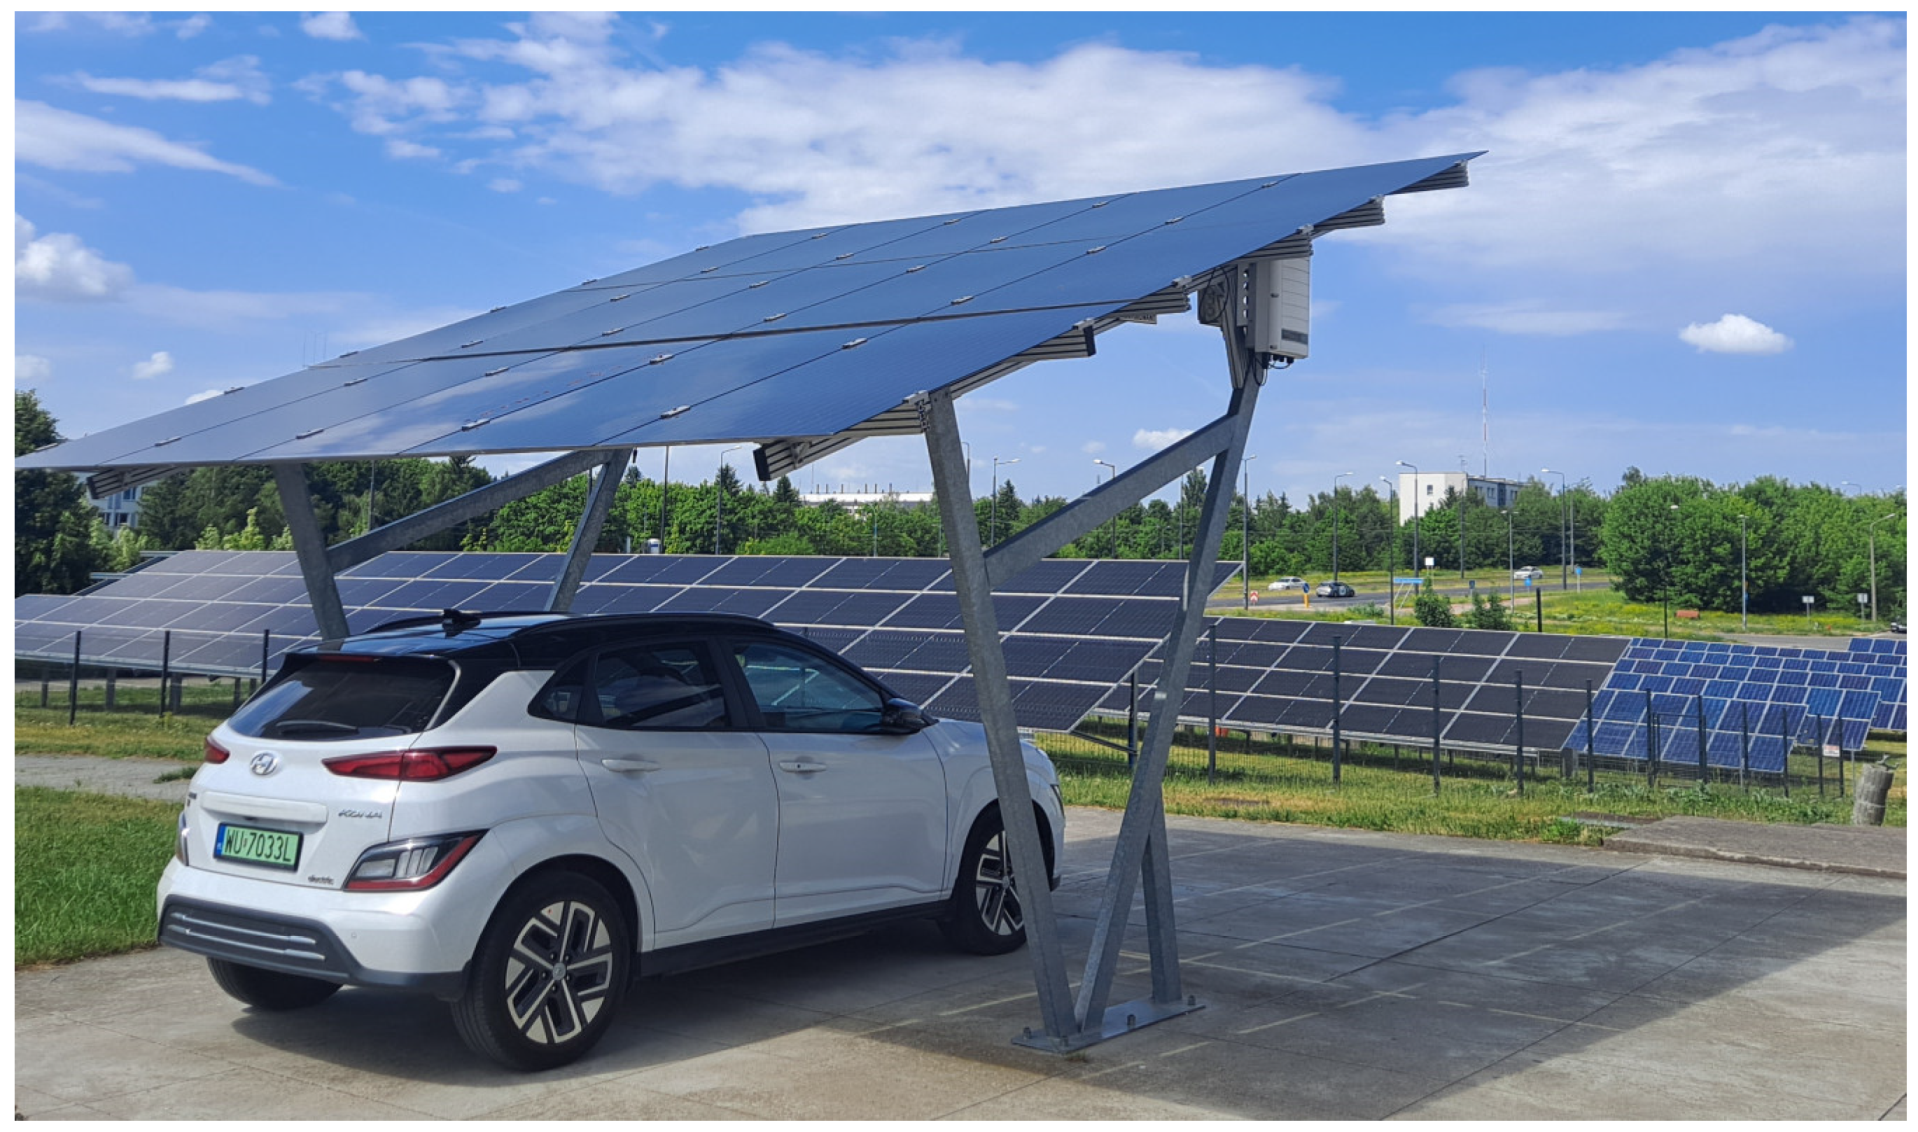
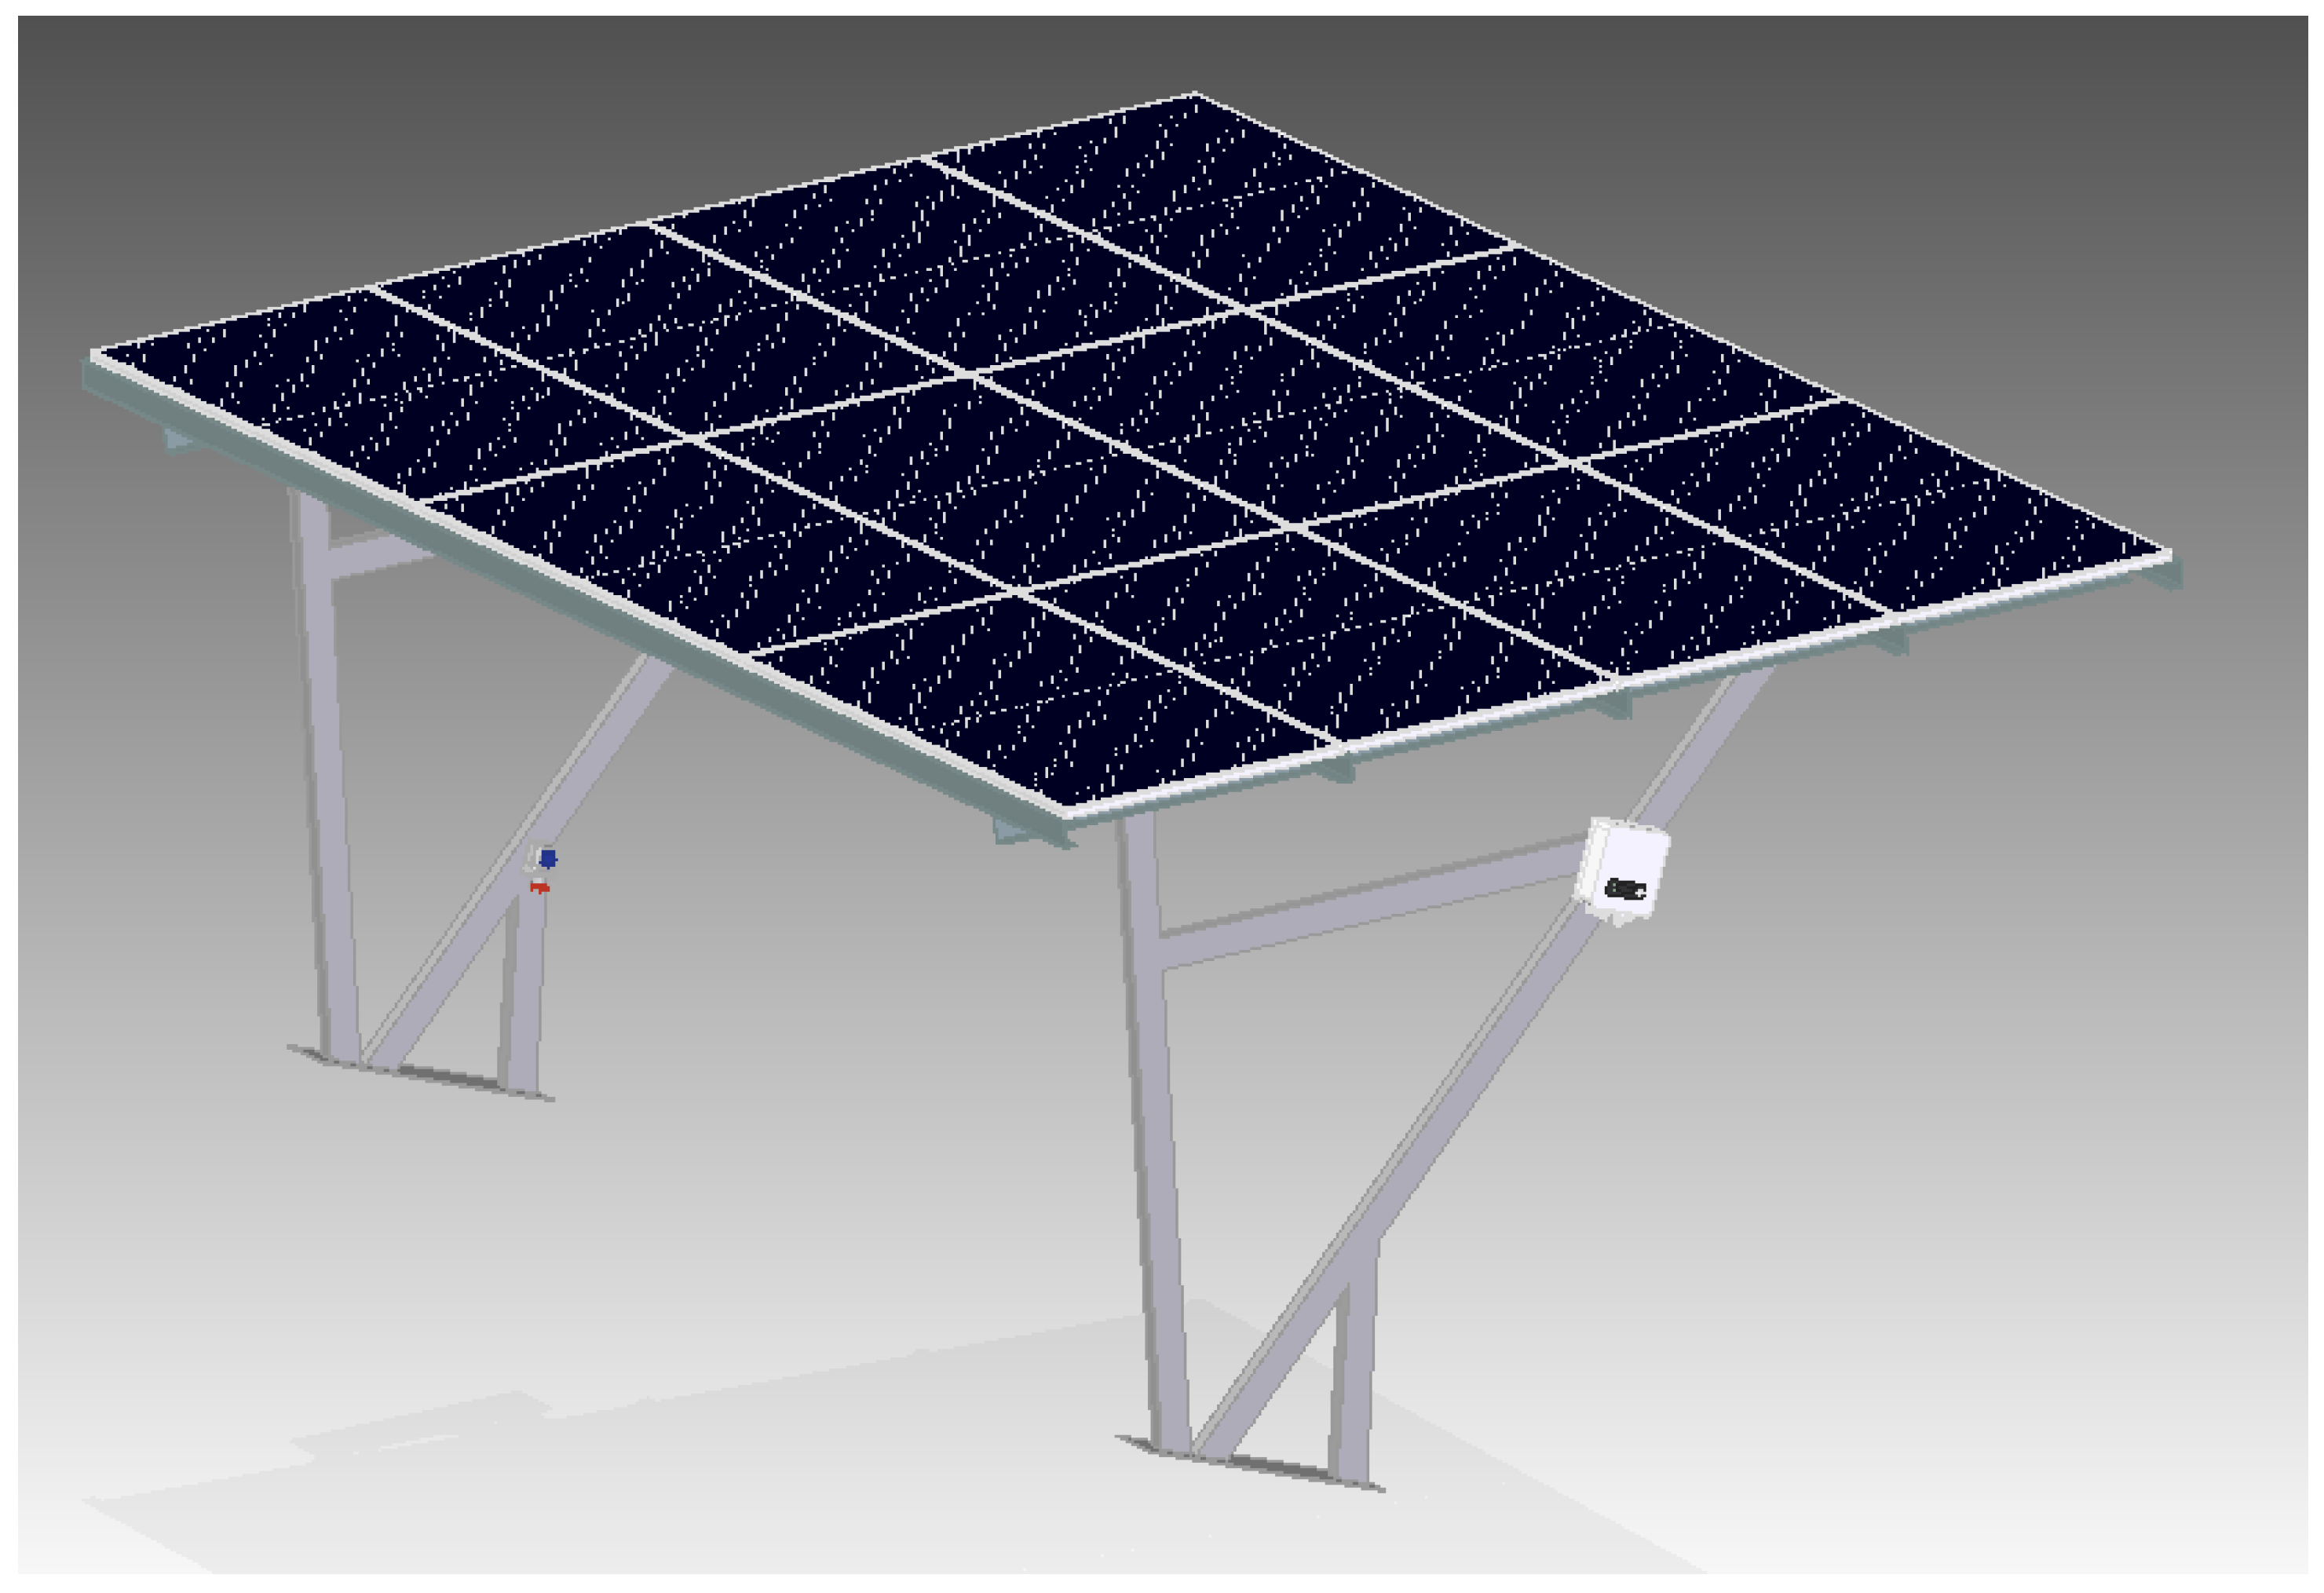
3.1. Photovoltaic Carport with Hybrid Inverter

In 2024, the latest monocrystalline bifacial panels were proposed to be employed for the construction of a photovoltaic carport [69]. Bifacial cells, which can capture light from both front and back, have higher energy production and efficiency rates than single-sided cells. The active layer is on both sides, which allows the panels to absorb not only the light that falls on them, but also the reflected light that reaches them from the back [70]. When the panels were placed in the standard way, i.e., at an angle of 35° and with the front side of the module facing south, rather good results were obtained. It is not only extremely effective, but also certainly profitable to position the solar modules at this angle. In this position, the back side can produce up to 25% of the total energy. The height at which the panels are placed is also important. According to the tests conducted, the amount of electricity produced by bifacial photovoltaic panels increases significantly depending on the height of the panels from the ground. Mounting them higher in the frame results in greater electricity production. Therefore, they are ideal for installation on photovoltaic carports. Hence, a horizontal arrangement of three panels in four rows was proposed. The approximate width of the carport will be 2274 mm × 3 = 6822 mm, and the height will be 1134 mm × 4 = 4536 mm. The peak power of twelve panels will be 530 Wp × 12 = 6360 Wp. The 3D model of a 6.36 kWp photovoltaic carport is presented in Figure 4.
The active surface of the carport will have the dimensions of approximately 6.8 m × 4.5 m. With a spacing of the carport’s legs of 6 m, it will be possible to park two compact-class vehicles under it. The proposed carport will be able to generate over 6 MWh of electricity per year in Polish climatic and geographical conditions [71]. The carport should be equipped with a hybrid inverter capable of charging the stationary energy storage.
In the time of the Internet of Things devices, it is important for the photovoltaic system to have a well-functioning cloud platform for continuous monitoring and effective diagnostics of the entire system [72]. Such a platform should have functions for easy access to the measurement data, and it should allow the data to be saved in standard data exchange formats [73].

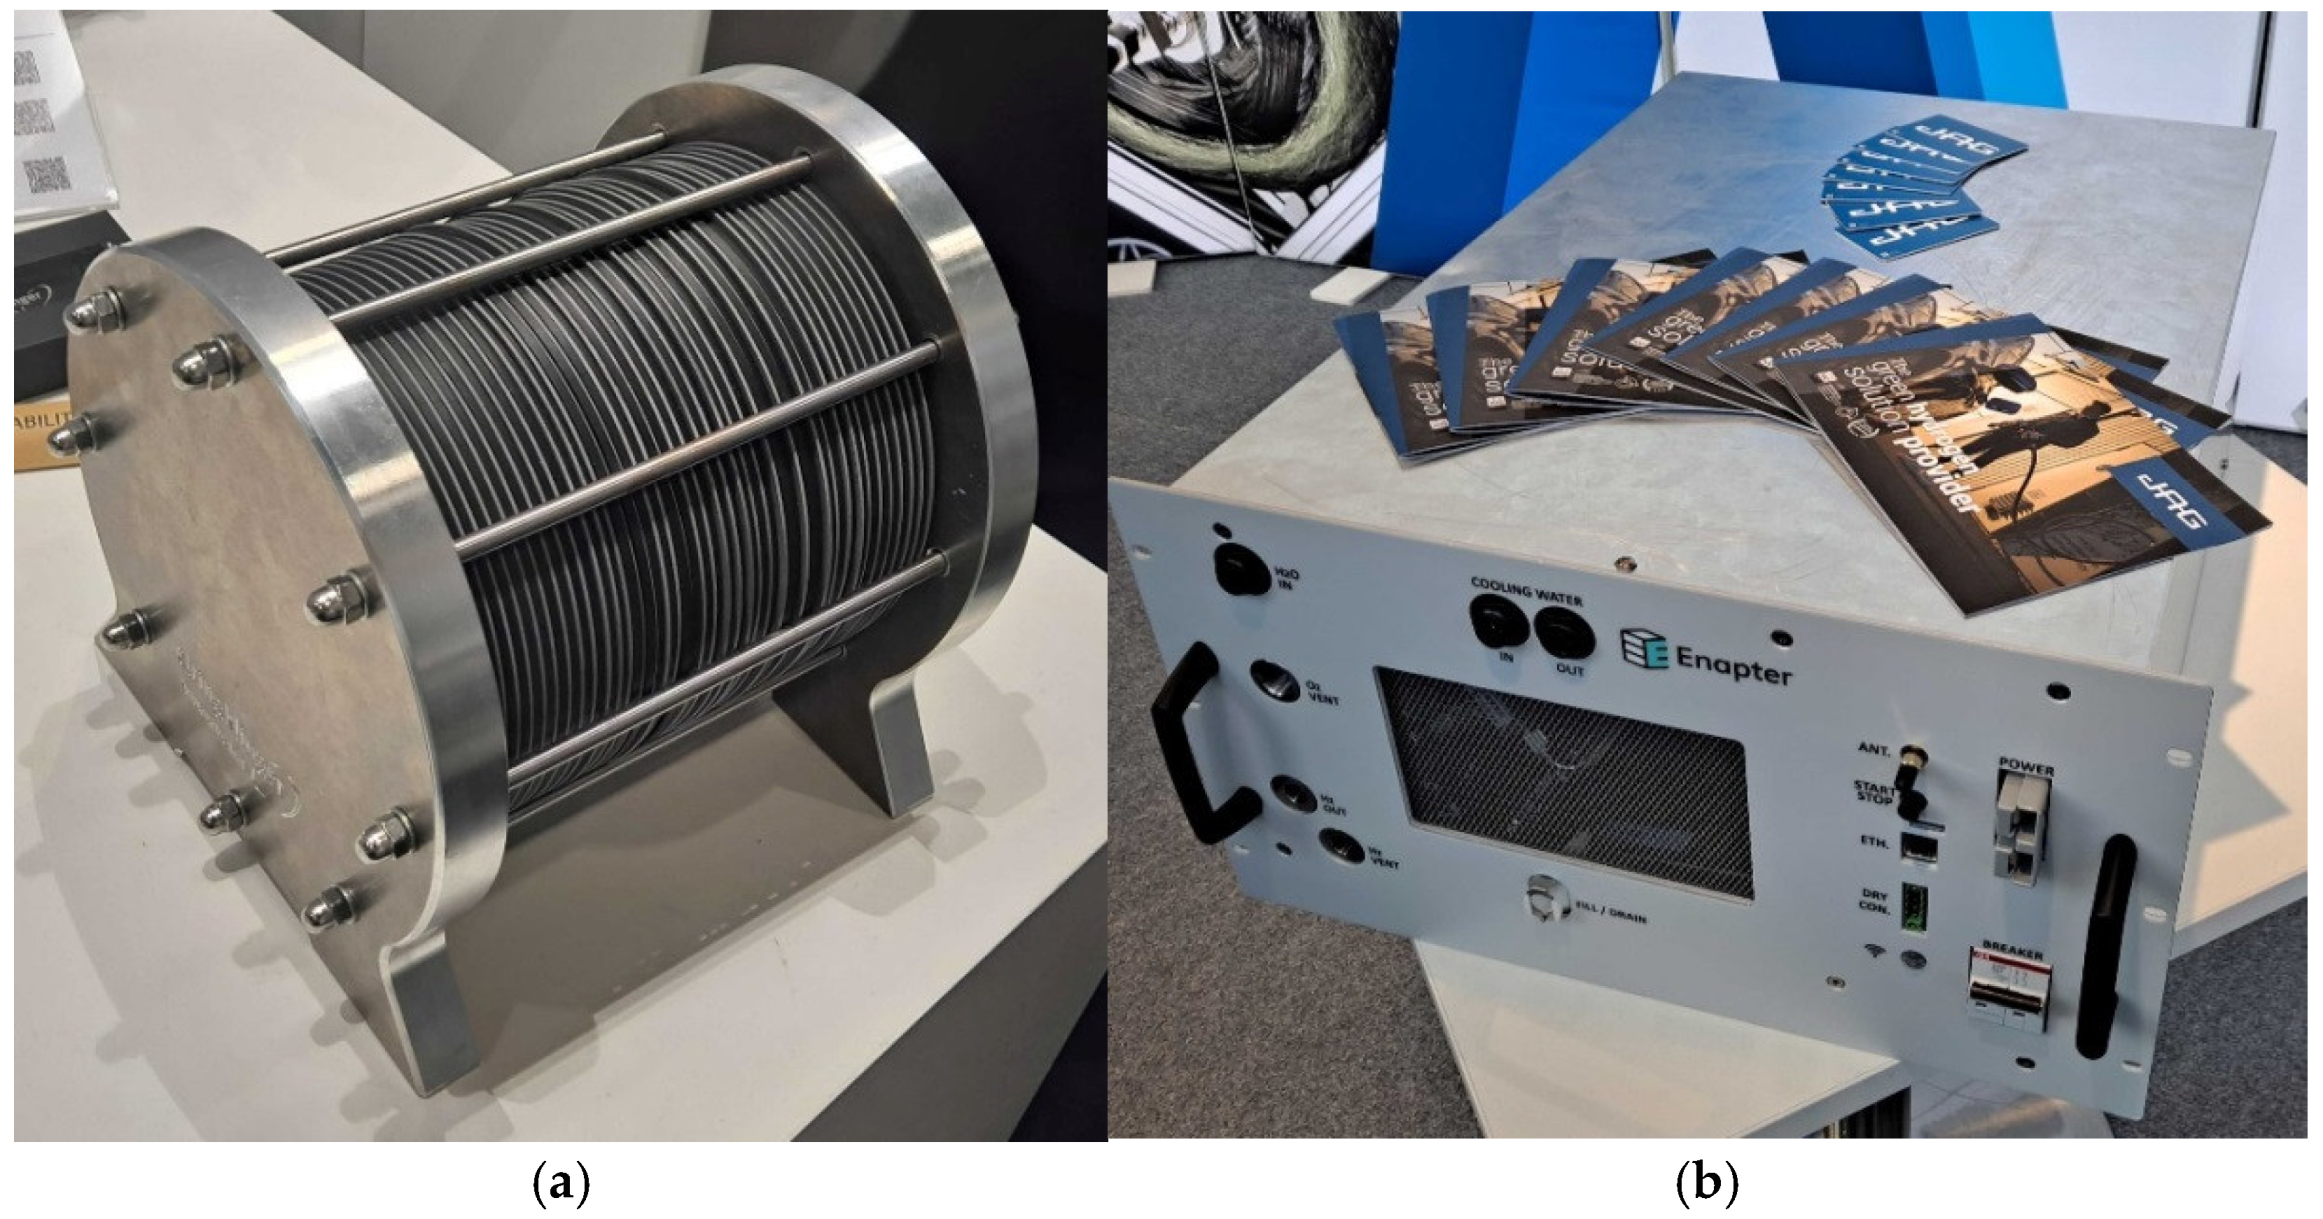
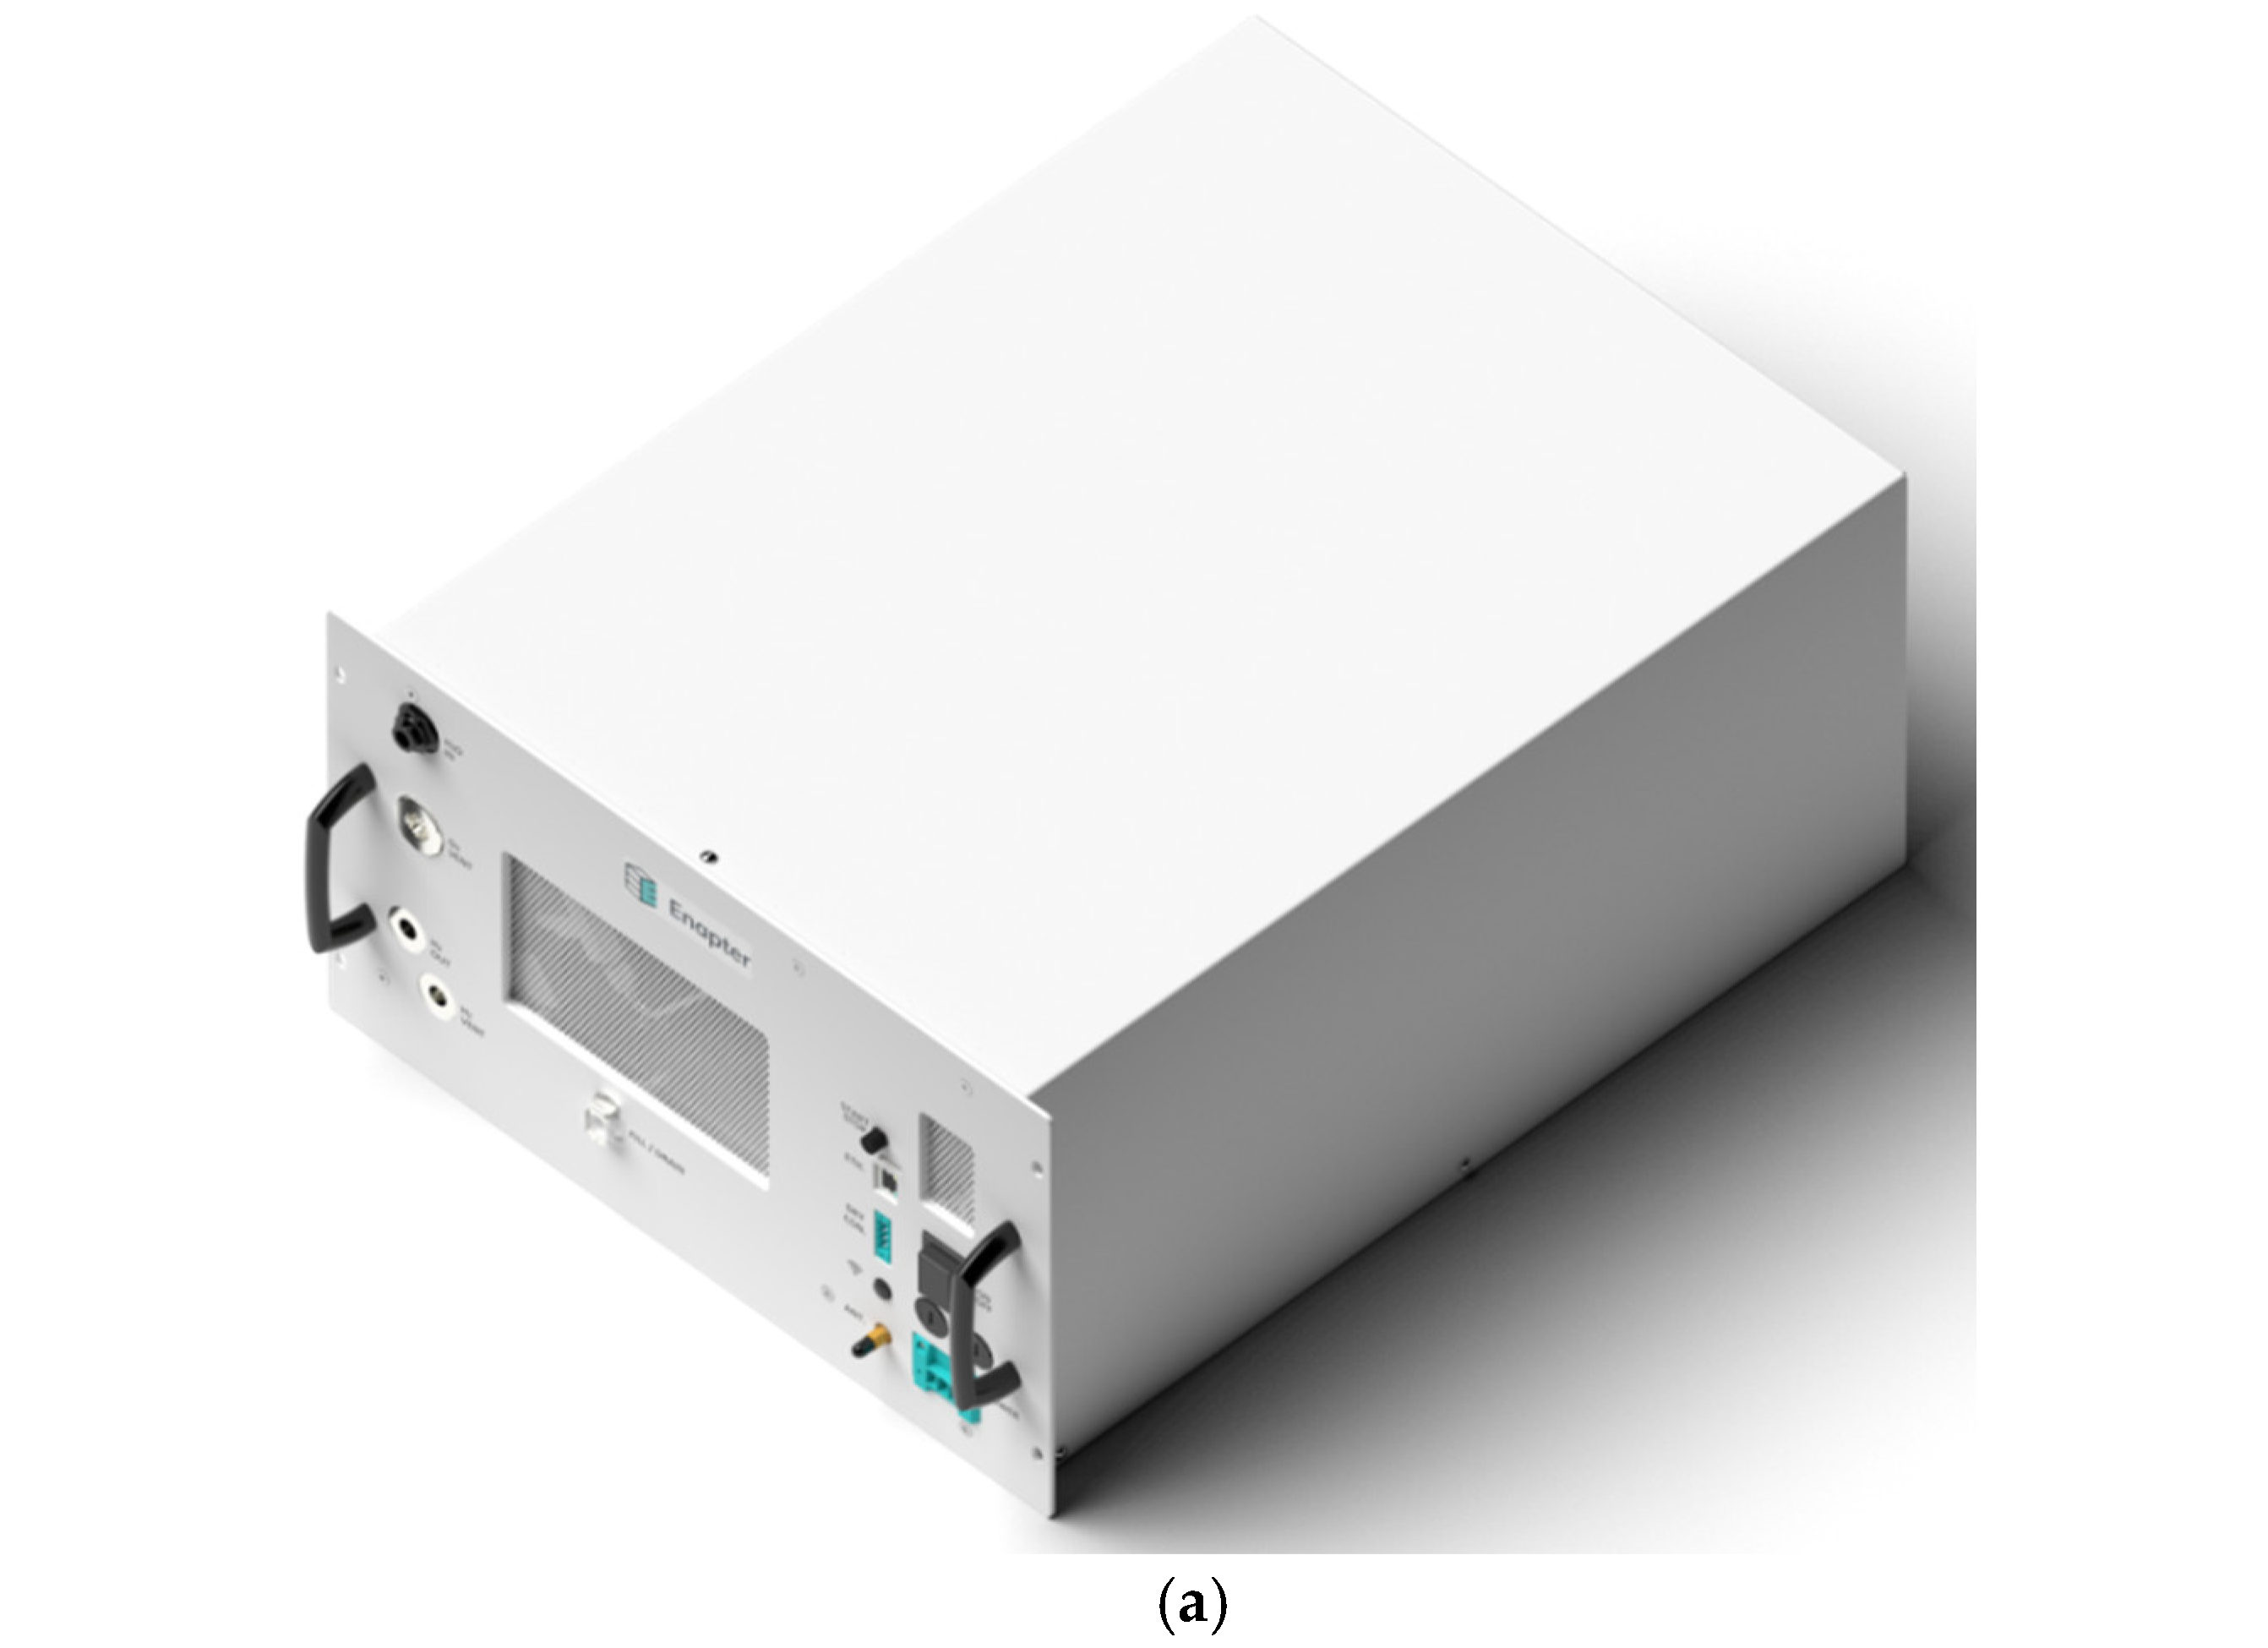
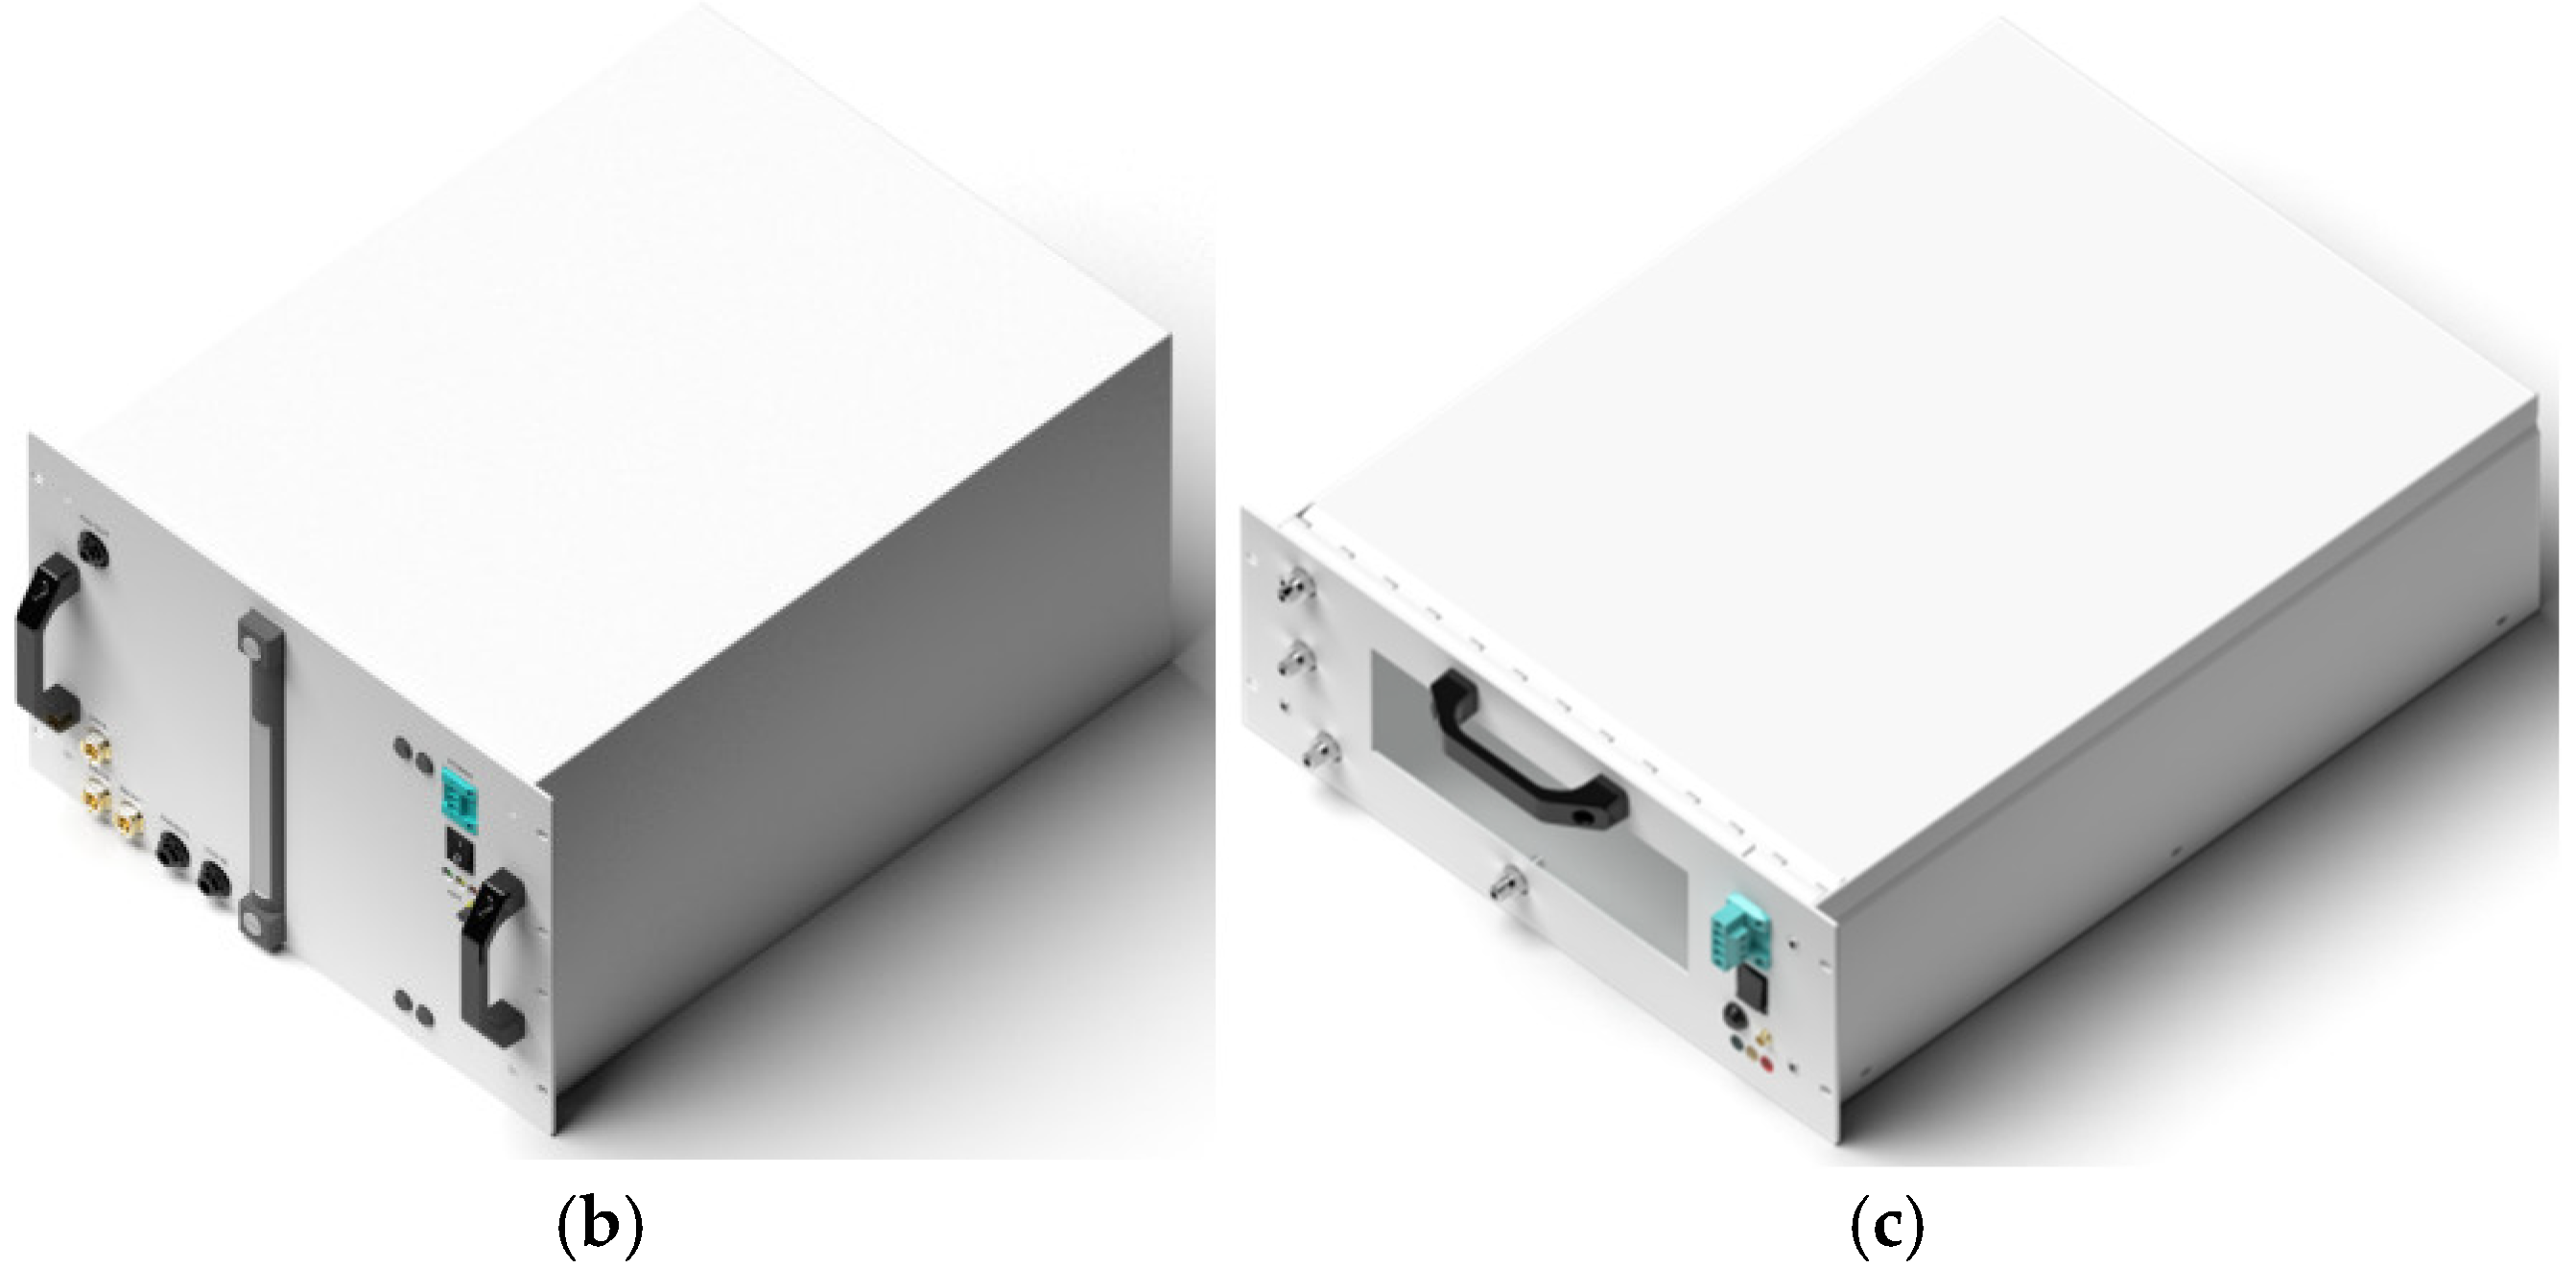
3.2. Hydrogen Electrolyzer

Many European and global companies are developing and marketing products for the production, storage and use of hydrogen in various industries and transport, as could be seen at the Hydrogen Technology Expo in Bremen in 2023. Exhibitors of electrolyzers of various types used to produce hydrogen presented their products at the fair. These were European, American and Chinese companies, although the latter’s participation in the fair was not very extensive. The latest electrolyzers are offered in PEM [74,75], alkaline [76] and the latest AEM [77] technology. The appearance of an electrolyzer stack itself and a stack built in a compact housing are shown in Figure 5a and 5b, respectively.
For engineering, educational and scientific purposes, it is crucial that some electrolyzer manufacturers offer ready-made 3D models of the electrolyzers themselves, the water preparation station, the hydrogen drying station and even the rack cabinet in which these elements can be installed. The 3D models of individual components of the hydrogen generation system prepared in the rendered version appear like the photos of the real objects (Figure 6). This approach, called rapid prototyping, greatly shortens the design time of a hydrogen generation system [78].
The choice of an electrolyzer for a hydrogen generation system powered by a photovoltaic carport is not accidental. Water electrolyzers for hydrogen production are manufactured employing various technologies. The ones that are most important include alkaline electrolyzers, with a PEM membrane [80], an AEM membrane [81] and high-temperature SOE [82]. AEM electrolyzers are characterized by the greatest flexibility in terms of load variability.
The lifecycle of the presented AEM electrolyzer stack, as with all electrochemical devices, is reduced in the event of frequent starts/stops. As the field experience and the operational data increase, the manufacturer recommends its customers limit the electrolyzer operating cycles to a maximum of five on/off cycles per day and one on/off cycle per hour. This helps to ensure the durability of the electrolyzer. The electrolyzer works most effectively and is most durable when used continuously [83]. However, the modular design of the presented electrolyzers and the energy management system is perfectly suited to adapt to changing renewable energy supplies or changing demand. Individual electrolyzers can be charged from 60 to 100%, and the combination of multiple electrolyzers allows for any required flow rate of produced hydrogen [84]. If the hydrogen demand is sporadic throughout the day, adding an appropriately sized buffer tank can minimize the electrolyzer on and off cycles. It was decided to place the rack cabinet with electrolyzers and the energy storage in a container, as shown in Figure 7. Solid Edge version 2024 was used for modeling. To accommodate the rack cabinet with the hydrogen generation system and a small energy storage with a capacity of 10 ÷ 15 kWh, a 10-foot ISO shipping container was used.

3.3. Energy Storage

Generating electricity from renewable energy sources is not only a global trend but also an important element of the decarbonization of entire countries [85]. The percentage of energy from the photovoltaic systems supplied for the system owner’s self-consumption and to the power grid increases significantly every year. However, photovoltaic systems are characterized by periodicity (due to day and night periods) and seasonality (due to the changing seasons) in energy production [86]. The electricity demand profile of individual and institutional customers may differ significantly from the energy production profile of photovoltaic systems. The power distribution network is usually used to balance such differences; however, its possibilities in this area are sometimes limited. The use of energy storage can be helpful in this regard [87]. Energy storage is an important component in the energy supply system of residential and institutional buildings [88]. It is able to store significant amounts of energy, which constitute excess production in relation to the momentary demand for power and its release at any programmed time.
Due to the storage of electricity in the energy storage facilities in the form of direct current, these facilities can be charged directly with the direct current generated by the photovoltaic system. The combination of a DC/DC converter and a DC/AC converter in one housing is called a hybrid energy inverter. The effective selection of a photovoltaic system, hybrid inverter and energy storage allows one to configure the operation of the energy system in on/off-grid mode and in the form of an emergency UPS power supply [89]. The autonomy and self-consumption of such solutions are much greater than those of the traditional solutions.
There is currently a substantial offer of hybrid inverters on the market. The smaller ones work with single-phase power networks; the larger ones work in a three-phase system. The offered hybrid inverters work with various types of energy storage units (LFP and NMC) with different voltage levels from 24 to 500 V. The energy capacity of the energy storage units can also be freely configured from 2 to over 100 kWh [90].
For the production and storage of the energy obtained from renewable energy sources to generate green hydrogen, it is proposed to use a three-phase hybrid inverter with a capacity of 6 kW and an energy storage facility in the LFP [91,92] or NMC [93,94] technology with an energy capacity of 20 kWh. One can consider purchasing a secondhand traction battery from an electric vehicle to use it as a stationary energy storage device [95].

4. Results

In the analytical part, the Metalog probability distribution family was used to determine the amount of monthly energy produced by the 6.3 kWp photovoltaic systems located in two European countries: Poland and Italy. The data flow and processing diagram in the analytical part of this article is presented in Figure 8. The comparable values characterizing the energy and hydrogen generation system are also marked there.

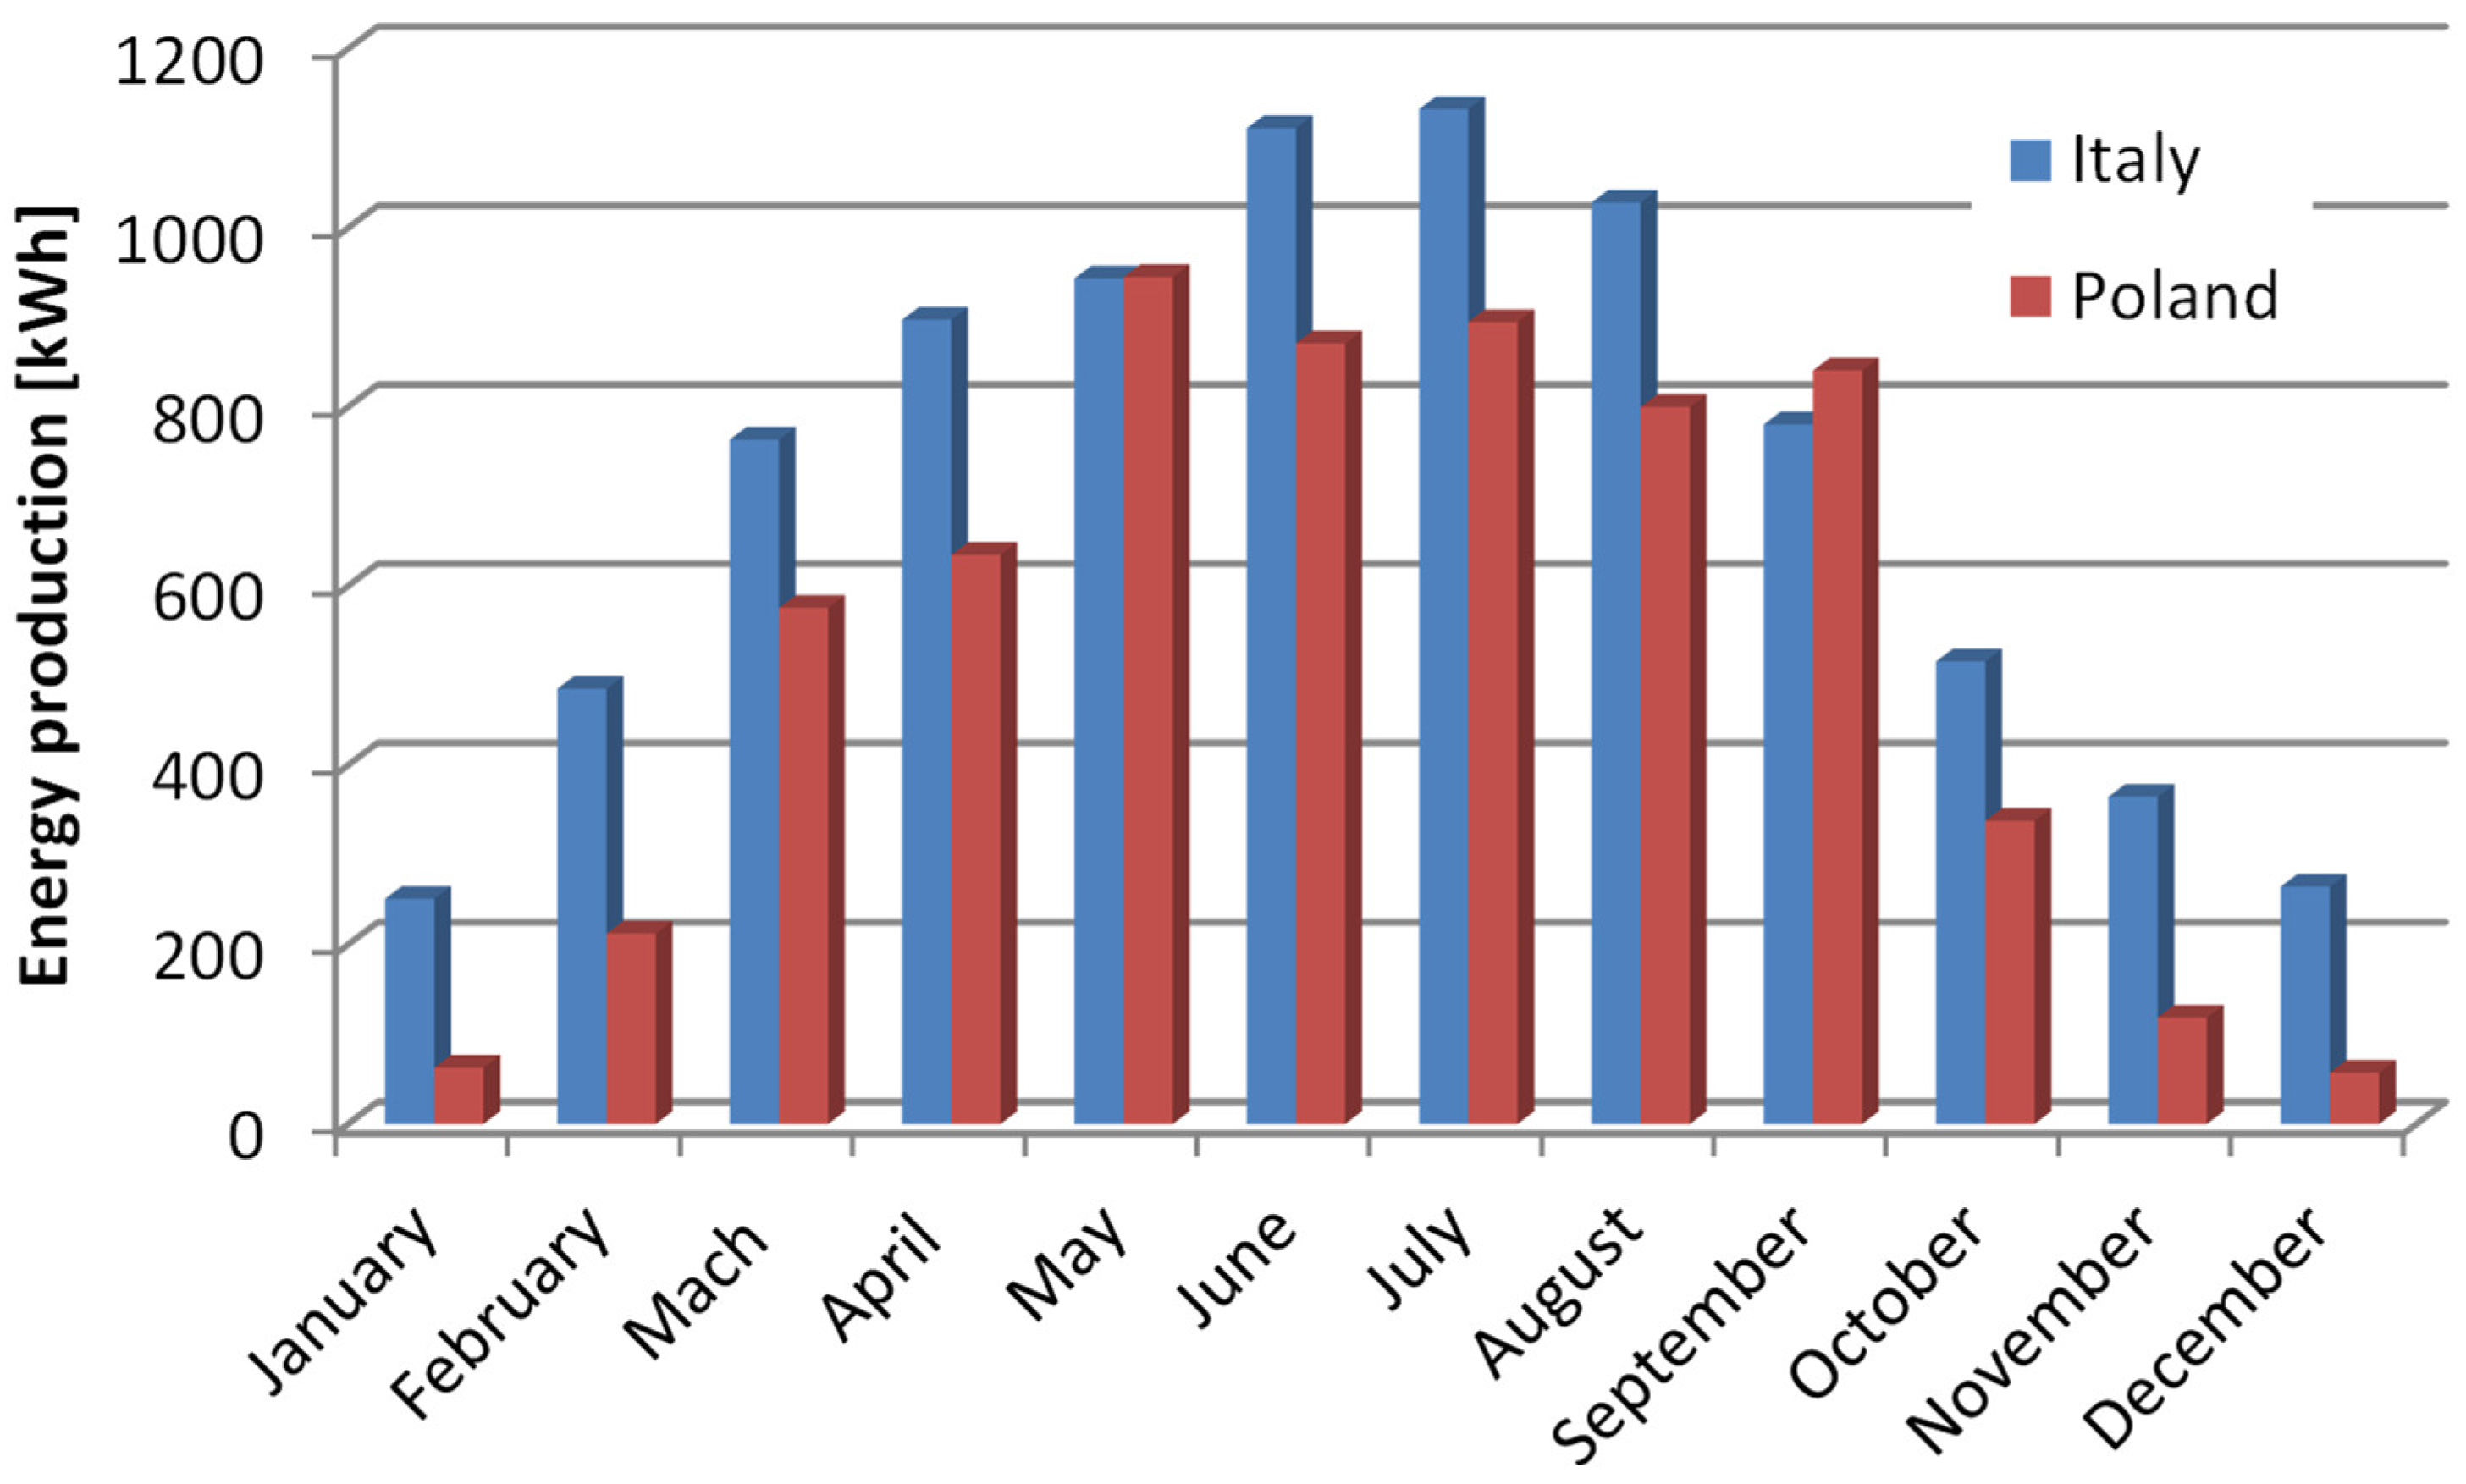
4.1. Comparison of the Amount of Energy Produced in Poland and Italy

The data on the production of electricity by the photovoltaic systems with a selected peak power, along with their location, can be obtained on the website of the inverter manufacturer—Solaregde (Herzliya, Israel). The first of the photovoltaic systems studied is the system with a capacity of 6.3 kWp located in eastern Poland, near the border with Belarus [96]. In 2023, it produced 6.351 MWh of electricity. The second of the systems studied was a system located in northern Italy near Lake Como, near Milan [97]. The system also with a peak power of 6.3 kWp in 2023 and produced 8.539 MWh of energy. The performance of both photovoltaic systems shows that they were directed exactly to the south and had an optimal tilt of the panels (see Figure 9). The amount of energy produced by photovoltaic systems with the same peak power but located in different geographical conditions was considered in order to compare the amount of energy produced per month. Due to better solar radiation conditions, the photovoltaic system with a peak power of 6.3 kWp in Italy was able to produce over 2 MWh more energy during the year than its Polish counterpart. These data show that the geographical context has a huge impact on the amount of energy produced by photovoltaic systems in different European countries. The amount of energy produced by photovoltaic systems with the same peak power affects the economics of return on the invested money and, therefore, the cost of the hydrogen produced. The amount of energy produced by a given photovoltaic system directly affects the amount of low-emission hydrogen produced from it.

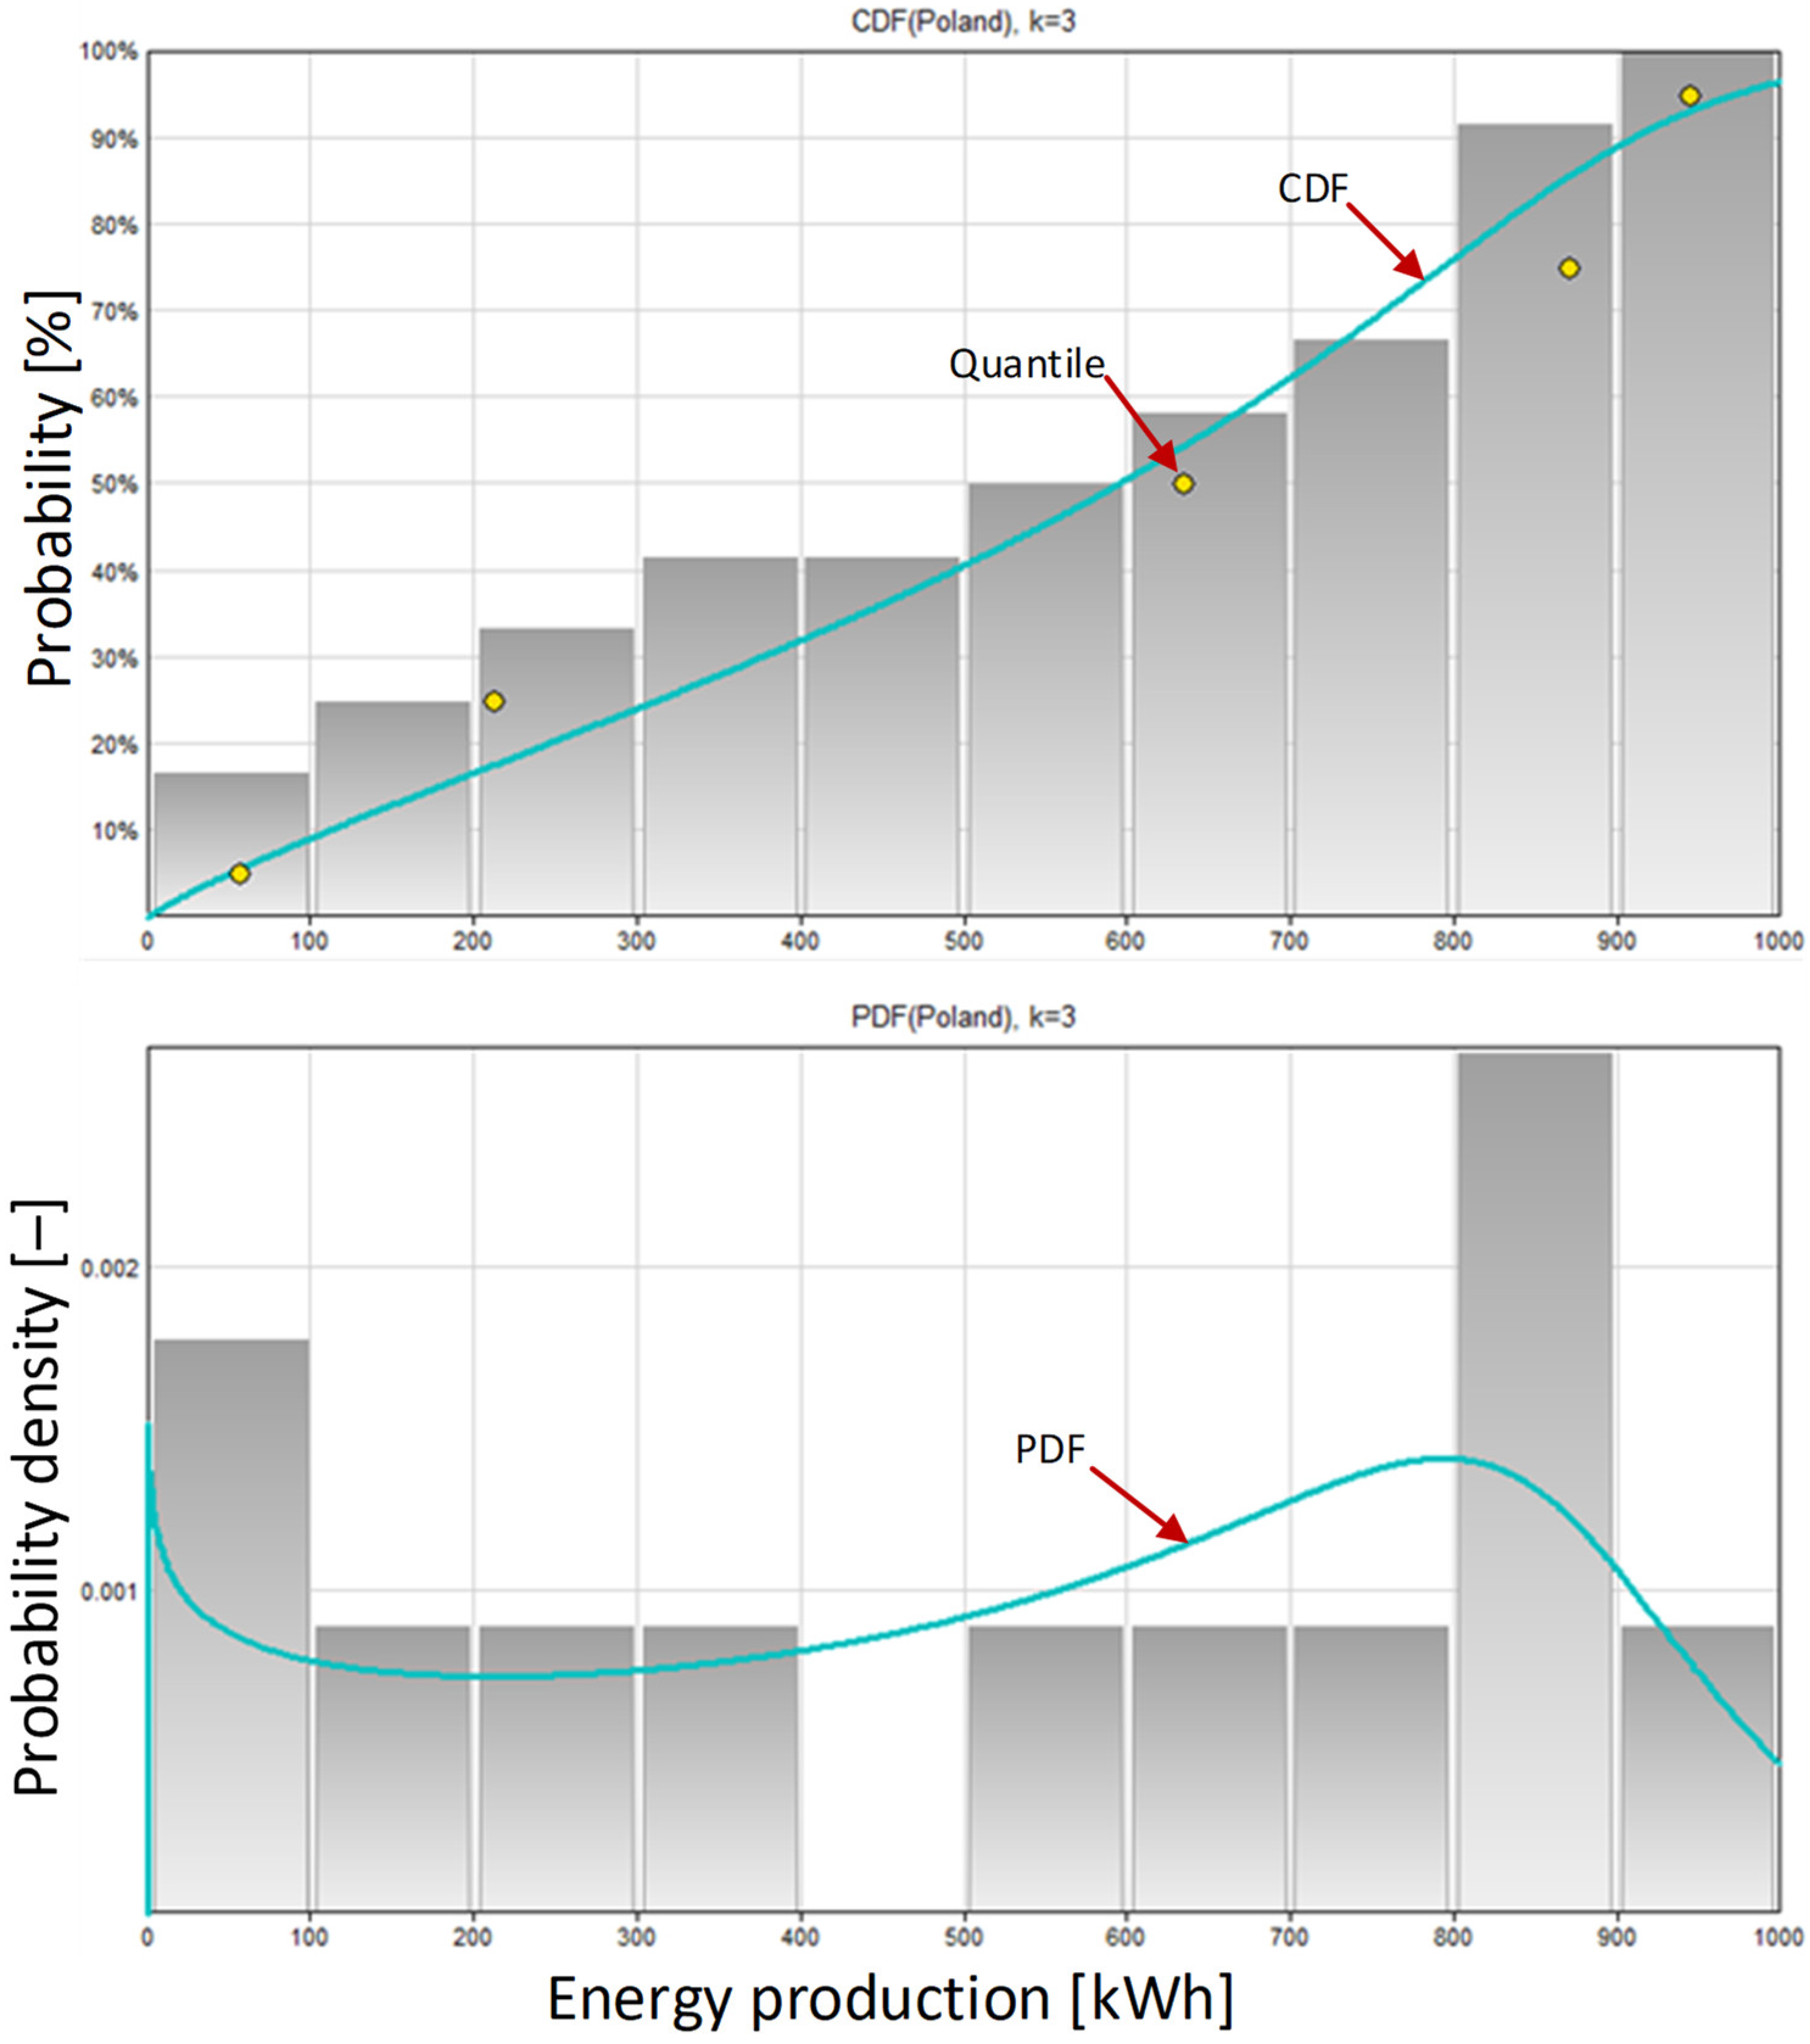
4.2. Probability of Monthly Energy Production Levels in Poland

The amount of energy produced monthly by the photovoltaic systems depends to a large extent on seasonality related to the different seasons. The highest energy production occurs in the spring and summer months, exceeding 700 kWh per month. The basic statistical data presented in Table 1 indicate that the highest monthly energy production by a photovoltaic system with a peak power of 6.3 kWp took place in May and amounted to 945.084 kWh of energy. The lowest value of energy produced took place in December and amounted to only 57.044 kWh. This means that in Polish geographical and climatic conditions, there is a more than 16-fold difference in energy production between the best and worst months of the year. In Polish climatic conditions, May is a spring month, during which there is already good sunlight and the days are becoming longer. The cost of the photovoltaic systems is also positively influenced by low average daily temperatures and significant winds that cool the photovoltaic panels. In the winter months, large amounts of snow often remain on the panels for several days at a time, and then, the photovoltaic system does not produce any energy at all. Such cases occurred in December 2023. The energy production by the 6.3 kWp photovoltaic system is characterized by an average value of monthly energy production of 529.221 kWh with a standard deviation of 350.765 kWh. These data indicate a large difference in the amount of energy produced in Poland in individual months. Such differences make it difficult to plan the energy production for the generation of low-emission hydrogen only from the energy obtained from photovoltaic systems. The extended statistical data presented in Table 2 also clearly show that the probabilities of energy production corresponding to individual quantiles are very different.
Afterward, an advanced probability analysis was performed using the Metalog probability distribution family [98]. The Fit Metalog Distribution function in Genie 4.1 Academic Version software was used for this purpose. It allowed for generating the Cumulative Distribution Function (CDF) and Probability Density Function (PDF) for the monthly energy production of the 6.3 kWp peak photovoltaic system located in Poland, as shown in Figure 10. Described by a third-degree polynomial, the PDF has a bimodal course. The first optimum (maximum) occurs for small amounts of monthly energy production. The second optimum (maximum) occurs for large amounts of monthly energy production of about 800 kWh.
The Metalog probability distribution family is easy to use and provides a lot of information, especially in the initial, conceptual phase of project implementation. Based on archive data from the previous year (or the previous few years), the amount of energy generated per month can be calculated with accuracy in relation to the probability distribution. The Metalog distribution family allows calculations to be made for a specific photovoltaic system located in a specific location (Lublin in Poland) and in a specific context (location on the ground, azimuth, shading). The Metalog distribution family allows you to determine quantiles in the production of electricity by a photovoltaic system and obtain an answer about its value with accuracy in relation to the probability distribution. The Metalog approach refers to the composition of probability distributions. It is a complex distribution. Using the Metalog distribution family, information is obtained from the knowledge base and not from the database. The difference is fundamental. In a database, the answer to the questions asked is obtained as a result of searching the database. The knowledge base answers the question by running an inferential algorithm. This approach resembles asking the following question: What if? Using Metalog, determining the probability for a given monthly or daily amount of energy production requires a simulation process that uses the determination of the inverse function of the Cumulative Distribution Function. GeNIe 4.1 Academic software has built-in families of Metalog distributions and allows for the quick determination of the Cumulative Distribution Function and Probability Density Function and provides a simple way to obtain information from the knowledge base. From the shape of the Probability Density Function, it can be concluded that there are several different contexts for the operation of the photovoltaic system, which will be proven in this article.
Based on the data on monthly energy production (presented in Figure 7), the software creates models that constitute the knowledge base. Importantly, this information from the knowledge base can be easily obtained. For example, one can ask the following question: What is the probability of generating monthly energy equal to or less than 200 kWh by the tested photovoltaic system? Based on the models in the form of the CDF and PDF, the database provides an answer: 0.25. Therefore, the probability of generating monthly energy greater than 200 kWh by the tested photovoltaic system is 1 − 0.25 = 0.75. The results of acquiring knowledge from the knowledge base are presented in Table 3.

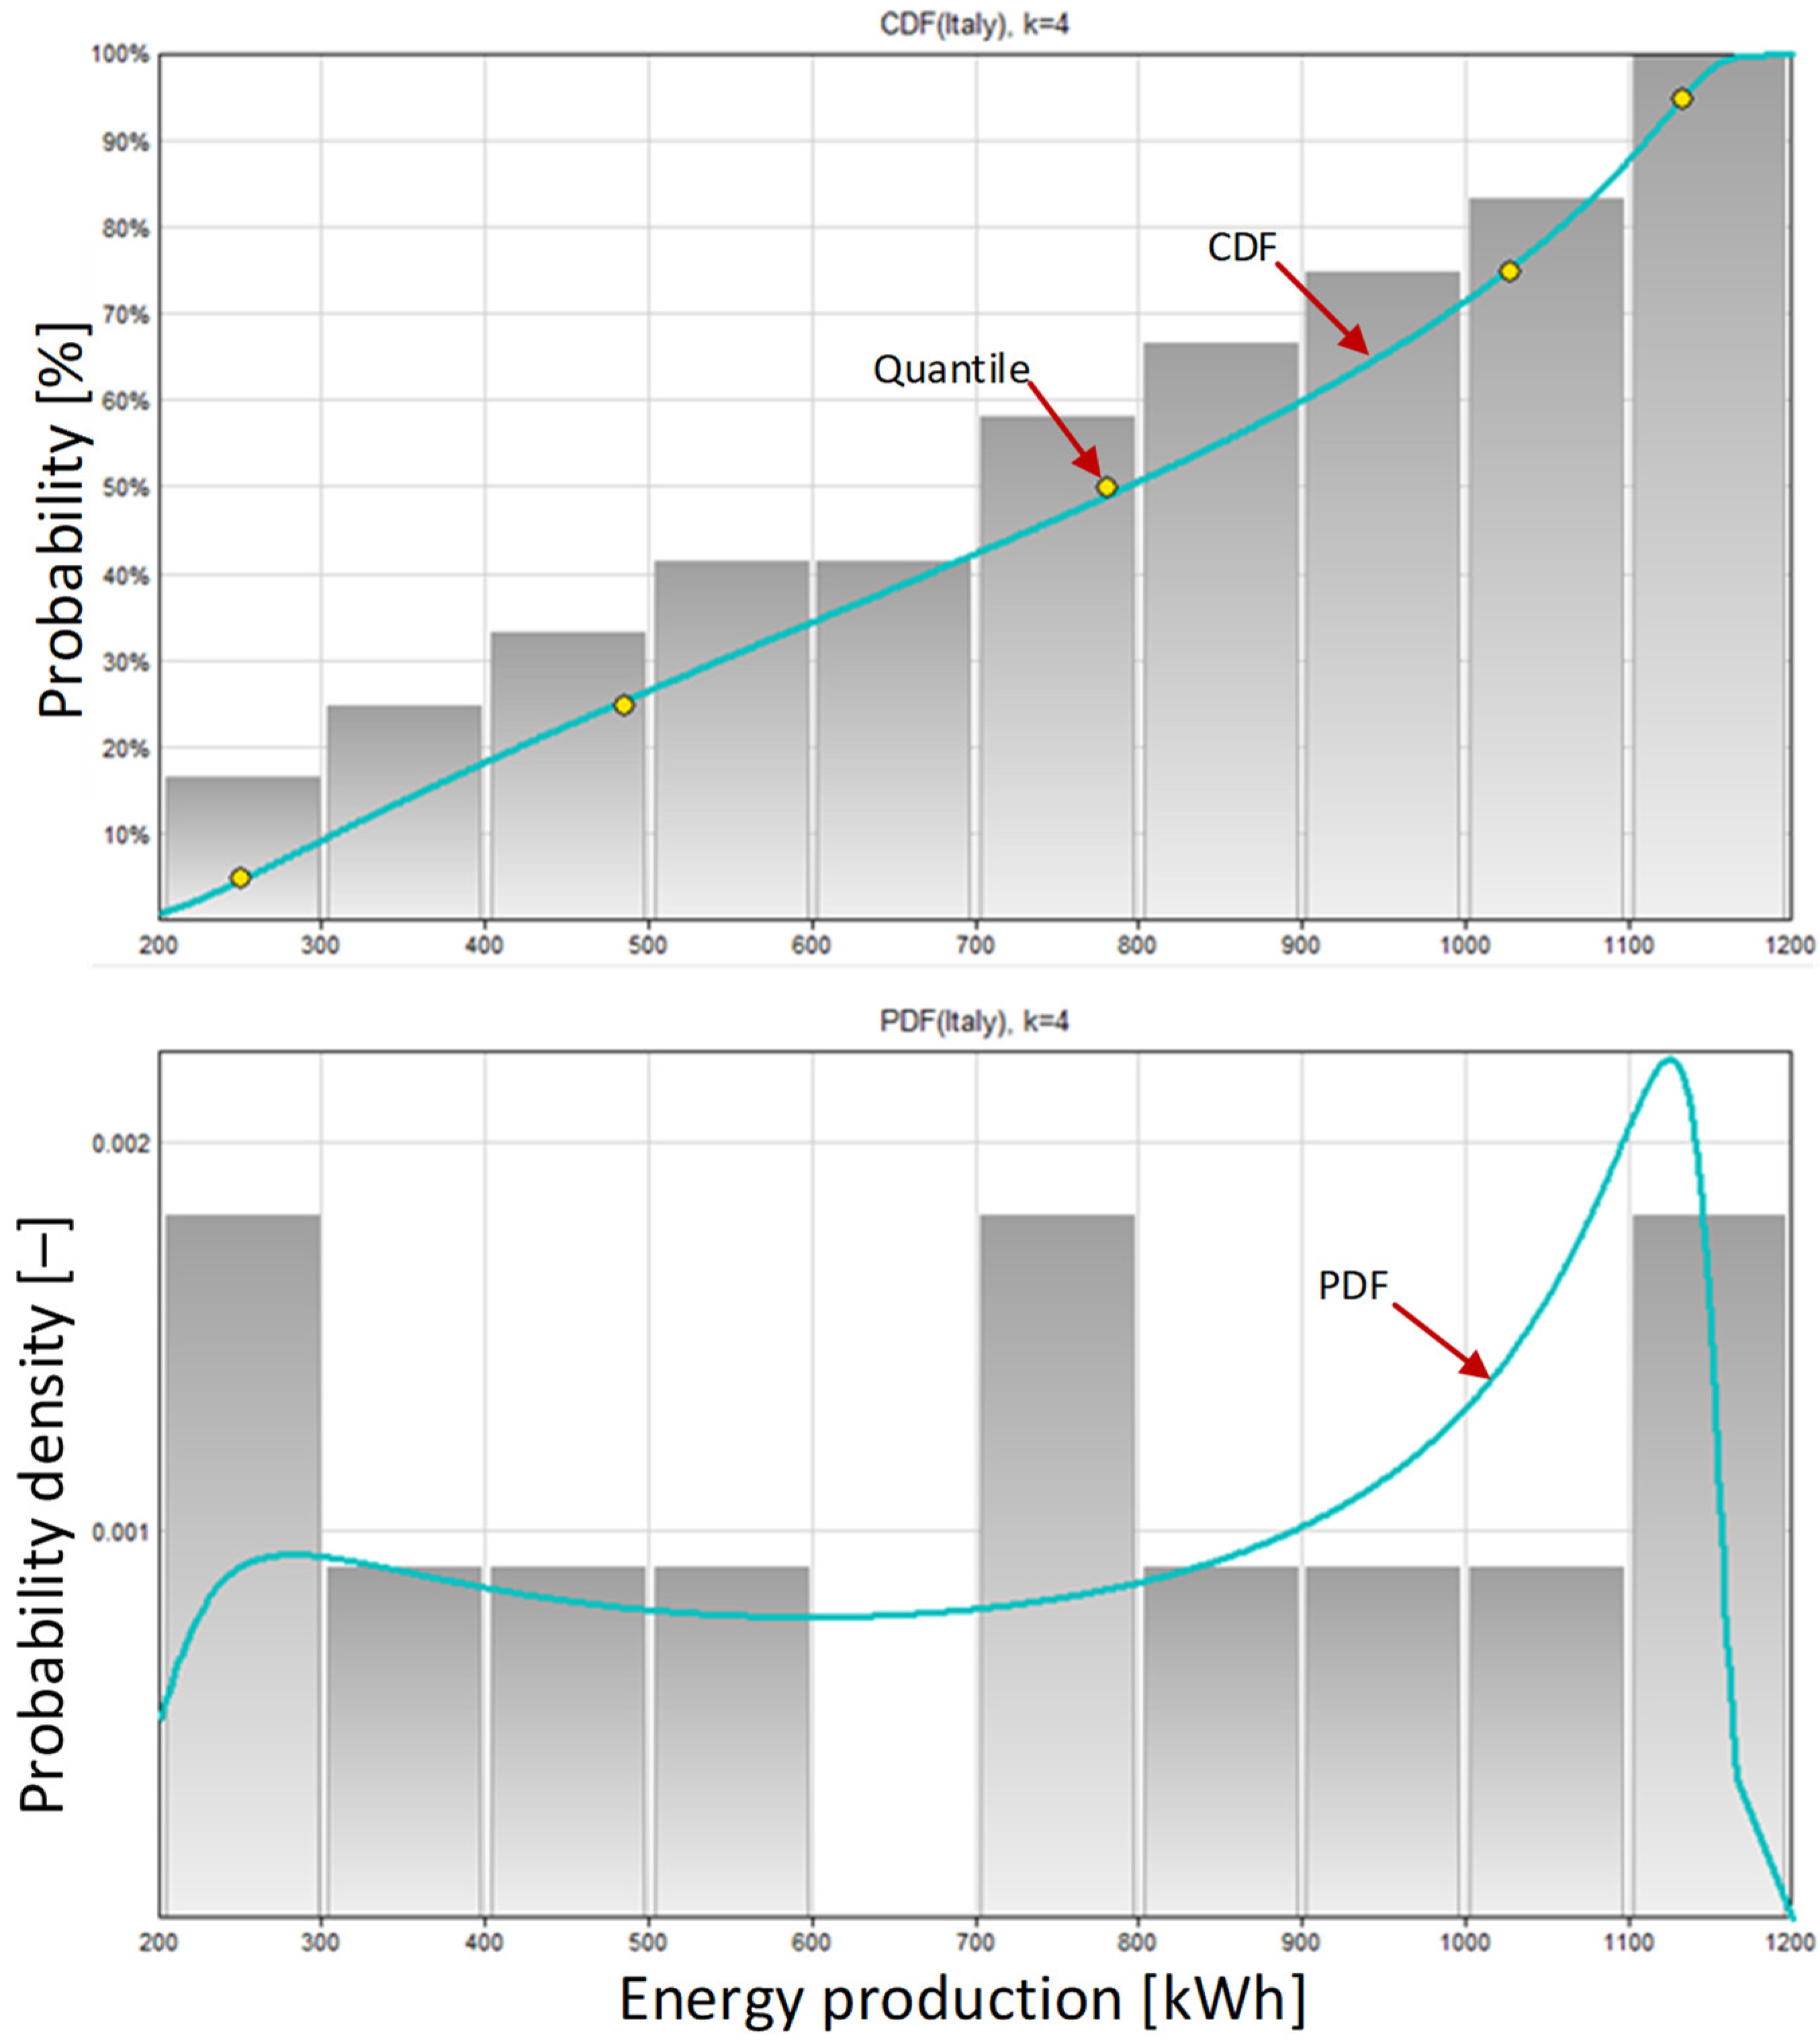
4.3. Probability of Monthly Energy Production Levels in Italy

Identical calculations were performed for the monthly energy production of the photovoltaic system with a peak power of 6.3 kWp operating in Italy. The amounts of monthly energy production by photovoltaic systems in Italy also depend to a very large extent on seasonality related to the shift to different seasons. The highest energy production occurs in the spring and summer months, exceeding 700 kWh per month, similarly to Poland. The basic statistical data presented in Table 4 indicate that the highest monthly energy production by the photovoltaic system with a peak power of 6.3 kWp took place in July and amounted to 1132.73 kWh of energy. The lowest value of energy production took place in January and amounted to only 251.033 kWh. This means that in Italian geographic and climatic conditions, there is a more than 4-fold difference in energy production between the best and worst months of the year. Let us recall that this value was more than 16-fold for Poland. In Italy, in this region, snow falls very rarely in the winter months, and it does not often accumulate on photovoltaic panels. Energy production by the 6.3 kWp photovoltaic system is characterized by an average value of monthly energy production of 711.584 kWh with a standard deviation of 324.064 kWh. In comparison, these values for Poland were 529.221 kWh and 350.765 kWh, respectively. Thus, in the average approach, the system located in Italy produced almost 200 kWh more electricity per month than its counterpart located in Poland. The data from the Italian photovoltaic system also indicate a large difference in the amount produced in individual months. Additionally, the extended statistics presented in Table 5 clearly present that the energy production probabilities corresponding to the individual quantiles are very different.
Afterward, an advanced probability analysis using the Metalog probability distribution family was also performed. The Cumulative Distribution Function (CDF) and Probability Density Function (PDF) generated by Genie 4.1 software for the monthly energy production of the 6.3 kWp peak of the photovoltaic system located in Italy are shown in Figure 11. Described by a fourth-degree polynomial, the PDF has a bimodal course. The first optimum (maximum) occurs for small amounts of monthly energy production of about 300 kWh. The second optimum (maximum) occurs for large amounts of monthly energy production of over 1100 kWh.
Based on the data on the monthly energy production of the Italian photovoltaic system (presented in Figure 7), the Genie 4.1 software also created the models that constitute the knowledge base. The following question was asked: What is the probability of generating monthly energy equal to or less than 400 kWh by the tested photovoltaic system? Based on the models available in the form of CDF and PDF, the database provides an answer: 0.25. Therefore, the probability of generating monthly energy greater than 400 kWh by the tested photovoltaic system is 1 − 0.25 = 0.75. The results of knowledge acquisition from the knowledge base are presented in Table 6.

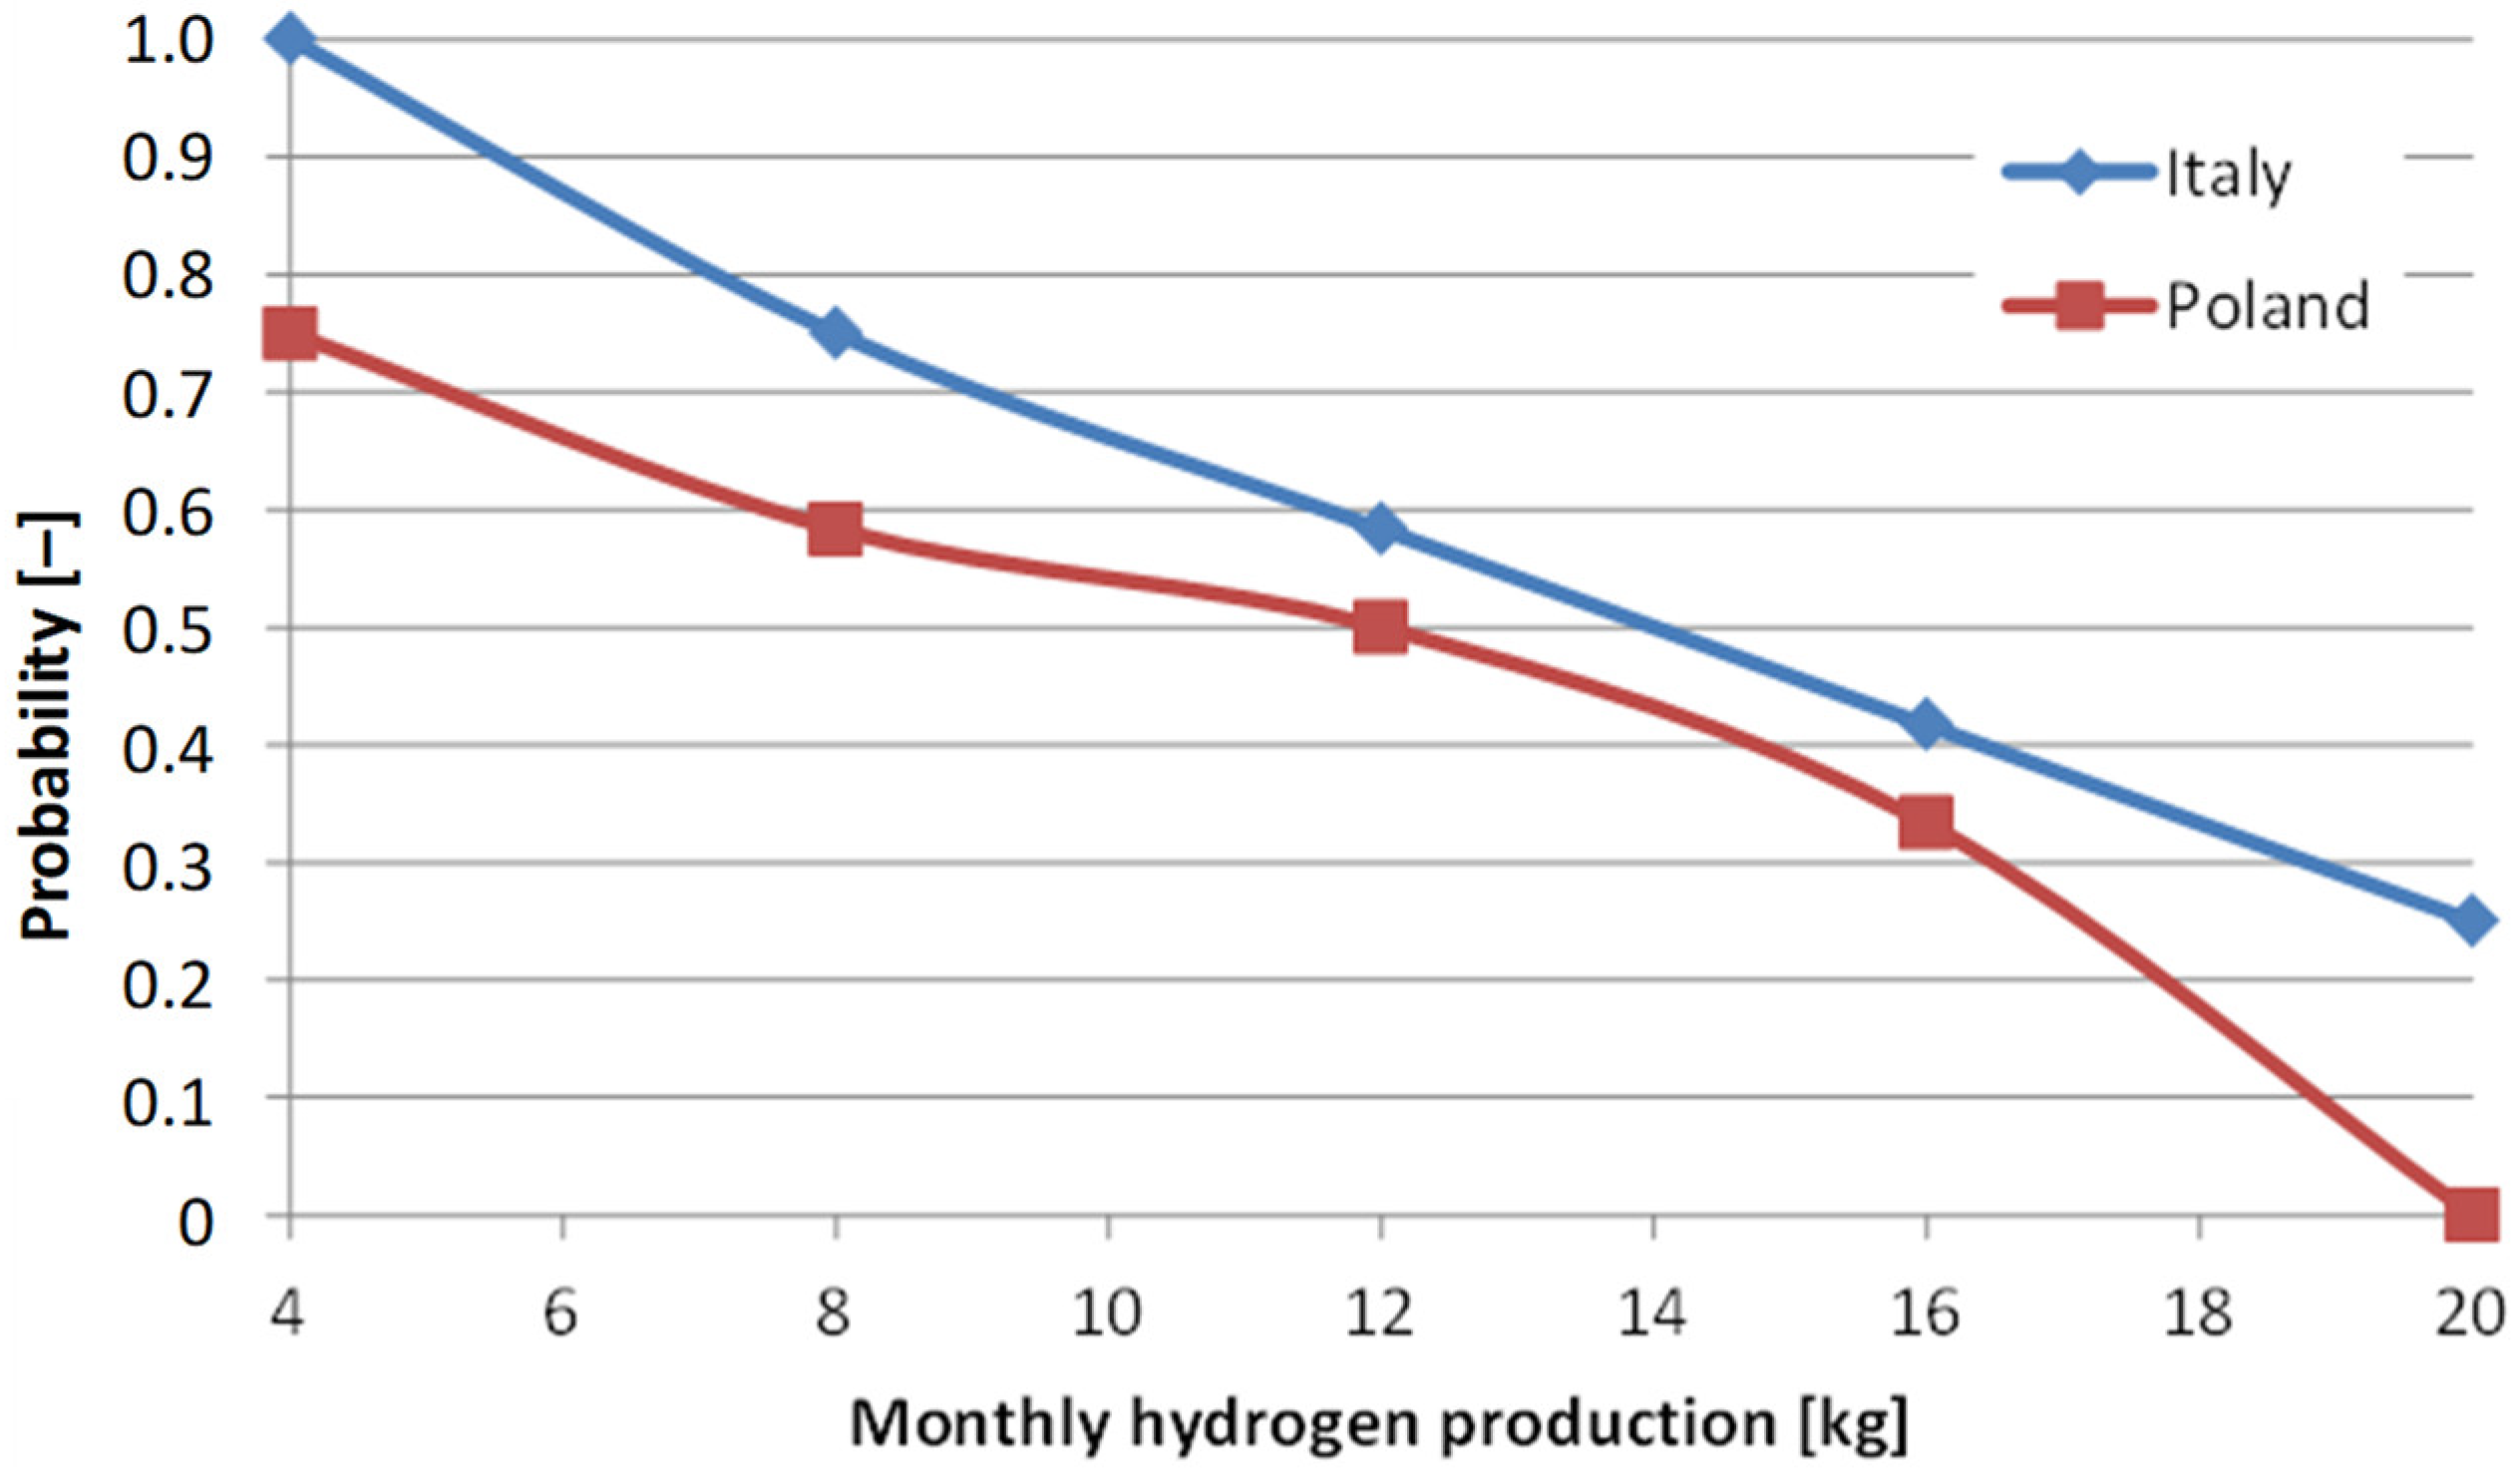
4.4. Comparison of Monthly Energy Production Probability Levels in Poland and Italy

The probability of generating individual energy levels per month by photovoltaic systems with a peak power of 6.3 kWp located in Poland and Italy is presented in the graph in Figure 12. A comparison of the obtained results shows that for all the power levels considered, the system located in Italy was able to generate them with a higher probability. The results obtained in the calculations were based on data from only one year of operation of photovoltaic systems located in two specific locations in Europe, and the conclusions drawn from this cannot be the basis for broader generalizations regarding the amount of energy and hydrogen produced in Poland and Italy. The calculations carried out are to indicate the order of calculations performed using selected calculation tools.

5. Discussion

The probability of the photovoltaic systems generating individual levels of monthly energy production (Figure 12) can be easily converted into the probability of low-emission hydrogen production. However, this requires adopting certain initial assumptions which are listed as follows:
(1)
All energy produced by the photovoltaic system will be used to produce hydrogen. For this purpose, it is necessary to use an energy storage device that is able to accumulate excess electricity and use it to power the electrolyzer during periods of lower sunlight or at night.
(2)
To produce 1 kg of hydrogen, 50 kWh of electricity is needed. This is a significant simplification because it results from the efficiency of the entire hydrogen generation system. However, it is very useful in quick and approximate calculations.
(3)
The low-emission hydrogen generation system operates reliably. All system components operate with maximum efficiency and do not fail. Under normal operating conditions, certain periodic downtimes related to inspections and maintenance procedures in the operation of the entire system should be expected.
(4)
No costs associated with compressing hydrogen to pressures of 350 or 700 bar are included.
The probability of producing a specific monthly expenditure of low-emission hydrogen using the energy from the photovoltaic systems is shown in Figure 13. Low-emission hydrogen generation systems powered by 6.3 kWp peak photovoltaic systems are able to produce between 4 and 20 kg of low-emission hydrogen per month. Of course, the probability of producing a specific expenditure of hydrogen is higher in Italian conditions and is a direct result of the production of higher monthly energy quantities.
At this point, it is necessary to discuss the possibilities of hydrogen fuel cell vehicles currently on the market. The capacity of the three hydrogen tanks in the Hyundai Nexo (Seoul, Republic of Korea) is 156.6 L, and they can hold 6.33 kg of hydrogen. Refueling them takes only 5 min. This amount of hydrogen gives a range of 666 km in the WLTP mixed cycle (in urban mode 0.77 kg/100 km, outside the city 0.89 kg/100 km, average consumption 0.84 kg/100 km). The average hydrogen consumption in the Toyota Mirai (Toyota, Japan) is 0.79–0.89 kg/100 km (also in the WLTP cycle). The car’s range is approximately 650 km. Therefore, it can be stated that the compared hydrogen vehicles have almost identical hydrogen consumption, which translates into very similar ranges on a single refueling with hydrogen. For further calculations, we will assume a hydrogen tank capacity of 6.33 kg and a vehicle range of 650 km. Taking into account the possibilities of producing low-emission hydrogen, we are able to state that the monthly hydrogen expenditures produced in the summer period amounting to 16 kg/month and even 20 kg/month in the case of Italy are able to provide monthly ranges of hydrogen vehicles amounting to 1643 km and 2054 km, respectively. The total amounts of energy produced annually by the tested photovoltaic systems located in Poland and Italy can be translated into the following annual ranges of hydrogen vehicles: for Polish conditions, 13,043 km, and for Italian conditions, 17,537 km.
More advanced modeling methods can be used in subsequent stages of projects related to hydrogen production from renewable energy. Measurement data from real objects in the form of photovoltaic carports and hydrogen electrolyzers can be used to create physical models of these objects or to model their performance using recurrent neural networks. Models generated in this way can be used in dynamic modeling of hydrogen production in various scenarios of energy production from renewable energy sources. The input to the low-emission hydrogen production system can be the instantaneous power generated by the photovoltaic system. Depending on its value, the control algorithm is able to select the appropriate power supplying the electrolyzer and control it while maintaining all safety requirements. In the scientific literature, there are examples of dynamic modeling in the area of hydrogen bus supply. In this case, dynamic modeling allowed for the optimization of the size of fuel cells and the size of traction batteries on board a hydrogen bus [99]. The same research approach could be used in the future to generate low-emission hydrogen.

6. Conclusions

The aim of this article was to determine the levels of monthly energy production by photovoltaic systems placed on a carport structure with accuracy in relation to the probability distribution in order to use it to produce low-emission hydrogen for transport purposes. For this purpose, 3D modeling and the Building Information Modeling (BIM) approach were used to determine the size and peak power of the carport. Then, the amount of energy produced and the probability of generating individual monthly energy levels and low-emission hydrogen production levels for systems located in Poland and Italy were compared.
The following conclusions result from the research and analyses conducted in this article:
(1)
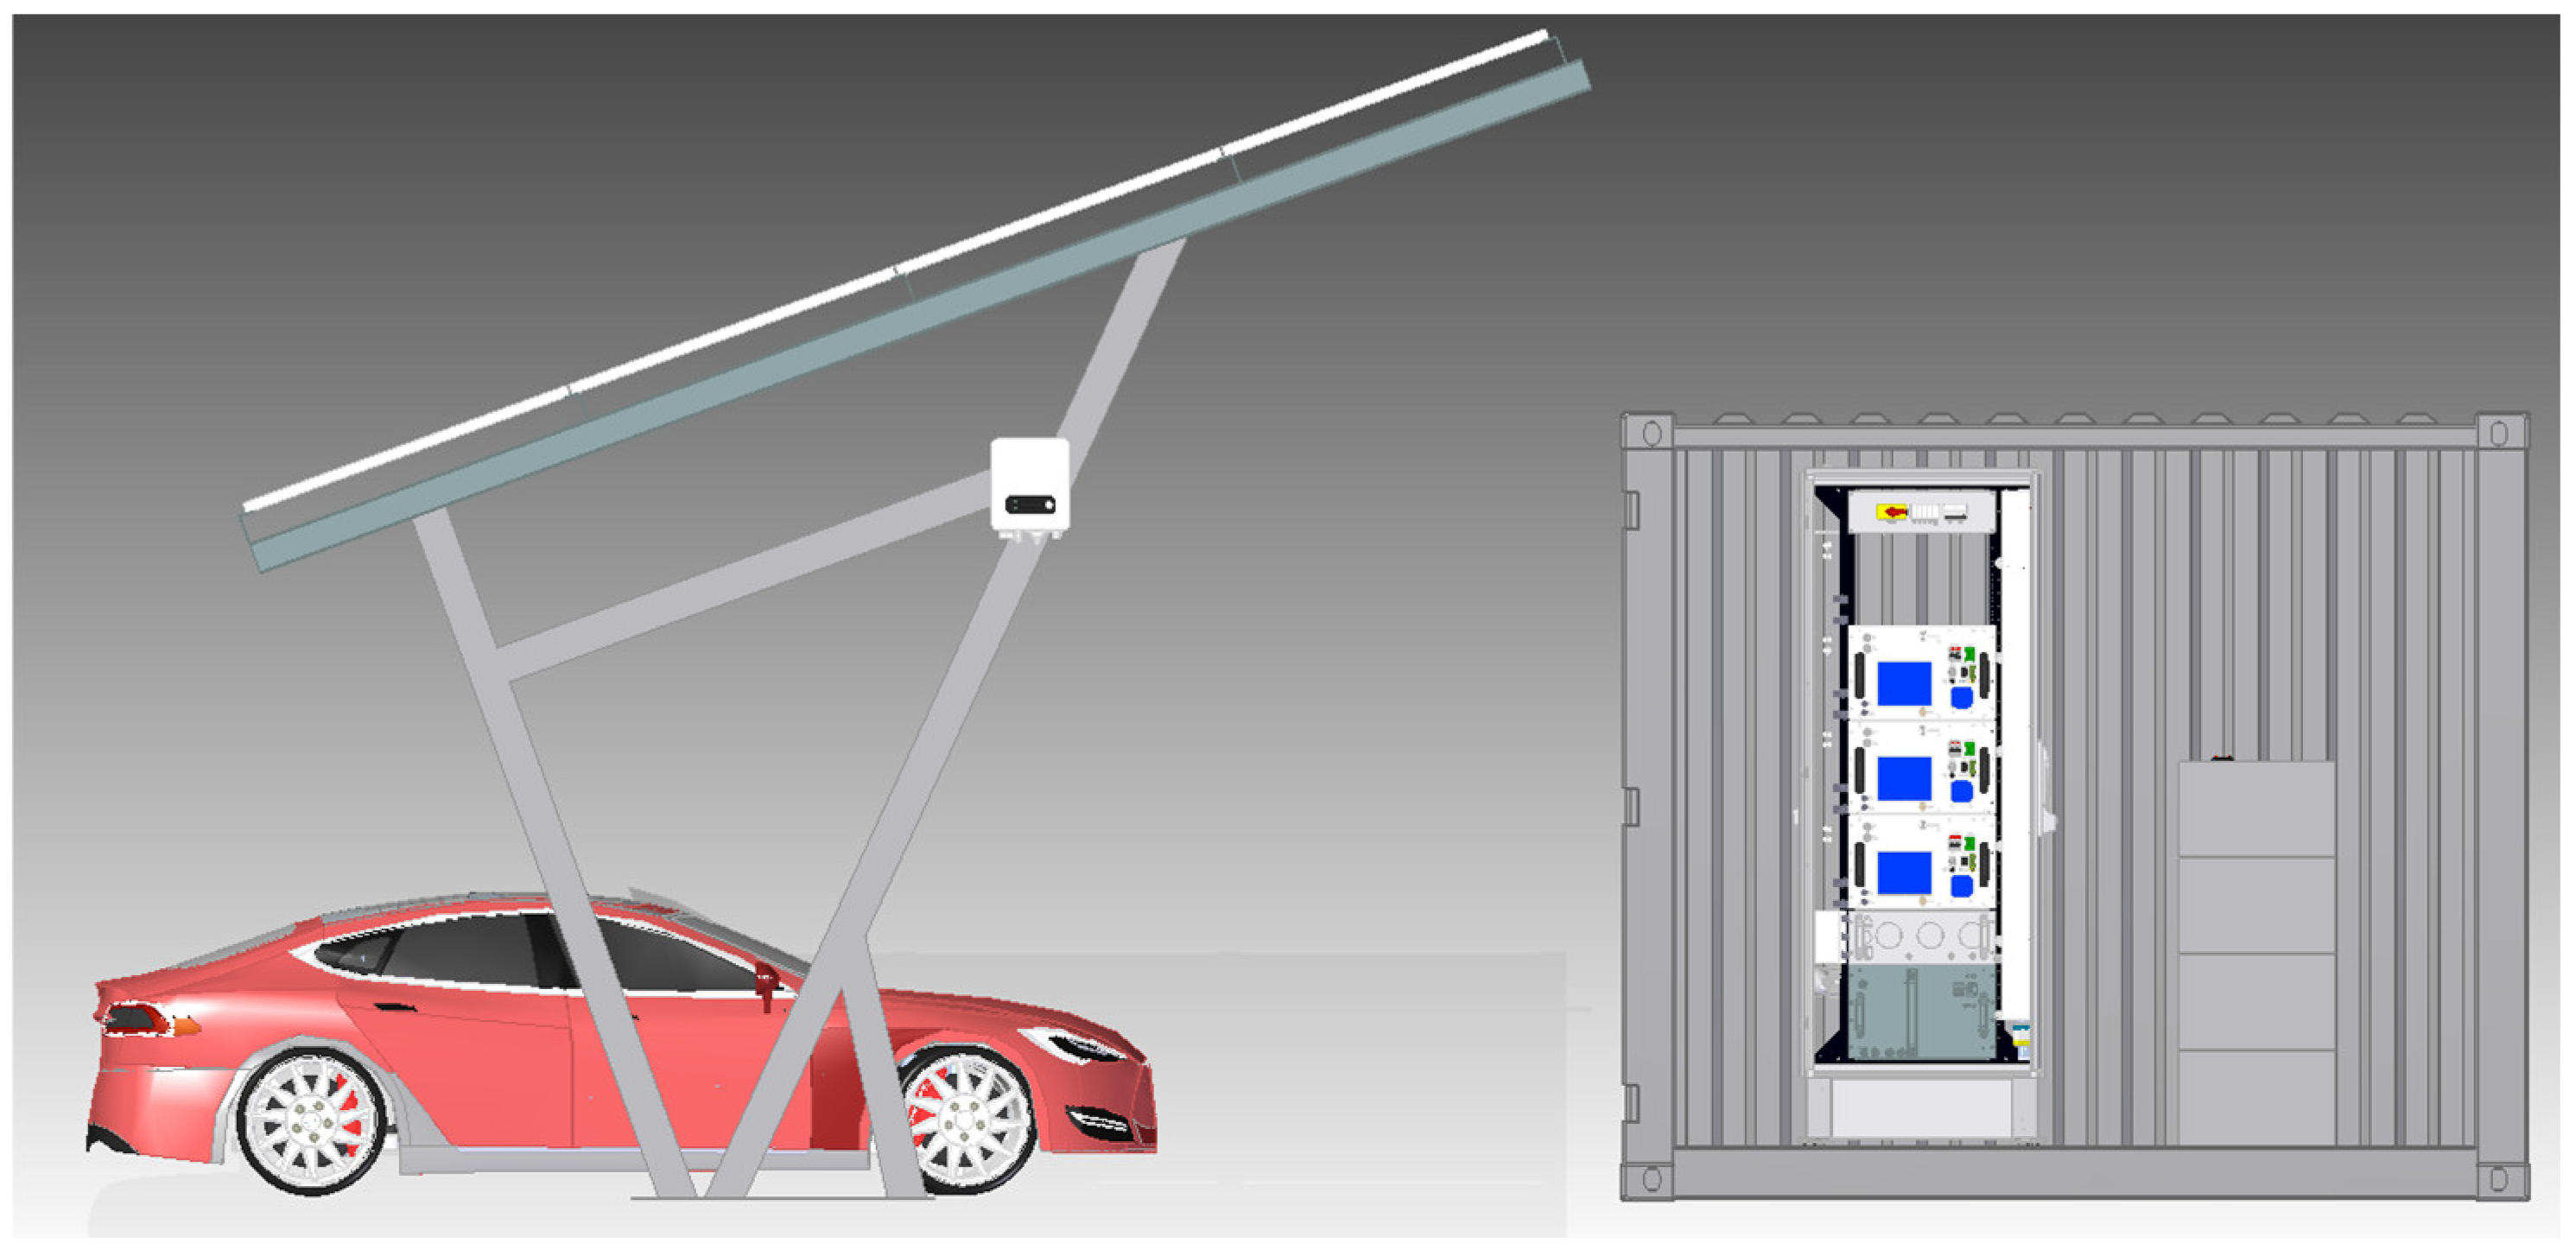
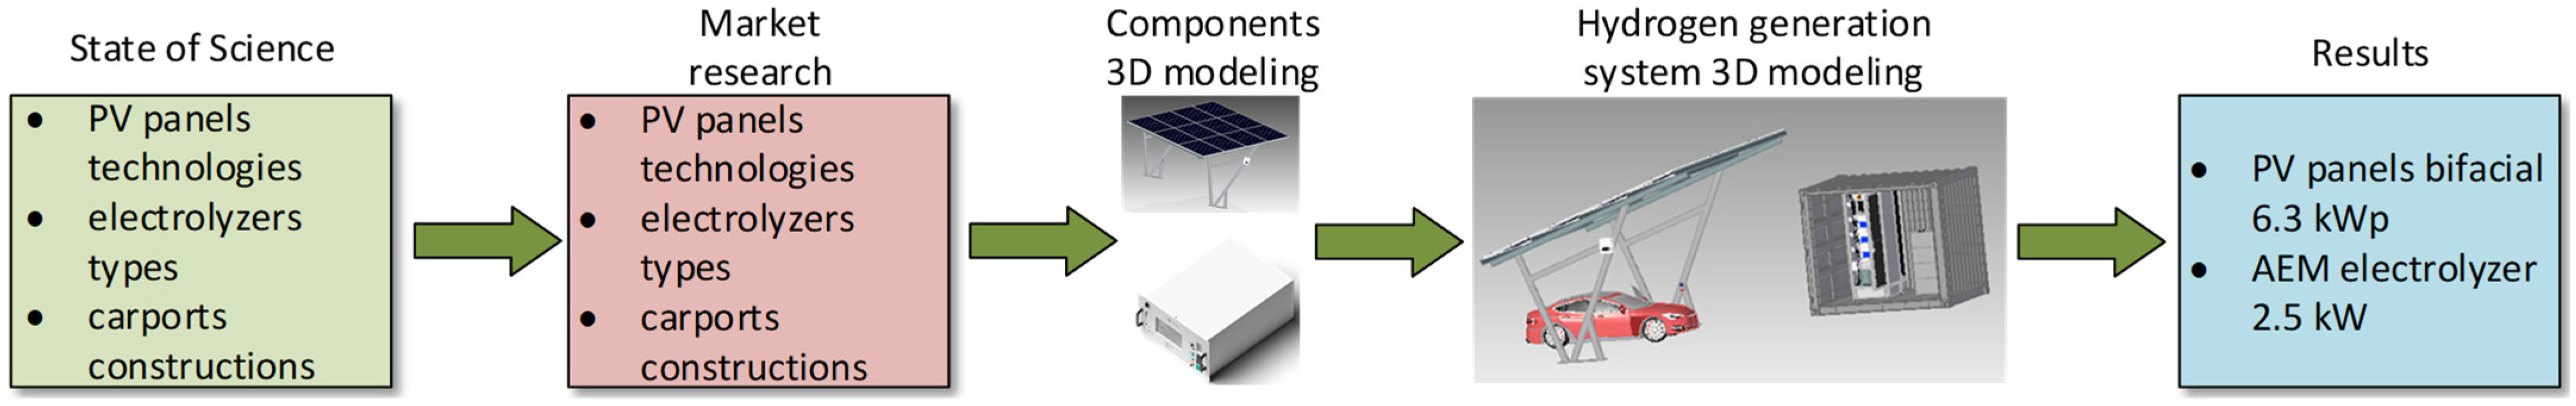
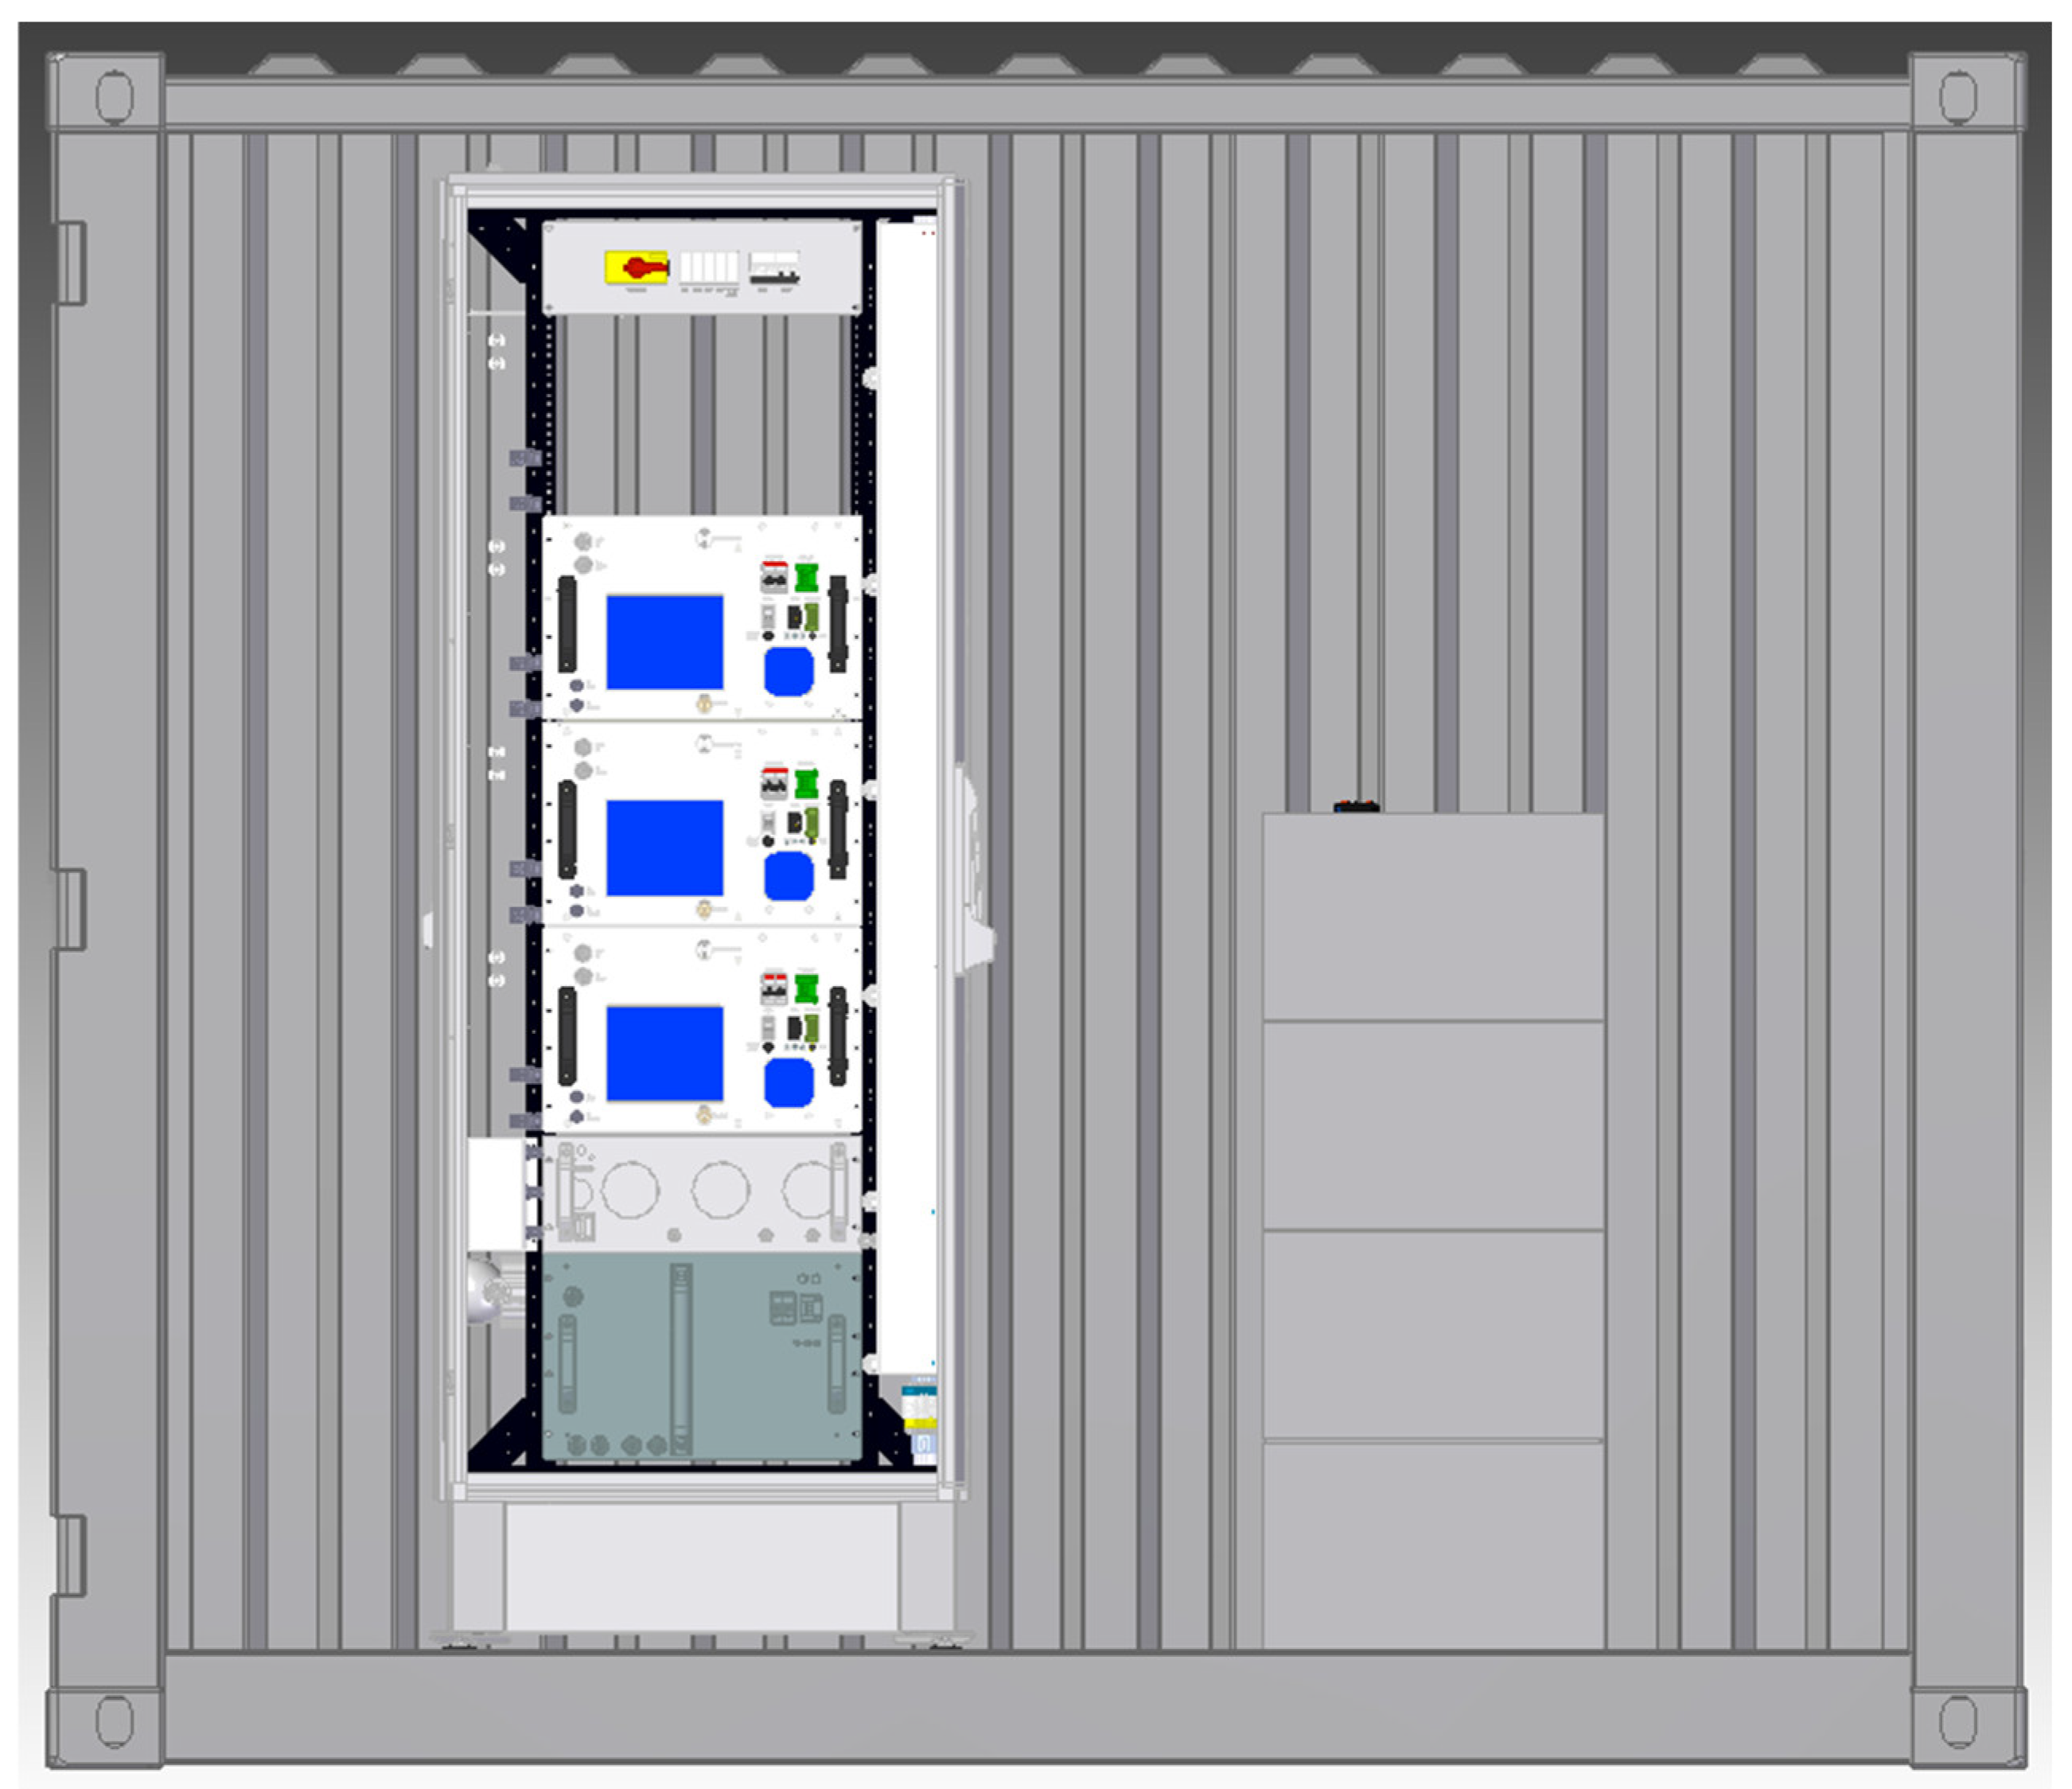
This article includes the 3D modeling and the probabilistic analysis of a low-emission hydrogen generation system powered by energy from the photovoltaic carport. First, the individual components of the low-emission hydrogen generation system were characterized. Due to the purpose of the produced hydrogen, it was decided that the energy for its production would come from the carport. The 3D modeling presented in this article allows us to estimate the sufficient surface area in order to generate the specific amount of hydrogen. To produce hydrogen in the amount of ¾ kg/day, a photovoltaic carport was designed in 3D using the Solid Edge software with a peak power of 6.36 kWp. The peak power results from the use of twelve bifacial panels with a peak power of 530 Wp. The approximate overall dimensions of the carport will be 6.822 mm × 4.536 mm. With a carport leg spacing of 6000 mm, two compact-class vehicles can be parked under it. The hydrogen generation system, including an electrolyzer, a water preparation station and a hydrogen dryer, as well as an energy storage facility, was placed in a 10-foot ISO shipping container.
(2)
Among the many available hydrogen production technologies, the AEM electrolyzer technology was selected for producing clean hydrogen that is able to meet the requirements of the automotive industry. The selected 2.4 kW electrolyzer is ideally suited for producing 1 kg of hydrogen per day, provided that the appropriate amount of energy is supplied. In order to ensure the production of low-emission hydrogen with the energy from the photovoltaic carport, it was necessary to store the energy in a stationary storage. The power produced by the carport, which is an excess in relation to the power consumed by the electrolyzer, must be stored in the energy storage and released from it at times of lower power generated from the sun and at night.
(3)
A probabilistic analysis of the monthly energy production by two photovoltaic systems located in two European countries, namely Poland and Italy, was then performed. The calculation method presented in this article uses the Metalog probability distribution family. As a result of using the actual monthly energy production by the photovoltaic systems with a peak power of 6.3 kWp located in Poland and Italy for calculations, the probabilistic analysis takes into account the geographical context related to the location of the low-emission hydrogen generation system. The system located in Italy was able to produce approximately 200 kWh more energy per month than its counterpart located in Poland. Higher monthly energy production in Italian geographical and climatic conditions resulted in a higher probability of generating individual energy levels, which directly translated into the probability of generating individual monthly low-emission hydrogen expenditures.
(4)
The monthly hydrogen production amounts were compared with the average hydrogen consumption of the two most popular hydrogen fuel cell vehicles. On this basis, it was calculated that the energy produced annually by the 6.3 kWp peak photovoltaic system located in Poland would provide a hydrogen vehicle with a range of over 13,000 km. An identical photovoltaic system located in Italy would provide a hydrogen vehicle with a range of over 17,000 km. The results obtained in the calculations were made based on data from only one year of operation of photovoltaic systems located in two specific locations in Europe, and the conclusions drawn from this cannot be the basis for broader generalizations regarding the amount of energy and hydrogen produced in Poland and Italy. The calculations carried out are to indicate the order of calculations performed using selected calculation tools.
The 3D modeling of the low-emission hydrogen generation system which uses the energy from the carport presented in this article and the accompanying probabilistic analysis are examples of a practical scientific approach in engineering practice. The research results can be adopted by individual users of hydrogen vehicles for distributed hydrogen production for their vehicles. The approach presented in this article can be easily scaled to achieve higher levels of energy generation and hydrogen production. This article presents a ready-to-use algorithm for performing calculations along with a physical interpretation of the obtained results. It can have a direct and fast application in conceptual calculations related to the design of low-emission hydrogen generation systems in distributed conditions. It can be used by any hydrogen-powered vehicle owner to design their own hydrogen generation and refueling station.
Based on the ready-made project of a low-emission hydrogen production system in the form of a 3D model, a real system will be built in the near future at the Lublin Science and Technology Park in Poland. The research that has been started will be continued to more precisely determine the size of the energy storage facility and, in future calculations, to take into account the amount of energy needed to compress the produced green or low-emission hydrogen to a pressure of 350 and 700 bar.

Author Contributions

Conceptualization, A.M., J.C. and A.D.; methodology, A.M.; software, A.M.; validation, J.C. and A.D.; formal analysis, A.D. and J.M.; investigation, A.M.; resources, J.C. and J.M.; data curation, A.M.; writing—original draft preparation, A.D., A.M., J.C. and J.M.; writing—review and editing, A.M., J.C., A.D. and J.M.; visualization, A.M.; supervision, A.D., A.M. and J.M.; project administration, A.D.; funding acquisition, A.D. and J.C. All authors have read and agreed to the published version of the manuscript.

Funding

This work was prepared as part of the scientific internship of Jacek Caban at the Institute of Mechanical Science of Vilnius Gediminas Technical University which took place from 26 July to 6 August 2021.

Institutional Review Board Statement

Not applicable.

Informed Consent Statement

Not applicable.

Data Availability Statement

The original contributions presented in the study are included in this article; further inquiries can be directed to the corresponding author.

Conflicts of Interest

The authors declare no conflicts of interest.

References

  1. Barreto, L.; Makihira, A.; Riahi, K. The hydrogen economy in the 21st century: A sustainable development scenario. Int. J. Hydrogen Energy 2003, 28, 267–284. [Google Scholar] [CrossRef]
  2. Minderytė, A.; Pauraite, J.; Dudoitis, V.; Plauškaitė, K.; Kilikevičius, A.; Matijošius, J.; Rimkus, A.; Kilikevičienė, K.; Vainorius, D.; Byčenkienė, S. Carbonaceous aerosol source apportionment and assessment of transport-related pollution. Atmos. Environ. 2022, 279, 119043. [Google Scholar] [CrossRef]
  3. Stopka, O.; Kampf, R.; Vrábel, J. Deploying the means of transport within the transport enterprises in the context of emission standards. In Transport Means, Proceedings of the International Conference, Juodkrante, Lithuania, 5–7 October 2016; Kaunas University of Technology: Juodkrante, Lithuania, 2016; pp. 185–190. [Google Scholar]
  4. Beik, Y.; Dziewiątkowski, M.; Szpica, D. Exhaust emissions of an engine fuelled by petrol and liquefied petroleum gas with control algorithm adjustment. SAE Int. J. Engines 2020, 13, 739–759. [Google Scholar] [CrossRef]
  5. Pivetta, D.; Dall’Armi, C.; Sandrin, P.; Bogar, M.; Taccani, R. The role of hydrogen as enabler of industrial port area decarbonization. Renew. Sustain. Energy Rev. 2024, 189 Pt B, 113912. [Google Scholar] [CrossRef]
  6. Pivetta, D.; Volpato, G.; Carraro, G.; Dall’Armi, C.; Da Lio, L.; Lazzaretto, A.; Taccani, R. Optimal decarbonization strategies for an industrial port area by using hydrogen as energy carrier. Int. J. Hydrogen Energy 2023, 52, 1084–1103. [Google Scholar] [CrossRef]
  7. Skrúcaný, T.; Gnap, J. Energy intensity and greenhouse gases production of the road and rail cargo transport using a software to simulate the energy consumption of a train. Commun. Comput. Inf. Sci. 2014, 471, 263–272. [Google Scholar]
  8. Skrúcaný, T.; Stopková, M.; Stopka, O.; Kalašová, A.; Ovčiarik, P. User’s determination of a proper method for quantifying fuel consumption of a passenger car with compression ignition engine in specific operation conditions. Open Eng. 2021, 11, 151–160. [Google Scholar] [CrossRef]
  9. Suh, J. Estimation of Photovoltaic Potential of Solar-Powered Electric Vehicle: Case Study of Commuters on Donghae Expressway, Korea. Appl. Sci. 2024, 14, 6574. [Google Scholar] [CrossRef]
  10. Malek, A.; Niewczas, A. Selected maintenance aspects of traction batteries in electric vehicles. In Proceedings of the 2020 XII International Science-Technical Conference AUTOMOTIVE SAFETY, Kielce, Poland, 21–23 October 2020; pp. 1–6. [Google Scholar] [CrossRef]
  11. Gawlik, L.; Mokrzycki, E. Analysis of the Polish Hydrogen Strategy in the Context of the EU’s Strategic Documents on Hydrogen. Energies 2021, 14, 6382. [Google Scholar] [CrossRef]
  12. Ding, S.-L.; Song, E.-Z.; Yang, L.-P.; Litak, G.; Yao, C.; Ma, X.-Z. Investigation on nonlinear dynamic characteristics of combustion instability in the lean-burn premixed natural gas engine. Chaos Solitons Fractals 2016, 93, 99–110. [Google Scholar] [CrossRef]
  13. Szpica, D.; Czaban, J. Investigating of the combustion process in a diesel engine fueled with conventional and alternative fuels. In Proceedings of the 23rd International Scientific Conference, Transport Means 2019, Palanga, Lithuania, 2–4 October 2019; pp. 176–181. [Google Scholar]
  14. Dziewiatkowski, M.; Szpica, D.; Borawski, A. Evaluation of impact of combustion engine controller adaptation process on level of exhaust gas emissions in gasoline and compressed natural gas supply process. Eng. Rural. Dev. 2020, 19, 541–548. [Google Scholar] [CrossRef]
  15. Shahabuddin, M.; Rhamdhani, M.A.; Brooks, G.A. Technoeconomic Analysis for Green Hydrogen in Terms of Production, Compression, Transportation and Storage Considering the Australian Perspective. Processes 2023, 11, 2196. [Google Scholar] [CrossRef]
  16. Aguilar-García, E.; Pérez-Cruz, M.A.; Sánchez-Cruz, M.; Yee-Madeira, H.; Cruz-Leal, M.; Rubio-Rosas, E.; Hernández-Huesca, R. Hydrogen Production by Hydrogen Sulfide Decomposition Using Cobalt Catalysts Doped in SBA-15 Synthetized by EISA Method. Catal. Lett. 2024, 154, 3724–3737. [Google Scholar] [CrossRef]
  17. Anastasiadis, A.G.; Papadimitriou, P.; Vlachou, P.; Vokas, G.A. Management of Hybrid Wind and Photovoltaic System Electrolyzer for Green Hydrogen Production and Storage in the Presence of a Small Fleet of Hydrogen Vehicles—An Economic Assessment. Energies 2023, 16, 7990. [Google Scholar] [CrossRef]
  18. Chakrabarty, P.; Alam, K.C.A.; Paul, S.K.; Saha, S.C. Hydrogen production by electrolysis: A sustainable pathway. In Hydrogen Energy Conversion and Management; Elsevier: Amsterdam, The Netherlands, 2024; pp. 81–102. [Google Scholar] [CrossRef]
  19. Nadaleti, W.C.; de Souza, E.G.; de Souza, S.N.M. The potential of hydrogen production from high and low-temperature electrolysis methods using solar and nuclear energy sources: The transition to a hydrogen economy in Brazil. Int. J. Hydrogen Energy 2022, 47, 34727–34738. [Google Scholar] [CrossRef]
  20. Di Micco, S.; Romano, F.; Jannelli, E.; Perna, A.; Minutillo, M. Techno-economic analysis of a multi-energy system for the co-production of green hydrogen, renewable electricity and heat. Int. J. Hydrogen Energy 2023, 48, 31457–31467. [Google Scholar] [CrossRef]
  21. Shi, J.; Zhu, Y.; Feng, Y.; Yang, J.; Xia, C. A Prompt Decarbonization Pathway for Shipping: Green Hydrogen, Ammonia, and Methanol Production and Utilization in Marine Engines. Atmosphere 2023, 14, 584. [Google Scholar] [CrossRef]
  22. Wappler, M.; Unguder, D.; Lu, X.; Ohlmeyer, H.; Teschke, H.; Lueke, W. Building the green hydrogen market—Current state and outlook on green hydrogen demand and electrolyzer manufacturing. Int. J. Hydrogen Energy 2022, 47, 33551–33570. [Google Scholar] [CrossRef]
  23. Fragiacomo, P.; Genovese, M.; Piraino, F.; Massari, F.; Boroomandnia, M. Analysis of a distributed green hydrogen infrastructure designed to support the sustainable mobility of a heavy-duty fleet. Int. J. Hydrogen Energy 2023, 51, 576–594. [Google Scholar] [CrossRef]
  24. Benalcazar, P.; Komorowska, A. Prospects of green hydrogen in Poland: A techno-economic analysis using a Monte Carlo approach. Int. J. Hydrogen Energy 2022, 47, 5779–5796. [Google Scholar] [CrossRef]
  25. Lee, Y.; Jung, J.; Song, H. Public acceptance of hydrogen buses through policy instrument: Local government perceptions in Changwon city. Int. J. Hydrogen Energy 2023, 48, 13377–13389. [Google Scholar] [CrossRef]
  26. Jurkovic, M.; Kalina, T.; Skrúcaný, T.; Gorzelanczyk, P.; L’upták, V. Environmental Impacts of Introducing LNG as Alternative Fuel for Urban Buses—Case Study in Slovakia. Promet-Traffic Transp. 2020, 32, 837–847. [Google Scholar] [CrossRef]
  27. Gechev, T.; Punov, P.; Barta, D. Model Investigation of the Performance of SI ICE Fueled by Gasoline, Methane, Hydrogen and SOFC Anode Off-Gas. In Proceedings of the 15th Electrical Engineering Faculty Conference, BulEF 2023, Varna, Bulgaria, 16–19 September 2023. [Google Scholar] [CrossRef]
  28. Grzybek, G.; Wasiłek, O.; Rudzińska, M.; Stelmachowski, P.; Legutko, P.; Greluk, M.; Kotarba, A. Developing alumina-based cobalt catalyst for efficient hydrogen production via the ethanol steam reforming process. Catal. Today 2024, 439, 114808. [Google Scholar] [CrossRef]
  29. Haoran, C.; Xia, Y.; Wei, W.; Yongzhi, Z.; Bo, Z.; Leiqi, Z. Safety and efficiency problems of hydrogen production from alkaline water electrolyzers driven by renewable energy sources. Int. J. Hydrogen Energy 2023, 54, 700–712. [Google Scholar] [CrossRef]
  30. Hassan, Q.; Algburi, S.; Sameen, A.Z.; Salman, H.M.; Jaszczur, M. Green hydrogen: A pathway to a sustainable energy future. Int. J. Hydrogen Energy 2024, 50, 310–333. [Google Scholar] [CrossRef]
  31. Iqbal, S.; Aftab, K.; Jannat, F.; Baig, M.A.; Kalsoom, U. A bibliographic analysis of optimization of hydrogen production via electrochemical method using machine learning. Fuel 2024, 372, 132126. [Google Scholar] [CrossRef]
  32. Jałowiec, T.; Grala, D.; Maśloch, P.; Wojtaszek, H.; Maśloch, G.; Wójcik-Czerniawska, A. Analysis of the Implementation of Functional Hydrogen Assumptions in Poland and Germany. Energies 2022, 15, 8383. [Google Scholar] [CrossRef]
  33. Ji, M.; Wang, J. Review and comparison of various hydrogen production methods based on costs and life cycle impact assessment indicators. Int. J. Hydrogen Energy 2021, 46, 38612–38635. [Google Scholar] [CrossRef]
  34. Makhsoos, A.; Kandidayeni, M.; Pollet, B.G.; Boulon, L. A perspective on increasing the efficiency of proton exchange membrane water electrolyzers—A review. Int. J. Hydrogen Energy 2023, 48, 15341–15370. [Google Scholar] [CrossRef]
  35. León, M.; Silva, J.; Ortíz-Soto, R.; Carrasco, S. A Techno-Economic Study for Off-Grid Green Hydrogen Production Plants: The Case of Chile. Energies 2023, 16, 5327. [Google Scholar] [CrossRef]
  36. Lin, Y.; Yang, H.; Ma, L.; Li, Z.; Ni, W. Low-Carbon Development for the Iron and Steel Industry in China and the World: Status Quo, Future Vision, and Key Actions. Sustainability 2021, 13, 12548. [Google Scholar] [CrossRef]
  37. Nouni, M.R.; Manna, J. Green Hydrogen: An Introduction. In Challenges and Opportunities in Green Hydrogen Production; Springer Nature: Singapore, 2024; pp. 9–38. [Google Scholar]
  38. Perna, A.; Jannelli, E.; Di Micco, S.; Romano, F.; Minutillo, M. Designing, sizing and economic feasibility of a green hydrogen supply chain for maritime transportation. Energy Convers. Manag. 2023, 278, 116702. [Google Scholar] [CrossRef]
  39. Rasul, G.; Hazrat, M.A.; Sattar, M.A.; Jahirul, M.I.; Shearer, M.J. The future of hydrogen: Challenges on production, storage and applications. Energy Convers. Manag. 2022, 272, 116326. [Google Scholar] [CrossRef]
  40. Ruan, X.; Meng, D.; Huang, C.; Xu, M.; Jiao, D.; Cheng, H.; Yu, J. Artificial photosynthetic system with spatial dual reduction site enabling enhanced solar hydrogen production. Adv. Mater. 2024, 36, 2309199. [Google Scholar] [CrossRef]
  41. Šalipur, H.; Manojlović, D.; Milošević, K.; Fronczak, M.; Silva, A.G.; Lončarević, D.; Dostanić, J. Unraveling the solar and visible light-induced deactivation mechanism of Pt-decorated carbon/TiO2 nanocomposite in photocatalytic hydrogen production. J. Environ. Chem. Eng. 2024, 12, 112862. [Google Scholar] [CrossRef]
  42. Singla, M.K.; Gupta, J.; Beryozkina, S.; Safaraliev, M.; Singh, M. The colorful economics of hydrogen: Assessing the costs and viability of different hydrogen production methods—A review. Int. J. Hydrogen Energy 2024, 61, 664–677. [Google Scholar] [CrossRef]
  43. Sun, Z.; Chen, X.; Kuo, P.-C.; Ding, L.; Aziz, M. Co-feeding biomass and municipal solid waste for enhanced hydrogen and synthetic natural gas yields employing chemical looping process. Chem. Eng. J. 2024, 493, 152487. [Google Scholar] [CrossRef]
  44. Wu, Q.; Huang, F.; Zhao, M.; Xu, J.; Zhou, J.; Wang, Y. Ultra-small yellow defective TiO2 nanoparticles for co-catalyst free photocatalytic hydrogen production. Nano Energy 2016, 24, 63–71. [Google Scholar] [CrossRef]
  45. Kandpal, V.; Jaswal, A.; Santibanez Gonzalez, E.D.; Agarwal, N. Sustainable Energy Transition, Circular Economy, and ESG Practices. In Sustainable Energy Transition: Circular Economy and Sustainable Financing for Environmental, Social and Governance (ESG) Practices; Springer Nature: Cham, Switzerland, 2024; pp. 1–51. [Google Scholar]
  46. Griffiths, S.; Sovacool, B.K.; Kim, J.; Bazilian, M.; Uratani, J.M. Industrial decarbonization via hydrogen: A critical and systematic review of developments, socio-technical systems and policy options. Energy Res. Soc. Sci. 2021, 80, 102208. [Google Scholar] [CrossRef]
  47. Marouani, I.; Guesmi, T.; Alshammari, B.M.; Alqunun, K.; Alzamil, A.; Alturki, M.; Hadj Abdallah, H. Integration of Renewable-Energy-Based Green Hydrogen into the Energy Future. Processes 2023, 11, 2685. [Google Scholar] [CrossRef]
  48. Gale, F.; Goodwin, D.; Lovell, H.; Murphy-Gregory, H.; Beasy, K.; Schoen, M. Renewable hydrogen standards, certifications, and labels: A state-of-the-art review from a sustainability systems governance perspective. Int. J. Hydrogen Energy 2024, 59, 654–667. [Google Scholar] [CrossRef]
  49. Genovese, M.; Cigolotti, V.; Jannelli, E.; Fragiacomo, P. Current standards and configurations for the permitting and operation of hydrogen refueling stations. Int. J. Hydrogen Energy 2023, 48, 19357–19371. [Google Scholar] [CrossRef]
  50. Mendrela, P.; Stanek, W.; Simla, T. Sustainability assessment of hydrogen production based on nuclear energy. Int. J. Hydrogen Energy 2024, 49, 729–744. [Google Scholar] [CrossRef]
  51. Muñoz Díaz, M.T.; Chávez Oróstica, H.; Guajardo, J. Economic Analysis: Green Hydrogen Production Systems. Processes 2023, 11, 1390. [Google Scholar] [CrossRef]
  52. Ma, N.; Zhao, W.; Wang, W.; Li, X.; Zhou, H. Large scale of green hydrogen storage: Opportunities and challenges. Int. J. Hydrogen Energy 2023, 50, 379–396. [Google Scholar] [CrossRef]
  53. Kulik, A.C.; Tonolo, É.A.; Scortegagna, A.K.; da Silva, J.E.; Urbanetz Junior, J. Analysis of Scenarios for the Insertion of Electric Vehicles in Conjunction with a Solar Carport in the City of Curitiba, Paraná—Brazil. Energies 2021, 14, 5027. [Google Scholar] [CrossRef]
  54. Ghotge, R.; Nijssen, K.P.; Annema, J.A.; Lukszo, Z. Use before You Choose: What Do EV Drivers Think about V2G after Experiencing It? Energies 2022, 15, 4907. [Google Scholar] [CrossRef]
  55. Vandewetering, N.; Hayibo, K.S.; Pearce, J.M. Open-Source Photovoltaic—Electrical Vehicle Carport Designs. Technologies 2022, 10, 114. [Google Scholar] [CrossRef]
  56. Ranganathan, E.; Natarajan, R. Spotted Hyena Optimization Method for Harvesting Maximum PV Power under Uniform and Partial-Shade Conditions. Energies 2022, 15, 2850. [Google Scholar] [CrossRef]
  57. Sokolovskij, E.; Małek, A.; Caban, J.; Dudziak, A.; Matijošius, J.; Marciniak, A. Selection of a Photovoltaic Carport Power for an Electric Vehicle. Energies 2023, 16, 3126. [Google Scholar] [CrossRef]
  58. Tashie-Lewis, B.C.; Nnabuife, S.G. Hydrogen Production, Distribution, Storage and Power Conversion in a Hydrogen Economy—A Technology Review. Chem. Eng. J. Adv. 2021, 8, 100172. [Google Scholar] [CrossRef]
  59. Reddy, V.J.; Hariram, N.P.; Maity, R.; Ghazali, M.F.; Kumarasamy, S. Sustainable E-Fuels: Green Hydrogen, Methanol and Ammonia for Carbon-Neutral Transportation. World Electr. Veh. J. 2023, 14, 349. [Google Scholar] [CrossRef]
  60. Sarker, A.K.; Azad, A.K.; Rasul, M.G.; Doppalapudi, A.T. Prospect of Green Hydrogen Generation from Hybrid Renewable Energy Sources: A Review. Energies 2023, 16, 1556. [Google Scholar] [CrossRef]
  61. Centi, G.; Perathoner, S. Rethinking chemical production with “green” hydrogen. Pure Appl. Chem. 2024, 96, 471–477. [Google Scholar] [CrossRef]
  62. Keelin, T.W.; Chrisman, L.; Savage, S.L. The metalog distributions and extremely accurate sums of lognormals in closed form. In Proceedings of the 2019 Winter Simulation Conference (WSC), National Harbor, MD, USA, 8–12 December 2019; pp. 3074–3085. [Google Scholar] [CrossRef]
  63. Keelin, T.W. The Metalog Distributions. Decis. Anal. 2016, 13, 243–277. [Google Scholar] [CrossRef]
  64. Available online: https://blogs.sas.com/content/iml/2023/02/22/metalog-distribution.html (accessed on 11 August 2024).
  65. Available online: https://download.bayesfusion.com/files.html?category=Academia (accessed on 11 August 2024).
  66. Patiño, J.J.; Velásquez, C.; Ramirez, E.; Betancur, R.; Montoya, J.F.; Chica, E.; Romero-Gómez, P.; Kannan, A.M.; Ramírez, D.; Eusse, P.; et al. Renewable Energy Sources for Green Hydrogen Generation in Colombia and Applicable Case of Studies. Energies 2023, 16, 7809. [Google Scholar] [CrossRef]
  67. Hassan, Q.; Abdulrahman, I.S.; Salman, H.M.; Olapade, O.T.; Jaszczur, M. Techno-Economic Assessment of Green Hydrogen Production by an Off-Grid Photovoltaic Energy System. Energies 2023, 16, 744. [Google Scholar] [CrossRef]
  68. Małek, A.; Karowiec, R.; Jóżwik, K. A review of technologies in the area of production, storage and use of hydrogen in the automotive industry. Arch. Automot. Eng.—Arch. Motoryz. 2023, 102, 41–67. [Google Scholar] [CrossRef]
  69. Cosgun, A.E.; Demir, H. Investigating the Effect of Albedo in Simulation-Based Floating Photovoltaic System: 1 MW Bifacial Floating Photovoltaic System Design. Energies 2024, 17, 959. [Google Scholar] [CrossRef]
  70. Shah, H.H.; Bareschino, P.; Mancusi, E.; Pepe, F. Environmental Life Cycle Analysis and Energy Payback Period Evaluation of Solar PV Systems: The Case of Pakistan. Energies 2023, 16, 6400. [Google Scholar] [CrossRef]
  71. Idzikowski, A.; Cierlicki, T.; Al-Zubiedy, A.; Zawada, M. Management the Operation Process of Photovoltaic Modules in Terms of Quality and Performance Evaluation—A Case Study. Energies 2022, 15, 1652. [Google Scholar] [CrossRef]
  72. Qureshi, M.A.; Torelli, F.; Musumeci, S.; Reatti, A.; Mazza, A.; Chicco, G. A Novel Adaptive Control Approach for Maximum Power-Point Tracking in Photovoltaic Systems. Energies 2023, 16, 2782. [Google Scholar] [CrossRef]
  73. Livera, A.; Tziolis, G.; Franquelo, J.G.; Bernal, R.G.; Georghiou, G.E. Cloud-Based Platform for Photovoltaic Assets Diagnosis and Maintenance. Energies 2022, 15, 7760. [Google Scholar] [CrossRef]
  74. Dall’Armi, C.; Pivetta, D.; Taccani, R. Hybrid PEM Fuel Cell Power Plants Fuelled by Hydrogen for Improving Sustainability in Shipping: State of the Art and Review on Active Projects. Energies 2023, 16, 2022. [Google Scholar] [CrossRef]
  75. Folgado, F.J.; Orellana, D.; González, I.; Calderón, A.J. Processes Supervision System for Green Hydrogen Production: Experimental Characterization and Data Acquisition of PEM Electrolyzer. Eng. Proc. 2022, 19, 36. [Google Scholar] [CrossRef]
  76. Cao, X.; Wang, J.; Zhao, P.; Xia, H.; Li, Y.; Sun, L.; He, W. Hydrogen Production System Using Alkaline Water Electrolysis Adapting to Fast Fluctuating Photovoltaic Power. Energies 2023, 16, 3308. [Google Scholar] [CrossRef]
  77. Faqeeh, A.H.; Symes, M.D. A standard electrolyzer test cell design for evaluating catalysts and cell components for anion exchange membrane water electrolysis. Electrochim. Acta 2023, 444, 142030. [Google Scholar] [CrossRef]
  78. Ghazian, N.; Lortie, C.J. A Review of the Roots of Ecological Engineering and its Principles. J. Ecol. Eng. 2024, 25, 345–357. [Google Scholar] [CrossRef]
  79. Available online: https://handbook.enapter.com/electrolyser/el41/ (accessed on 13 August 2024).
  80. Yang, R.; Mohamed, A.; Kim, K. Optimal design and flow-field pattern selection of proton exchange membrane electrolyzers using artificial intelligence. Energy 2023, 264, 126135. [Google Scholar] [CrossRef]
  81. Vidales, A.G.; Millan, N.C.; Bock, C. Modeling of anion exchange membrane water electrolyzers: The influence of operating parameters. Chem. Eng. Res. Des. 2023, 194, 636–648. [Google Scholar] [CrossRef]
  82. Xu, Y.; Cai, S.; Chi, B.; Tu, Z. Technological limitations and recent developments in a solid oxide electrolyzer cell: A review. Int. J. Hydrogen Energy 2023, 50, 548–591. [Google Scholar] [CrossRef]
  83. Martinez Lopez, V.A.; Ziar, H.; Haverkort, J.W.; Zeman, M.; Isabella, O. Dynamic operation of water electrolyzers: A review for applications in photovoltaic systems integration. Renew. Sustain. Energy Rev. 2023, 182, 113407. [Google Scholar] [CrossRef]
  84. Available online: https://www.enapter.com/faqs/ (accessed on 13 June 2024).
  85. Illa Font, C.H.; Siqueira, H.V.; Machado Neto, J.E.; Santos, J.L.F.d.; Stevan, S.L., Jr.; Converti, A.; Corrêa, F.C. Second Life of Lithium-Ion Batteries of Electric Vehicles: A Short Review and Perspectives. Energies 2023, 16, 953. [Google Scholar] [CrossRef]
  86. Nováková, K.; Pražanová, A.; Stroe, D.-I.; Knap, V. Second-Life of Lithium-Ion Batteries from Electric Vehicles: Concept, Aging, Testing, and Applications. Energies 2023, 16, 2345. [Google Scholar] [CrossRef]
  87. Li, N.; Lukszo, Z.; Schmitz, J. An approach for sizing a PV–battery–electrolyzer–fuel cell energy system: A case study at a field lab. Renew. Sustain. Energy Rev. 2023, 181, 113308. [Google Scholar] [CrossRef]
  88. Sarker, M.T.; Haram, M.H.S.M.; Shern, S.J.; Ramasamy, G.; Al Farid, F. Second-Life Electric Vehicle Batteries for Home Photovoltaic Systems: Transforming Energy Storage and Sustainability. Energies 2024, 17, 2345. [Google Scholar] [CrossRef]
  89. Vinci, G.; Arangia, V.C.; Ruggieri, R.; Savastano, M.; Ruggeri, M. Reuse of Lithium Iron Phosphate (LiFePO4) Batteries from a Life Cycle Assessment Perspective: The Second-Life Case Study. Energies 2024, 17, 2544. [Google Scholar] [CrossRef]
  90. Guenther, L.H.; Klein, V.; Loef, G.; Pohl, A.; Okube, H.; Winterbur, R.; Röwer, G.; Wegener, B.; Goertz, R.; Bracke, S. Second Life for Lithium-Ion Traction Batteries. Sustainability 2024, 16, 7288. [Google Scholar] [CrossRef]
  91. Apachitei, G.; Heymer, R.; Lain, M.; Dogaru, D.; Hidalgo, M.; Marco, J.; Copley, M. Scale-Up of Lithium Iron Phosphate Cathodes with High Active Materials Contents for Lithium Ion Cells. Batteries 2023, 9, 518. [Google Scholar] [CrossRef]
  92. Vasconcelos, D.d.S.; Tenório, J.A.S.; Botelho Junior, A.B.; Espinosa, D.C.R. Circular Recycling Strategies for LFP Batteries: A Review Focusing on Hydrometallurgy Sustainable Processing. Metals 2023, 13, 543. [Google Scholar] [CrossRef]
  93. Neunzling, J.; Winter, H.; Henriques, D.; Fleckenstein, M.; Markus, T. Online State-of-Health Estimation for NMC Lithium-Ion Batteries Using an Observer Structure. Batteries 2023, 9, 494. [Google Scholar] [CrossRef]
  94. Accardo, A.; Dotelli, G.; Musa, M.L.; Spessa, E. Life Cycle Assessment of an NMC Battery for Application to Electric Light-Duty Commercial Vehicles and Comparison with a Sodium-Nickel-Chloride Battery. Appl. Sci. 2021, 11, 1160. [Google Scholar] [CrossRef]
  95. Yang, J.; Beatty, M.; Strickland, D.; Abedi-Varnosfaderani, M.; Warren, J. Second-Life Battery Capacity Estimation and Method Comparison. Energies 2023, 16, 3244. [Google Scholar] [CrossRef]
  96. Available online: https://monitoringpublic.solaredge.com/solaredge-web/p/site/public?name=Robert%20D.&locale=pl_PL#/dashboard (accessed on 23 August 2024).
  97. Available online: https://monitoringpublic.solaredge.com/solaredge-web/p/site/public?name=GioDomOvestSudEst&locale=pl_PL#/dashboard (accessed on 23 August 2024).
  98. Nestler, S.; Keelin, T. Introducing the Metalog Distributions. Significance 2022, 19, 31–33. [Google Scholar] [CrossRef]
  99. Małek, A.; Taccani, R.; Kasperek, D.; Hunicz, J. Optimization of Energy Management in a City Bus Powered by the Hydrogen Fuel Cells. Commun.—Sci. Lett. Univ. Zilina 2021, 23, E56–E67. [Google Scholar] [CrossRef]
Figure 1. The appearance of a photovoltaic carport with a vehicle during charging.
Applsci 14 09531 g001
Figure 2. Green hydrogen generation system powered by a photovoltaic carport.
Applsci 14 09531 g002
Figure 3. Steps in implementing research.
Applsci 14 09531 g003
Figure 4. Photovoltaic carport with bifacial panels with a peak power of 6.36 kWp.
Applsci 14 09531 g004
Figure 5. Electrolyzers: (a) multi-cell electrolyzer stack, (b) electrolyzer module with built-in multi-cell stack.
Applsci 14 09531 g005
Figure 6. Three-dimensional models: (a) electrolyzer module, (b) water preparation station and (c) hydrogen dryer [79].
Applsci 14 09531 g006aApplsci 14 09531 g006b
Figure 7. Electrolyzer with energy storage in a container building.
Applsci 14 09531 g007
Figure 8. Data flow and processing diagram in the analytical part of this article.
Applsci 14 09531 g008
Figure 9. Monthly energy production by photovoltaic systems with a peak power of 6.3 kWp located in Poland and Italy.
Applsci 14 09531 g009
Figure 10. Cumulative Distribution Function (CDF) and Probability Density Function (PDF) for the power generated monthly by a 6.3 kWp photovoltaic system placed in Poland.
Applsci 14 09531 g010
Figure 11. Cumulative Distribution Function (CDF) and Probability Density Function (PDF) for the power generated by a 6.3 kWp photovoltaic system placed in Italy.
Applsci 14 09531 g011
Figure 12. Probability of generating particular energy levels per month by photovoltaic systems with a peak power of 6.3 kWp located in Poland and Italy.
Applsci 14 09531 g012
Figure 13. The probability of producing a specific monthly expenditure of low-emission hydrogen using energy from photovoltaic systems located in Poland and Italy.
Applsci 14 09531 g013
Table 1. Basic statistical analysis of the energy generated monthly by a 6.3 kWp photovoltaic system in Poland.
Energy Production [kWh]
Count12
Minimum57.044
Maximum945.084
Mean529.221
StdDev350.765
Table 2. Extended statistical analysis of the energy generated monthly by a 6.3 kWp photovoltaic system in Poland.
ProbabilityEnergy Production [kWh]
0.0557.04399871826
0.25212.4069976807
0.5634.7689819336
0.75871.0469970703
0.95945.083984375
Table 3. Results of the probability of energy production monthly by a 6.3 kWp photovoltaic system in Poland.
Energy Production
[kWh]
Probability
Probability
>
2000.250.75
4000.41670.5833
6000.50.5
8000.66670.3333
Table 4. Basic statistical analysis of the energy generated monthly by a 6.3 kWp photovoltaic system in Italy.
Energy Production [kWh]
Count12
Minimum251.033
Maximum1132.73
Mean711.584
StdDev324.064
Table 5. Extended statistical analysis of the energy generated monthly by a 6.3 kWp photovoltaic system in Italy.
ProbabilityEnergy Production [kWh]
0.05251.0330047607
0.25485.2600097656
0.5780.6019897461
0.751028.311035156
0.951132.729003906
Table 6. Results of the probability of energy production monthly by a 6.3 kWp photovoltaic system in Italy.
Energy Production
[kWh]
Probability
Probability
>
4000.250.75
6000.41670.5833
8000.58330.4167
10000.750.25
Disclaimer/Publisher’s Note: The statements, opinions and data contained in all publications are solely those of the individual author(s) and contributor(s) and not of MDPI and/or the editor(s). MDPI and/or the editor(s) disclaim responsibility for any injury to people or property resulting from any ideas, methods, instructions or products referred to in the content.

