1. Introduction
The growing diversity of the global population, coupled with economic growth, has precipitated a period of accelerated social transformation, necessitating a swift technological response to meet the evolving societal demands. The advancement of new technologies and the advent of machinery have become imperative worldwide, and sustained industrial evolution has enhanced the capacity to respond effectively to societal changes. Conversely, with industrial sophistication and complexity increasing to meet changing societal needs, the number of workers employed in the field has increased, which correspondingly increases the number of occupational accidents, attributable to the hazards to which workers are exposed in their workplaces [
1]. Occupational accidents impose several expenses on workers, including medical treatment and earnings losses. Furthermore, such incidents have an adverse impact on companies or employers, resulting in a loss of labor, reduced productivity, and weakened relationships [
2]. Furthermore, the financial losses incurred owing to occupational accidents present a significant economic burden on the country and are widely acknowledged as a major social issue [
3].
In the United States, the National Institute for Occupational Safety and Health (NIOSH) has developed a comprehensive strategic plan to address a wide range of occupational health and safety risks by identifying high-risk workplaces and at-risk workers [
4]. In the United Kingdom, the changing landscape of workplaces and the expanded role of the Health and Safety Executive (HSE) are being planned to include factors not previously considered, such as occupational accidents related to stress and mental health [
5]. In Germany, the Joint Strategy for Occupational Safety and Health provides for the modernization of their occupational safety and health system and strengthens the role of companies concerning safety and health [
6]. In Japan, the Ministry of Health, Labor, and Welfare has set various goals for preventing occupational accidents and proposed eight priorities and specific response strategies for achieving them [
7]. To effectively reduce occupational accidents and create workplaces with guaranteed life and safety of workers, South Korea has introduced and systematized a system of on-site supervision of high-risk areas with clear responsibilities and roles. The importance of occupational safety is increasingly being recognized globally, and policy support is being sought through various approaches.
Notably, South Korea has recently witnessed stagnation in the trend of reducing occupational accidents, despite several policies supporting the reduction. The situation is highly threatening in countries with a high proportion of manufacturing industries and dense populations. In response, Korea’s Ministry of Employment and Labor has emphasized a “self-discipline prevention system” based on risk assessment (listing and checking accidental risks during work or workplace processes by predicting them from previous cases) to detect and prevent risks. Additionally, it aims to accurately identify and predict workplace accidents based on previous accident cases and implement effective preventive measures. New policy directions are oriented based on accidents at industrial sites and contribute to the resolution of occupational accidents, which are recognized as major social problems. Therefore, accurate records and detailed analyses are required to utilize past cases of occupational accidents. The sources of accident cases have been collected and recorded from the Industrial Accident Compensation Approval Data (for accidents requiring medical treatment for more than four days, the Ministry of Labor and Welfare receives an application from the employer, and the details of the accident are classified and recorded by the Occupational Safety and Health Institute) and the Occupational Accident Investigation Table (for accidents requiring leave of absence for more than three days, the local office of the Ministry of Employment and Labor classifies and records the relevant accidents). The recorded information is converted into statistical data by classification workers (from the Ministry of Employment, Labor and Welfare or the Occupational Safety and Health Agency) based on an accident summary to identify the circumstances surrounding the accident.
During the process of transforming and categorizing data, those engaged in data classification frequently encounter difficulties with certain datasets. The problem primarily results in a declining quality of the original data, which is largely attributable to the subjective nature of input by workers, human error, the presence of homophones, misuse of terminology, and other factors. Conversely, the classification of data on the occurrence type or original cause materials among accident-related information can pose challenges or ambiguity, thereby rendering objective classification unfeasible. Based on existing case studies, the aforementioned issues have the potential to significantly affect the predictability and prevention of future accidents.
This study first addresses the issues related to quality by preprocessing an overview of 23 years of accident case data (approximately 2,100,000 cases) recorded from Korean industrial sites. The preprocessed data are used to develop a model that can classify the occurrence types among the criteria using artificial intelligence (AI) algorithms. Consequently, the developed model, with its objectivity and accuracy, can be used for research and policy development to suppress possible accidents through accident cases. Additionally, the AI model learns words from the original data that affect the accident overview quality, thereby increasing its versatility. Additionally, we expect that analyzing original cause materials closely related to accidents, along with the working environment and other contributing elements, will help reduce accidents. Moreover, we plan to strengthen the role of safety culture and managers by applying systems thinking to safety engineering and emphasizing organizational factors. Through this, we aim to foster a proactive safety culture within organizations and encourage active managerial participation in accident prevention.
2. Literature Review of Artificial Intelligence Model Utilization for Industrial Accident Prevention
The use of AI models for occupational safety differs from traditional statistical research applications. The differences are due to the dependence of data analysis processes on the opinions of experts or practitioners in the field, or the lack of numerical data that leads to biased results. Chi et al. [
8] used a systematic analysis of accident reports and statistical methods to analyze the causes and patterns of work-related fatalities. Jacinto et al. [
9] focused on an in-depth understanding of the causes of work accidents and developed strategic preventive measures. Although such studies have made significant advancements, they face limitations. Most of the methodologies focus on the quantitative aspects of incident data, which makes fully understanding the root causes of incidents or complex interaction patterns difficult [
10]. AI models are being utilized to improve the results of traditional research. Machine learning (ML) models typically use a “two-step approach”, where the first and second steps involve extracting features from data and performing classification or predictions, respectively. G Ahn et al. [
11] analyzed data from the 1665 accident summaries registered with the Korea Occupational Safety and Health Administration from 2007 to 2017 and extracted information. The extracted information was categorized into work type, original cause materials, occurrence type, and number of fatalities. Subsequently, they developed an ontology using a support vector machine (SVM) classification model [
12]. Zhang et al. [
13] used ML models including SVM, linear regression, k-nearest neighbors, decision tree, naive Bayes, and optimized ensemble models to classify construction accident causes. Such approaches require several interventions for feature extraction, have a strong dependency on domain knowledge, and are limited in their ability to handle large amounts of training data [
14].
Recently, deep-learning (DL)-based models have gained traction owing to their generalizability compared to models in previous research. DL-based models are effective in handling large amounts of data and can solve complex non-linear problems with multiple layers. Unlike ML models that are optimized for numerical data, DL-based models can handle various types of data, including images, text, and audio, making them effective at introducing new approaches to the field of occupational safety and producing objective results. Zhang et al. [
15] utilized a recurrent-neural-network-based [
16] long short-term memory (LSTM) [
17] technique to analyze NTSB aviation accident reports. To accurately and objectively identify the causes of aviation accidents, three binary classification models were developed: accident vs. incident, damaged vs. non-damaged, and fatal vs. nonfatal. Nemani et al. [
18] utilized an ensemble of LSTM models to predict the remaining useful life of bearings (for the detection and early prevention of machine failures), prevent unearned machine downtime, increase costs, and prevent potential occupational accidents.
Although LSTM techniques have been utilized in various ways, they pose limitations. Particularly, as LSTM sequentially processes information within a sequence, it can handle text information relatively well before a certain point in time; however, considering information after a certain point in time is difficult [
19]. The problem can be solved using the bidirectional encoder representations from the transformers (BERT) model recently developed by Google [
20]. The BERT model uses a bidirectional transformer encoder to fully understand textual contexts and sentence organization. Luo et al. [
21] utilized the BERT model for text analysis of chemical accident analysis reports. Soft Lexicon and BERT–transformer–conditional random fields were used together to automatically extract valid information from chemical accident reports and suggest ways to identify accident causes and preventive measures. Luo et al. [
22] proposed a method for applying checklists and safety training to the BERT model using health, labor, and accident case data for identifying and preventing accident causes at construction sites.
The use of AI models has gradually become a major research trend in occupational safety due to the improvements in algorithmic limitations of initially developed AI models and the frequent applications of new models. Despite the use of constantly updated AI models, the fundamental problem of natural language processing remains a challenge. In particular, Korean, which is the language considered in this study, presents challenges for AI learning due to its complex sentence structures, the presence of multiple expressions of sentences, and the intricacies of its parts of speech.
Therefore, this study aims to improve the value of basic data for accident prevention by actively utilizing data on occupational accidents at Korean industrial sites. As a huge amount of data is considered, introducing an objective classification method through AI learning to fully reflect the characteristics of the Korean language is necessary. Consequently, the KoBERT [
23] model is adopted as a classification tool for accident cases, and accident outlines recorded as actual accident cases are used as training data. To verify the classification method of the developed model, confusion matrices, precision, recall, and accuracy are utilized as the criteria of occurrence type, which distinguishes the main characteristics of the accidents.
3. Material and Methods
3.1. Overview
Between 2001 and 2023, approximately 2,100,000 occupational accidents occurred in South Korea, including deaths, injuries, and illnesses. Data are provided by the Ministry of Employment and Labor and include “occurrence type” and “accident summary”. “Accident summary” contains information that allows intuitive judgment of occupational accidents that occurred and is organized in the form of a sentence. “Occurrence type” is important information that classifies the final type of industrial accident and is categorized by a code, as listed in
Table 1.
The classification performed based on “accident summary” requires correction for several errors. Human errors (subjectivity, lack of consistency, typology, and misclassification) are mainly caused by the human categorization process and are related to data quality. However, an imbalance exists in the amount of data accumulated annually. The errors are essential for the development of an effective AI classification model and have a significant impact on the improvement of accuracy and reliability. Therefore, we improved the qualitative and quantitative quality of training data in this study by refining sentence components during the preprocessing stage, morphological analysis, keyword replacement by codes, and data augmentation to make the training data robust.
3.2. Improving the Quality of Occupational Accidents
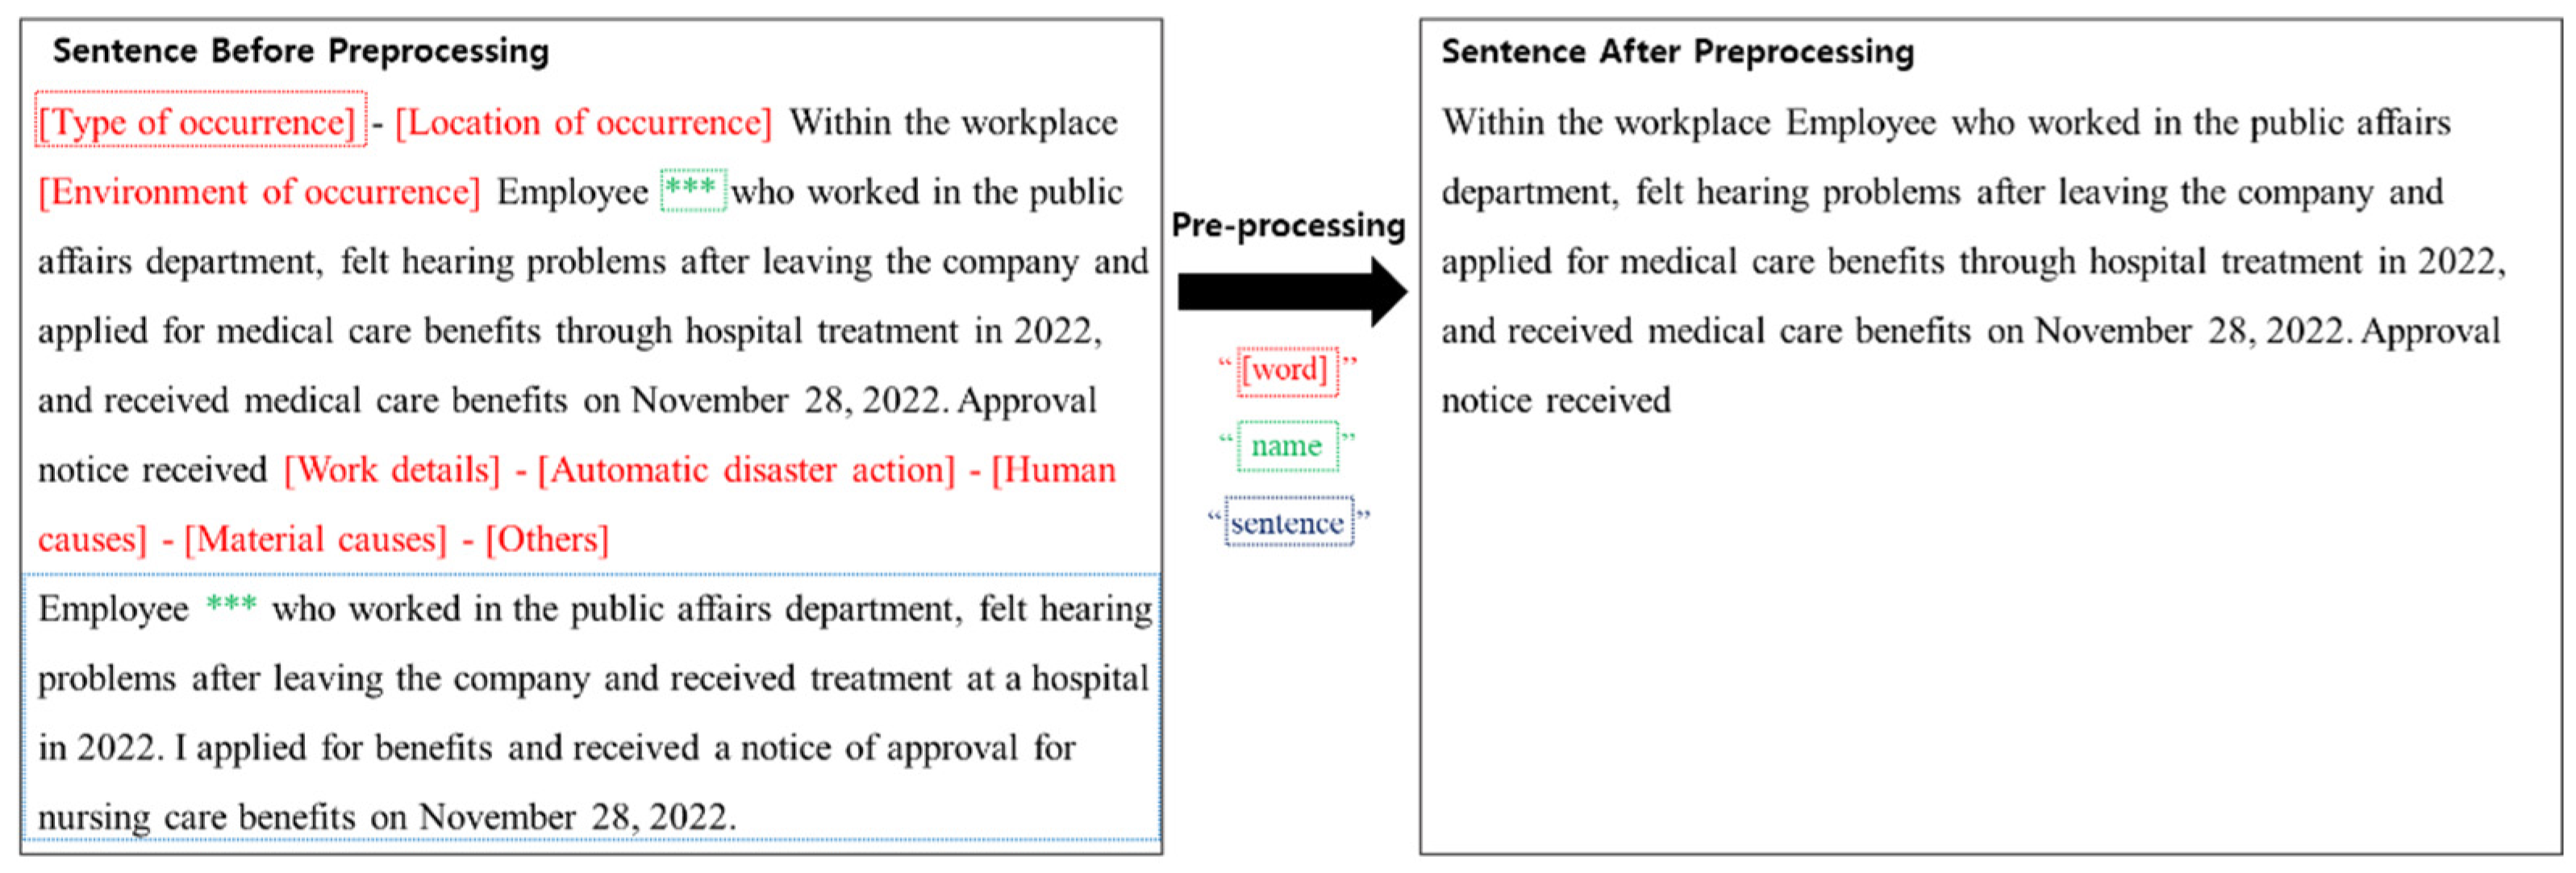
Accident classification can help prevent recurring accidents, specialized accidents with anomalous findings, and accidents of high magnitude or frequency. Therefore, to improve the effectiveness of classification, improving the quality of the “accident summary” is crucial. Therefore, a three-step preprocessing stage was applied in this study. In the first step, unnecessary hieroglyphs in the sentences were removed such that only essential sentence elements could be utilized. Second, the same sentences or words were repeated or made redundant to avoid affecting learning soundness. Finally, unnecessary words irrelevant to the content were excluded. The proposed method is illustrated in
Figure 1.
3.3. Replacement with Similar Keywords
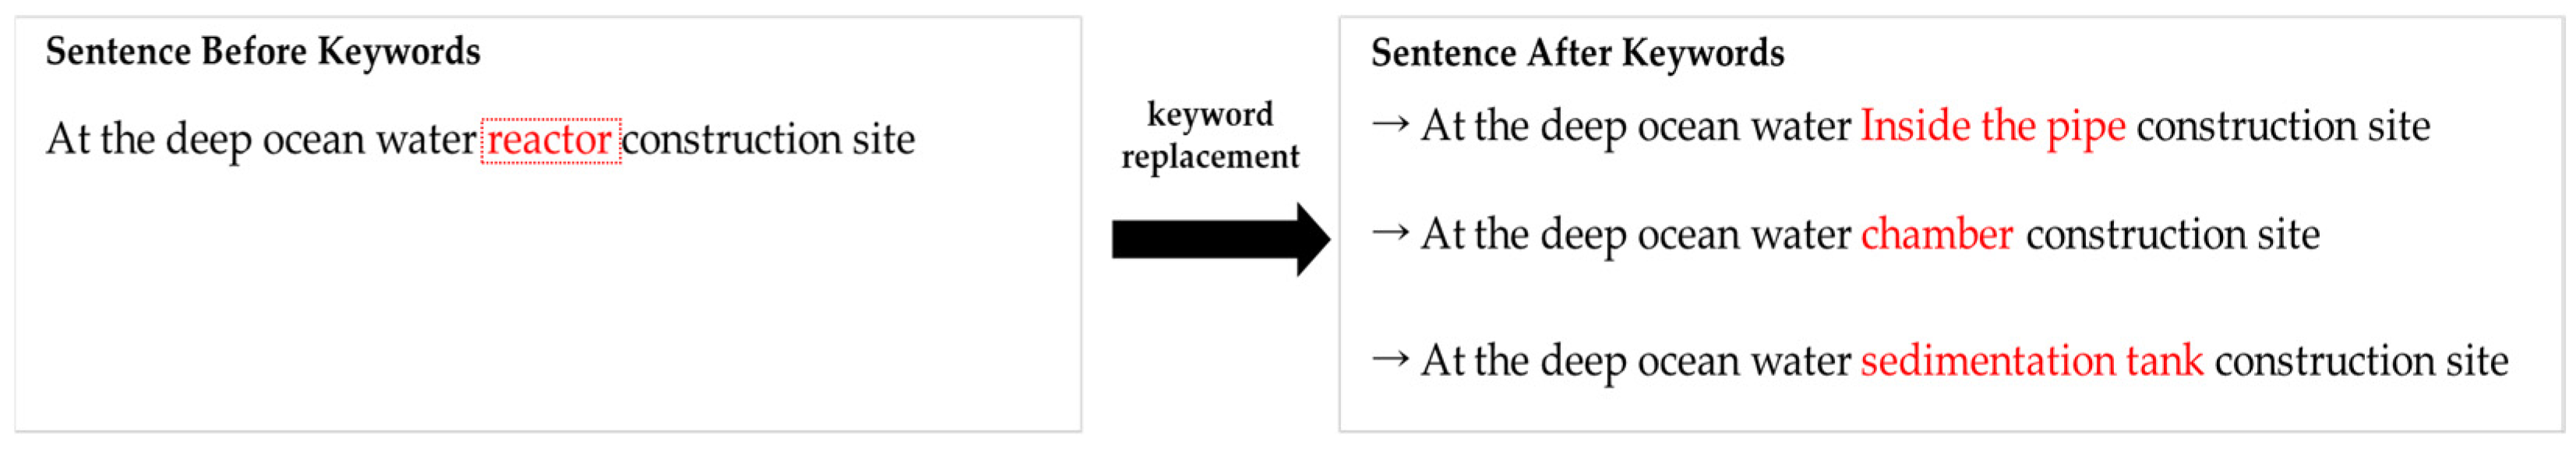
The aforementioned problem remained even after data preprocessing. The possibility of typos, other words, or expressions with the same meaning reduced the efficiency of model training. This issue was resolved by introducing similar keywords. By replacing various dead ends or typos referring to the “occurrence type” with similar keywords, it became possible to achieve model training with improved accuracy and efficiency. Keywords were extracted from the “accident summaries” of the last five years of accident cases. As the data were based on actual incident data, they contributed significantly to improving the prediction performance of the model. Similar keywords were categorized by “occurrence type” and expressed as frequencies by codes (
Table 2).
Similar keywords help models effectively recognize different expressions or words with similar meanings. However, they can contribute to the generation or replacement of sufficient training data, thereby playing an important role in creating robust models that reflect the diversity of natural languages. Additionally, keywords can be used to minimize the quantitative imbalance in training data, which can improve the predictive performance of models. The process of similar keyword replacement is illustrated in
Figure 2.
3.4. Morphological Analysis
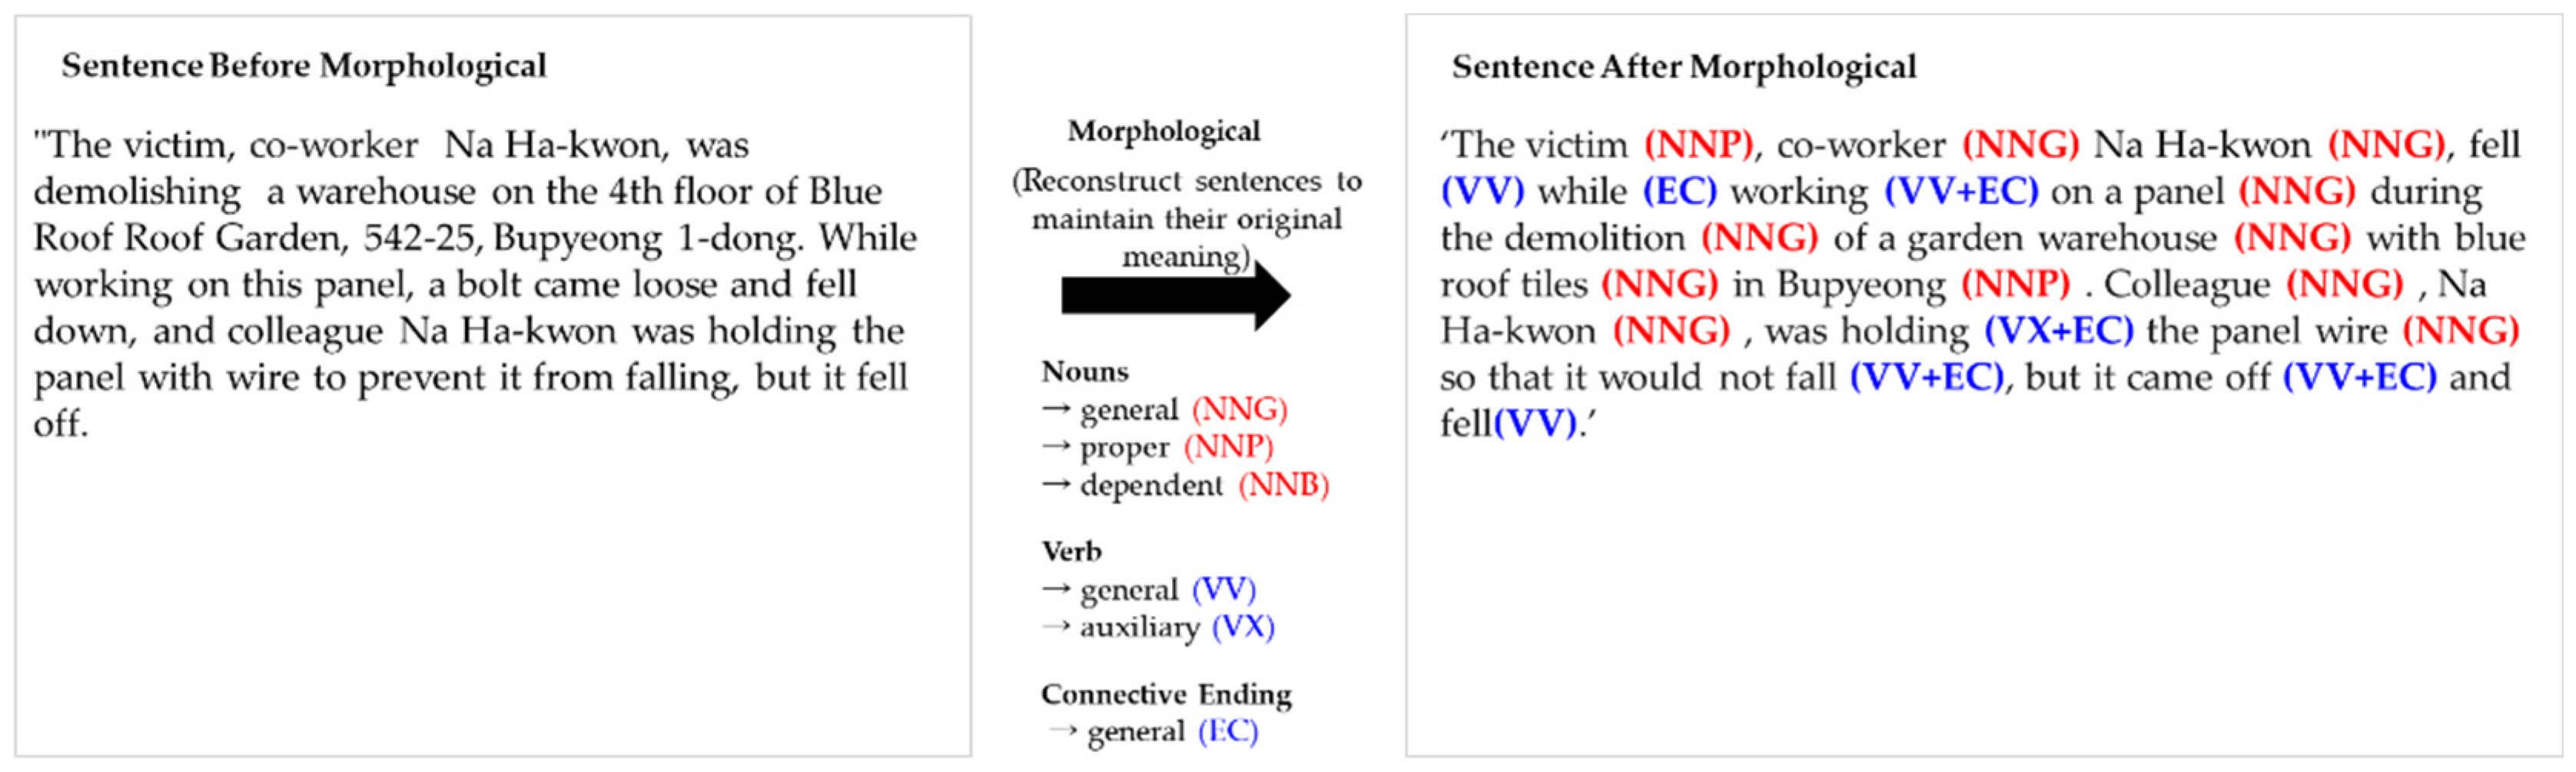
We performed a morphological analysis to better understand the context of replaced keywords or sentences. Morphemes are the smallest units of sentence organization and comprise nouns, verbs, connecting words, and auxiliary words. This analysis assisted in understanding the role of each morpheme in a sentence and how it interacted with other morphemes. By transforming textual data into a more structured form, KoBERT models effectively learn from data, improve model performance, and enable more accurate predictions.
Figure 3 illustrates the results of text extraction through morphological analysis, which contributed to the effective search and categorization of data.
3.5. Application of the KoBERT Model
The KoBERT model was characterized by pretraining Korean Wikipedia and news articles to improve Korean processing performance. The model was fine-tuned specifically for Koreans, as illustrated in
Figure 4, similar to the BERT model that uses the self-attention mechanism of the transformer to understand the meaning and relationships of sentences.
The final output involved classifying a sentence into 1 of 27 occurrence types using a vector corresponding to the position of the [CLS] token ([CLS] summarized the overall context of the sentence, which was used to classify the sentence), as illustrated in
Figure 4. The [CLS] token summarized the context of the entire sentence, allowing the determination of the class to which the sentence belonged. The KoBERT model used GluonNLP’s pretrained SentencePieceTokenizer as the tokenizer.
3.6. System Configuration and Settings for Deep Learning
The system used for training was configured with Ubuntu Linux, AMD 7742, NVIDIA A100ⅹ4, 1TB of memory, Python 3.7.16, and PyTorch 1.12, as listed in
Table 3.
The training settings were configured as listed in
Table 4, and the epoch was run 20 times for each model to ensure sufficient training. For stable and generalized learning, the optimizer used adaptive moment estimation (Adam), and the warmup ratio was set to 0.1 to prevent weight updates from being extremely large in the early stages of learning and causing instability. The batch size was common to all three models and was set to 240, which was the largest size available for our computer environment.
3.7. Constructing and Describing the Training Dataset
The augmented counts using the original data, similar keywords, and the morphological analysis method proposed in this study are listed in
Table 5.
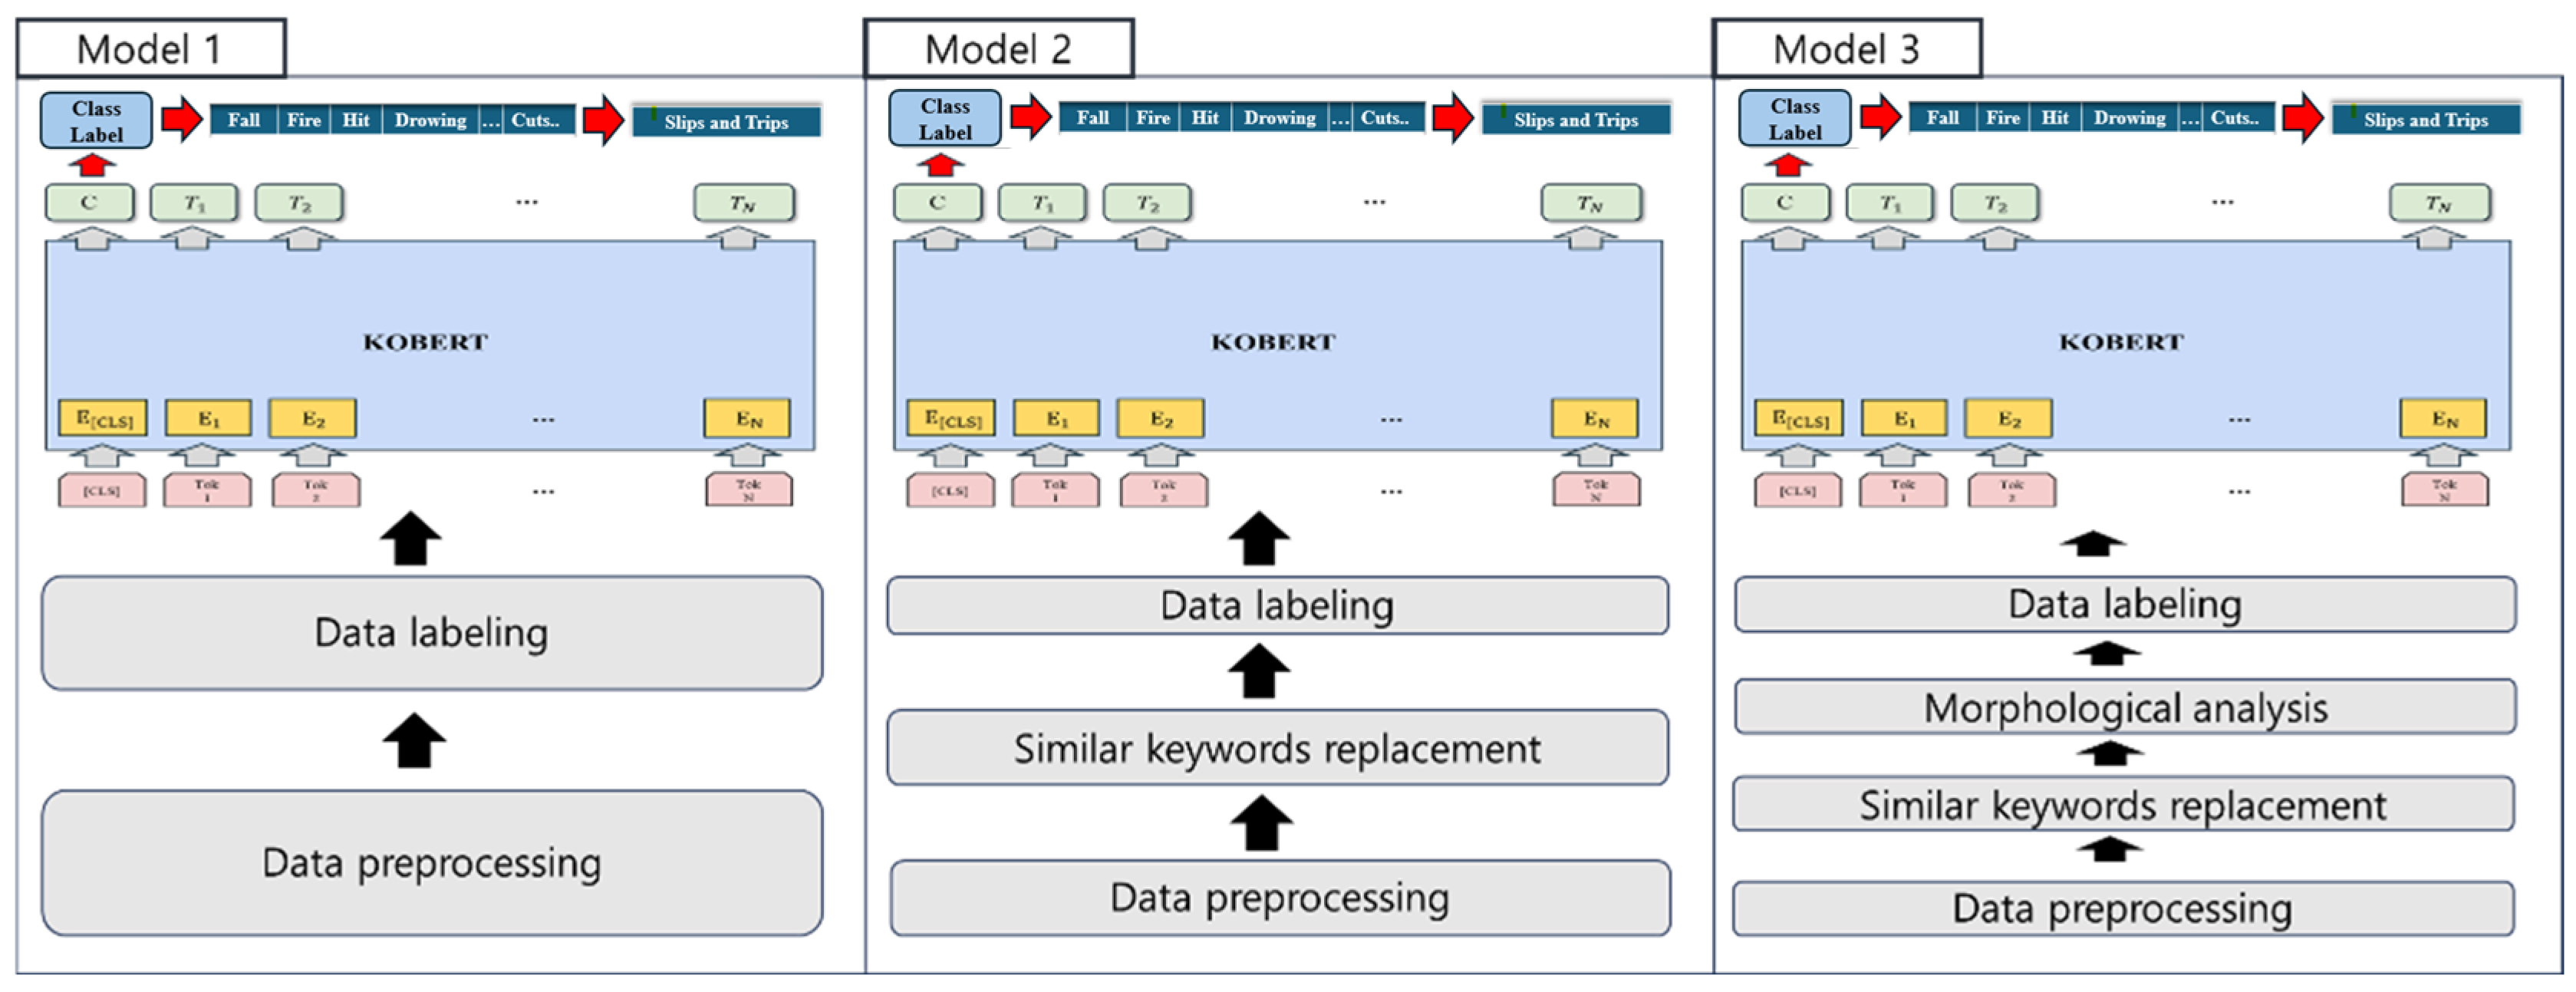
Each occurrence type in the source data represented a different degree of accident occurrence. Particularly, slips and trips, caught in/between objects, falls, and hits were items that occurred frequently owing to the work activities and movements of workers without being limited by the location of the industrial site. However, maritime and aviation accidents, asphyxiation, and drowning demonstrated a relatively small number of original data because they occurred when working in a specific place, situation, or time. To resolve the data imbalance, we augmented the data using appropriate keywords for each occurrence type; however, for occurrence types that lacked similar keywords, the problem of data imbalance was not completely resolved because of insufficient data augmentation. Therefore, we further increased the number of data points for each occurrence type using morphological analysis. The resulting dataset was applied to Models 1, 2, and 3. The dataset for Model 1 was trained using the original data presented in
Table 5 without any additional tuning, and the results are shown in
Table 6 and
Figure 5.
In Model 2, we used the keyword replacement augmented data provided in
Table 5, which utilized approximately 20,000 data points per code. The exception involved the unclassifiable category, which had fewer keyword replacements and fewer cases collected; therefore, we limited the number of augmented data to 10,000 or less. The results are presented in
Table 7 and
Figure 6.
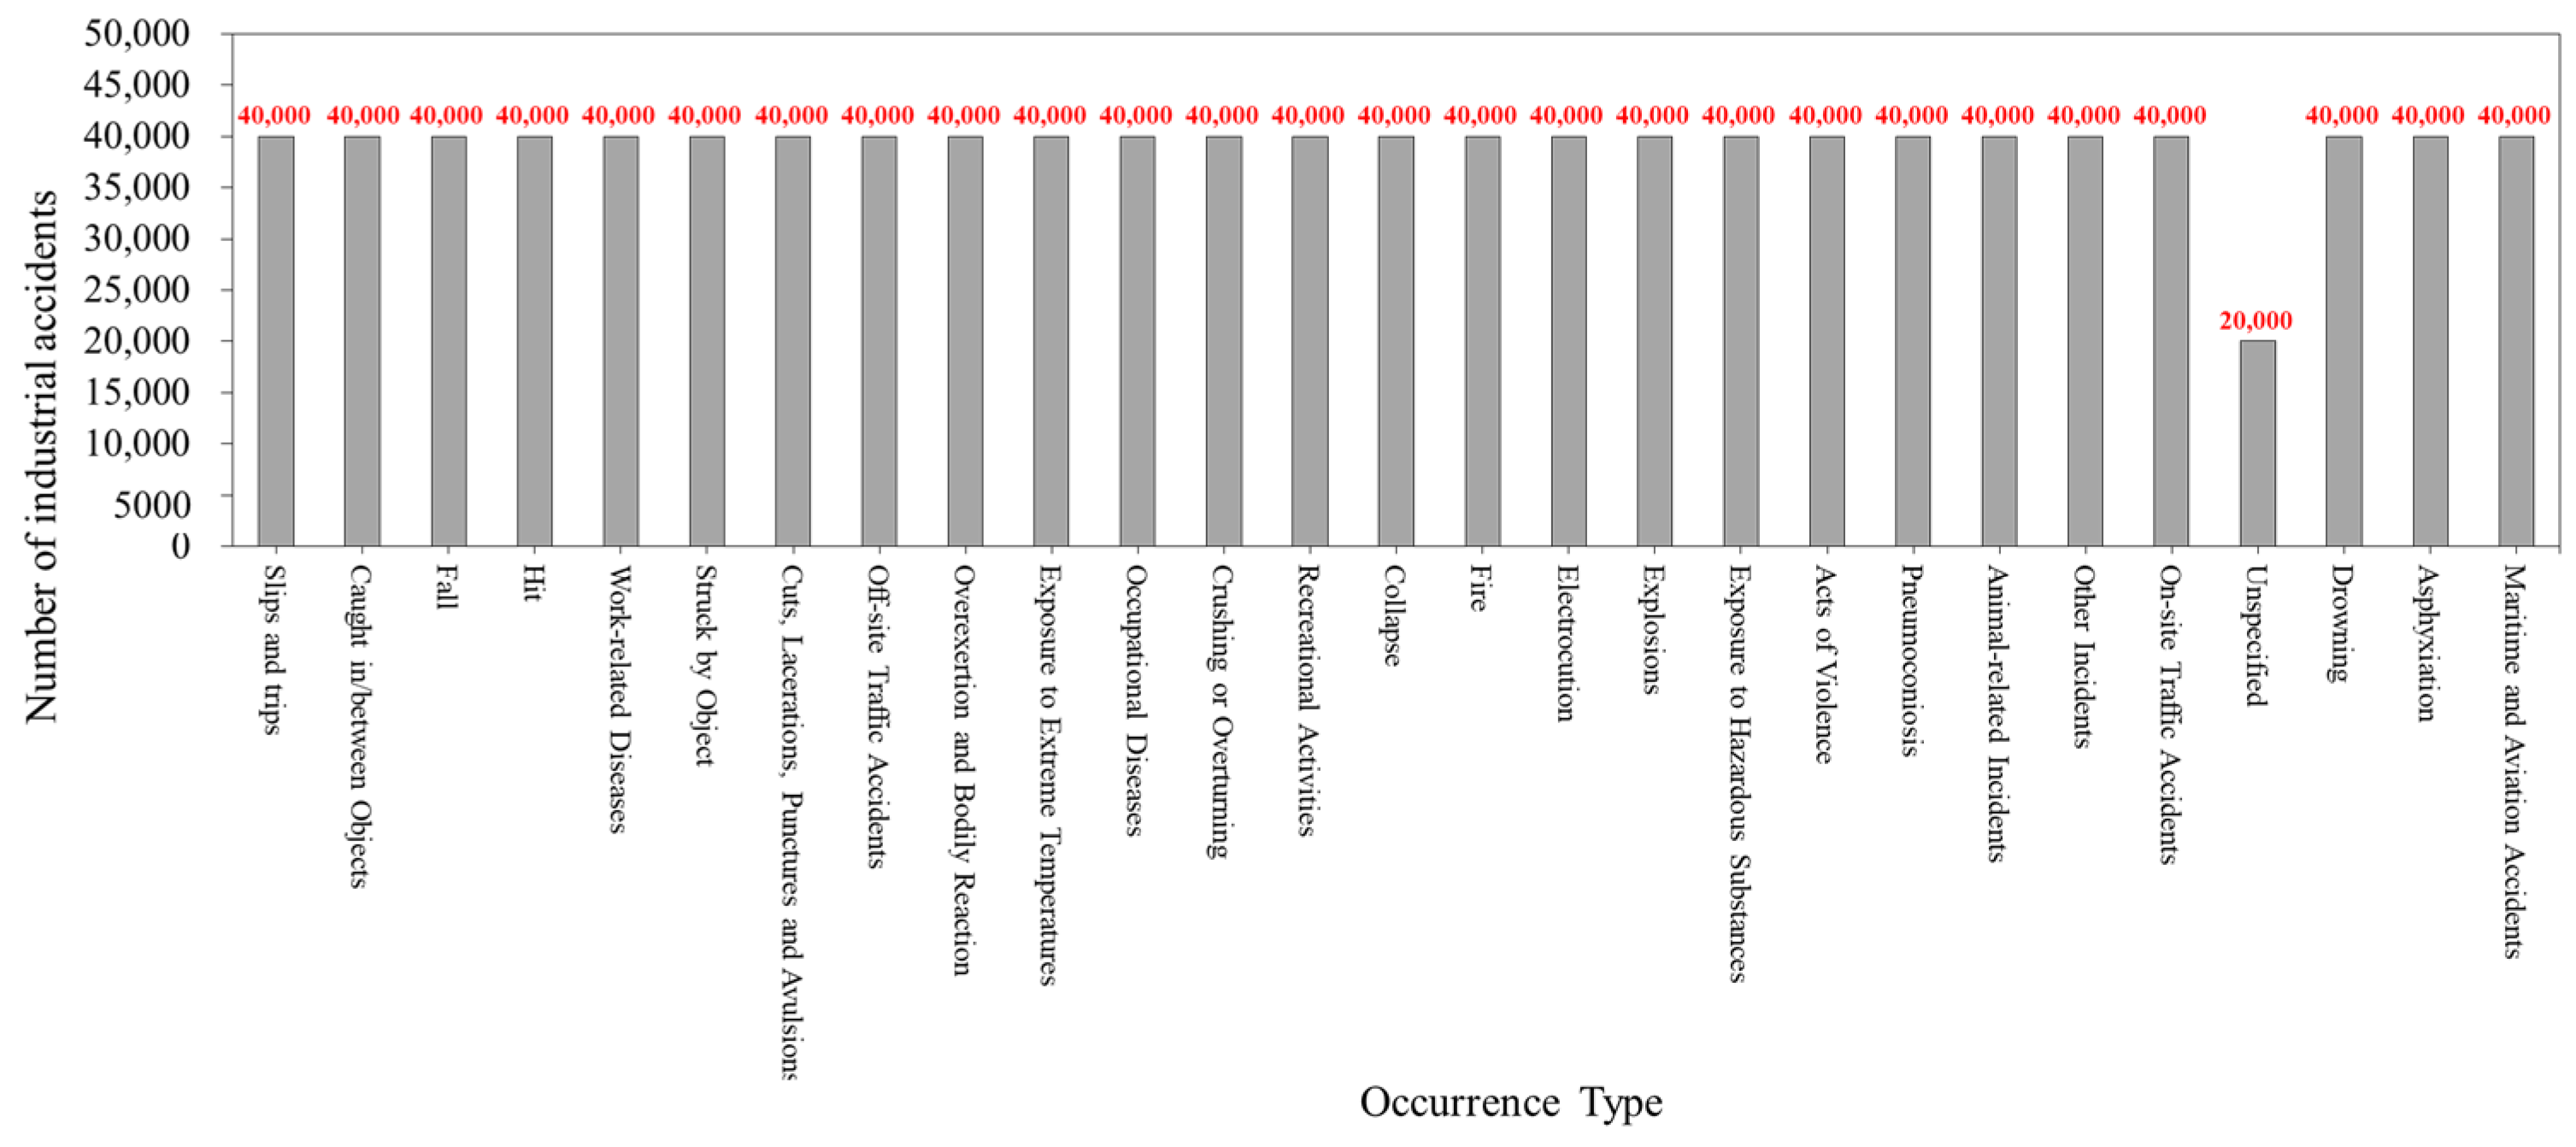
For Model 3, we used the keyword replacement and morpheme-augmented data presented in
Table 5 and utilized approximately 40,000 data points. As in Model 2, we limited the amount of data after augmentation to 20,000 or less for unclassifiable items. The results are presented in
Table 8 and
Figure 7.
The dataset for each model was divided into training, test, and validation datasets at a ratio of 8:1:1. The training dataset was trained according to the variable set for DL and implemented in each classification model. The test set was used to validate model performance during training, and the final classification model was evaluated using an independent validation set (original data not used for training).
4. Results and Experimental
4.1. Validation of Each Model According to Various Parameters
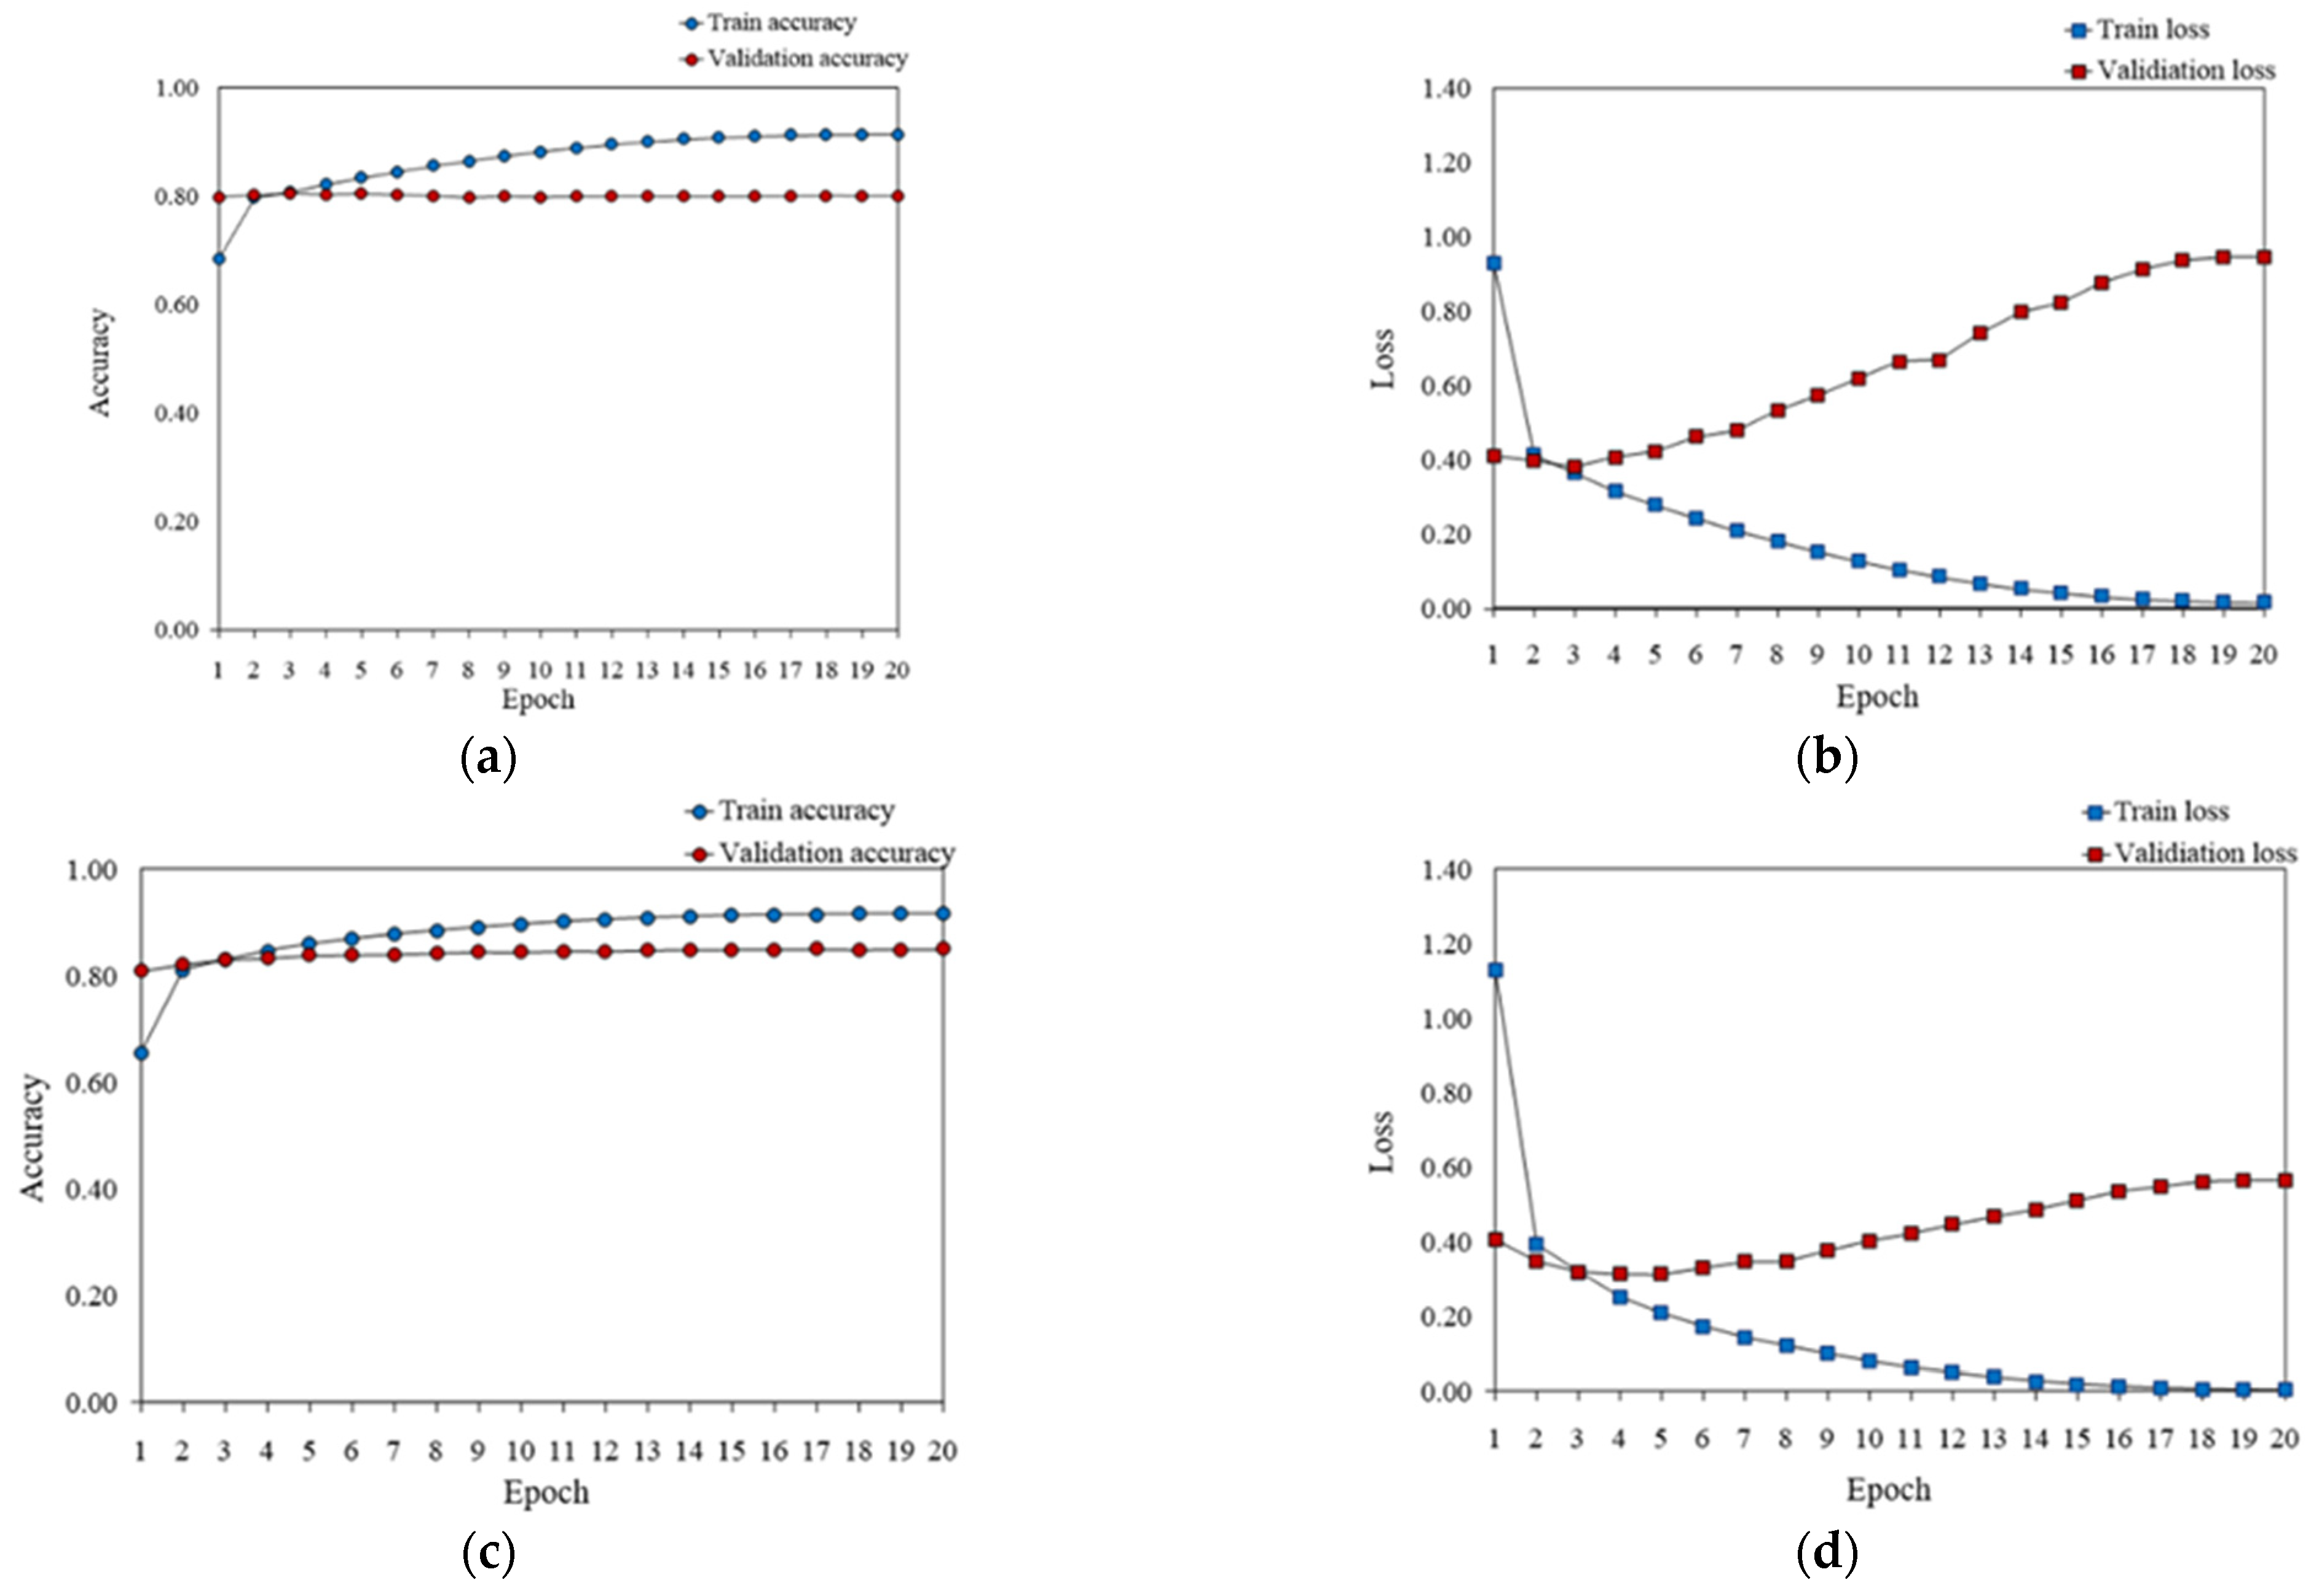
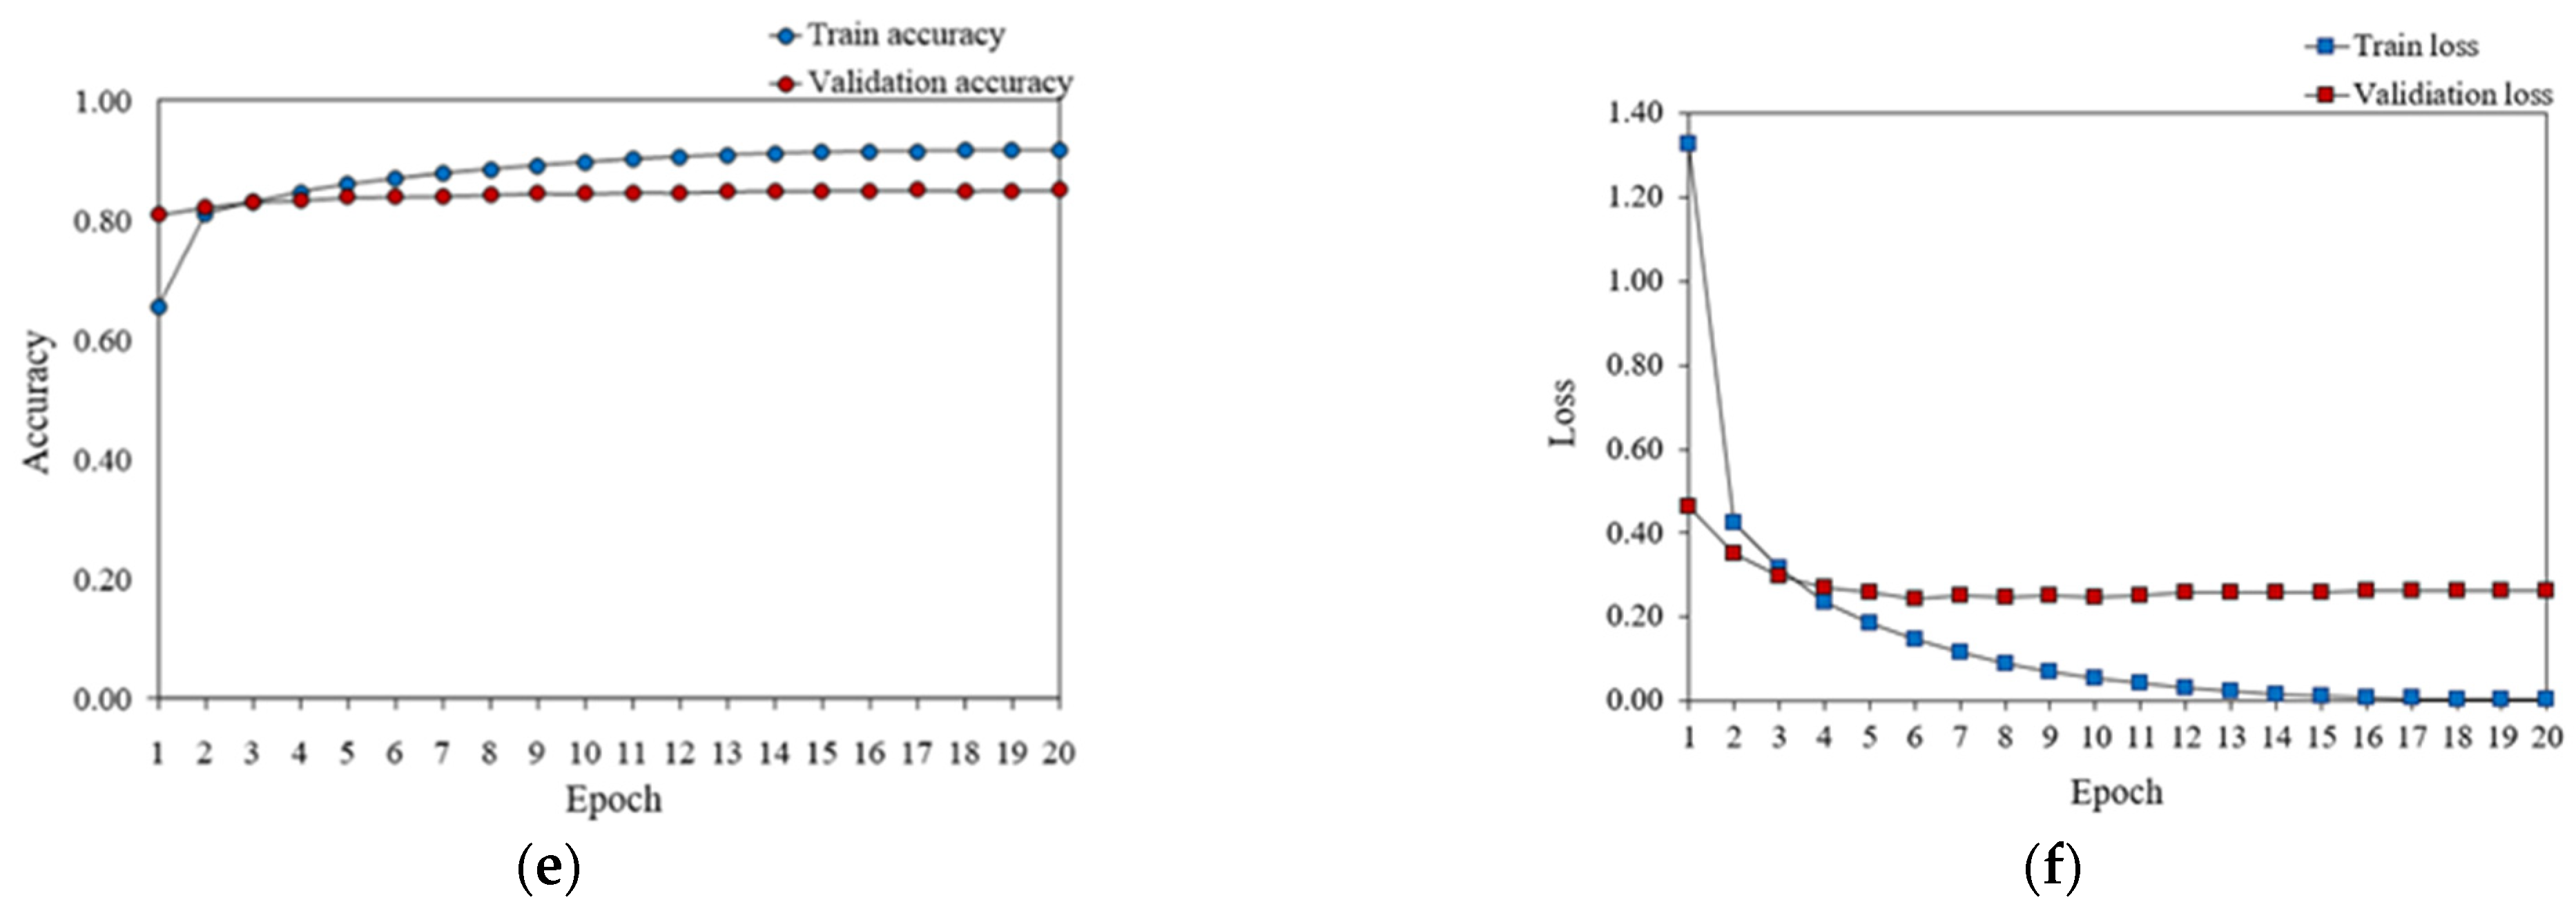
The three models were analyzed in terms of accuracy and loss per epoch using the training and validation sets to indicate how well the model predicted the training or validation data.
Figure 8 illustrates the accuracy and loss results of each model per epoch.
Accuracy was interpreted as an improvement in prediction performance as the difference between the training and validation data decreased. Conversely, as the training progressed, the curve became a better fit for the training data, and the training accuracy converged to nearly 100%. However, when the loss became divergent, the curve suffered from overfitting. Therefore, the curve should converge after a certain point to avoid problems.
In Model 1, when the training accuracy converged to 100% as the epochs progressed, a difference in validation accuracy occurred. When the validation accuracy converged to 87% (more than a 5% difference in accuracy), the training accuracy reached 92%; however, there was no positive effect as the epochs progressed. As the training loss of Model 1 converged to zero, the validation loss gradually increased, which could be interpreted as a sign of overfitting. Further details are presented in
Table 9.
In Model 2, the training accuracy reached 99% when the validation accuracy converged to 93% (within a 6–7% accuracy difference), indicating a tendency for accuracy to improve with epochs. The training loss in Model 2 converged to zero, while the validation loss gradually increased, as in Model 1, and then converged at epochs above 18; however, it exhibited a tendency to overfit. Further details are presented in
Table 10.
In Model 3, the training accuracy was 99% when the validation accuracy converged to 95% (within a 4–5% accuracy difference), and the accuracy reached 96% when the epoch was 20. The training loss in Model 3 also converged to zero, similar to the previous models, and the validation loss converged when the number of epochs was 16 or more. Further details are presented in
Table 11.
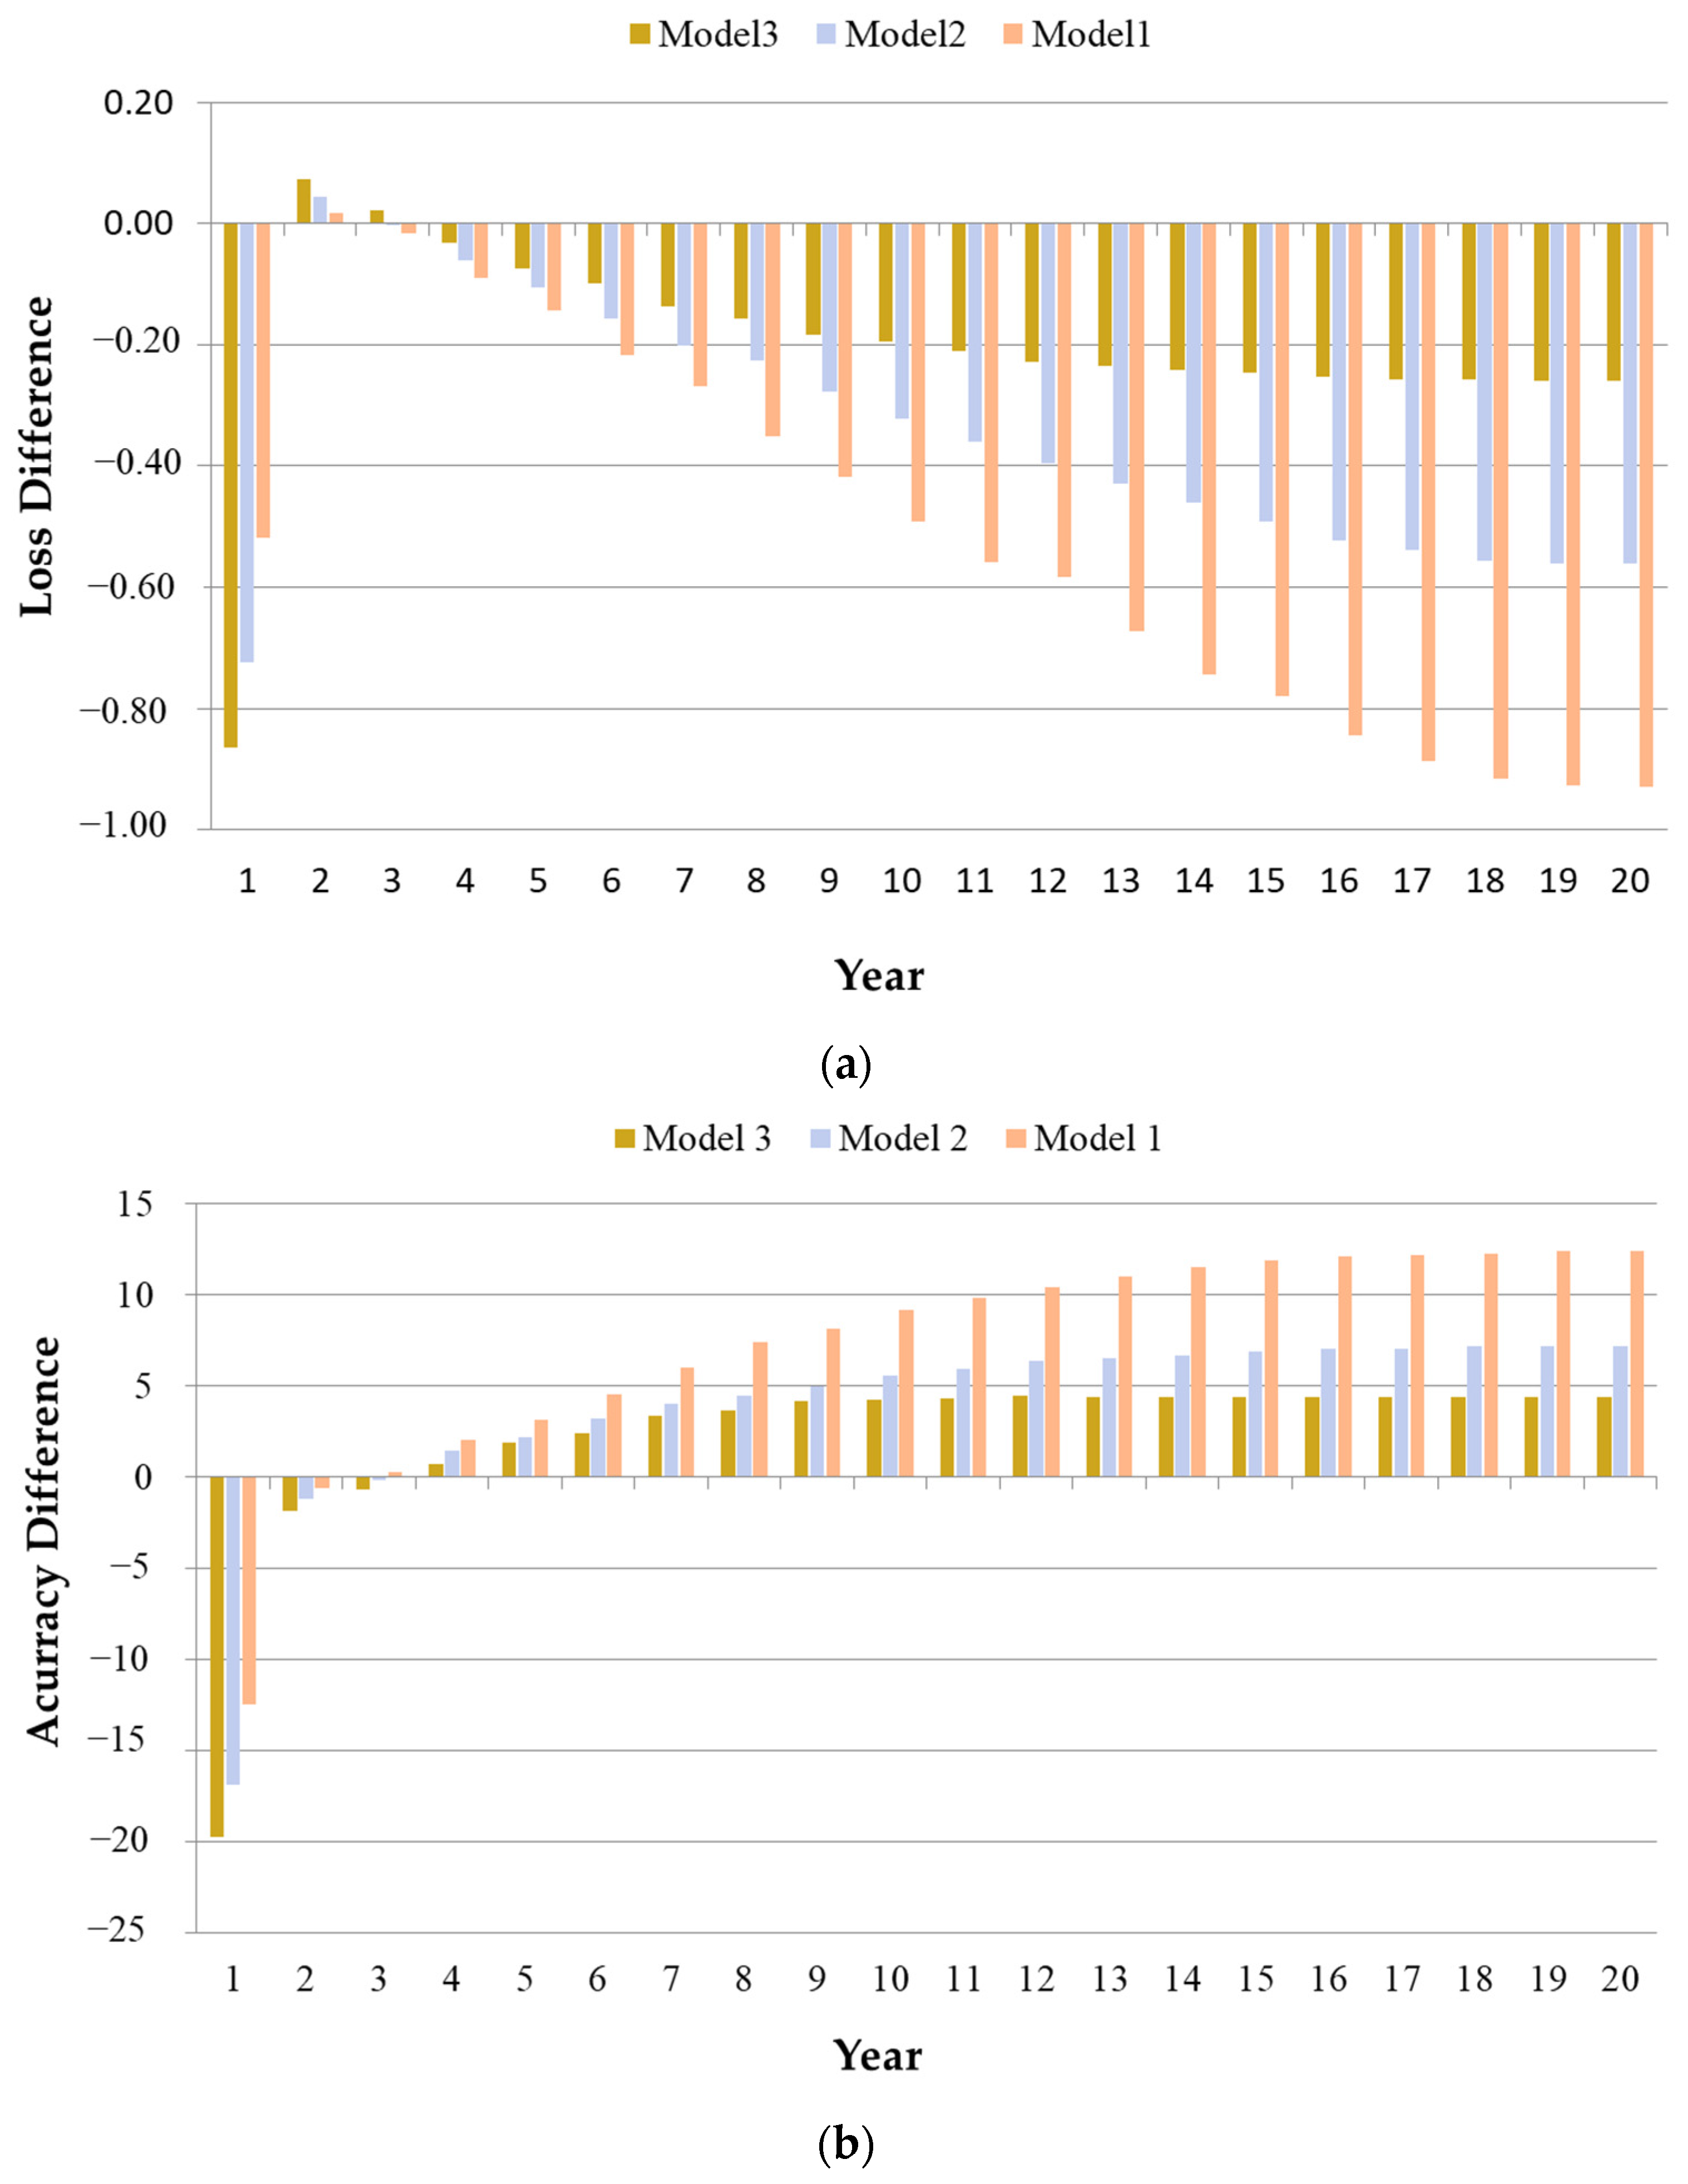
With each epoch, the model was increasingly fit to the training data, which was manifested by the training accuracy reaching 100%, or a loss converging to zero. Thus, the model learned the training data perfectly, but it also introduced the possibility of overfitting. Overfitting occurred when the model was well fitted to the training data and became less predictive of new data. However, the validation accuracy and loss converged to a certain value. Thus, the ability of the model to generalize new data was established, as illustrated in
Figure 9.
The performance of the classification models and their tendency to overfit were identified based on the difference between accuracy and loss. The performance of the classification model showed that the accuracy improved with the performance of the classification model, from Models 1, 2, and 3. Similarly, the difference between the training and validation losses eliminated the overfitting problem in Model 3. Therefore, Model 3, proposed in this study, exhibited the best classification performance for both the new and training data.
4.2. Comparison of Experiment Results
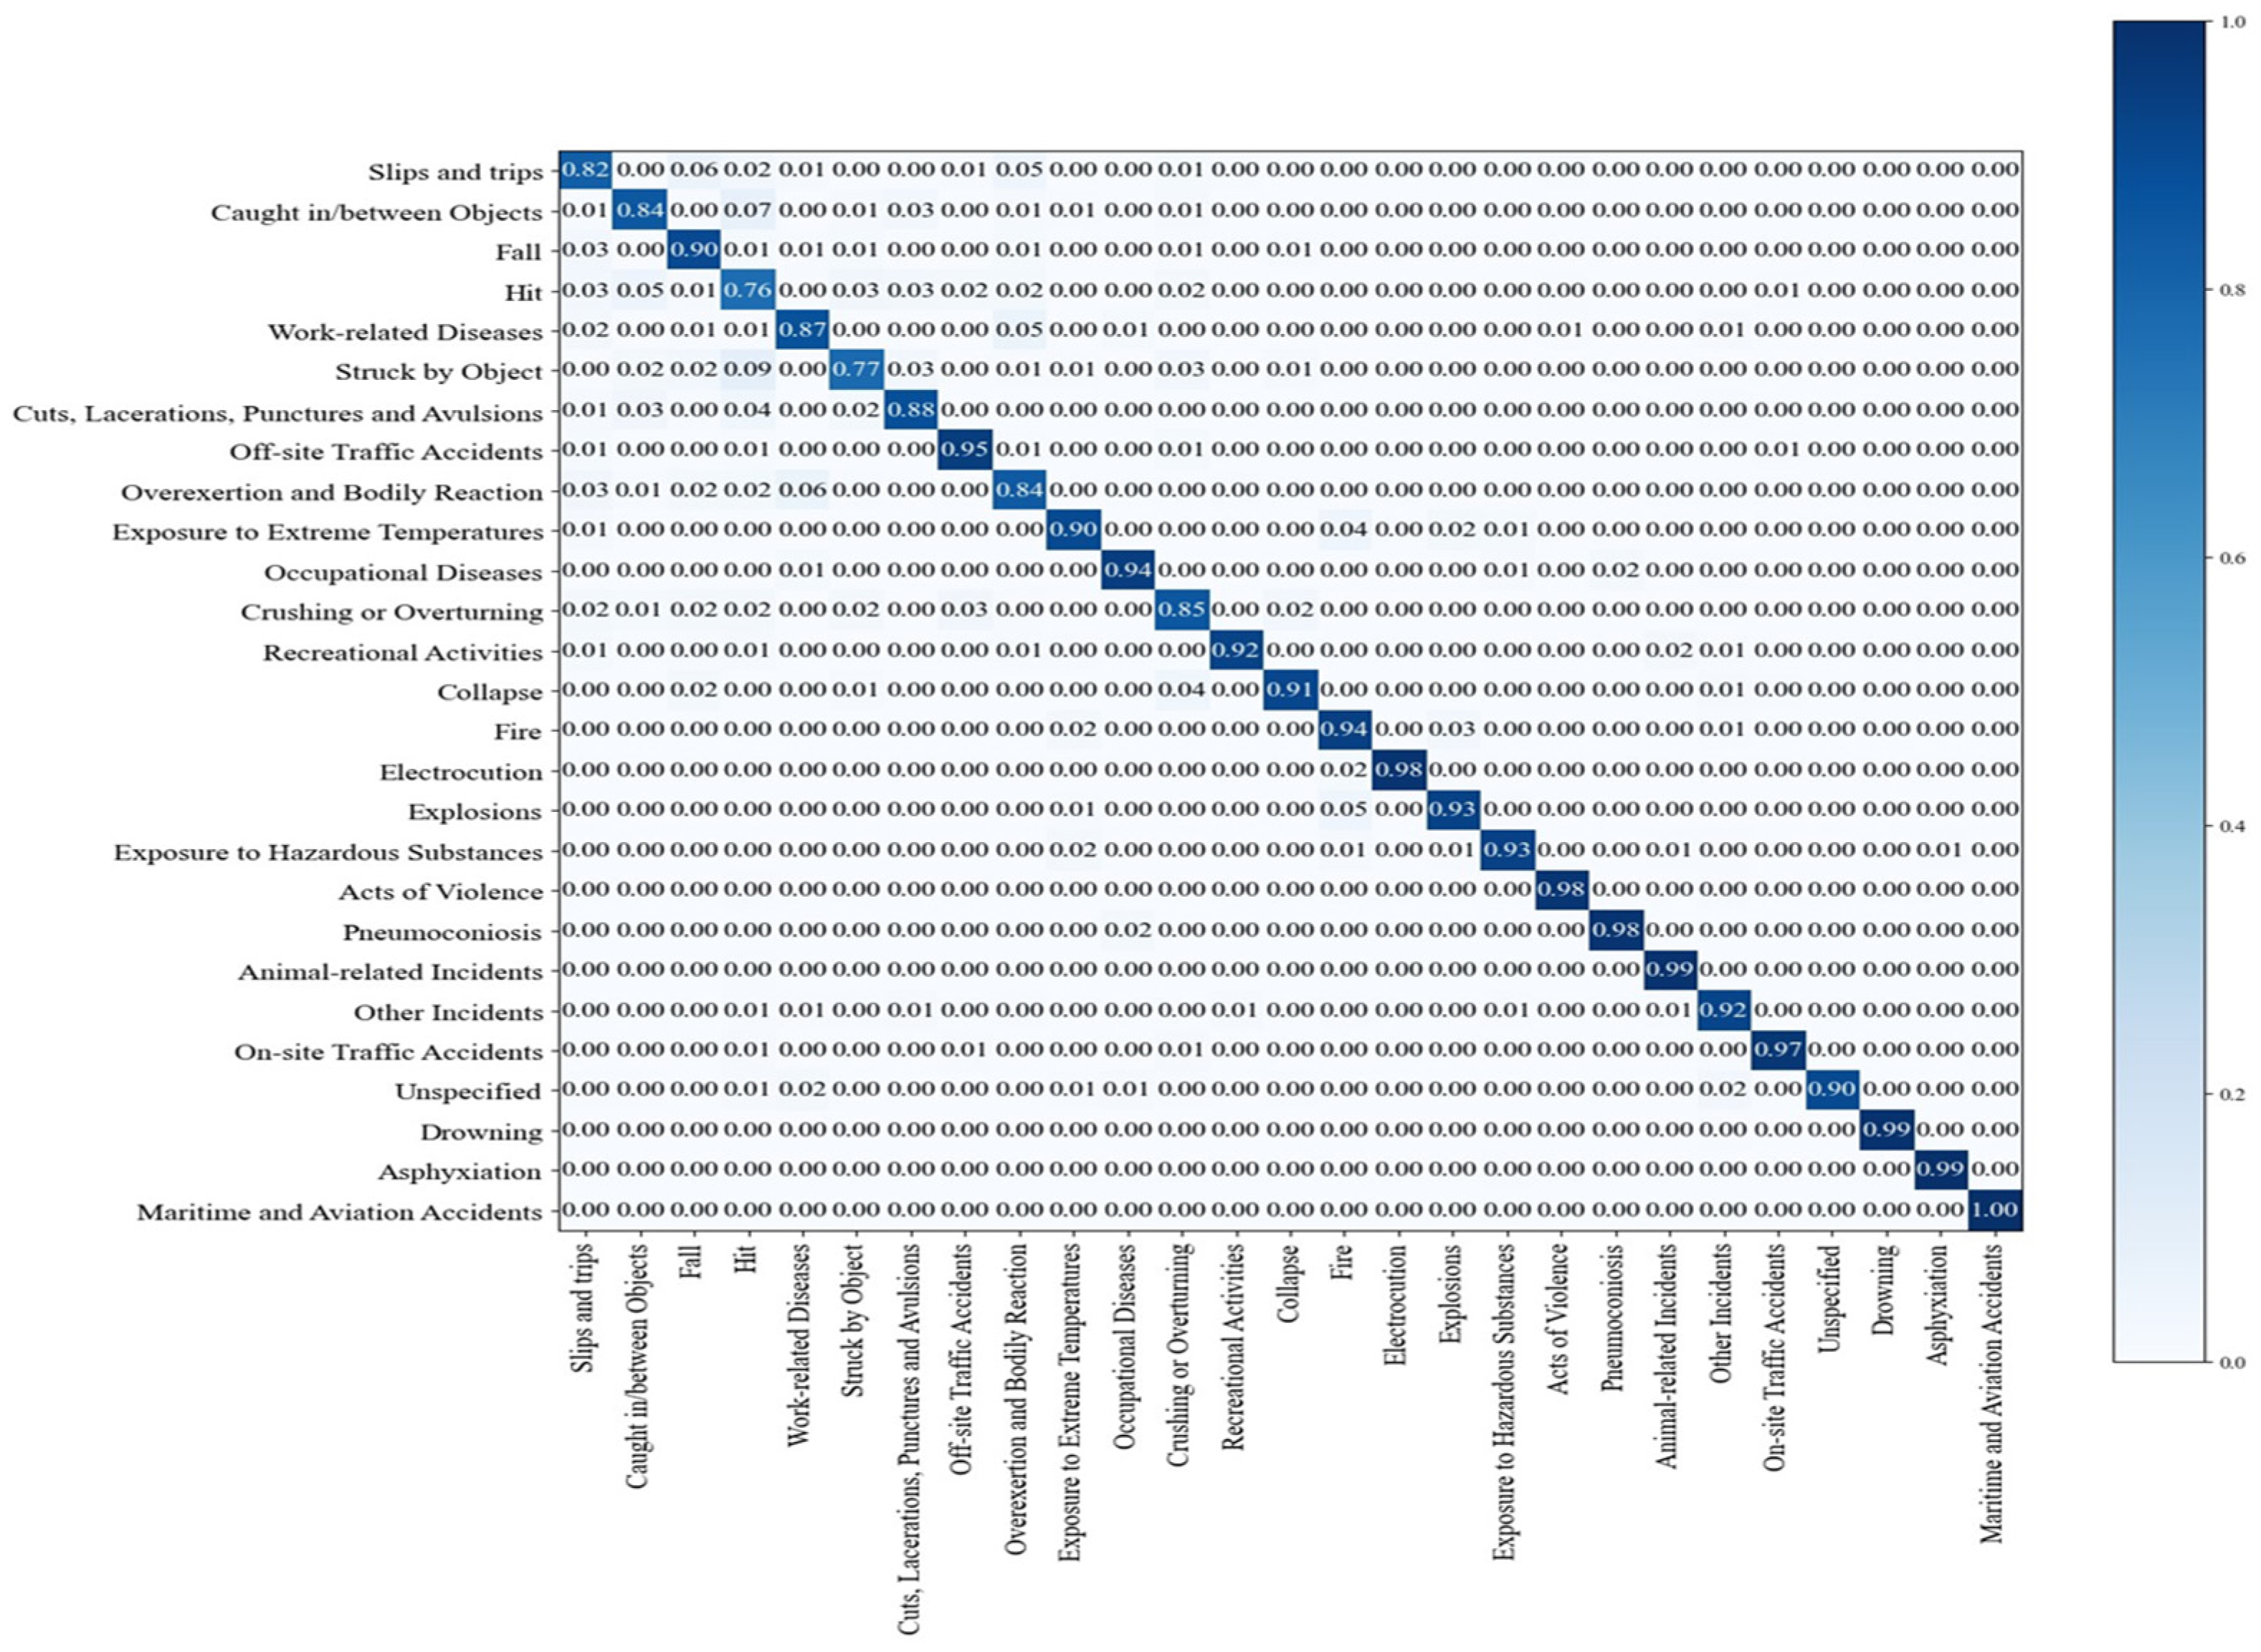
Based on 2.1 million “accident summary” data recorded as actual industrial accident cases in Korea, we proposed three “occurrence type” classification models to distinguish the main characteristics of the accidents using the KoBERT model. Each model was tested by sequentially adding data preprocessing, keyword replacement, and morphological analysis to the original data. The results are illustrated in
Figure 10,
Figure 11 and
Figure 12.
A confusion matrix, validated by class and expressed in terms of precision, recall, loss, and F1 score, was established to compare the results of the overall model. The algorithm and experimental results for each classification model are further discussed.
The results of the Model 1 algorithm with only the data preprocessing method are listed in
Table 12, and the precision, recall, F1 score, and loss were 87.1%, 0.878, 0.878, and 0.38, respectively. Comparing the results in
Table 13 based on the data of each trained class, drowning (67%), asphyxiation (0%), and unspecified (0%), which have relatively few data (64–100), exhibited a low classification accuracy or no classification. Conversely, slips and trips, falls, being caught in/between objects, work-related diseases, cuts–lacerations–punctures, and avulsions, which comprised more than 50,000 data points, exhibited a classification accuracy of a minimum of 82% (up to 92%).
Thus, Model 1 exhibited a large variation in classification accuracy, depending on the amount of trained data.
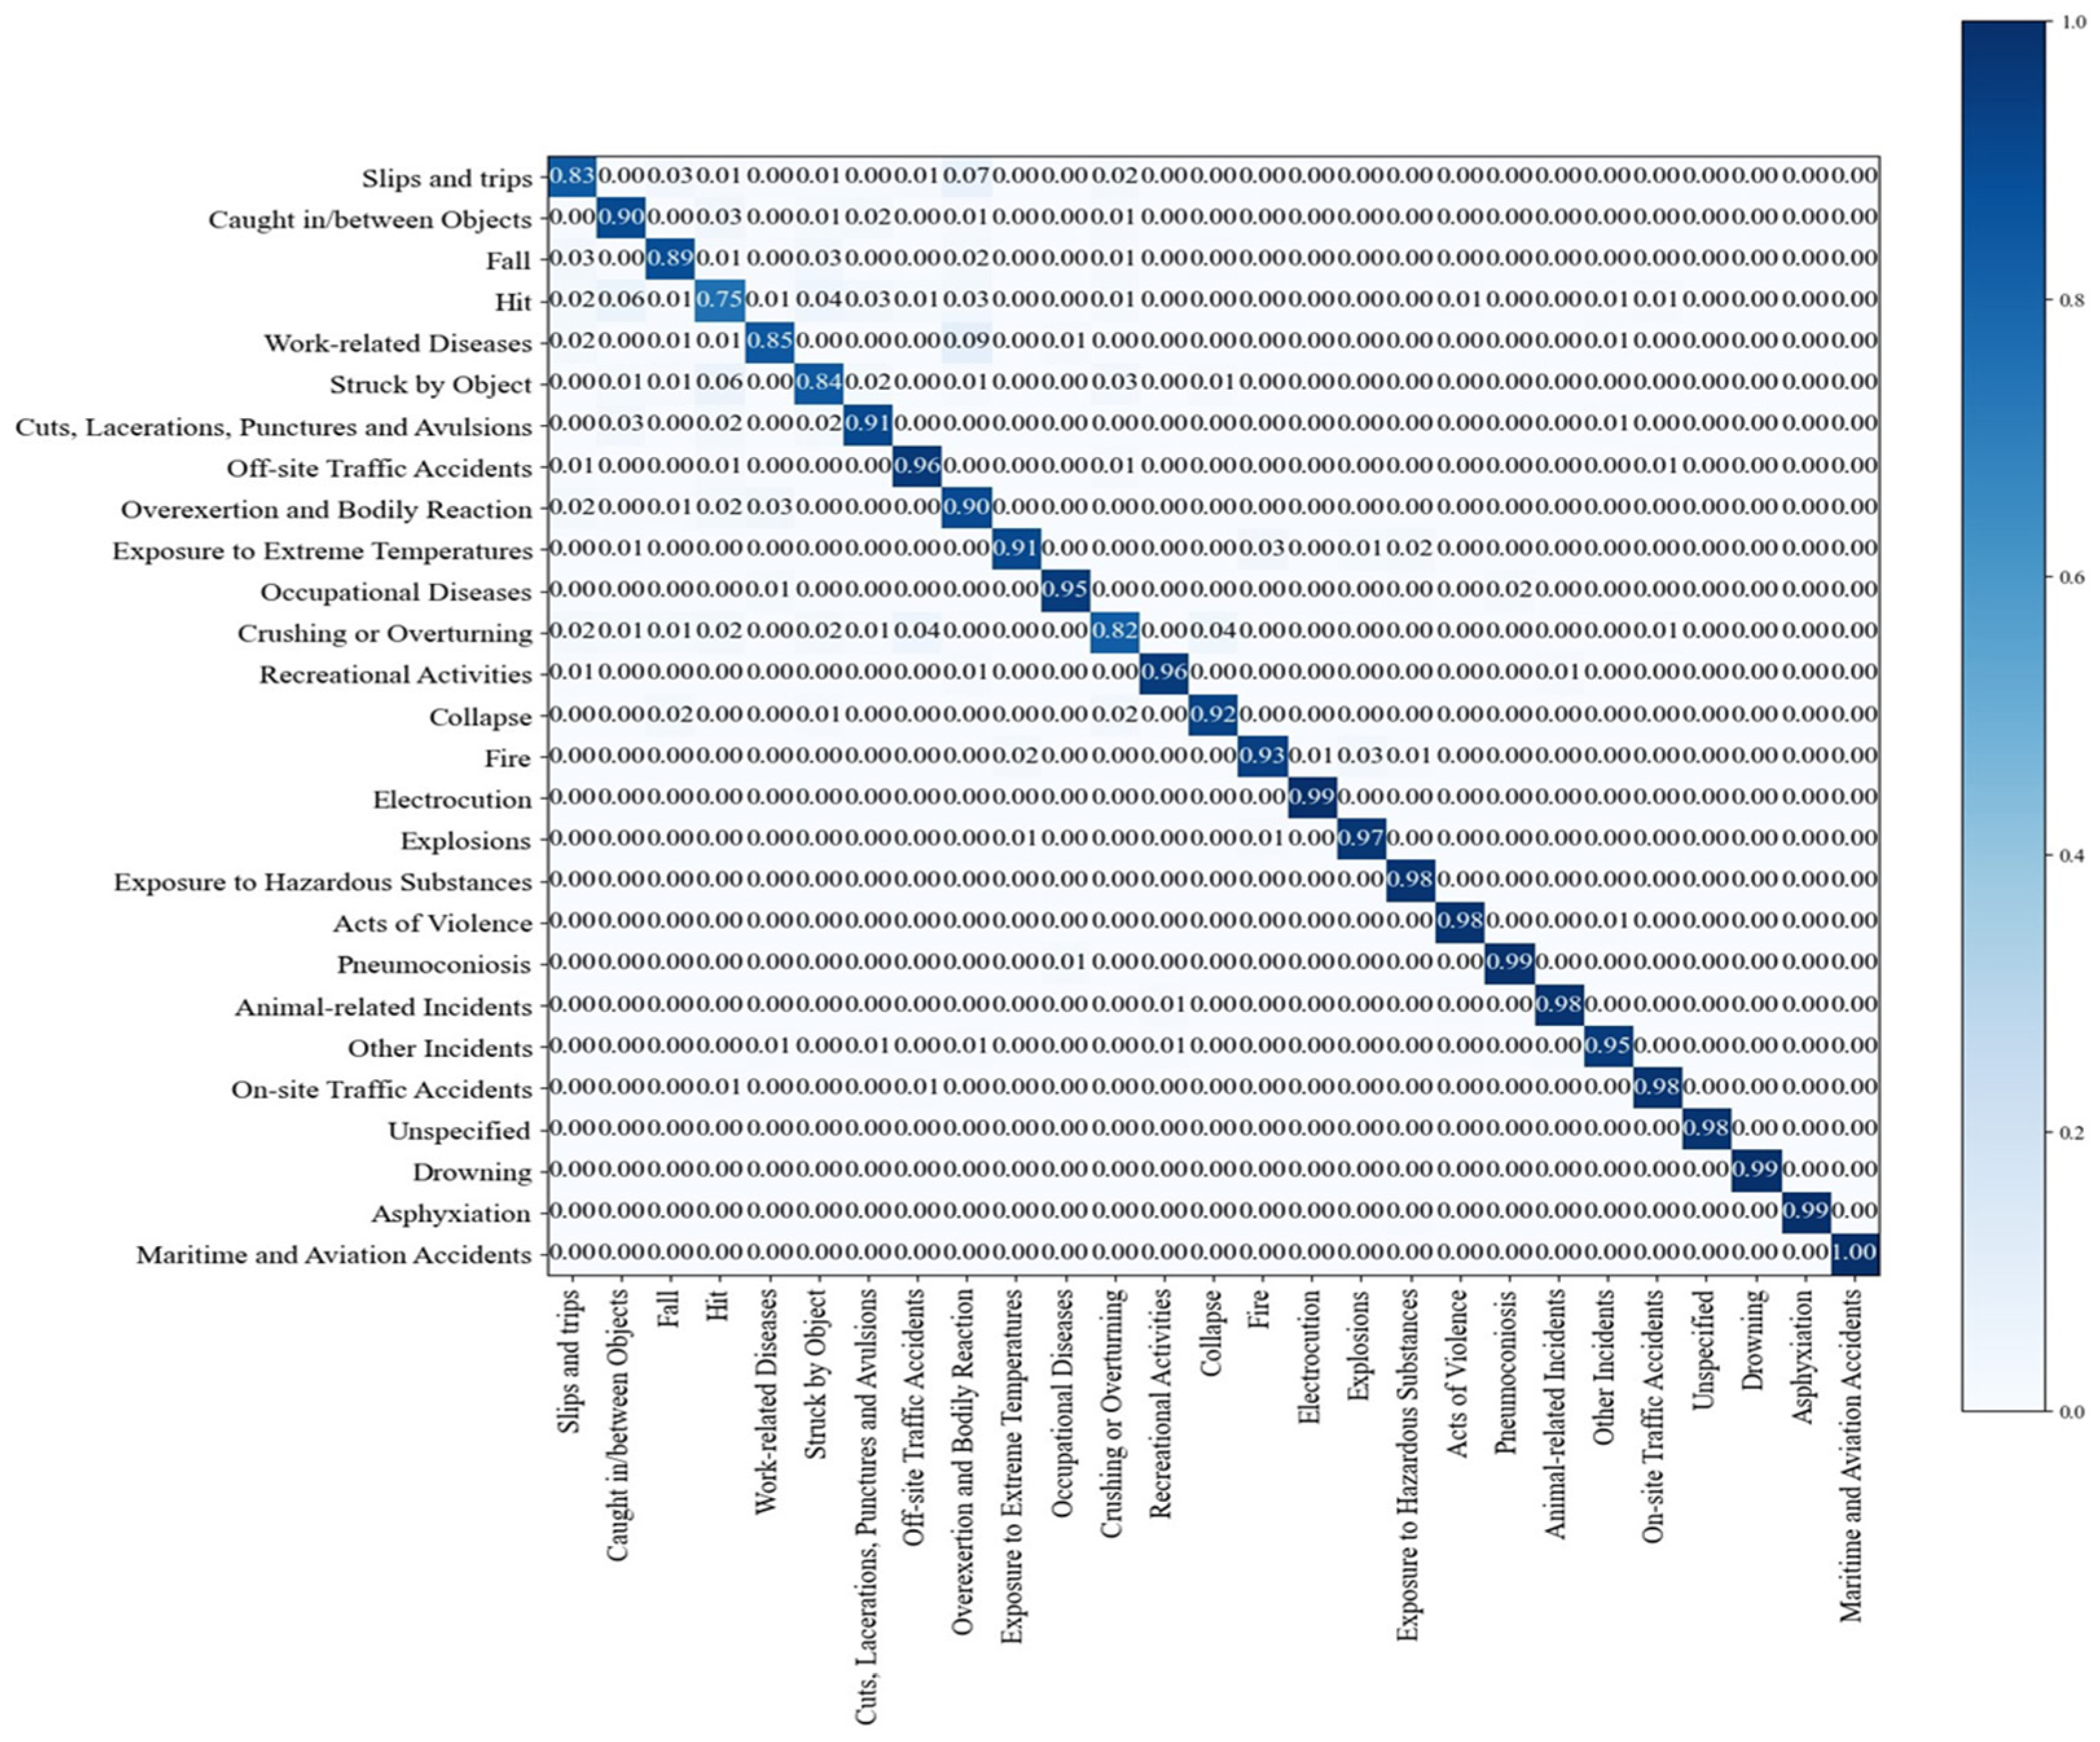
The results of the Model 2 algorithm, which involved data preprocessing and data augmentation to improve the accuracy deviation of Model 1, are listed in
Table 12, with precision, recall, F1 score, and loss of 91.3%, 0.912, 0.913, and 0.31, respectively.
As listed in
Table 13, the classification results improved from 67% to 99% for the drowning class, from 0% to 90% for the unspecified class, and from 0% to 99% for asphyxiation, which had low accuracy in the Model 1 algorithm.
However, some classification accuracy decreased for other classes that were equalized with data augmentation for classes with insufficient training data. Conversely, increasing the training data to 20,000 for classes with very few data (between 60 and 100) increased the classification accuracy to over 90%, whereas reducing the training data from 50,000+ to 20,000 resulted in an accuracy decrease to approximately 9% or less for classes that were trained with less data. Although an overall improvement in classification accuracy compared to Model 1 was observed, the accuracy decreased in some classes due to the equalization of training data; therefore, Model 2 required further improvement.
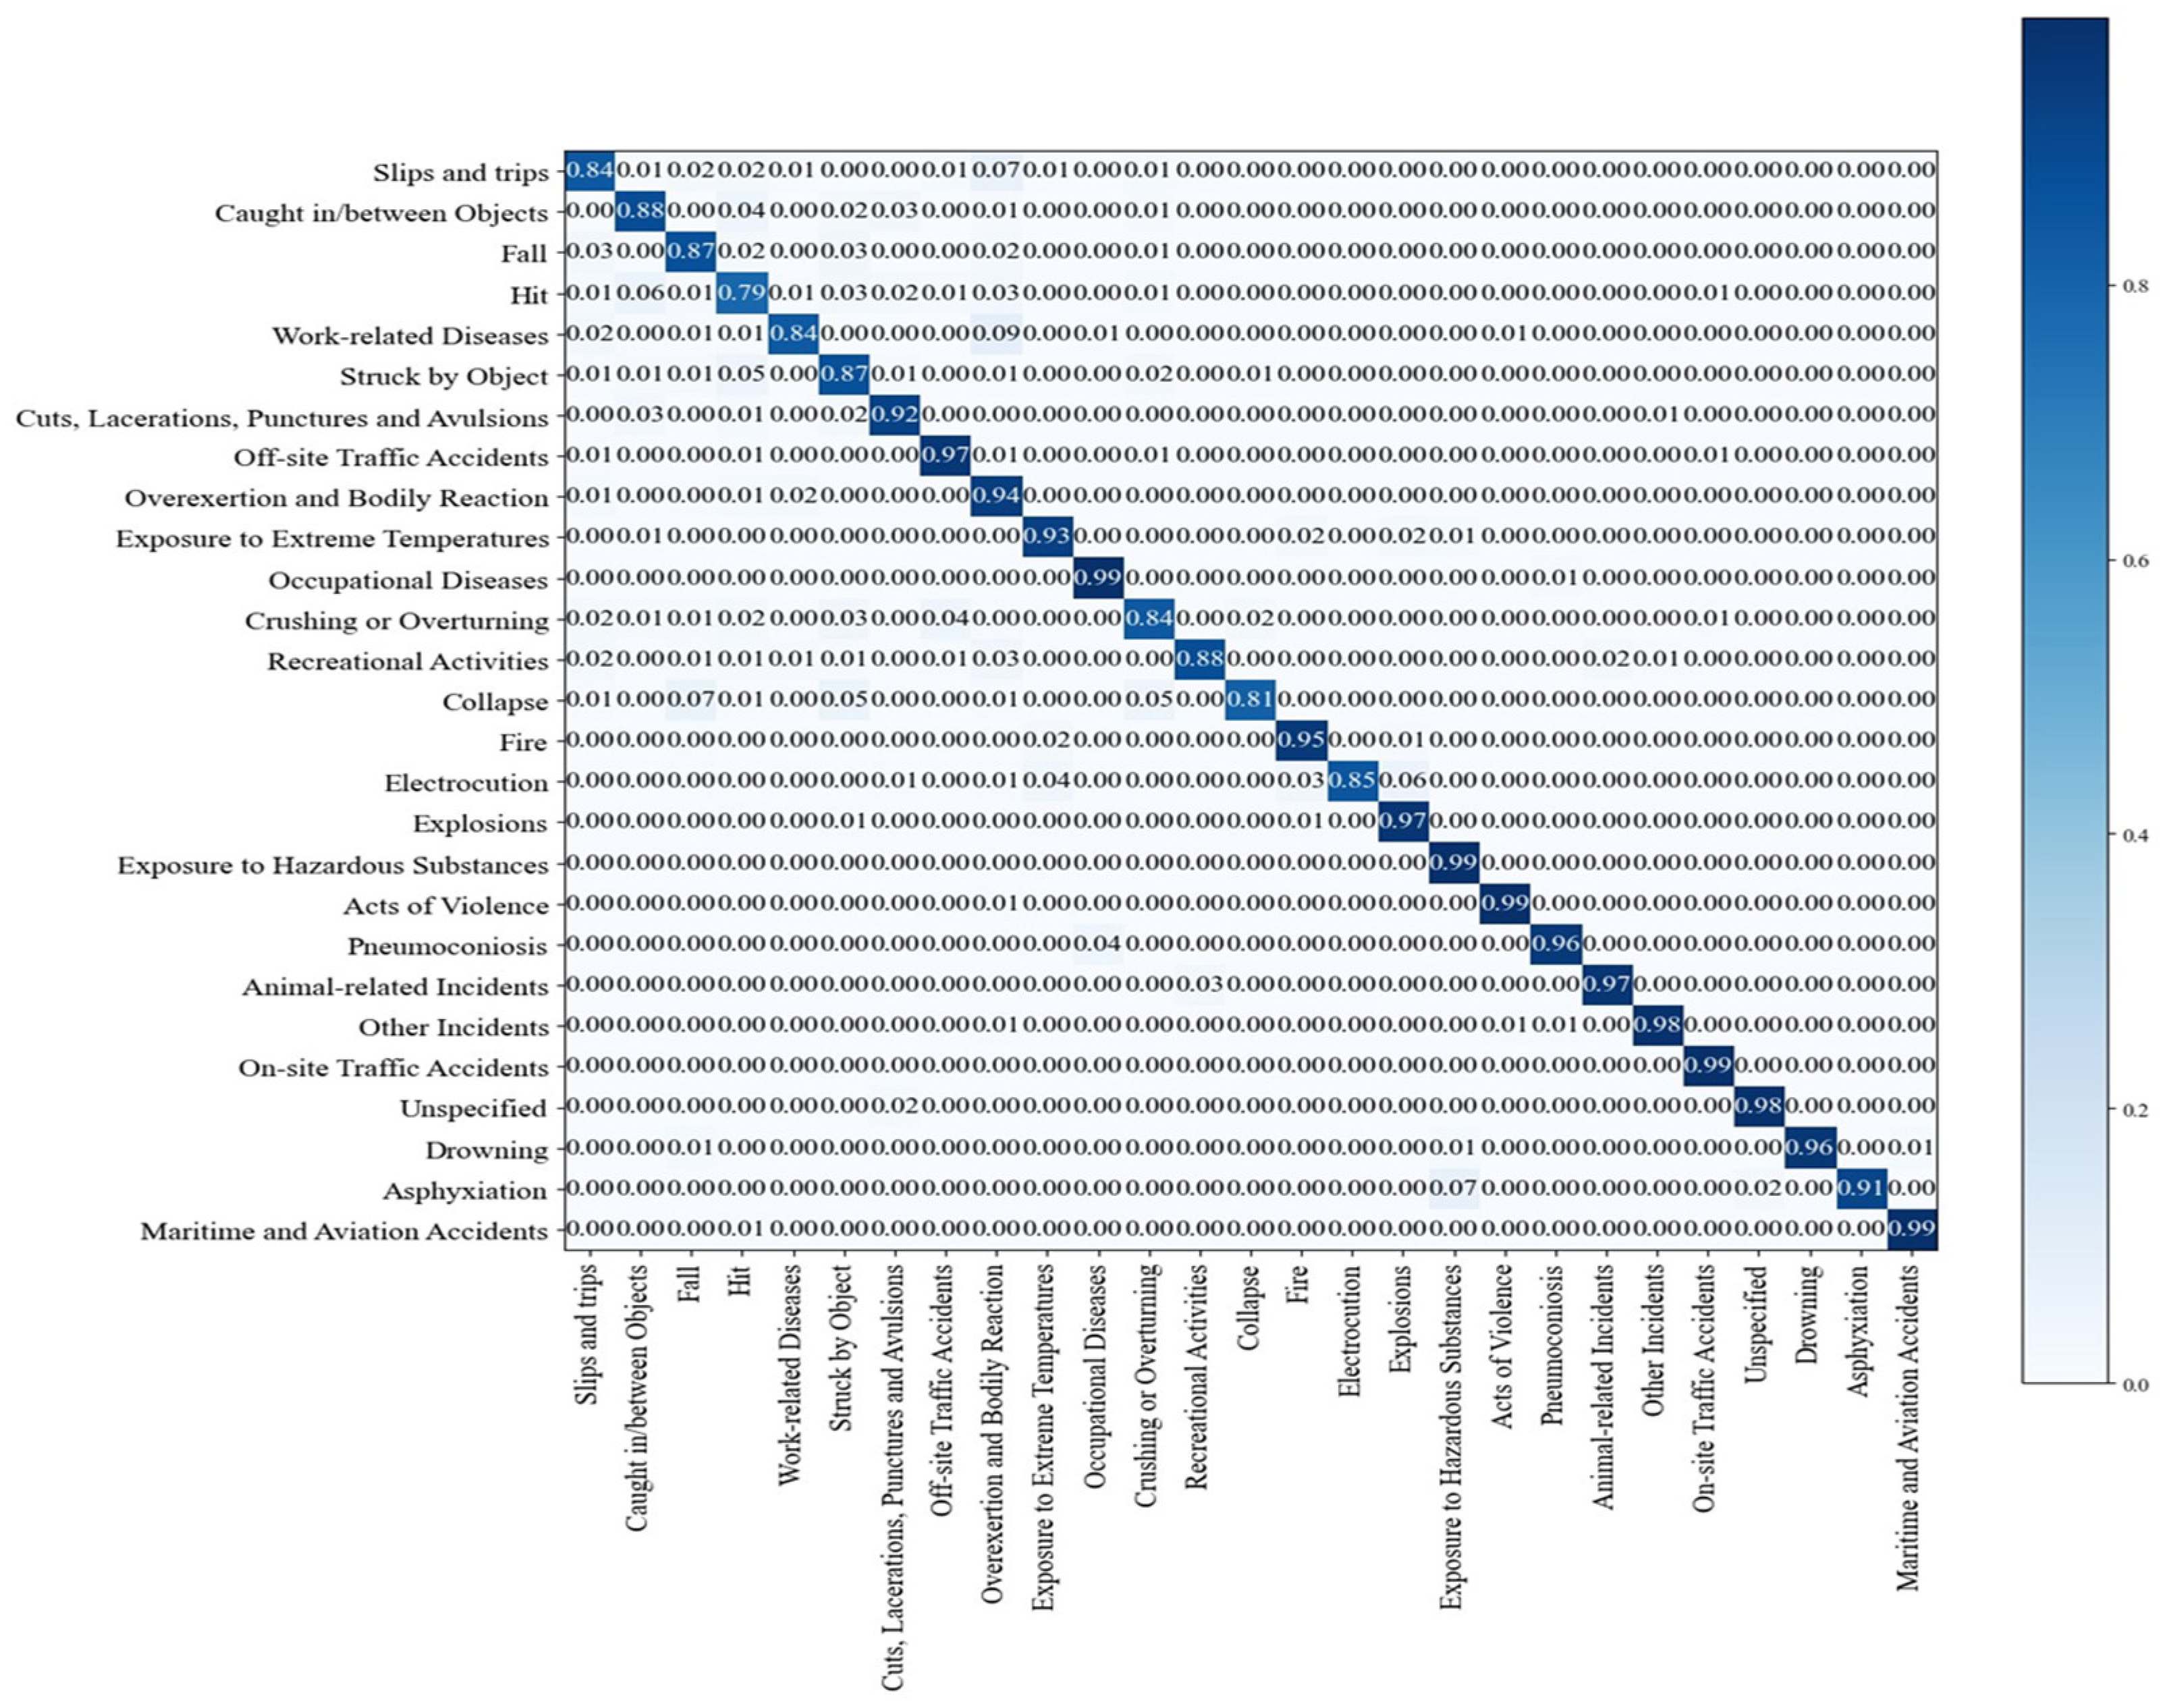
Model 3 was constructed by adding morphological analysis to the algorithm to address the issues in Model 2. With the improvement, the results of Model 3 were 93.1%, 0.931, 0.031, and 0.24 for precision, recall, F1 score, and loss, respectively, as shown in
Table 12. As listed in
Table 13, the accuracy of each class, which decreased in Model 2, was improved by up to 6%, and the classification accuracy was over 90%, excluding 6 out of 27 classes (struck by object, fall, crushing or overturning, slips and trips, work-related diseases, and hit).
Based on the experimental and analytical results of each variable model, we propose Model 3 as a valid algorithm for the objective classification of accident cases. Furthermore, the original data (untrained) of accident cases that occurred in 2023 were classified and verified using Model 3.
The results are presented in
Table 12; the precision, recall, F1 score, and loss were 91.1%, 0.908, 0.909, and 0.32, respectively, confirming the possibility of using the model objectively.
The confusion matrix for each class result is illustrated in
Figure 13. The model was well trained without overfitting. Conversely, the model was expected to classify new data appropriately even after the year corresponding to the validation data and evaluated as an objective accident case classification model.
5. Conclusions
Based on 2.1 million accident summaries recorded as actual cases of occupational accidents in South Korea, this study proposes three occurrence-type classification models that use the KoBERT model to distinguish the main characteristics of accidents. Each model was constructed by sequentially performing data preprocessing, keyword replacement, and morphological analysis of original data. Compared with the other models, Model 3 demonstrated the best results.
The results of this study are anticipated to play an important role in preventing occupational accidents based on accurately classifying accident cases by occurrence type.
In Model 1, only data preprocessing was applied, and the classification performance was 87.1%, attributable to an imbalance in the initial input of the original data. Particularly, for classes with fewer data, the classification accuracy was extremely low (drowning, precision 67%) or not classified at all (asphyxiation, unspecified). To address the imbalance in the amount of data, improving the model by augmenting the training data was necessary.
Model 2 introduced data preprocessing and data augmentation with keyword replacement to solve the imbalance problem in Model 1. The improvements resulted in an improved classification accuracy for most classes (with an average classification accuracy of over 90%) and were sufficient to improve Model 1. Thus, the augmentation method of finding and replacing keywords for a specific accident summary was effective in reducing the gap between the training and real data. Nevertheless, in Model 2, the equalized training data caused a decrease in accuracy in classes with sufficiently large amounts of original data. The drawback presented a tradeoff problem caused by uniform data equalization, requiring improvements to Model 2. Therefore, we introduced a new preprocessing method for the training data.
In Model 3, morphological analysis was performed to solve the problems encountered in Model 2. Model 3 applied three techniques, namely preprocessing of the original data, data augmentation through keyword replacement, and morphological analysis, and overcame the limitations of the previous models. When Model 3 was validated with the most recent accident case data, its precision was recorded as 91%, confirming its objective utility.
Thus, Model 3 was determined to be the most appropriate for the accident summary classification model in this study, and it is expected to alleviate problems such as human error in the occurrence-type classification process for accident summaries and poor objectivity in classification.
However, the AI model developed in this study for classifying occurrence types from accident summaries has certain limitations. Although the model has a high potential for objective utilization, as it is trained based on accident cases accumulated from the past, it can be trained with cases that are incorrectly classified by humans or cases with unclear classification boundaries, which can cause reliability problems. Therefore, we verified the classification of the occurrence type to the lowest rank to verify objectivity and reliability issues.
Figure 14 illustrates the difference between the results of the existing recorded occurrence type model and our classification model, valued at 99% when the third-level information was included. As listed in
Table 14, no significant improvement from the third rank and above was observed.
With the provision of up to three occurrence types, objective classification data were provided for the vast amount of existing accident event data, as shown in
Table 15,
Table 16 and
Table 17. The results can be used to double-check the classification or recording results, maintain the objectivity of the classifier or recorder, or determine the occurrence type classification.
The classification model developed in this study is expected to provide new directions for accident prevention measures and policy system improvements. Particularly, when the model is based on accurately categorizing cases by occurrence type, the model is expected to assist in establishing more effective accident prevention strategies. Thus, the proposed model contributes to improving the societal understanding of occupational safety and developing effective measures to prevent accidents. Continued research is expected to help prevent occupational accidents and reduce societal costs.
6. Discussion and Future Research
This study primarily aims to employ artificial intelligence technology to objectively and accurately classify occupational accident cases, rather than simply identifying or precisely understanding the causes of accidents. The focus lies on leveraging the collected examples of occupational accidents for more systematic classification.
Traditional accident analysis methods have relied on case-by-case investigations of the occurrence process to determine specific causes. However, such methods face limitations when dealing with large-scale, accumulated cases, as they may narrow the scope of analysis or focus solely on particular causes or outcomes. On the other hand, artificial intelligence technology is well suited for handling large-scale recorded accident data and is highly effective for variable studies. Consequently, this study developed a model to classify accident types based on accumulated accident case data. The classification method achieved over 93% accuracy in Rank 1 results and secured over 97% accuracy in subsequent Rank 2 results. Enhancing the accuracy of AI models can be accomplished through improvements in model architecture, augmentation, or efficient preprocessing procedures.
Nevertheless, these enhancements may not directly contribute to reducing occupational accidents or accurately identifying their root causes. Accidents in industrial sites may be caused by complex mechanisms or specific factors, which is a crucial consideration for determining the potential application of this study’s findings. Therefore, to successfully implement artificial intelligence technology in the field of occupational safety and health, it is necessary to consider not only the technical completeness—such as model improvement and accuracy enhancement—but also how these technologies can contribute to the prevention of occupational accidents.
In future research, to overcome these limitations and contribute more effectively to industrial accident prevention, the research will be expanded in the following directions:
First, we will try to accurately classify the causal factors that directly contribute to the accident and identify the cause. In most accident cases, the original cause material is closely related to the occurrence of the accident. This is a factor that is commonly used or found in industrial sites such as machinery, equipment, parts, products, etc., and has the characteristic of coming into contact with or being close to workers when an accident occurs. Since this directly contributes to the cause of the accident, the exact cause and result of the accident can be predicted from the accident case. Therefore, referring to the method and results of this study, a model that can classify the original cause material from the accident overview can be added. This requires more information input than the results of the existing occurrence type, and the artificial intelligence model will also need to be improved.
Second, a comprehensive accident analysis will be conducted, considering the complexity of the working environment. Modern industrial sites involve various risk factors that interact with each other due to technological advancements and system complexity. The complexity of the working environment encompasses not only direct causes such as causal factors but also systemic factors, organizational structures, human–machine interactions, and technical elements. Dekker et al. [
24] emphasized that failures in complex systems cannot be explained by simple causes, and Brocal et al. [
25] proposed a new risk management approach in the context of Industry 4.0. By referencing these studies, we will develop a model that comprehensively analyzes the diverse risk factors and their interactions that occur in the work environment. This will help identify systemic risk factors that are difficult to detect through causal factor analysis alone and contribute to establishing a comprehensive strategy for accident prevention.
Third, we will seek accident prevention measures that take into account motivational and cognitive biases in decision-making processes. Kahneman [
26] explained cognitive biases that affect human judgment and decision-making, and Montibeller and Winterfeldt [
27] analyzed motivational biases. These biases can lead to faulty decision-making, which can become a cause of accidents. Therefore, we aim to develop a system that minimizes these biases to contribute to accident prevention.
Fourth, we will research ways to strengthen safety culture and the role of managers. Leveson [
28,
29] applied systems thinking to safety engineering and proposed methodologies to prevent accidents, while Komljenovic et al. [
30] emphasized the importance of organizational factors. Additionally, Mosey [
31] highlighted the impact of safety culture and the role of managers in accident prevention. Based on these studies, we will establish strategies for building a safety culture at the organizational level and encouraging active participation by managers.
Through this future research, we aim to develop a comprehensive accident analysis and prevention system that considers both direct causes of accidents, such as causal factors, and systemic factors arising from the complexity of the work environment. This will contribute to a more practical approach to industrial accident prevention.


