Article

Research on High-Strength Economic Support Technology for Soft Rock Roadway with Roof Drenching under Thin Bedrock Irregular Surface

1
College of Mining and Coal, Inner Mongolia University of Science and Technology, Baotou 014017, China
2
Ordos City Jintong Mining Industry Co., Ltd., Ordos 017000, China
3
School of Mines, China University of Mining and Technology, Xuzhou 221116, China
4
MOE Key Laboratory of Deep Coal Resource Mining, China University of Mining and Technology, Xuzhou 221116, China
5
Uxin Banner Mengda Mining Industry Co., Ltd., Ordos 017399, China
*
Authors to whom correspondence should be addressed.
Appl. Sci. 2024, 14(20), 9428; https://doi.org/10.3390/app14209428
Submission received: 29 August 2024 / Revised: 27 September 2024 / Accepted: 9 October 2024 / Published: 16 October 2024

Abstract

:
The control of soft surrounding rock stability has always been a hot academic issue. Soft rock has poor stability and low strength, and the deformation of a soft rock tunnel becomes more serious after it is affected by water for a long time. In this paper, the Jintong Coal Mine is taken as the research object, and nondestructive immersion experiments are used to study the change in mechanical properties of rock after being affected by water. The FLAC numerical model is used to analyze the stress evolution characteristics of the surrounding rock after being affected by water, and the results of the study show that the water absorption of siltstone is always higher than that of coarse-grained sandstone, and the uniaxial compressive strength of siltstone and coarse-grained sandstone decreases by 54.59% and 67.99%, respectively, under a state of saturated water compared with that under a state of dryness. Influenced by a T-shaped surface, the maximum principal stress concentration area occurs in the rock layer below the T-shaped surface and outside the joint. Concentrations of maximum shear stress occur within the “T” channel. Vertical stress concentration zones occur at the higher ground level and the bottom of the slope. The maximum shear stress of the roof fluctuates before the face reaches the surface of the “1” section, and continues to increase with and continues to increase with the distance of the face. After entering below the surface of the “1” section, the maximum shear stress of the roof increases rapidly, and the influence range is about 24 m. The maximum shear stress distribution plays a dominant role in the stability of the surrounding rocks of the two roadways. We analyze the principle of high-strength economic support, propose a “four-in-one” surrounding rock control technology based on “controlled hydrophobicity, structural adjustment, district management, and gradient control”, and propose a surrounding rock control scheme of district management. The measured data on site show that the roadway surrounding the rock is reasonably controlled. This provides a reference for the stable control of the surrounding rock of the roadway under similar conditions.

1. Introduction

In recent years, as coal mining has become more and more involved in the control of soft rock roadway enclosure under complex conditions, domestic and foreign research institutes have carried out a series of studies on the physical and mechanical damage to soft rock under special conditions, the most important of which is the experimental study of soft rock–water chemistry. Rosenbrand E et al. [1] used computed tomography (CT) technology to study the initial expansion of cracks and the evolution of secondary cracks under water–rock chemical actions. B. Hawkins and B.J. Mcconnell [2] carried out experimental research on the strength of a variety of weakly cemented rocks under a saturated state with compression tests, and the change in pore water pressure in specimens in the process of loading did not have much effect on the strength of the rock. Chugh and Missavage [3] found that the uniaxial compressive strength of soft rock left in water or at 100% humidity for 24 h was reduced by 50–60% compared to a specimen with natural humidity. Chang et al. [4] found that the ultimate strength of “wet” rock is as low as that of “dry” rock through a triaxial test. Yao and Chen [5,6,7] investigated the effects of water intrusion and loading rate on the mechanical properties and fracture development of coal–rock composites. Zhang et al. [8] analyzed the compositional characteristics of typical weakly cemented chondrites in their study area using X-ray fluorescence and X-ray diffraction. A degradation trend of hydrodynamic properties of weakly cemented soft rocks was systematically revealed. Zhou et al. [9] concluded that water content has four main effects on the mechanical behavior of coal samples. These are liquid bridge force, water softening effect, wedge effect, and lubrication effect. Chen et al. [10] conducted an experimental study on the mechanical properties and acoustic emission characteristics of dry and saturated soft rock using a creep–impact dynamic perturbation loading system. Zhao et al. [11]. determined the mechanical properties of water-bearing weakly cemented sandstone, and the weakening mechanism of water-bearing weakly cemented sandstone was elucidated. Liu et al. [12] investigated the mechanical properties of mudstone–clay composites with different thicknesses, layers, quantities, and water content by a series of uniaxial loading and acoustic emission tests.
Some scholars [13,14] have also analyzed the change in mechanical properties of soft rock under the influence of water using numerical simulations and on-site measurements. Zhao et al. [13] analyzed the gradual development, dynamic expansion, and deformation of fissures in surrounding rock of a weathered rock roadway using UDEC numerical simulation software (version 5.0, Itasca Consulting, Inc., Minneapolis, MN, USA). Jia et al. [14] investigated the destabilization and damage law of a roadway using the methods of borehole peeping, water-immersed softening test, and numerical simulation.
At present, regarding the support of soft rock roadways under water-rich conditions, combination control technology is mainly adopted [12,14,15,16,17]. Overall, the main research results of the current academic research on soft rock roadway support technology can be summarized in the following three respects.
(1) Improving support strength: Development of new support technologies and roof supports have been developed to prevent roof and coal wall damage. Parameters like anchor rod spacing and preload are optimized for stability [18,19,20,21]. Zhu et al. [18] designed a “high-resistance, integral beam, two-stage rib + roof support system” in soft coal seam roadway support technology. Ma et al. [19] proposed that reasonable spacing and preload parameters (anchor rod spacing of 0.7–0.9 m, preload greater than 40 kN). Xue et al. [20] proposed a new joint support system of “anchor–rope–net–spray + grouting”. Zhang et al. [21] proposed a fully closed joint support method of a “U-type steel shed to close the roof and gangs + filling flexible materials behind the shed + laying reinforcing steel mesh and concrete on the floor + reinforcing the key parts”.
(2) Enhancing the self-supporting ability of surrounding rock: Grouting reinforcement schemes change the nature of the surrounding rock, improving its mechanical properties. Long and short anchor cables, local injection grouting, and other measures enhance overall strength and stability [22,23,24,25,26,27,28,29]. Optimization of roadway sections, spraying, and gradient support also contribute to effective deformation control. Yu et al. [22] proposed a weakly cemented siltstone roadway joint support scheme based on grouting reinforcement. Lin et al. [23] proposed long and short anchor cable support, reinforced coal wall roof, and local injection grouting. Wen et al. [24] proposed using bolts, grouted anchors, and long anchor cables to achieve coupled support for the fracture, plastic, and elastic zones. Lin et al. [25] effectively controlled the deformation of a Jurassic soft rock roadway surrounding rock by optimizing the roadway section, thin spraying on the roadway surface, optimizing the support components, gradient support, and other measures. Jing et al. [26] proposed soft rock roadway deformation control based on the double-row anchor control method. Yang et al. [27] proposed an interconnection support technology of large and small structures based on high-strength anchor rods, high-stiffness shotcrete layer to block the water, deep-hole grouting, and shallow-hole grouting to reinforce the small structures, high-prestressing anchor cables tensioned twice to make the large and small structures uniformly stressed, and grooved steel and high-prestressing anchors to control the bottom drum. Zhang et al. [28] studied the numerical simulation of surrounding rock deformation under different support modes based on considering the role of fluid–solid coupling. Li et al. [29] proposed a new type of “grouting + anchor rope network + bottom arch” joint support scheme.
(3) Preventing water-induced weakening: Water infiltration and physicochemical actions degrade rock strength, increasing deformation and damage risk. Grouting has been identified as an effective method to improve stability [30,31,32,33]. Zhang et al. [30] believe that the infiltration and physicochemical action of fissure water tends to have a deteriorating effect on the strength and bearing capacity of a roadway surrounding rock. Yuan et al. [31] used a single-factor analysis method to thoroughly study the effects of water infiltration, strain softening, rock spreading, residual cohesion, and intermediate principal stresses on a roadway surrounding rock, and concluded that grouting is an effective way to improve the stability of the roadway. Wang et al. [32] proposed a joint support scheme of “steel beam + anchor net cable + grouting”, and achieved good short-term results. Lu et al. [33] found that in water-rich soft rock such as muddy siltstone, the effect of the self-dissolving grouting method was significantly better than that of the traditional grouting method, and the uniaxial compressive strength and modulus of elasticity were significantly improved.
Numerous scholars have contributed to enhancing the support effect from various perspectives. Cao [34] employed the RFPA 3D numerical simulation method to investigate the fracture evolution of surrounding rock and the progressive debonding of anchor rods. He conducted calculations and generated graphs using MATLAB software to elucidate the mechanism behind anchor debonding. Additionally, he [35] discovered that the type and intensity of mine water’s influence on the resin slurry varies across different mine water environments, indicating that the microscale properties of the resin slurry do not perform as effectively as those of traditional grouting methods. Furthermore, the impact of mine water on the resin slurry and the alterations in its microstructure are also variable. The proposed damage parameters can quantitatively characterize the damage process of the resin slurry when subjected to mine water solutions.
Research on the irregular surface, roof drenching, and the evolution of stress fields in mining—specifically the distribution characteristics of maximum principal stress, maximum shear stress, and vertical stress—remains underexplored. This study aims to advance and enhance research in this domain. Using the Jintong Coal Mine’s 51,102 return airway as the engineering context, we conducted nondestructive immersion tests on the roof rock layer, which consists of siltstone and coarse-grained sandstone, and analyzed the changes in mechanical properties of rock samples with varying water content. A numerical simulation model was developed to account for the “T”-shaped surface, water-induced softening of the rock layer, and multiple stages of mining, facilitating an analysis of the evolution laws governing both the original rock stress field and the mining stress field. Drawing on the principles of high-strength economic support, we propose a “four-in-one” surrounding rock control technology that integrates controlled hydrophobicity, structural adjustment, zonal management, and gradient control. Additionally, we present a surrounding rock control scheme centered on zonal management, which serves as a reference for research and engineering practices related to surrounding rock control in similar contexts.

2. Background

2.1. Underground Geological Conditions

The Jintong Mine is situated in Ordos, Inner Mongolia Autonomous Region, China, as illustrated in Figure 1a. The 51,102 working face is positioned in the northern wing area of the Jintong Coal Mine, with an 8 m coal pillar left between the two working faces. The primary mining coal seam, designated as 5-1, is buried at depths ranging from 42 m to 74 m, with an average depth of 58 m. The 51,102 working face has a knife handle shape, approximately 737 m from the opening, and its width decreases from 240 m to 149 m. The underground spatial relationships are depicted in Figure 1b. According to data from J2–4 drilling (Figure 1c), the direct roof of the 51,102 return airway consists of siltstone that is grey to dark grey, mud-based, occurring in clumps, and containing fine mica flakes and fossilized plant fragments, characterized by horizontal laminations and a limited number of developed fissures. The basic roof is composed of coarse-grained sandstone, light grey in color, with a fine-grained sandy structure primarily made up of quartz and muddy cementation, locally exhibiting horizontal and interlacing laminations, and is relatively soft, underlain by a thin layer of sandy mudstone. The direct floor comprises sandy mudstone, grey in color, with a sandy mud structure that contains numerous plant fossil fragments and coal packages, along with a small number of cracks; the core is soft and prone to weathering. The basic floor is formed from fine-grained sandstone, grey in color, primarily consisting of feldspar and quartz. The main aquifers associated with the 51,102 working face include the sandstone fissure aquifer of the Yan’an Formation located in the roof of the working face and the surface backfill management layer. It is anticipated that the maximum water influx in the 51,102 working face will reach 8 m3/h, with a normal water influx of 4 m3/h. Observations indicate that the degree of weakening of the roof strength due to drenching is significant, with the roof rock layer in the exposed section being easily broken by hand. The exposed sections of the anchor rods and anchors are continuously dripping, and the rods exhibit significant corrosion. This corrosion increases the likelihood of fractures in the anchor rods and anchors due to mining influences, thereby elevating the safety risks associated with roadway support. Detailed observations are illustrated in Figure 1d.

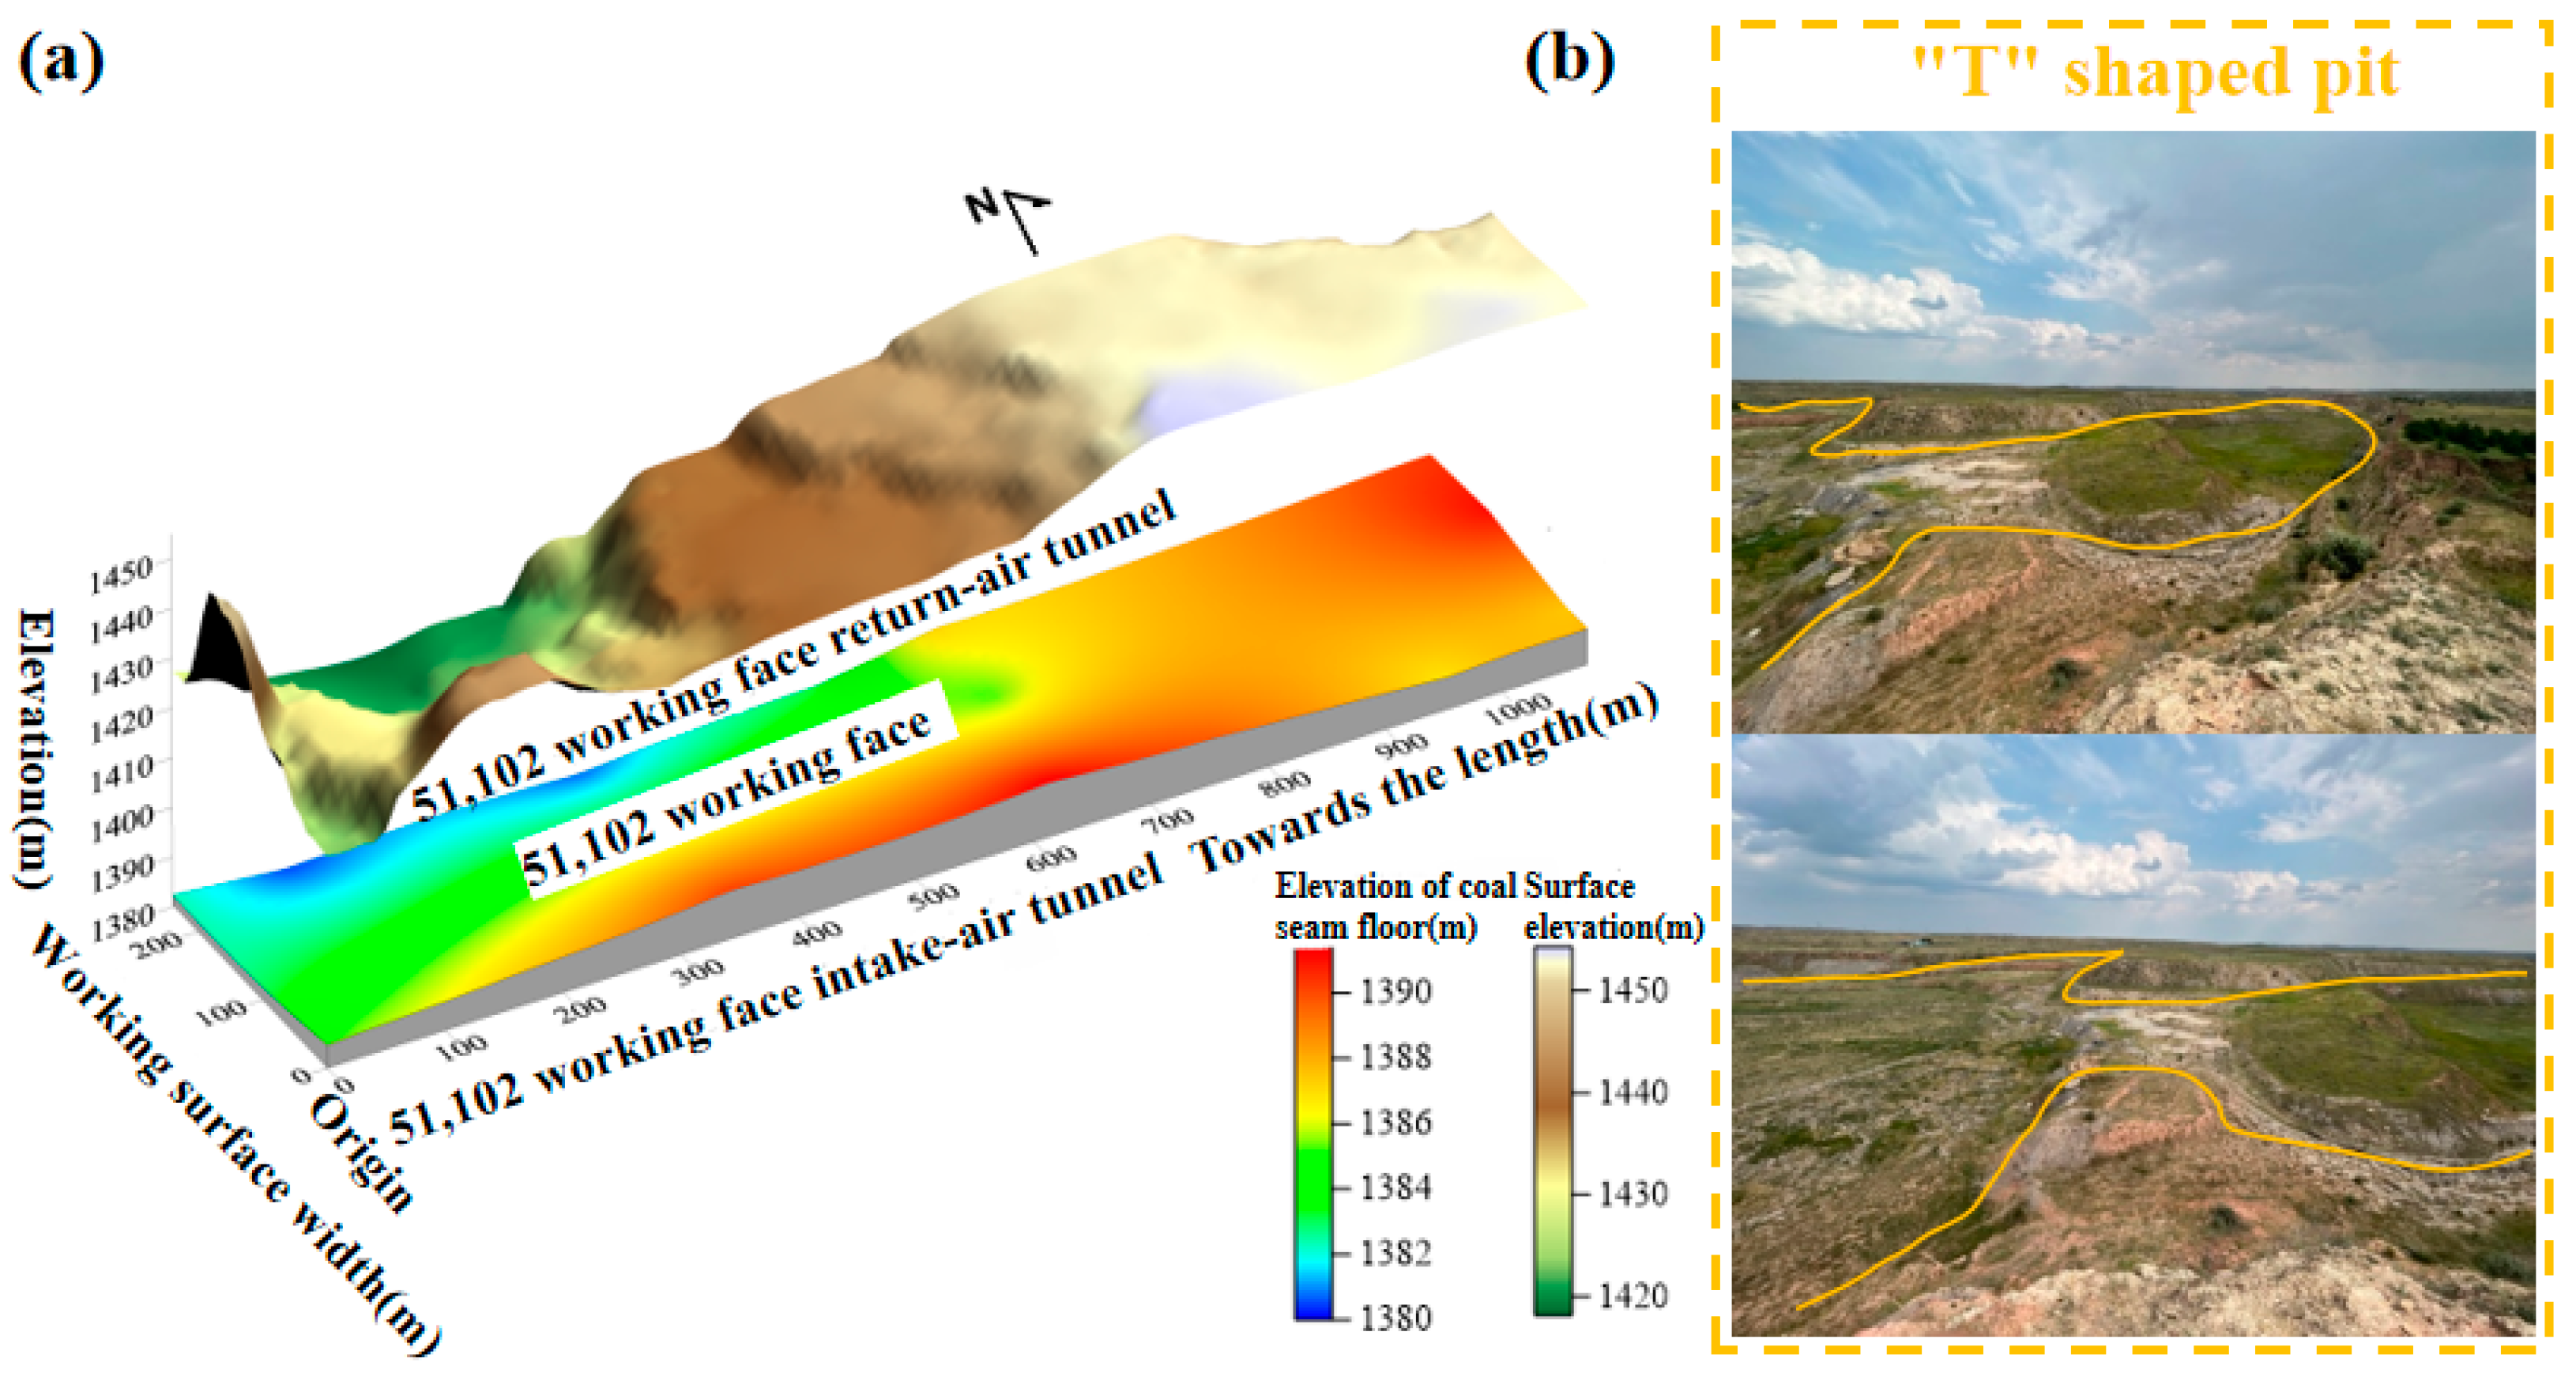
2.2. Overview of Irregular Surface

The ground conditions at the 51,102 working face are more complex due to the prior open-cast mining of the 4-1 coal seam above the 5-1 coal seam. This mining activity has resulted in the formation of a “T”-shaped mining pit, leading to an irregular surface with significant drops of up to 30 m, as illustrated in Figure 2. The stress from this irregular terrain is transferred to the underlying coal seam, altering the mechanical environment of the surrounding rock in the roadway. Additionally, the continuous weakening of the rock layer’s strength due to water infiltration further deteriorates its stability, thereby posing a substantial safety hazard.

3. Materials and Methods

3.1. Materials

To investigate the variation in mechanical properties of siltstone at different water contents, as well as those of coarse-grained sandstone, rock blocks were collected from the 51,102 return airway of the Jintong Coal Mine, as illustrated in Figure 3a. In accordance with the standards set by the International Society of Rock Mechanics, shown in Figure 3b, the cores were processed into φ50 mm rock samples using a ZS-100 vertical rock drill sampler (Jinan Mining & Rock Testing Instrument Co., Ltd., Jinan, China). Subsequently, the rock samples were cut into lengths of 100 mm and 25 mm using a DQ-1 rock cutter (Shandong Zhongtan Intelligent Equipment Co., Ltd., Jining, China) [36].
The rock samples were placed in an electrically heated, constant-temperature blast drying oven, with a drying temperature set between 105 and 110 °C. The drying process involved measuring the weight of the samples every 30 min for the first 3 h, followed by hourly measurements for a total drying duration of 24 h. The natural moisture content of the two rock samples was subsequently calculated, as illustrated in Figure 3c.
The nondestructive immersion device comprises a humidifier, a sealing box, a water seepage plate, a plastic hose, and other components, as depicted in Figure 3d. In the test, the humidifier box is connected to the sealing box via a plastic tube, allowing the air humidifier to introduce water mist into the sealing box. This setup gradually creates a high-humidity environment, ensuring that the immersion process does not compromise the structural integrity of the rock samples. During the water immersion phase, the weight of the samples was measured every 30 min for the initial 3 h, and subsequently at hourly intervals until the mass of the rock samples showed no significant changes, indicating that saturation had been achieved, as shown in Figure 3e.
We utilize HY-914 (Tianjin Yanhai Chemical Co., Ltd., Tianjin, China), a fast bonding agent, to affix two groups of strain gauges positioned at 180° on the surface of the rock samples for the compression test. Each group consists of a pair of mutually perpendicular strain gauges: one aligned with the axial direction of the cylinder to measure the longitudinal strain of the core during uniaxial compression, and the other oriented perpendicular to the axial direction to assess the transverse strain of the core in uniaxial compression. The electrical resistance of each strain gauge is 120 Ω.

3.2. Methods

(1)
Indoor test
The test loading unit employs a C64.106/1000 kN electro-hydraulic servo universal testing machine (Shanghai Sukyo Industrial Technology Co., Ltd., Shanghai, China), while the control unit utilizes Test Expert. In this study, the uniaxial compression test is conducted using a displacement control mode with a loading rate of 0.2 mm/min, as illustrated in Figure 3f. The electronic universal testing machine (China Machine Testing Equipment Corporation, Beijing, China) is also employed for the variable angle shear test, which is performed at three different angles: 55°, 60°, and 65°, maintaining the same loading speed of 0.2 mm/min, as shown in Figure 3g. The test continues until the rock sample fails, resulting in a rapid reduction in strength, at which point the testing machine automatically ceases loading. The entire testing process is recorded using a high-speed camera operating at 50 frames per minute, while the strain of the rock samples is monitored with a TS3890N static resistive strain gauge (Langfang Zhongyi Science & Technology Co., Ltd., Langfang, China). The procedures for rock sample preparation and loading are depicted in Figure 3h.
(2)
Numerical simulation
FLAC 3D numerical simulation software (version 5.0, Itasca Consulting, Inc., Minneapolis, MN, USA) was employed to analyze the stress evolution characteristics of the irregular ground surface at the 51,102 working face during the mining period. This analysis aimed to clarify the stress environment of the surrounding rock in the roadway.
(1)
Model parameters and mechanical parameters
The model has dimensions of 300 m × 370 m × 82 m, with the cross-section of the two roadways being a rectangular shape measuring 4.5 m in width and 2.8 m in height. Protective coal pillars, measuring 45.5 m, are reserved on both sides, while 50 m of protective coal pillars are allocated in front of and behind the 51,102 working face. A pressure of 1.8 MPa is applied to the roof, with lateral pressure coefficients of 0.82 and 0.91, respectively. Given that the ground at the 51,102 working face exhibits a “T”-type configuration, the model simulates the impact of the combined effects of the irregular surface and mining stress on the stability of the surrounding rock in the two roadways of the 51,102 return airway. The boundary conditions for the model are as follows: the boundaries surrounding the model are constrained to prevent horizontal displacement, the bottom boundary is restricted from vertical displacement, and the roof boundary remains free. A diagram of the numerical calculation model is presented in Figure 4.
The yielding deformation of the surrounding rock following the excavation of the coal mine occurs due to the combined effects of roof water infiltration and surrounding rock stress. The selection of parameters for numerical simulation involves continuously adjusting these parameters to ensure that the stress–strain curve and failure mode observed in the numerical simulations closely resemble those of physical experiments [37,38]. Taking into account the flow–solid coupling effect [39,40,41,42,43] and the specific underground geological conditions, the strength of the surrounding rock under conditions of gushing water can be estimated to be approximately 70% of that in a water-free environment (as illustrated in Figure 5), and is simulated using FLAC3D software (version 5.0, Itasca Consulting, Inc., Minneapolis, MN, USA). The physical and mechanical parameters for each rock layer are detailed in Table 1.
(2)
Model calculation process
The steps of the model calculation are as follows: (i) Calculate the original rock stress, (ii) tunnel the 51,102 return airway, (iii) tunnel the 51,102 intake airway, and (iv) conduct step-by-step mining at the 51,102 working face, which is divided into 15 mining steps. The numerical model’s mechanical ratio operation is set to 1 × 10⁻⁵, after which the operation is halted.

4. Results and Discussion

4.1. Water Content Change Rule

The water content of rock samples is calculated by Equation (1).
ω = (mamd)/md × 100%
where ω is the water content of rock samples, %; ma is the mass of water-soaked rock samples, g; md is the mass of dry rock samples, g.
The water content of siltstone and coarse-grained sandstone was found to increase negatively and exponentially with water immersion time, as determined by curve fitting. The relationship between water content and time is represented by Equations (2) and (3), with the corresponding fitting curves illustrated in Figure 6. Initially, the water content of the rock samples increased rapidly during stages I and II. As immersion time progressed, the rate of increase in water content gradually declined during stage III, ultimately leveling off in stage IV. Notably, the water absorption of siltstone consistently exceeded that of coarse-grained sandstone. According to Equation (1), the natural water content of siltstone is approximately 4%, while that of coarse-grained sandstone is about 1.25%. Thus, this variable must be considered when designing nondestructive immersion tests for rock samples.
ωsiltstone = −11.30446et/16.8895 + 11.15202, R2 = 0.99616
ωcoarse-grained sandstone = −4.50601et/21.83815 + 4.855571, R2 = 0.96024
where ω denotes the water content of the rock specimen, %; t denotes the immersion time of the rock specimen, and h; R2 denotes the goodness of fit of the fitted curve.

4.2. Change the Rule of Mechanical Properties

The stress–strain curves of selected rock samples are presented in Figure 7. As water content increases, the peak strength of siltstone rock samples consistently decreases. The peak strength of dry rock samples is measured at 10.566 MPa, while the peak strength of samples with 4% water content (natural state) is 9.475 MPa. When the water content rises to 6%, the peak strength further decreases to 8.562 MPa. At 9% water content, the peak strength drops to 7.413 MPa, and it remains at 7.413 MPa when the water content reaches 11% (saturated state). Notably, the peak strength of the samples declines to 4.798 MPa at 11% water content (saturated state), representing a reduction of more than half compared to the peak strength of the dry samples. Specifically, there is a 54.59% decrease in peak strength relative to the dry samples. This observation suggests that water action has inflicted damage on the internal structure of the rock samples, adversely affecting their uniaxial compressive strength. Prior to reaching peak strength, the stress–strain curves of the rock samples exhibit an increase, with higher water content leading to a gradual reduction in the elastic deformation of the samples during the loading process.
With the increase in water content, the peak strength of the coarse-grained sandstone samples continued to decline. Specifically, the peak strength of the dry samples was measured at 86.12 MPa, whereas the peak strength decreased to 27.57 MPa when the water content reached 5% (saturation), representing a reduction of 67.99% compared to the dry samples. This substantial decrease indicates a more pronounced sensitivity of coarse-grained sandstone to water, as the rock sample absorbs water at a lower rate, leading to a greater decline in peak strength. Consequently, the damage inflicted by water on the internal structure of the sandstone is more significant. The physical and mechanical parameters of the rock layer at the roof of the 51,102 return airway were derived by collating and summarizing the results of the aforementioned experiments, with detailed information presented in Table 2 and Table 3.
In summary, the axial compressive strength of siltstone decreased from 10.57 MPa in dry conditions to 4.80 MPa at 11% water content (saturated), reflecting a reduction of 54.59%. Similarly, the axial compressive strength of coarse-grained sandstone decreased from 86.12 MPa in dry conditions to 27.57 MPa at 5% water content (saturated), resulting in a decrease of 67.99%. These findings indicate that the physical and mechanical properties, including compressive strength, shear strength, and tensile strength, are consistently diminished, highlighting that the influence of water on the roof rock layer of the 51,102 return airway is significant.

4.3. Stress Evolution Characteristics

The evolution of coal seam roof stress under the influence of factors such as roof drenching, irregular surfaces, and mining is analyzed, as illustrated in Figure 8. The key findings are summarized as follows:
(1)
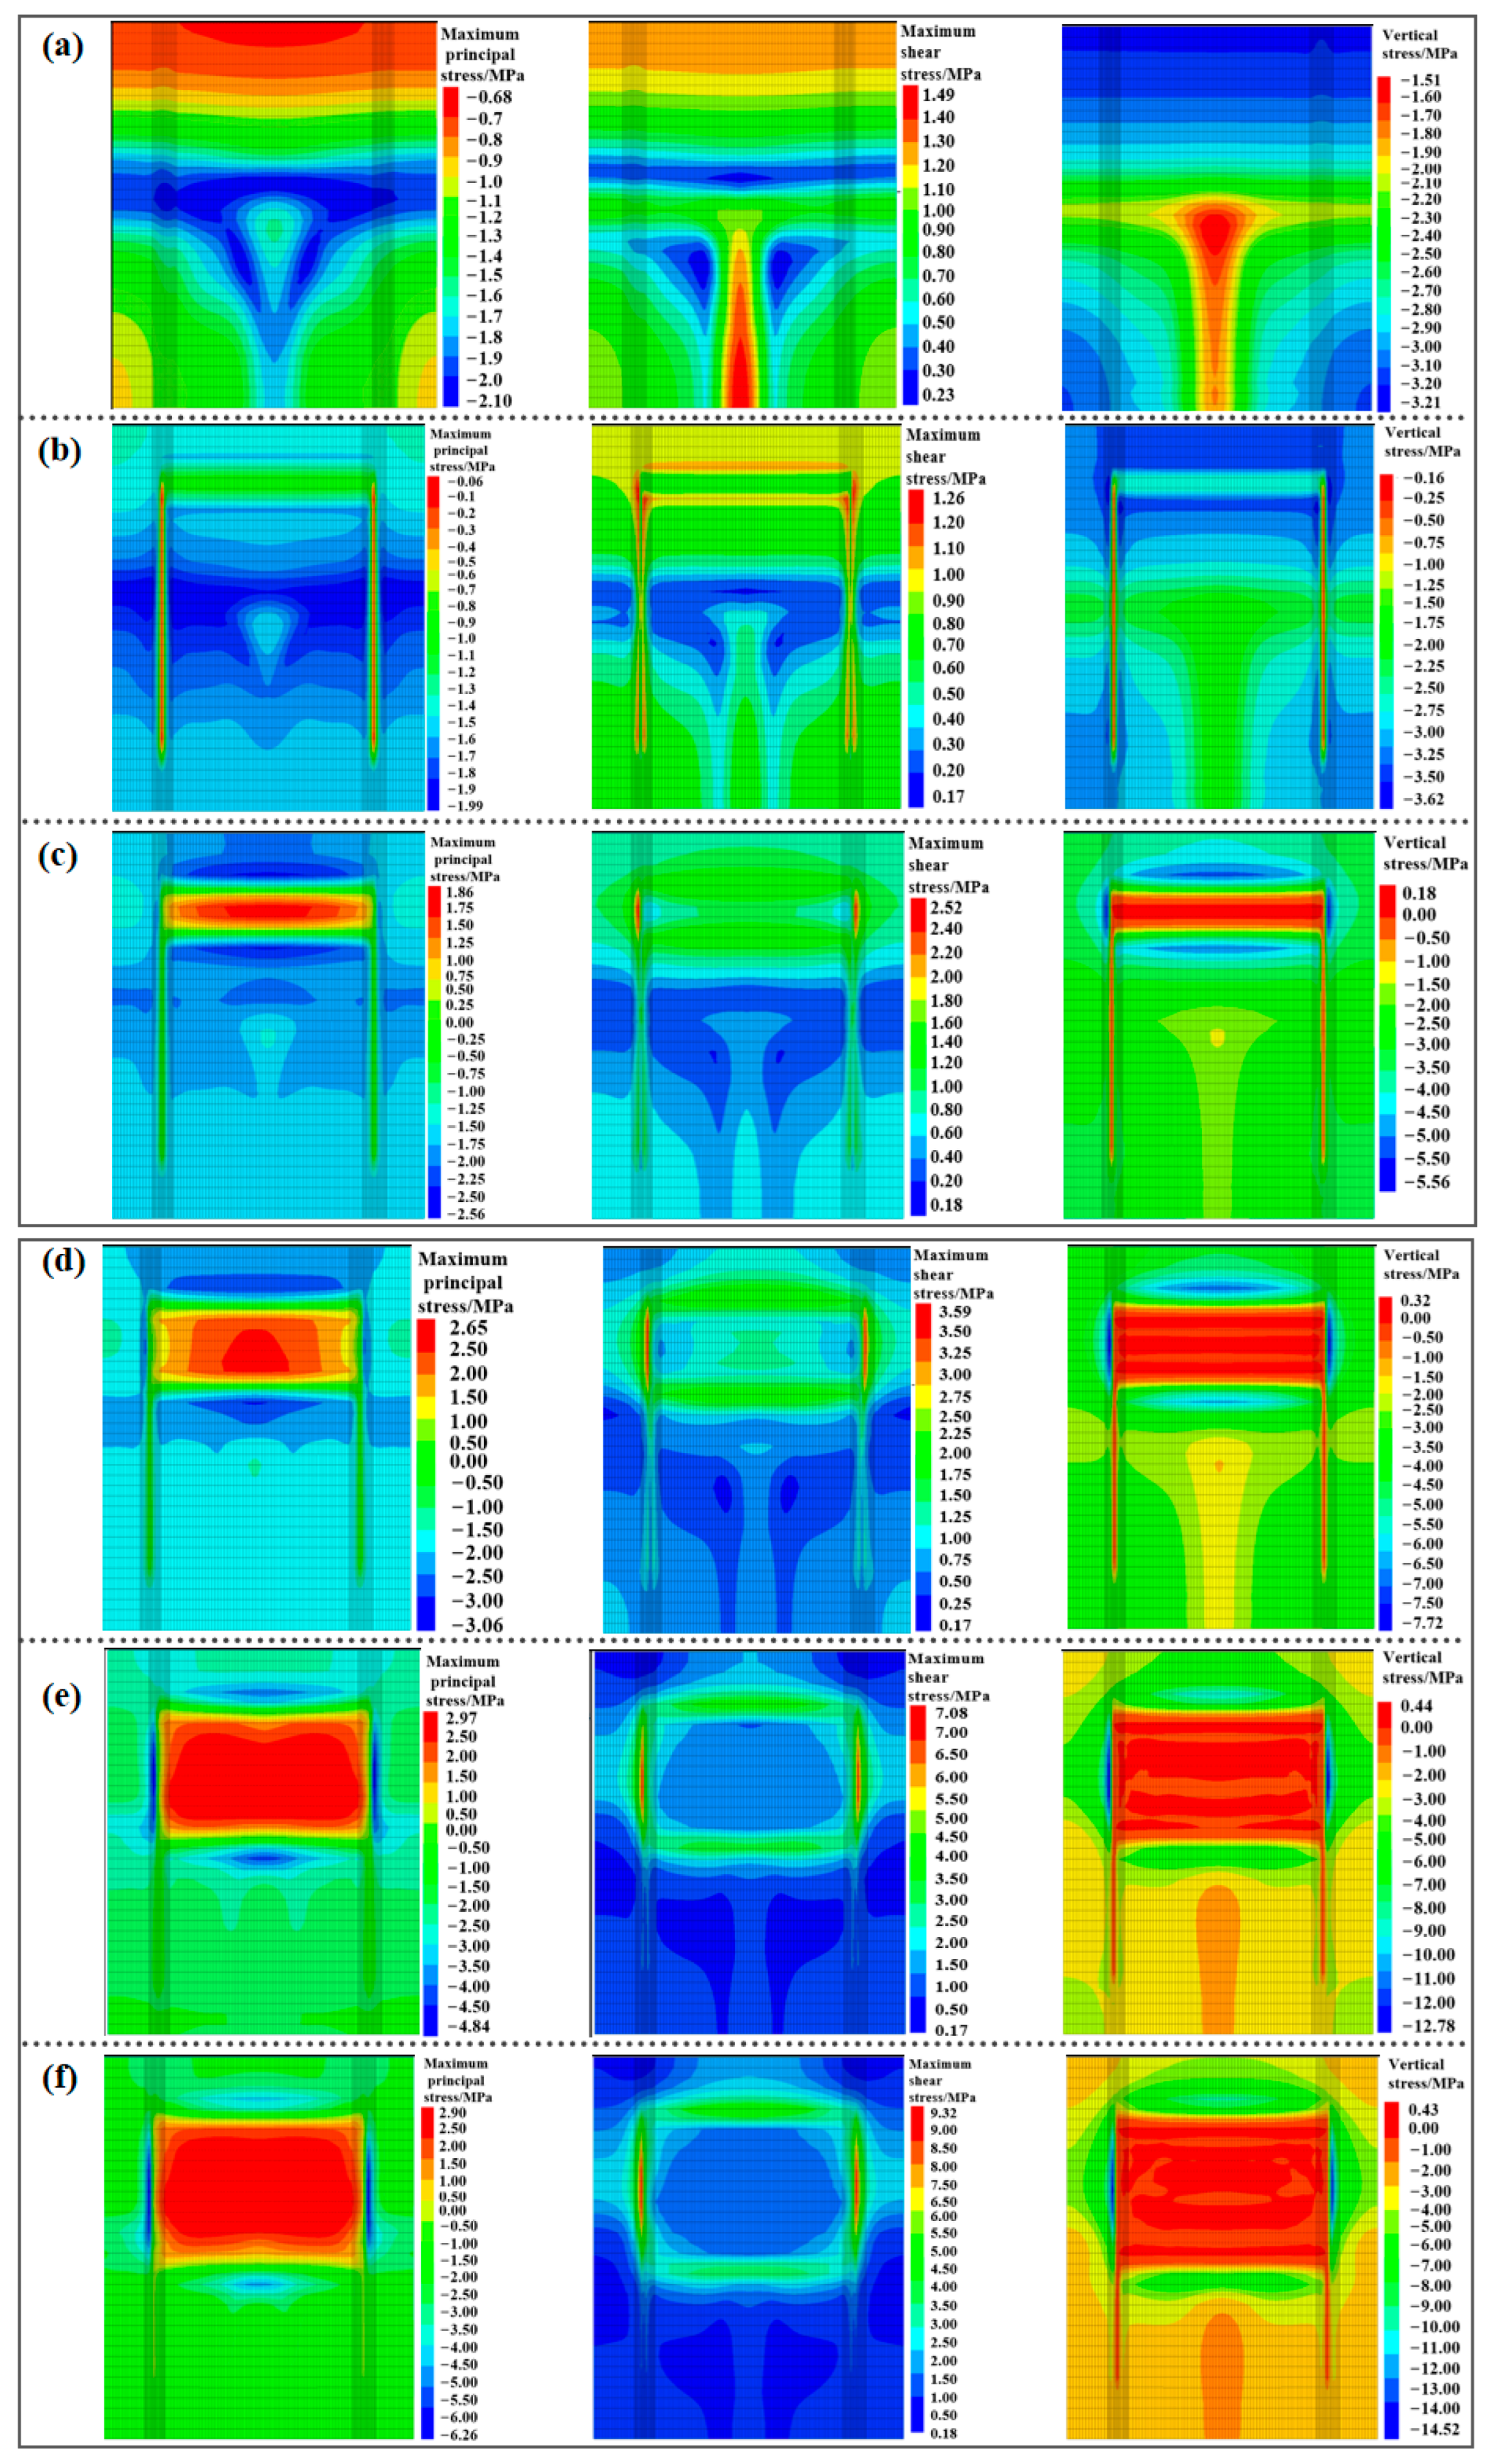
Influence of irregular surfaces: The presence of a “T”-shaped irregular surface induces significant alterations in the distributions of maximum principal stress and maximum shear stress. The maximum principal stress concentration occurs beneath the “T” surface and outside its connection, with a small stress reduction area observed at the intersection of the “T”. The maximum shear stress is concentrated within the “T” channel due to the compression of adjacent rock layers. The vertical stress distribution is influenced by the thickness of the overlying rock layers, revealing a stress reduction zone on the “T” surface and concentration zones in higher terrains and at the bases of slopes.
(2)
Influence of mining: In the initial stages of mining, there is no significant impact on the distribution of maximum principal stress. However, as mining progresses, areas of maximum principal stress concentration develop in both the advanced and lagging stages of the working face, with peak values increasing. The extent of this concentration is contingent upon the mining distance, with larger ranges observed at 50 m, 90 m, and 140 m from the working face.
(3)
Post-mining shear stress: Following mining operations, maximum shear stress concentration is evident around the goaf area and the advanced section of the roadway. Within a range of 10 m to 90 m from the mining site, the shear stress in the roadway roof is significantly elevated compared to other areas, reaching a maximum of approximately 2.19 MPa.
(4)
Vertical stress distribution: Consistent zones of vertical stress concentration are identified around the working face. A stress reduction zone forms above the roadway roof after the advancement of the 51,102 working face by 90 m, coinciding with the influence zone of the “T”-shaped surface.
Figure 9 illustrates that following the excavation of the two roadways associated with the 51,102 working face, the mining activities at the 51,102 working faces did not impact the distribution of maximum principal stress and vertical stress in the roof of the roadways. Both distributions remained consistent, with only minor alterations observed in the openings of the roadway and the position of the open-off cut.
Prior to the excavation of the roadway, a zone of maximum shear stress reduction was identified beneath the “T” corner position. Following the completion of the two roadways, a relatively high maximum shear stress was observed within 10 m both in front of and behind the opening, with the maximum shear stress concentration occurring approximately 8 m behind the open-off cut. Before the mining of 90 m of the working face and prior to reaching the surface of the “-” section, fluctuations in the maximum shear stress of the roof were noted. However, the trend of maximum shear stress at the face remained consistent across varying mining distances. It was observed that as the distance of the face mined increased, the value of the maximum shear stress also rose. Notably, the maximum shear stress of the roof experienced a rapid increase after the working face was mined back to 140 m, particularly below the “1” section, with an influence range of approximately 24 m. The maximum shear stress continued to rise as the mining distance extended to 160 m of the working face, ultimately reaching 0.55 MPa. Throughout the mining of the 51,102 working face, the distribution of maximum shear stress played a critical role in the stability of the surrounding rock in both roadways [44,45].

5. Principles of High-Strength Economic Support and Industrial Testing

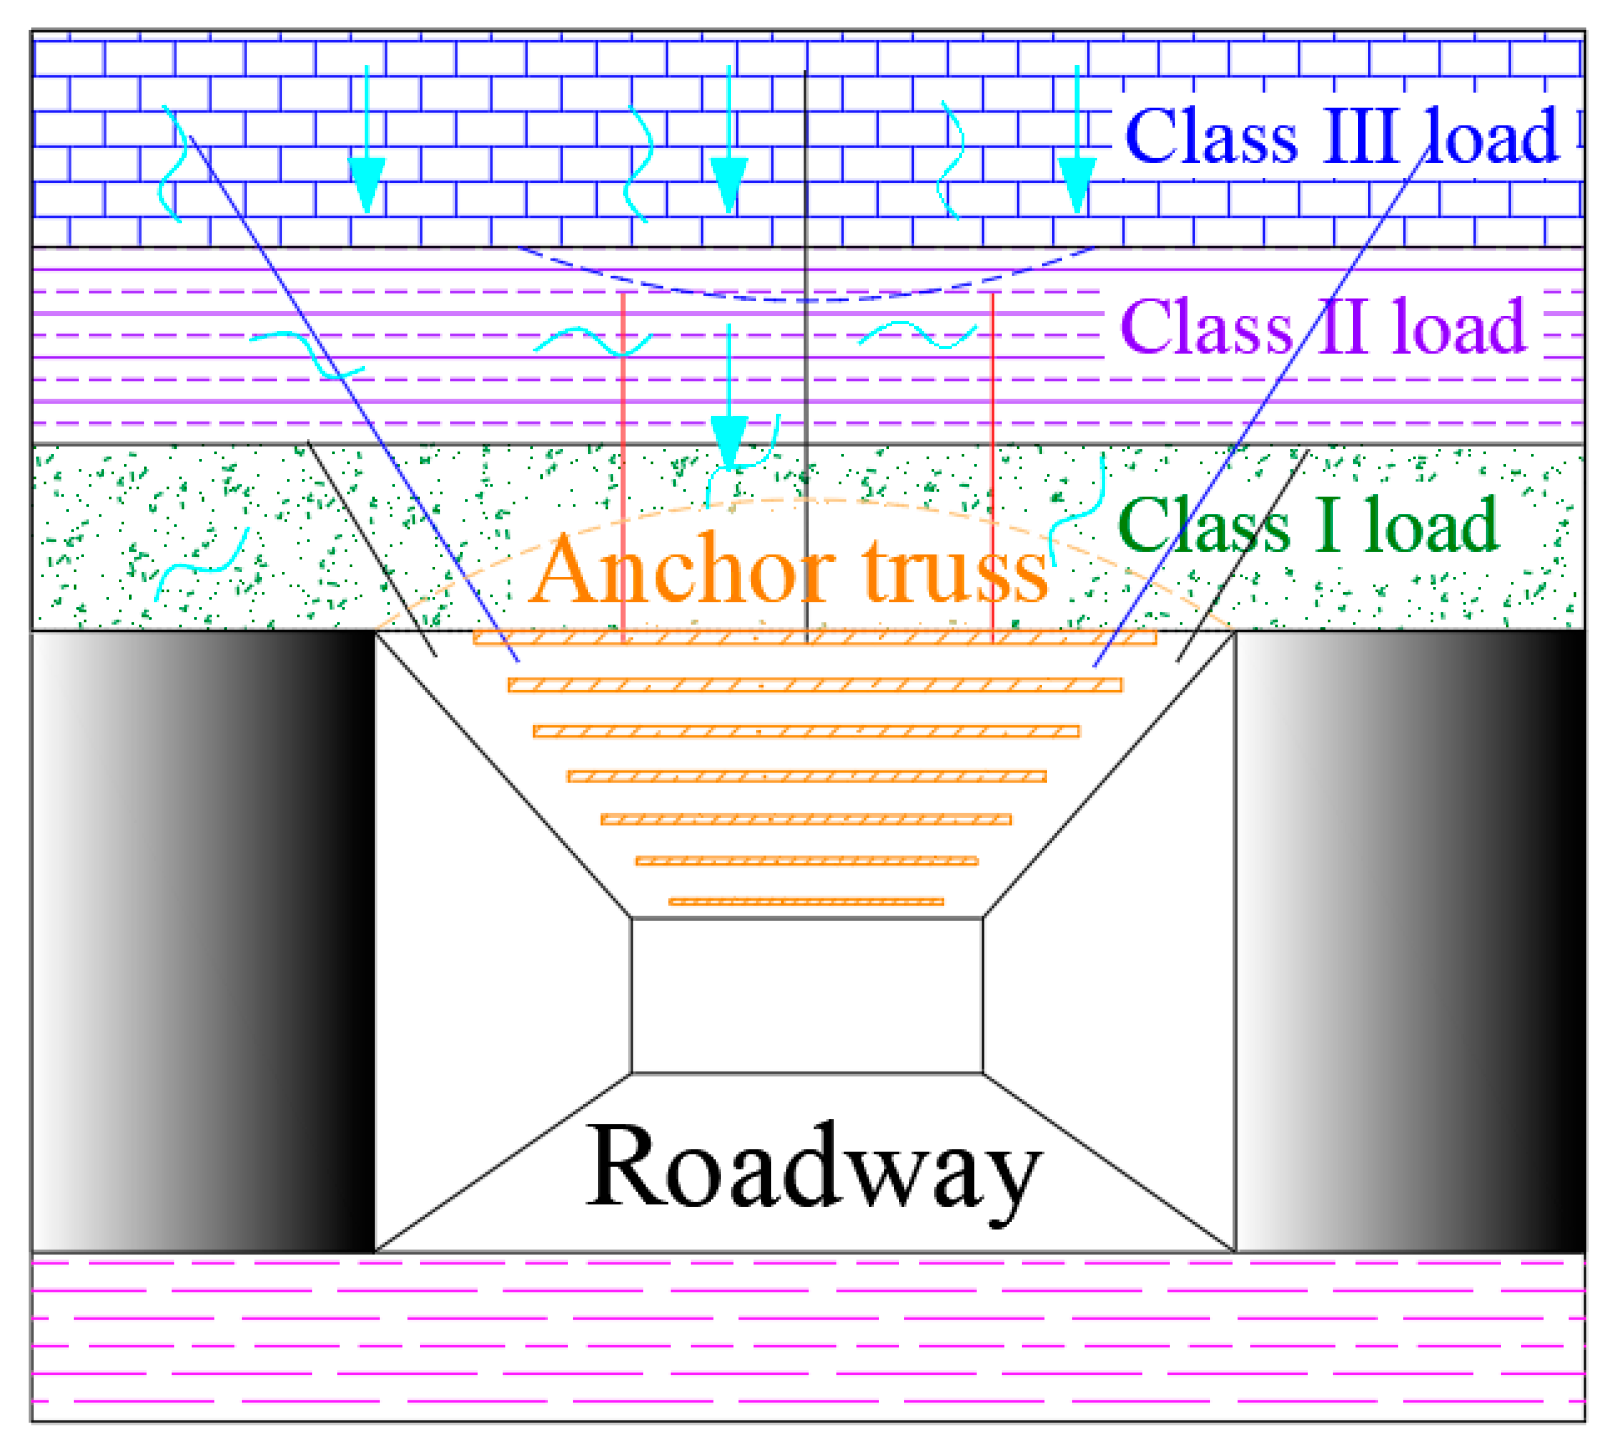
5.1. Principle of High-Strength Economic Support

The challenges associated with supporting soft rock roadways beneath the uneven surface of thin bedrock primarily manifest in three key areas: roof watering, the continuous weakening of lithology, and significant shear stress [46,47]. To address these issues, it is essential to adhere to four fundamental principles, “controlled hydrophobicity, structural adjustment, zoning management, and gradient control”, when determining the roadway support parameters. Based on these principles, the proposed “four-in-one” surrounding rock control technology for managing roof watering in soft rock roadways is outlined as follows:
Effective water management is essential, involving the cessation of water supply from the ground to the underground. Water infiltration into the underground should be controlled through centralized discharge and the drilling of holes in the roof to achieve regulated hydrophobicity. Concurrently, a waterproof anchoring agent should be utilized to reinforce the anchor “bearing foundation”, thereby enhancing the prestressing effect of the active support system. To ensure the safety of the roadway while reducing support density, it is crucial to connect the anchor rods (or cables) as a cohesive unit, which improves the coordination of the support system. This coordination involves strengthening the connections between the anchor rods (cables) and maintaining the integrity of the support system. Attention must be paid to the coupling between the support body and the surrounding rock to achieve comprehensive control over the support. In the case of soft rock roadway support, the primary focus should be on preventing the development of the anchorage zone outside the layer. If this zone continues to expand, it may lead to the collapse of the anchorage zone as a whole. Implementing anchor truss support can effectively address this issue. Additionally, altering the installation angle of the anchor cable (with an inclination of no less than 15°) in conjunction with a W steel belt can form a truss structure, anchoring the cable to the roof of the coal pillar to adjust the structure of the surrounding rock and enhance the anchoring effect. Based on the amount of water present in the roof and the anchoring effectiveness of the anchor rods (cables), the roadway can be categorized into different zones: Zone A (no water), Zone B (slight watering), and Zone C (significant watering). Different control schemes have been developed to facilitate zonal management and coordinated management and control of soft rock roadways. By considering the variations in geological conditions and the watering situation, the integration of long and short anchor cables with anchors enables hierarchical support. This approach modifies the structure of the shallow surrounding rock and establishes a multilevel bearing structure in the roof. Furthermore, the use of long and short cables in conjunction with anchor rods allows for graded support, thereby altering the structure of the shallow surrounding rock and constructing a multistage bearing structure in the roof slab to achieve graded control of both deep and shallow surrounding rock. Ultimately, a comprehensive “four-in-one” surrounding rock control system for soft rock roadways with roof watering has been established, as illustrated in Figure 10.
During the excavation of the 51,102 return airway, a water search and discharge chamber is installed every 120 m, with each chamber equipped with three to four water search and discharge drill holes. These drill holes are inclined at an angle of +8° to the roof, while the construction level is approximately 23 m above the roof. A photograph of the underground layout of the workface boreholes is presented in Figure 11.

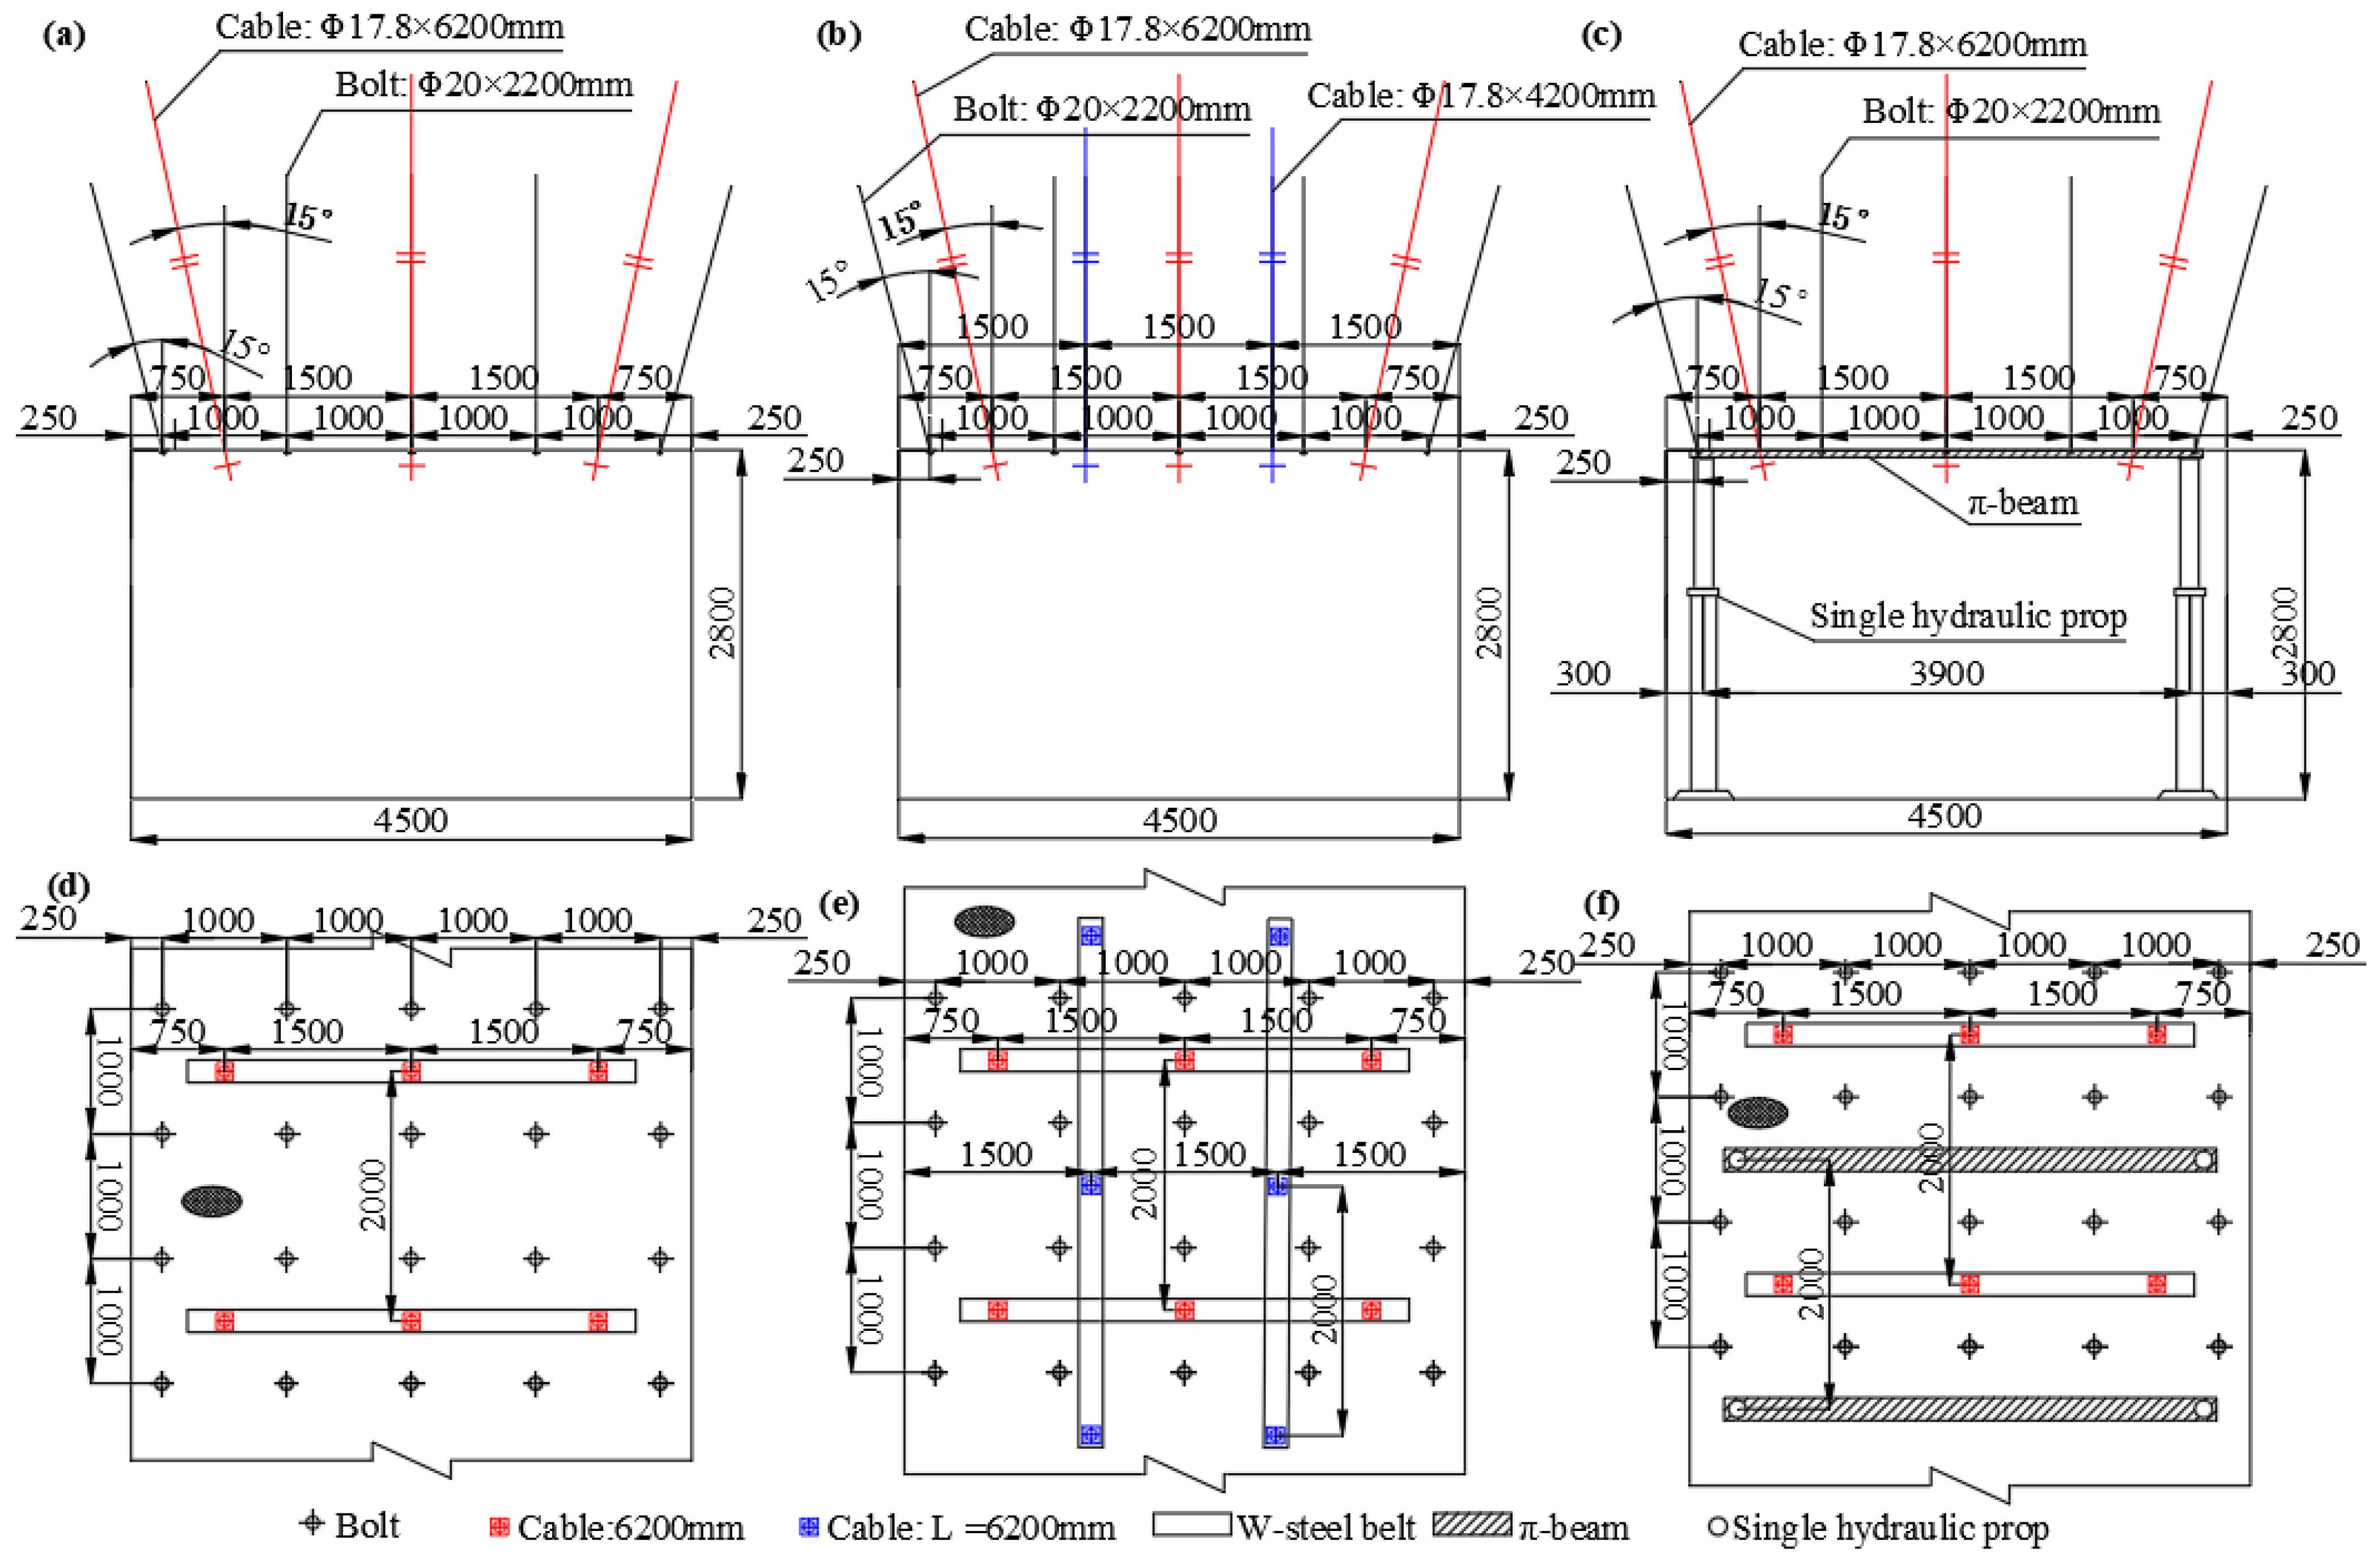
5.2. Support Programme for 51,102 Return Airway

To implement the zoning management of the 51,102 return airway, various support schemes tailored to different zones were developed by integrating the site conditions; the specifics are illustrated in Figure 12.
(1)
Supporting scheme for A and B zones
The anchor rods are arranged in rows on the roof, with five anchor rods per row and a spacing of 1000 × 1000 mm between rows. Each outer side is positioned 250 mm from the edges of the roadway. The shoulder angle anchor rods are inclined at 15°, while the remaining rods are oriented vertically. The rods are Φ20 mm left-handed nonlongitudinal rebar, made of steel number 335, and have a length of 2200 mm. One CK2360 and one CK2350 are employed for lengthening the anchorage. The required anchor torque is not less than 180 N·m, and the design anchorage force is specified to be no less than 105 kN.
The arrangement of anchor cables consists of three cables per row on the roof, with a spacing of 1500 × 2000 mm between rows and an outer distance of 750 mm from the roadway sides. The central anchor cable is positioned vertically on the roof, while the anchor cables on either side are inclined at an angle of 15°. Each anchor cable is constructed from Φ17.8 mm, 1 × 7 strands of high-strength, low-relaxation prestressing steel strand, with a length of 6200 mm. The system employs one MSCK2360 and two MSCK2350 components for lengthening and anchoring purposes. Each row of anchor cables is complemented by a 3800 × 230 × 3 mm W steel strip, which, in conjunction with the anchor cables, forms a truss structure. The pretensioning force of each anchor cable is specified to be no less than 150 kN, while the designed anchoring force is set at a minimum of 211.8 kN.
(2)
Support scheme of C zone
Influenced by water, the attenuation speed of anchor rods (cables) may become inconsistent. According to field tests, the demarcation line is defined by whether the anchoring force attenuation reaches 20% within 10 days following the completion of support. The C zone is further subdivided into two sections: one characterized by slower attenuation of anchoring force, referred to as the C1 zone, and the other marked by faster attenuation, known as the C2 zone.
① Slow attenuation of anchoring force (C1 zone)
Four FSCK2340 waterproof anchor rods and three FSCK2340 waterproof anchor rods were utilized. To provide support in the waterless and slightly damp areas, short anchor cables and W steel strips were added to the roof to create a “tic-tac-toe” structure. Two short anchor cables were arranged in the middle of each pair of long anchor cables and were connected longitudinally using W steel strips. The distance between the rows was set at 1500 × 2000 mm, with each row positioned 1.500 mm away from the roadway sides. The anchor cable material consists of Φ17.8 mm, 1 × 7 strands of high-strength low-relaxation prestressing steel strand, with a length of 4200 mm for the short anchor cables. All other support parameters remained consistent with those of the anchor cable support described in the previous section.
② Fast decay of anchorage force (C2 zone)
To achieve active support, it is recommended to utilize a waterproof anchoring agent in conjunction with an anchor cable. Additionally, a monolithic hydraulic strut (DW31.5 − 350/110X(H)) combined with a π-type steel beam should be employed to provide support for the roadway. Each row will consist of two monoliths, positioned 300 mm from the roadway side, with a spacing of 1000 mm between the pillars. A single π-type steel beam will be supported by each pair of monoliths, and it is essential that these components are equipped with shoes and hats.

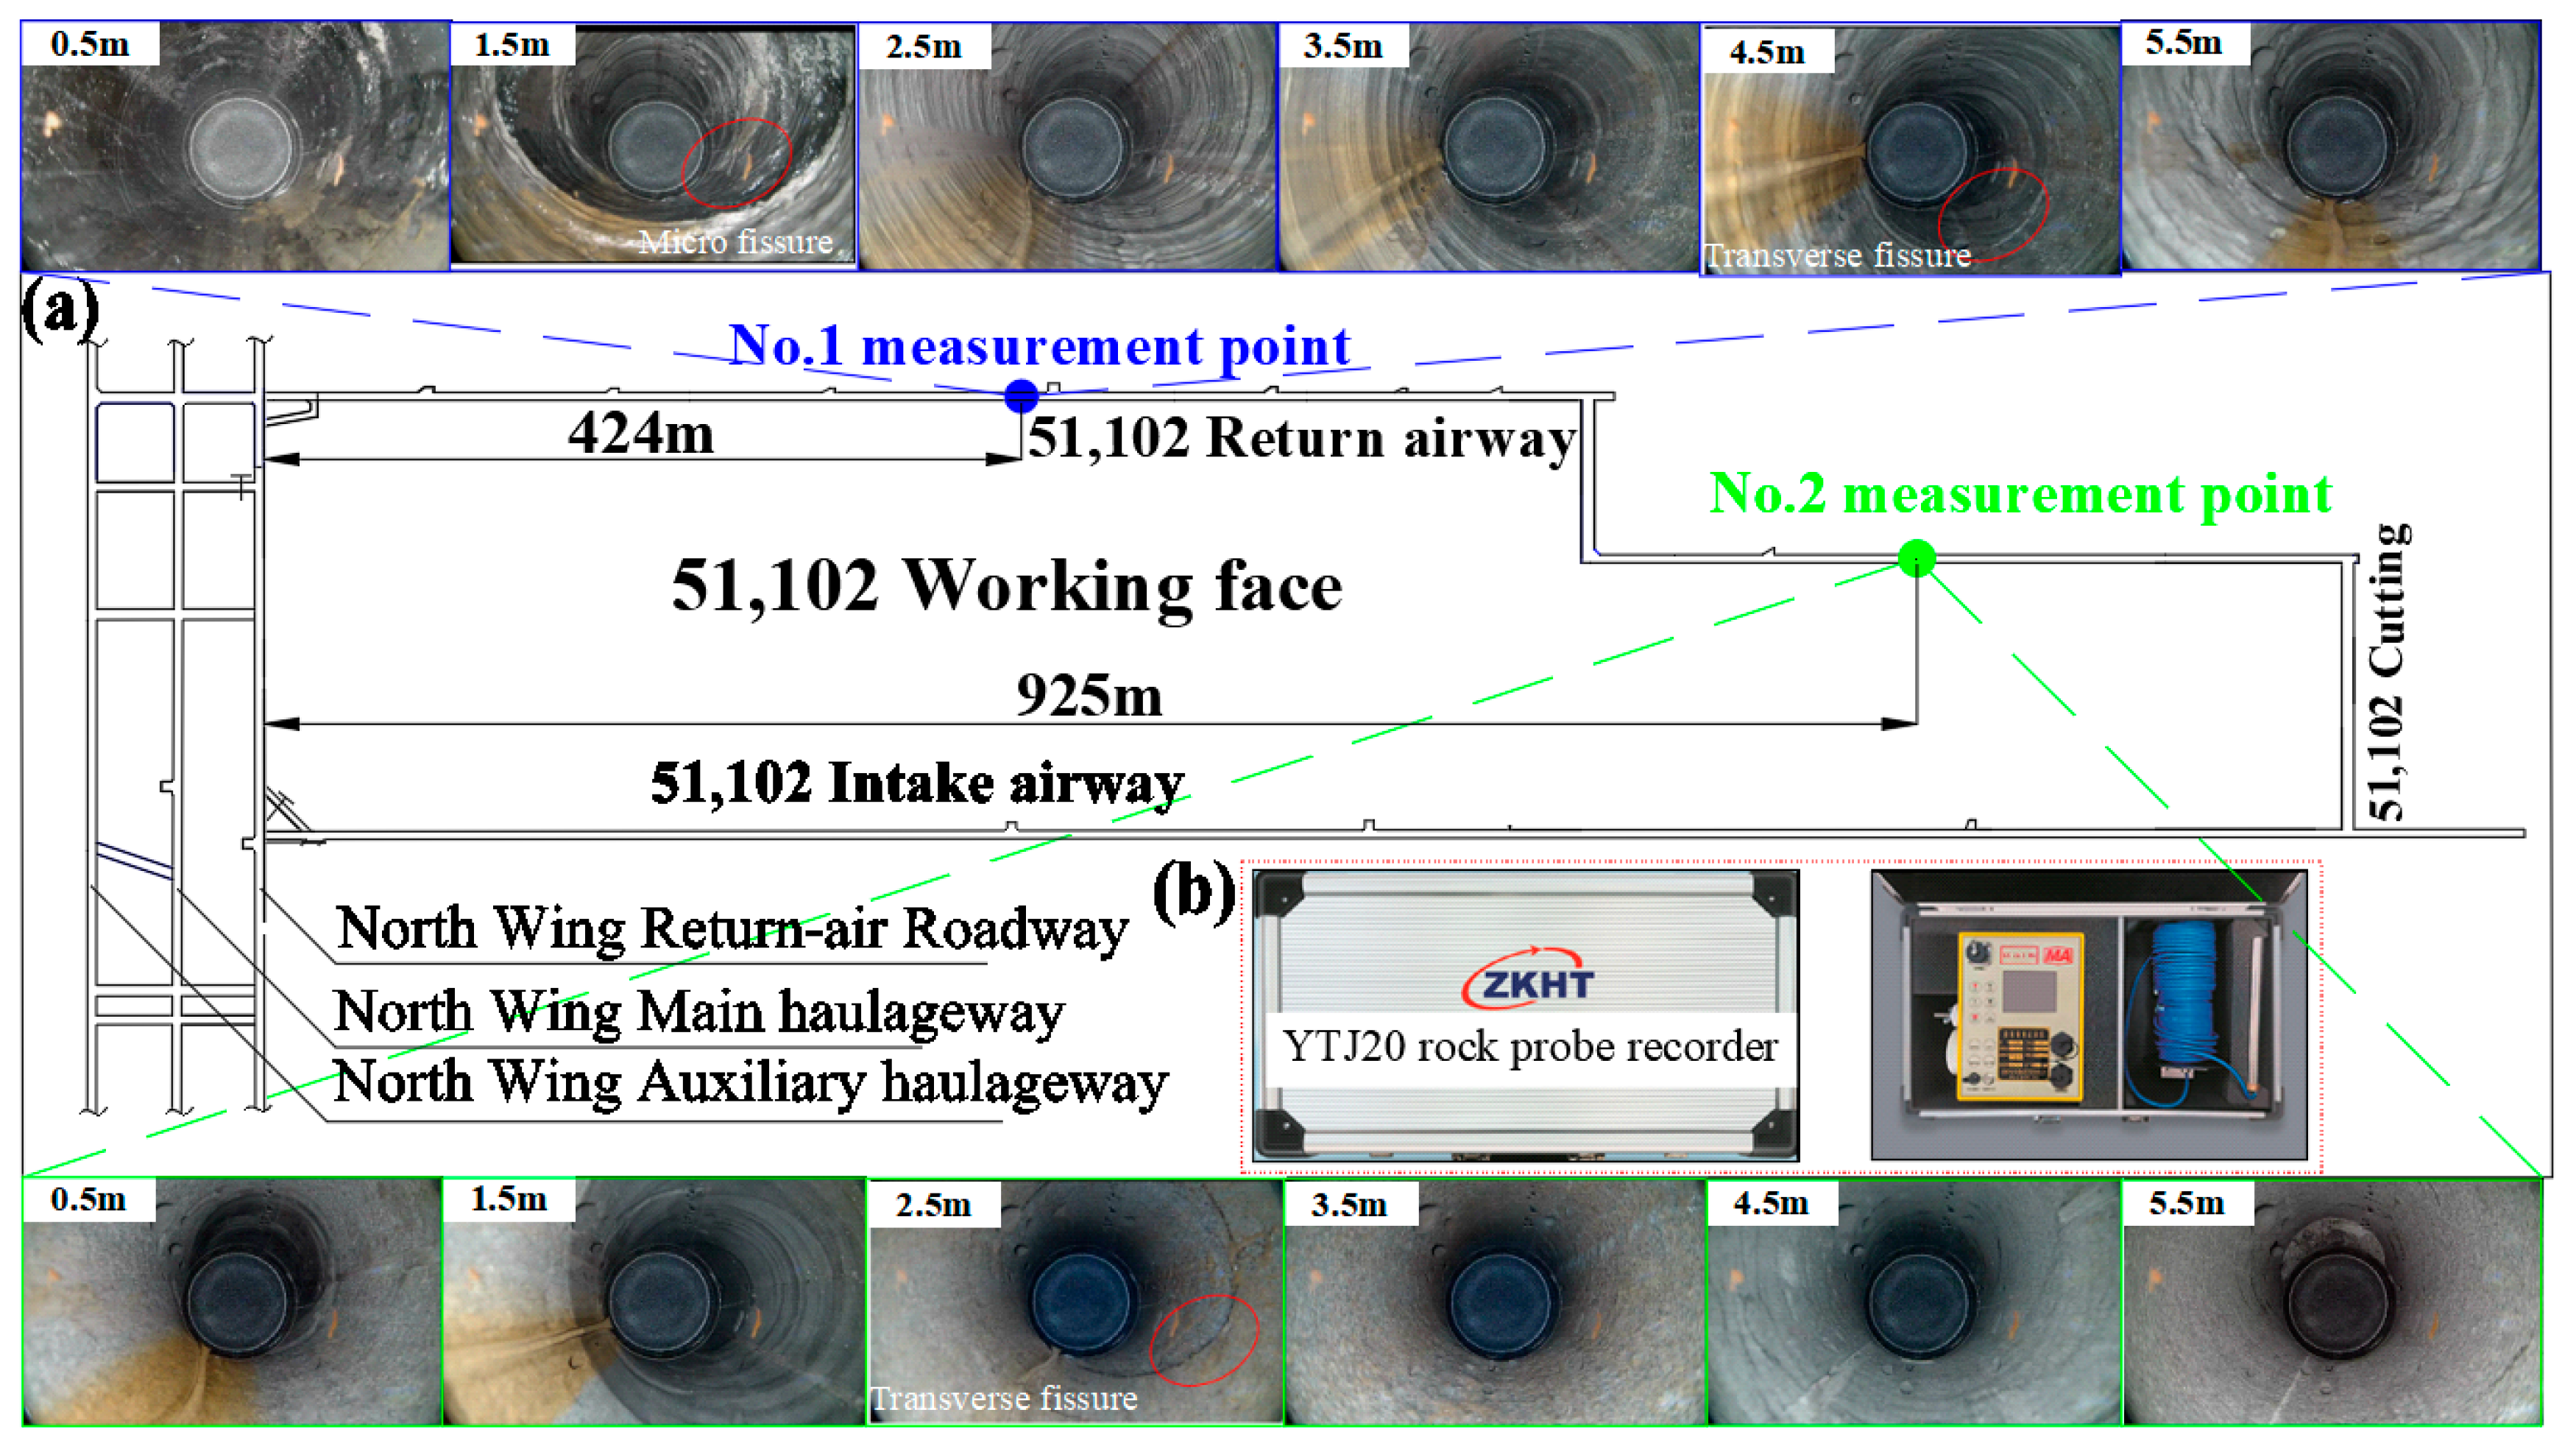
5.3. Analysis of Mineral Pressure Monitoring Results

(1)
The analysis of drilling observation
The YTJ20 type mining electronic drilling peeper was adopted, with a drill hole diameter of φ30 mm. Two measurement points were established at distances of 424 m and 925 m from the opening of the 51,102 return airway, respectively. This setup was utilized to examine the structural characteristics of the roof rock layer, with a peeping depth of 8 m, and several drilling peeping images were selected for analysis. Observations from the drilled holes revealed a limited number of fissures located 1.5 m above the roof of the 51,102 return airway, with additional minor transverse fissures noted at depths of 2.5 m and 4.5 m. Overall, the integrity of the rock layer was assessed as good. These findings indicate that the optimized scheme effectively leverages the active support provided by anchor rods (anchor cables), enhancing the integrity of the surrounding rock and inhibiting the expansion and development of surrounding rock fissures. Detailed results are presented in Figure 13.
(2)
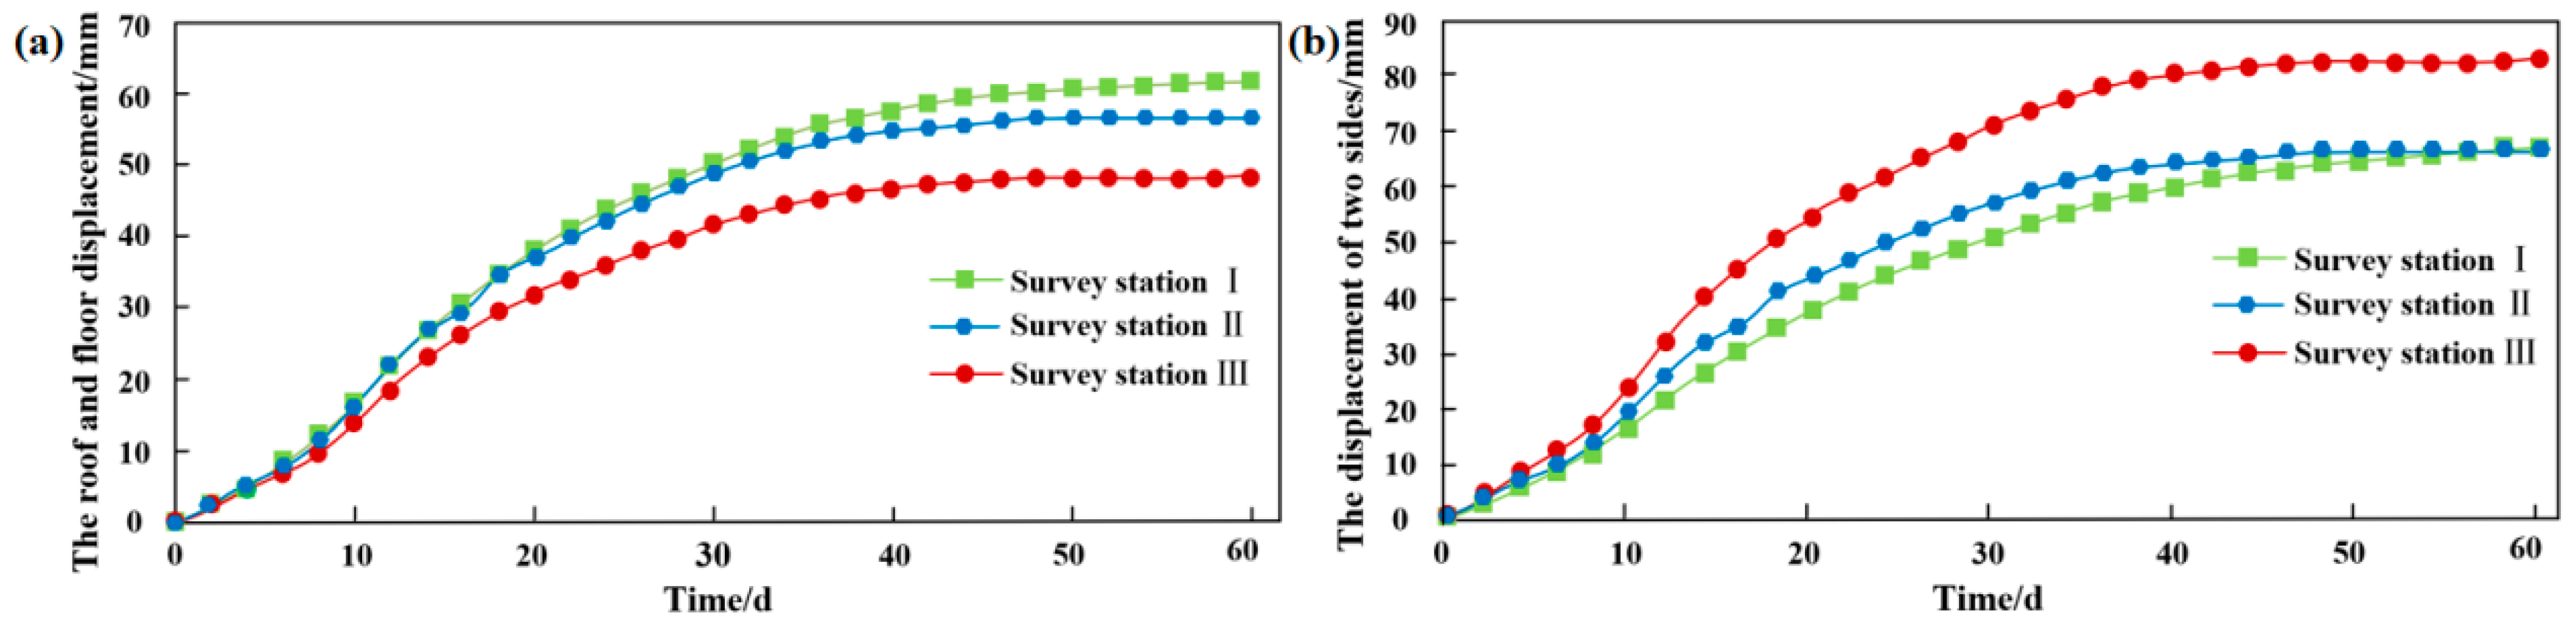
Roadway surface displacement monitoring
Since the formation of the open-off cut at the working face, the surface displacement changes at different stations during the mining period were recorded. Three stations were selected in the 51,102 return airway and designated as I, II, and III. The maximum displacement values at each station were compiled, as shown in Table 4, and a displacement curve was generated, as illustrated in Figure 14.
① The displacement of each measuring point on the surface of the surrounding rock of the 51,102 return airway increases over time. Influenced by mining activities, the surrounding rock exhibits a higher deformation rate during the first 15 days, with the maximum deformation rates recorded at the roof of the 51,102 return airway and its two sides reaching 1.9 mm/d and 2.7 mm/d, respectively. After 30 days, the deformation rate at each measuring point gradually decreases, with the roof and floor of the 51,102 return airway and the two sides recording deformation rates of 1.9 mm/d and 2.4 mm/d, respectively. By 40 days, the deformation rates stabilize at 1.9 mm/d for the roof and 2.4 mm/d for the sides, while the displacement at each measuring station reaches 1.4 mm/d and 2.4 mm/d, respectively. It can be concluded that the 51,102 return airway is approaching a stable state at this point.
② The maximum displacements recorded for the roof, floor, and two roadway sides of the 51,102 return airway were 36.2 mm, 37.8 mm, and 68.3 mm, respectively. The surface displacement in the advanced section of the 51,102 return airway varies significantly due to mining activities; however, the deformation observed during the mining period remains within the permissible limits for roadway deformation.
The support scheme implemented for the 51,102 return airway, as presented in this study, effectively mitigates harmful deformations of the surrounding rock, demonstrating a clear support effect, as detailed in Figure 15.

6. Conclusions

(1)
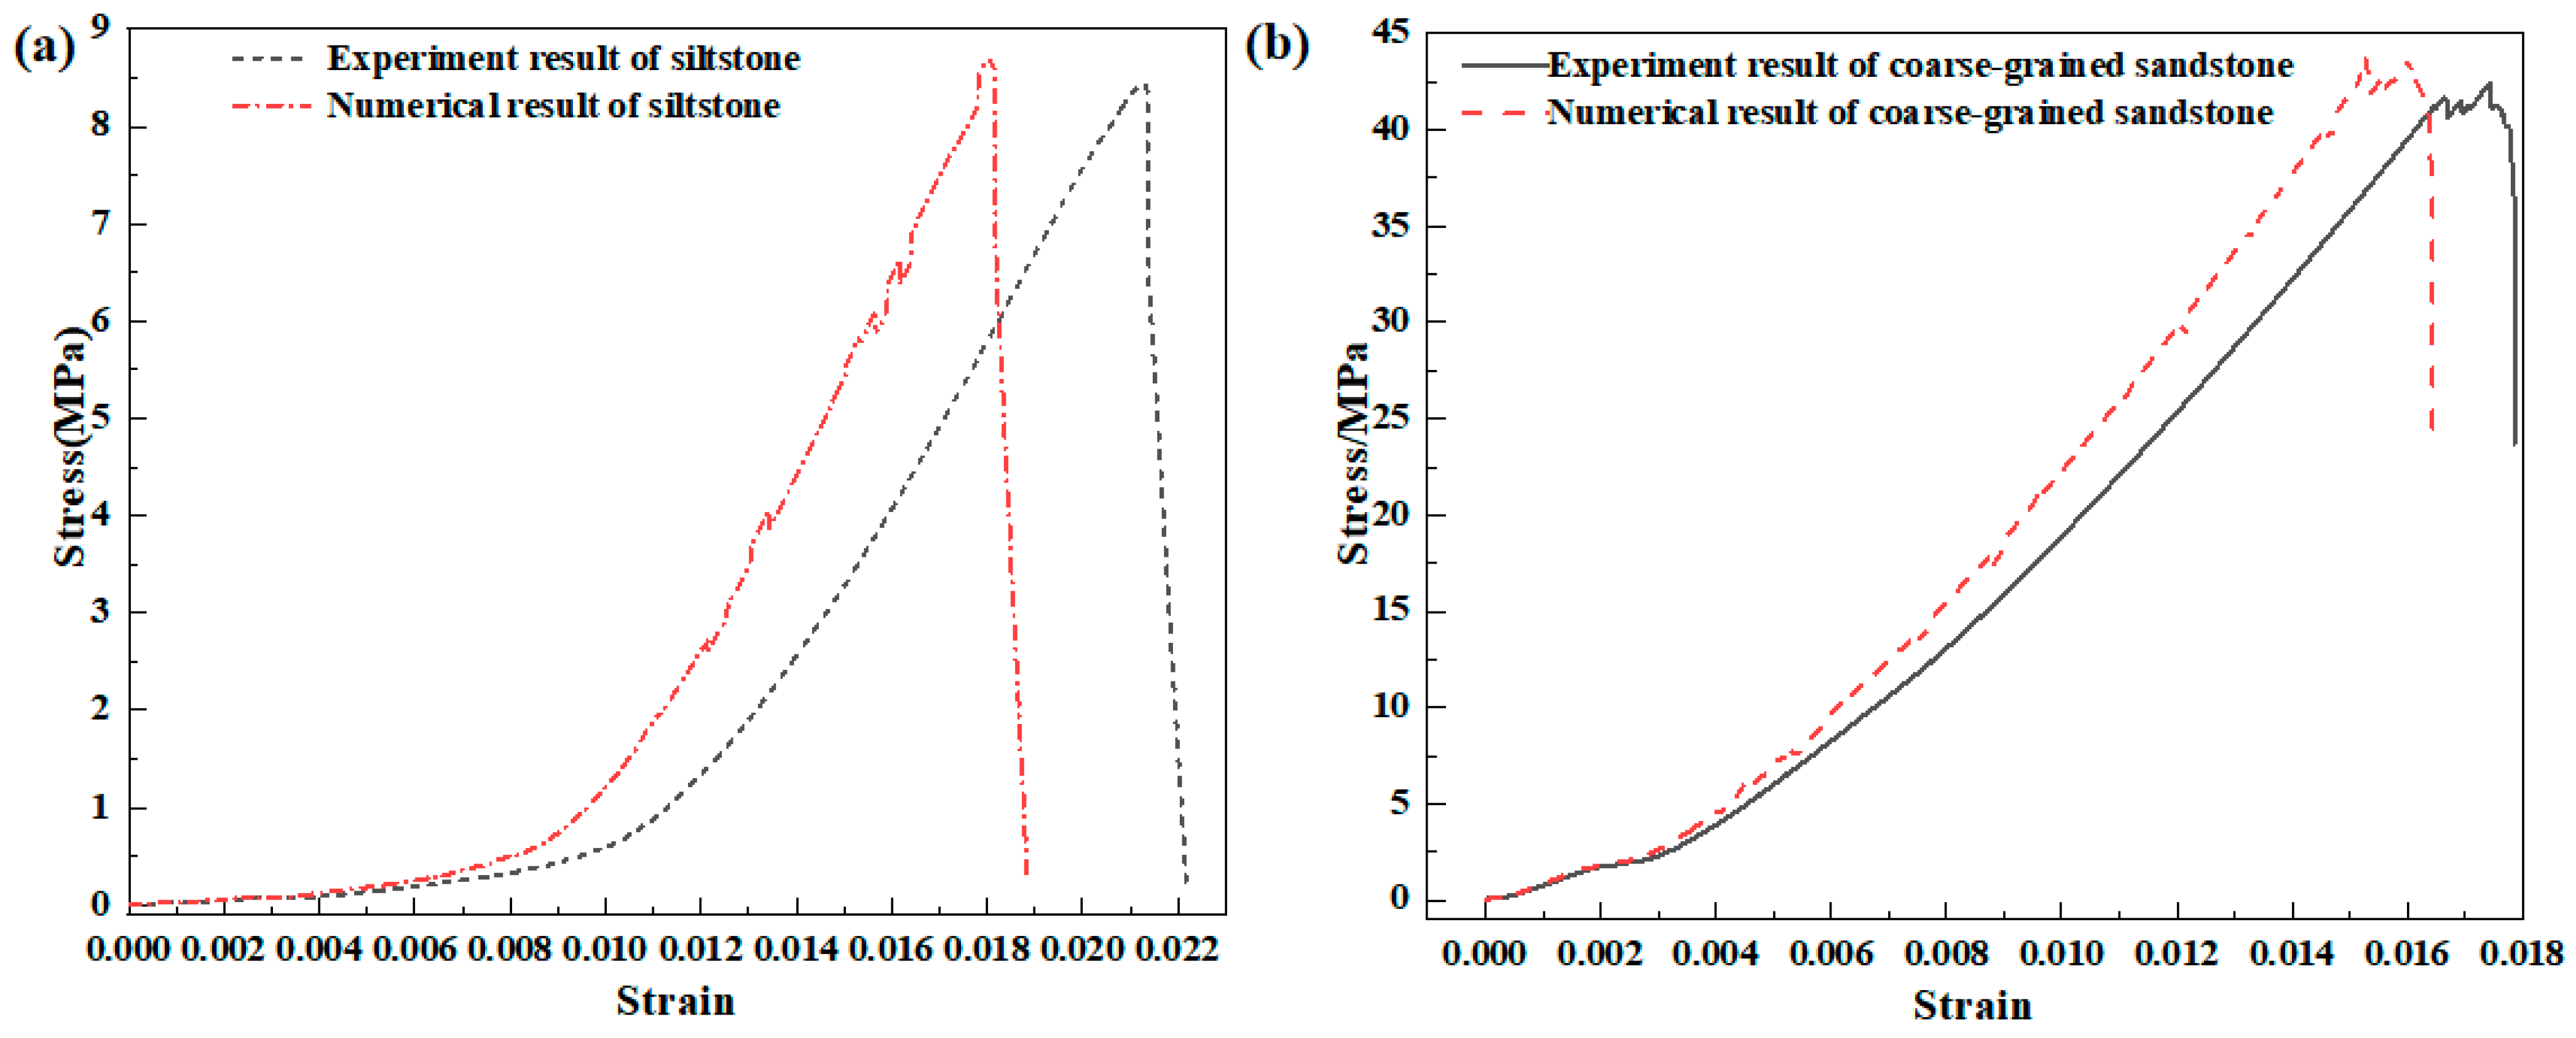
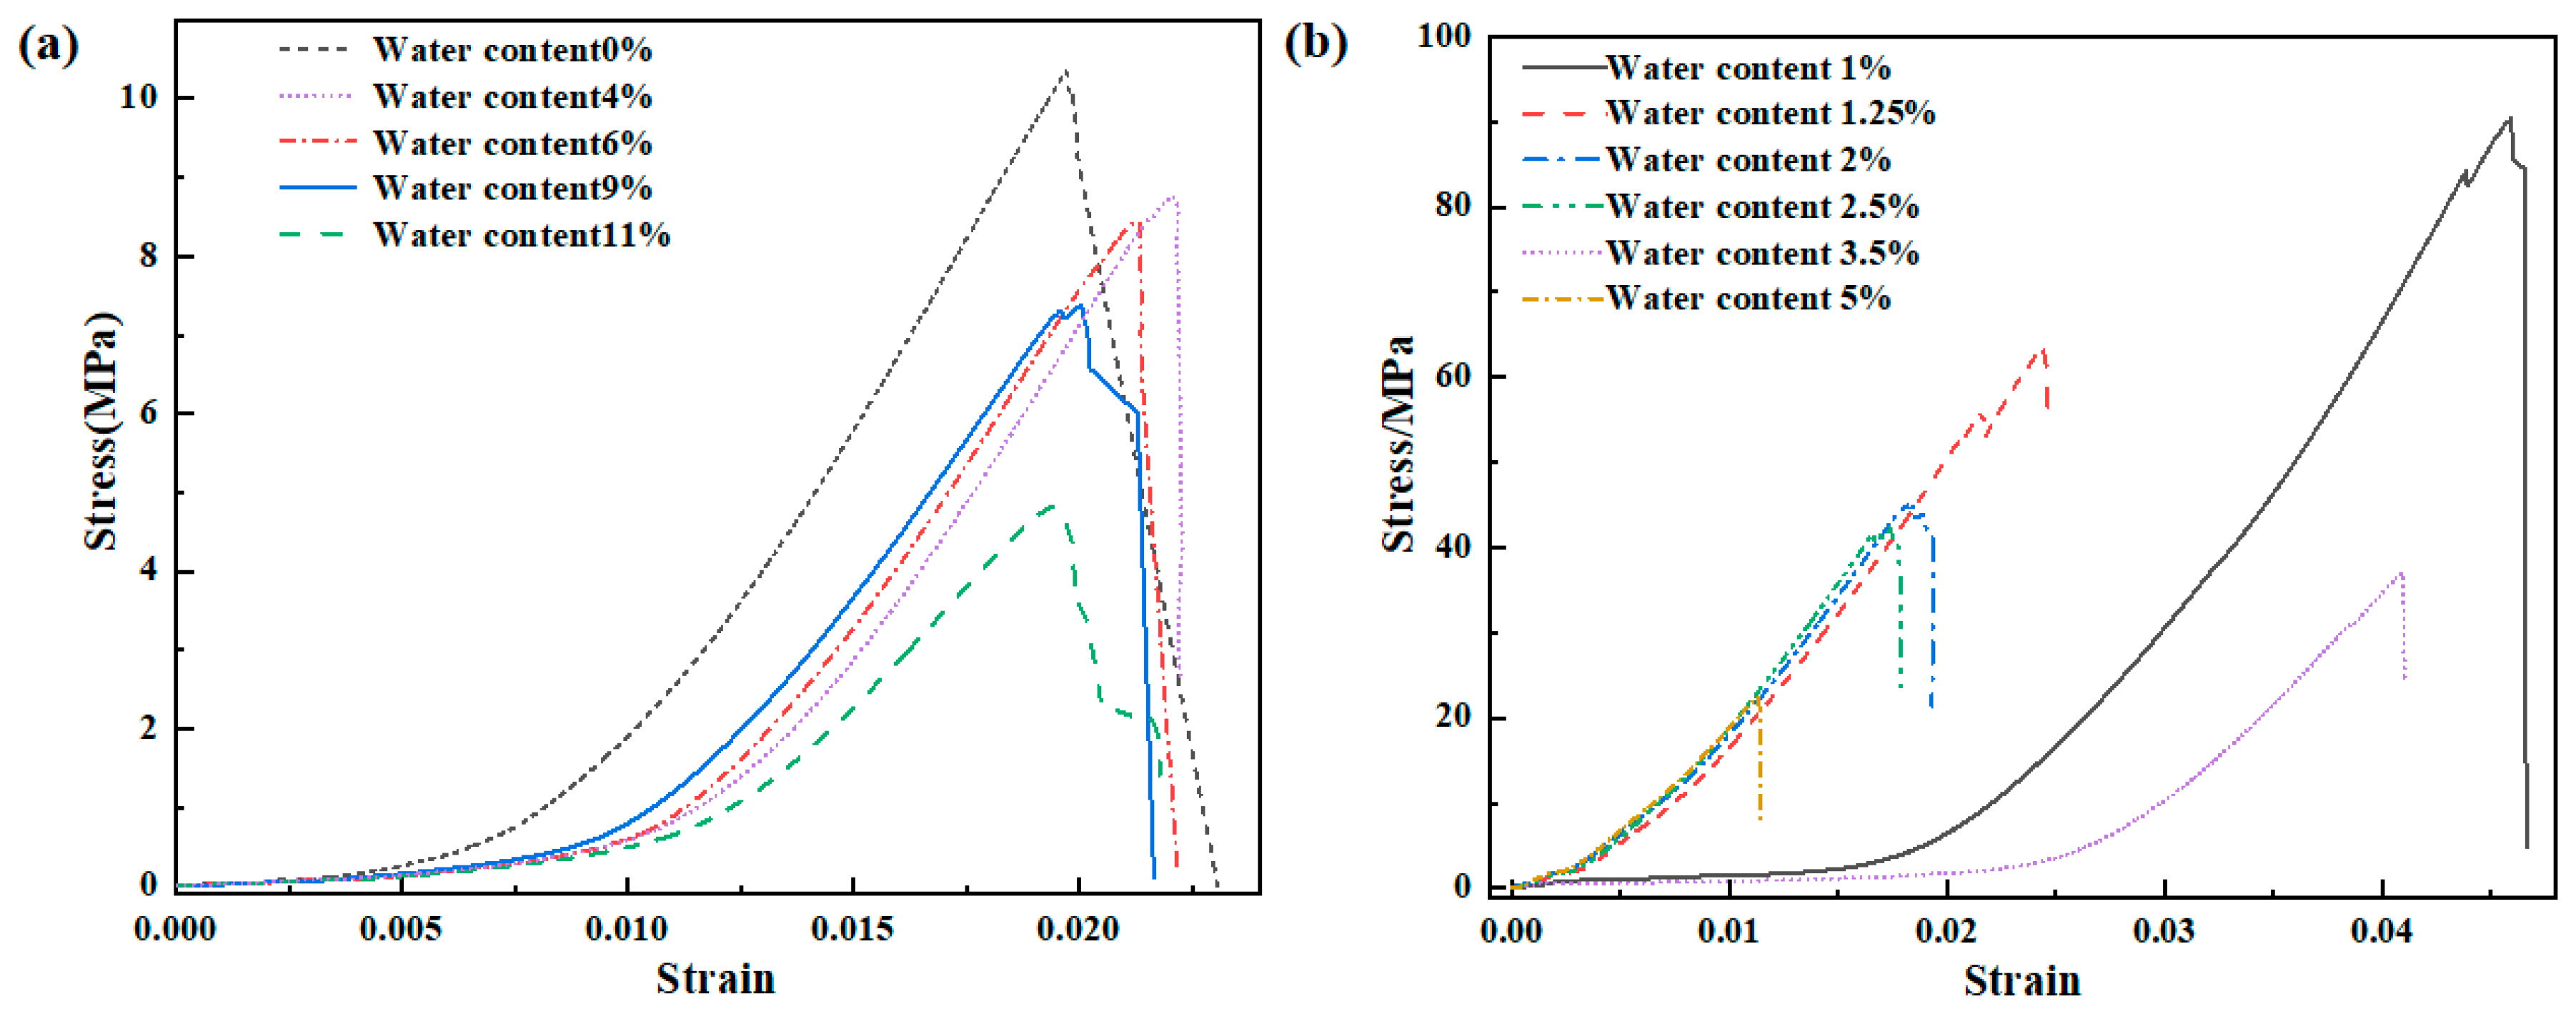
The nondestructive immersion device test reveals that the water content of siltstone and coarse-grained sandstone increases negatively and exponentially with immersion time. In a water-saturated state, the uniaxial compressive strength of siltstone and coarse-grained sandstone is measured at 4.80 MPa and 27.57 MPa, respectively, representing reductions of 54.59% and 67.99% compared to their strengths in a dry state.
(2)
Irregular surfaces and watering significantly affect the stress field of the original rock within the coal seam. The area of maximum principal stress concentration is located beneath the “T”-shaped surface and in the rock layer adjacent to the joint. Maximum shear stress concentrations are found at the outer edges of the “T” intersections and within the “T” channels. Additionally, vertical stress concentration zones are present at higher ground levels and at the bottom of the slope.
(3)
During the process of mining back to the 51,102 working face, stress concentration zones for both the maximum principal stress and vertical stress develop around the working face upon entering the “1” section and its lower part. Following the completion of mining, the area of maximum shear stress concentration is predominantly located around the hollow region and the roadway in the front section. Within the mining range of 10 m to 90 m, the maximum shear stress observed in the roof of the roadway exceeds that in other locations, reaching a peak value of approximately 2.19 MPa.
(4)
Prior to the mining of the face in the “1” section, although the maximum shear stress of the roof exhibited fluctuations, the trend of maximum shear stress at various mining stages remained consistent. Following the mining of the face below the surface of the “1” section, the maximum shear stress of the roof increases rapidly, with the influence range of the overrun extending approximately 24 m. The distribution of maximum shear stress is crucial for the stability of the surrounding rocks in both roadways.
(5)
The challenges associated with supporting soft rock roadways through roof watering under the irregular surface of thin bedrock include roof watering itself, ongoing lithological weakening, and continuous variations in shear stress. By analyzing the principles of high-strength economic support, the company proposed a “four-in-one” surrounding rock control technology, which is based on “controlled hydrophobicity, structural adjustment, district management, and gradient control”. This approach facilitates the establishment of a surrounding rock control scheme focused on district management. In the 51,102 return airway, the maximum displacements recorded for the roof, floor, and both sides of the roadway were 36.2 mm, 37.8 mm, and 68.3 mm, respectively. Consequently, this scheme is deemed effective in controlling harmful deformations of the surrounding rock, demonstrating a clear supporting effect.

Author Contributions

J.W.: formal analysis, methodology; writing—original draft. L.T.: formal analysis. C.L.: conceptualization, writing—review and editing, supervision, funding acquisition, methodology. Q.Q.: visualization. X.Y.: visualization, writing—review and editing. Y.L.: investigation. W.Y.: supervision. All authors have read and agreed to the published version of the manuscript.

Funding

This work was funded by the National Natural Science Foundation of China (No. 52374140), the Graduate Innovation Program of China University of Mining and Technology (No. 2024WLKXJ031), and the Postgraduate Research and Practice Innovation Program of Jiangsu Province (No. KYCX24_2864).

Institutional Review Board Statement

Not applicable.

Informed Consent Statement

Not applicable.

Data Availability Statement

The raw data supporting the conclusions of this article will be made available by the authors on request.

Acknowledgments

Reviewers are thanked for their insightful suggestions and comments, which improved the quality of this manuscript. And thanks to all who contributed to and funded this study.

Conflicts of Interest

Authors Junfeng Wang and Wei Yao were employed by the company Ordos City Jintong Mining Industry Co., Ltd. Author Yitao Liu was employed by the company Uxin Banner Mengda Mining Industry Co., Ltd. The remaining authors declare that the re-search was conducted in the absence of any commercial or financial relationships that could be construed as a potential conflict of interest.

References

  1. Rosenbrand, E.; Kjøller, C.; Riis, J.F.; Kets, F.; Fabricius, I.L. Different effects of temperature and salinity on permeability reduction by fines migration in Berea sandstone. Geothermics 2015, 53, 225–235. [Google Scholar] [CrossRef]
  2. Hawkins, A.B.; Mcconnell, B.J. Sensitivity of sandstone strength and deformability to changes in moisture content. Q. J. Eng. Geol. Hydrogeol. 1992, 25, 115–130. [Google Scholar] [CrossRef]
  3. Chugh, Y.P.; Missavage, R.A. Effects of moisture on strata control in coal mines. Eng. Geol. 1981, 17, 241–255. [Google Scholar] [CrossRef]
  4. Chang, C.; Haimson, B. Effect of fluid pressure on rock compressive failure in a nearly impermeable crystalline rock: Implication on mechanism of borehole breakouts. Eng. Geol. 2007, 89, 230–242. [Google Scholar] [CrossRef]
  5. Yao, Q.; Chen, T.; Ju, M.; Liang, S.; Liu, Y.; Li, X. Effects of water intrusion on mechanical properties of and crack propagation in coal. Rock Mech. Rock Eng. 2016, 49, 4699–4709. [Google Scholar] [CrossRef]
  6. Chen, T.; Yao, Q.; Wei, F.; Chong, Z.-H.; Zhou, J.; Wang, C.-B.; Li, J. Effects of water intrusion and loading rate on mechanical properties of and crack propagation in coal–rock combinations. J. Cent. South Univ. 2017, 24, 423–431. [Google Scholar] [CrossRef]
  7. Chen, Y.; Li, Q.; Pu, H.; Wu, P.; Chen, L.; Qian, D.; Shi, X.; Zhang, K.; Mao, X. Modeling and simulation of deformation mechanism of soft rock roadway considering the mine water. Geofluids 2020, 2020, 8812470. [Google Scholar] [CrossRef]
  8. Zhang, Y.; Zhang, W.; Wang, K.; Xie, K.; Song, K.; Wang, Y. Hydromechanical properties and engineering applications of weakly cemented soft rock in jurassic strata. ACS Omega 2023, 8, 16373–16383. [Google Scholar] [CrossRef]
  9. Zhou, K.; Dou, L.; Song, S.; Ma, X.; Chen, B. Experimental study on the mechanical behavior of coal samples during water saturation. ACS Omega 2021, 6, 33822–33836. [Google Scholar] [CrossRef]
  10. Chen, L.; Wang, D.; Jiang, Y.; Luan, H.; Zhang, G.; Liang, B. Experimental study on mechanical properties and acoustic emission characteristics of dry and water-saturated soft rocks under different dynamic loadings. Sustainability 2023, 15, 13201. [Google Scholar] [CrossRef]
  11. Zhao, J.; Tan, Z.; Wang, X.; Zhou, Z.; Li, G. Engineering characteristics of water-bearing weakly cemented sandstone and dewatering technology in tunnel excavation. Tunn. Undergr. Space Technol. 2022, 121, 104316. [Google Scholar] [CrossRef]
  12. Liu, H.; Liu, C.; Yue, X.; Wang, J. Study on mechanical properties and acoustic emission characteristics of mudstone-clay composites under uniaxial compression. Eng. Geol. 2024, 332, 107478. [Google Scholar] [CrossRef]
  13. Zhao, Q.; Zhang, N.; Peng, R.; Li, G.; Han, C.; Guo, Y. Discrete element simulation of roadway stability in an efflorescent oxidation zone. Adv. Civ. Eng. 2018, 2018, 4183748. [Google Scholar] [CrossRef]
  14. Jia, C.; Li, S.; Fan, C.; Luo, M.; Yang, Z.; Yang, L.; Pu, Z. Instability and failure characteristics of surrounding rock of water drenching roadway in thick coal seam. Front. Earth Sci. 2022, 10, 1013715. [Google Scholar] [CrossRef]
  15. Fan, H.; Niu, X.; Li, S. Failure mechanism and control technology for coal roadway in water-rich area. Sustainability 2022, 15, 410. [Google Scholar] [CrossRef]
  16. Chen, S.; Wu, A.; Wang, Y.; Chen, X.; Yan, R.; Ma, H. Study on repair control technology of soft surrounding rock roadway and its application. Eng. Fail. Anal. 2018, 92, 443–455. [Google Scholar] [CrossRef]
  17. Wu, W.; Wang, T.; Bai, J.; Liu, J.; Wang, X.; Xu, H.; Feng, G. Failure Characteristics and Cooperative Control Strategies for Gob-Side Entry Driving near an Advancing Working Face: A Case Study. Processes 2024, 12, 1398. [Google Scholar] [CrossRef]
  18. Zhu, C.Q.; Wang, L.; Li, S.B. The investigation of strata control for ultrasoft coal seam mining. Geofluids 2022, 2022, 8130555. [Google Scholar] [CrossRef]
  19. Ma, C.; Wang, P.; Jiang, L.; Wang, C. Deformation and control countermeasure of surrounding rocks for water-dripping roadway below a contiguous seam goaf. Processes 2018, 6, 77. [Google Scholar] [CrossRef]
  20. Xue, G.; Gu, C.; Fang, X.; Wei, T. A case study on large deformation failure mechanism and control techniques for soft rock roadways in tectonic stress areas. Sustainability 2019, 11, 3510. [Google Scholar] [CrossRef]
  21. Zhang, W.; Zhao, T.; Zhang, X.T. Stability analysis and deformation control method of swelling soft rock roadway adjacent to chambers. Geomech. Geophys. Geo-Energy Geo-Resour. 2023, 9, 91. [Google Scholar] [CrossRef]
  22. Yu, W.; Li, K.; Liu, Z.; An, B.; Wang, P.; Wu, H. Mechanical characteristics and deformation control of surrounding rock in weakly cemented siltstone. Environ. Earth Sci. 2021, 80, 337. [Google Scholar] [CrossRef]
  23. Lin, H.; Yang, R.; Li, Y.; Fang, S. Deformation mechanism and control technology of coal roadway with thin sand-mudstone interbed roof. Min. Metall. Explor. 2022, 40, 421–433. [Google Scholar] [CrossRef]
  24. Wen, W.; Zhang, S.; Xiao, T.; Hao, Y.; Li, D.; Li, H. Factors that affect the stability of roads around rocks. Geomat. Nat. Hazards Risk 2021, 12, 829–851. [Google Scholar]
  25. Lin, W.; Cheng, J.; Li, D.; Dang, H. Deformation characteristics and control technology of roadway in water-rich soft rock. Geofluids 2022, 2022, 2234334. [Google Scholar] [CrossRef]
  26. Jing, W.; Wang, X.; Hao, P.; Jing, L.; Xue, W. Instability mechanism and key control technology of deep soft rock roadway under long-term water immersion. Adv. Civ. Eng. 2021, 2021, 6670379. [Google Scholar] [CrossRef]
  27. Yang, R.; Li, Y.; Guo, D.; Yao, L.; Yang, T.; Li, T. Failure mechanism and control technology of water-immersed roadway in high-stress and soft rock in a deep mine. Int. J. Min. Sci. Technol. 2017, 27, 245–252. [Google Scholar] [CrossRef]
  28. Zhang, J.; Wang, Y.; Qi, X.; Zhu, T. Research on application of the bolt-truss coupling support technology in roadway with water-rich and soft rock. Front. Earth Sci. 2022, 10, 842672. [Google Scholar] [CrossRef]
  29. Li, Y.; Ma, C.; Zhang, L.; Li, B. Influence research for softening and swelling of weakly cemented soft rock on the stability of surrounding rock in roadway. Geofluids 2022, 2022, 6439277. [Google Scholar] [CrossRef]
  30. Zhang, M.; Chang, C.; Cao, W. A discussion of reinforcement timing optimization for main inclined shaft roadway with water seepage. Geofluids 2020, 2020, 8850911. [Google Scholar] [CrossRef]
  31. Yuan, Z.; Zhao, J.; Li, S.; Jiang, Z.; Huang, F. A unified solution for surrounding rock of roadway considering seepage, dilatancy, strain-softening and intermediate principal stress. Sustainability 2022, 14, 8099. [Google Scholar] [CrossRef]
  32. Wang, S.; Han, L.; Zhang, S.; Wang, H. Structure restrengthening process and mechanical properties of damaged weakly cemented mudstone. Sustainability 2023, 15, 9148. [Google Scholar] [CrossRef]
  33. Lu, H.; Yi, J.; Liu, Q.; Cao, A.; Wei, A.; Zhang, K. A self-dissolved grouting reinforcement method for water-rich soft rock roadway. Bull. Eng. Geol. Environ. 2022, 81, 256. [Google Scholar] [CrossRef]
  34. Cao, J.; Zhang, N.; Pi, L.; An, T.; Li, S.; Chi, E. Stability Analysis of Support Anchor Bolt in the Process of Surrounding Rock Fracture Evolution. Geofluids 2023, 2023, 4805857. [Google Scholar] [CrossRef]
  35. He, Y.; Liu, S.; Zhai, X.; Li, X.; Hou, B.; Wang, B. Experimental investigation of the influence of mine water on mechanical properties of resin grout. Sci. Rep. 2024, 14, 14323. [Google Scholar] [CrossRef]
  36. Commission, I.T. Suggested methods for determining tensile strength of rock materials. Int. J. Rock Mech. Min. Sci. 1978, 15, 99–103. [Google Scholar]
  37. Castro-Filgueira, U.; Alejano, L.R.; Arzúa, J.; Ivars, D.M. Sensitivity analysis of the micro-parameters used in a PFC analysis towards the mechanical properties of rocks. Procedia Eng. 2017, 191, 488–495. [Google Scholar] [CrossRef]
  38. Patil, M.S.; Seo, J.H.; Panchal, S.; Lee, M.-Y. Numerical study on sensitivity analysis of factors influencing liquid cooling with double cold-plate for lithium-ion pouch cell. Int. J. Energy Res. 2020, 45, 2533–2559. [Google Scholar] [CrossRef]
  39. Kang, B.; Jian, L.; Ming, X. Research on disaster mechanism of hydraulic fracturing for hydraulic tunnel. Disaster Adv. 2012, 5, 981–986. [Google Scholar]
  40. Li, W.; Wang, Z.; Qiao, L.; Liu, J.; Yang, J. The effects of hydro-mechanical coupling on hydraulic properties of fractured rock mass in unidirectional and radial flow configurations. Geomech. Geophys. Geo-Energy Geo-Resour. 2021, 7, 87. [Google Scholar] [CrossRef]
  41. Scesi, L.; Gattinoni, P. Water Circulation in Rocks; Springer Science & Business Media: Berlin, Germany, 2009. [Google Scholar]
  42. Wang, Q.; Qiao, L.; Zhou, M.; Zhu, S.; Griffith, S.; Li, L.; Yu, J.Z. Source apportionment of PM2.5 using hourly measurements of elemental tracers and major constituents in an urban environment: Investigation of time-resolution influence. J. Geophys. Res. Atmos. 2018, 123, 5284–5300. [Google Scholar] [CrossRef]
  43. Wang, Z.; Li, W.; Bi, L.; Qiao, L.; Liu, R.; Liu, J. Estimation of the REV size and equivalent permeability coefficient of fractured rock masses with an emphasis on comparing the radial and unidirectional flow configurations. Rock Mech. Rock Eng. 2018, 51, 1457–1471. [Google Scholar] [CrossRef]
  44. He, Q.; Zhu, L.; Li, Y.; Li, D.; Zhang, B. Simulating hydraulic fracture re-orientation in heterogeneous rocks with an improved discrete element method. Rock Mech. Rock Eng. 2021, 54, 2859–2879. [Google Scholar] [CrossRef]
  45. Zhang, K.; Zhang, B.; Liu, J.; Ma, D.; Bai, H. Experiment on seepage property and sand inrush criterion for granular rock mass. Geofluids 2017, 2017, 9352618. [Google Scholar] [CrossRef]
  46. Tai, L.; Li, C.; Yu, X.; Xu, Z.; Sun, L. Unloading Technology and Application Research of Variable Diameter Drilling in Dynamic Pressure Roadway. Appl. Sci. 2024, 14, 6443. [Google Scholar] [CrossRef]
  47. Yang, S.; Chen, M.; Jingl, H.; Chen, K.-F.; Meng, B. A case study on large deformation failure mechanism of deep soft rock roadway in Xin’An coal mine, China. Eng. Geol. 2017, 217, 89–101. [Google Scholar] [CrossRef]
Figure 1. The 51,102 working face underground production geological conditions: (a) coal mine locating, (b) underground layout, (c) columnar diagram of roof layer, (d) roadway support status.
Applsci 14 09428 g001
Figure 2. The surface condition of 51,102 working face: (a) elevation of working face, (b) photo of “T”-shaped surface.
Applsci 14 09428 g002
Figure 3. Flowchart of preparation and testing of water-containing rock samples: (a) Site photo of rock sample coring, (b) Rock sample processing equipment, (c) Drying box, (d) Non-destructive infiltration test, (e) Standard rock sample, (f) Compressive and tensile test equipment, (g) Variable angle shear test equipment, (h) Detailed drawing of rock sample loading.
Applsci 14 09428 g003
Figure 4. Numerical calculation model: (a) the dimensions and parameters, (b) the boundary conditions and constraints.
Applsci 14 09428 g004
Figure 5. The comparison results of numerical simulation and physical experiments: (a) the siltstone, (b) the coarse-grained sandstone.
Applsci 14 09428 g005
Figure 6. Water content change rule with soaking time: (a) siltstone, (b) coarse-grained sandstone (I: rapid growth stage; II: stable growth stage; III: decelerated growth stage; IV: stable stage).
Applsci 14 09428 g006
Figure 7. Uniaxial compressive stress–strain relationship curves of rock samples with different water content: (a) siltstone, (b) coarse-grained sandstone.
Applsci 14 09428 g007
Figure 8. The cloud map of stress distribution at different mining distances of 51,102 working face: (a) 0 m, (b) 10 m, (c) 40 m, (d) 90 m, (e) 140 m, (f) 160 m.
Applsci 14 09428 g008
Figure 9. Stress change curves of 51,102 working faces at different stages of mining: (a) maximum principal stress, (b) maximum shear stress, (c) vertical stress.
Applsci 14 09428 g009
Figure 10. Principle diagram of high-strength economic support for soft rock roadway with roof drenching: Light blue wavy lines and arrows indicate drenching; dark blue lines indicate long anchor cables; purple lines indicate short anchor cables; green lines indicate anchors.
Applsci 14 09428 g010
Figure 11. Drawings of roof slab water discharge drilling arrangement.
Applsci 14 09428 g011
Figure 12. Support scheme of 51,102 return airway: (a) section of A and B zone, (b) section of C1 zone, (c) section of C2 zone, (d) vertical view of A and B zone, (e) vertical view of C1 zone, (f) vertical view of C2 zone.
Applsci 14 09428 g012
Figure 13. The drilling observation in the 51,102 return airway roof: (a) location of the measuring station, (b) YTJ20 mining electronic drilling observation device.
Applsci 14 09428 g013
Figure 14. The 51,102 return airway surface displacement curve: (a) roof and floor displacement, (b) two gangs displacement.
Applsci 14 09428 g014
Figure 15. The support site drawing of the 51,102 return airway: (a) support picture of 51,102 return airway, (b) detail of roof support.
Applsci 14 09428 g015
Table 1. Coal rock’s physical and mechanical parameters.
LithologyThickness (m)Density
(kg/m3)
Bulk
Modulus
(GPA)
Shear
Modulus
(GPa)
Tensile Strength
(MPa)
Cohesion
(MPa)
Friction Angle
(°)
Loess2413402.11.31.92.120
Medium-grained sandstone1823103.64.82.11.634
Mudstone422003.031.562.83.633
Siltstone426504.53.71.02.327
Sandy mudstone122353.241.652.65.935
Siltstone326504.53.71.02.327
Sandy mudstone322353.241.652.65.935
Sandstone226504.53.71.02.327
5-1 Upper coal114001.190.382.21.828
Sandy mudstone122353.241.652.65.935
Coarse-grained sandstone523103.64.82.91.634
Siltstone626504.53.71.02.327
5-1 Coal214001.190.382.21.828
Sandy mudstone422353.241.652.65.935
Siltstone226504.53.71.02.327
Sandy mudstone222353.241.652.65.935
Table 2. Summary of physical and mechanical parameters of siltstone.
Water Content (%)Split Tensile TestUniaxial Compression TestShear Test
Tensile Strength (MPa)Compressive Strength (MPa)Elasticity Modulus (GPa)Poisson’s RatioShear
Modulus (GPa)
Cohesion
(MPa)
The Angle of Internal Friction (°)
01.4510.570.450.240.183.2736
41.029.480.410.230.172.6231
60.798.560.350.210.162.4127
90.677.400.340.180.151.4125
11 (saturated)0.434.800.260.170.110.3618
Table 3. Summary of physicomechanical parameters of coarse-grained sandstone.
Water Content (%)Split Tensile TestUniaxial Compression Test
Tensile Strength
(MPa)
Uniaxial Compressive Strength (MPa)Elasticity Modulus
(GPa)
Poisson’s RatioShear
Modulus (GPa)
04.1886.120.910.250.37
1.253.8162.260.730.240.29
2.53.1255.130.590.240.24
3.52.6132.060.540.230.22
5 (saturated)2.1427.570.470.230.19
Table 4. Statistics of the maximum value of surface displacement at each station.
NumberDisplacement/mm
RoofFloorRoof and FloorLeft SideRight SideTwo Roadway Sides
I36.225.661.933.834.468.3
II19.537.857.337.230.667.9
III23.226.649.827.625.453.1
Disclaimer/Publisher’s Note: The statements, opinions and data contained in all publications are solely those of the individual author(s) and contributor(s) and not of MDPI and/or the editor(s). MDPI and/or the editor(s) disclaim responsibility for any injury to people or property resulting from any ideas, methods, instructions or products referred to in the content.

