Is the Endurance Standardized ACWRHMLD or the Underlying Acute and Chronic Components Related to Injuries?

 , ,
, ,  and
and 
Abstract
Featured Application
Abstract
1. Introduction
2. Materials and Methods
2.1. Subjects
2.2. Injury Occurrence
- Overloading of the tendon insertion (atraumatic, chronic),
- Overloading of the back (vertebral stress reaction; atraumatic, chronic),
- Muscle fiber tear of the quadriceps (traumatic),
- Neurogenic hypertension hamstrings (atraumatic, chronic),
- Muscle fiber tear of the thigh (traumatic),
- Hypertonus hip flexors/adductors (atraumatic, chronic),
- Muscle fiber tear of the hamstrings (traumatic),
- Muscle fiber tear of the hamstrings (traumatic),
- Low back pain (atraumatic, chronic),
- Myofascial strain of the quadriceps (traumatic),
- Adductor myofascial strain (traumatic).
2.3. Experimental Design and Injury Documentation
| Inclusion criteria | Exclusion criteria |
|
|
2.4. Measurement Systems
2.4.1. Bioelectrical Impedance Analysis (BIA)
2.4.2. Endurance Performance Diagnostics
2.4.3. Tracking
2.5. Statistics
3. Results
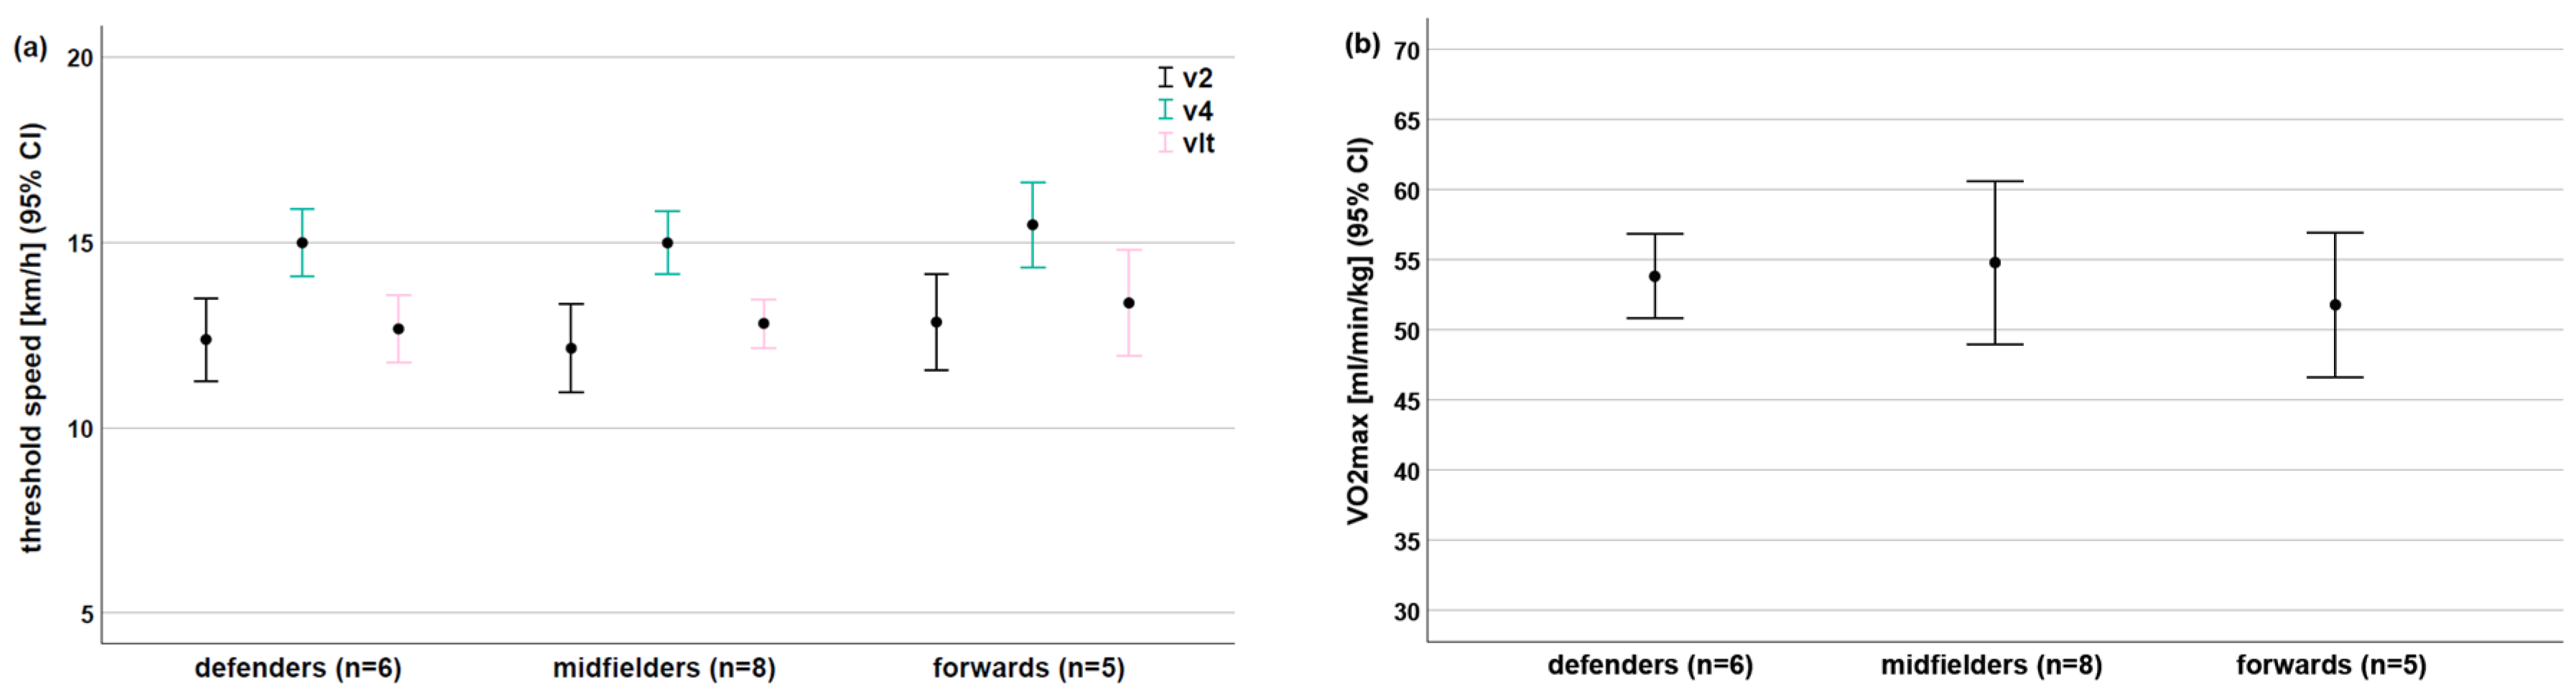
3.1. Endurance Performance (EP)
3.2. Load Related to Selected Endurance Parameters
4. Discussion
5. Limitations
6. Conclusions
- Do not use the sRPE as a subjective indicator of internal load. A more sufficient option is the HMLD as an objective indicator of internal load!
- It is extremely necessary to standardize the ACWR using the aerobic capacity. The isolated use of load parameters is insufficient.
- Based on these results, we recommend the vLT as a sufficient indicator for the aerobic capacity.
- The chronic component (CW) of the ACWR, especially in the last week before the injury, is more appropriate than the ACWR or the acute component (AW) of the ACWR.
- From a practical point of view, weekly analyses of the training load seem to be more appropriate than the usual 4-week period.
Author Contributions
Funding
Institutional Review Board Statement
Informed Consent Statement
Data Availability Statement
Acknowledgments
Conflicts of Interest
References
- Foster, C. Monitoring training in athletes with reference to overtraining syndrome. Med. Sci. Sports Exerc. 1998, 30, 1164–1168. [Google Scholar] [CrossRef] [PubMed]
- Hulin, B.T.; Gabbett, T.J.; Caputi, P.; Lawson, D.W.; Sampson, J.A. Low chronic workload and the acute: Chronic workload ratio are more predictive of injury than between-match recovery time: A two-season prospective cohort study in elite rugby league players. Br. J. Sports Med. 2016, 50, 1008–1012. [Google Scholar] [CrossRef] [PubMed]
- Gabbett, T.J. The training-injury prevention paradox: Should athletes be training smarter and harder? Br. J. Sports Med. 2016, 50, 273–280. [Google Scholar] [CrossRef] [PubMed]
- Impellizzeri, F.M.; McCall, A.; Ward, P.; Bornn, L.; Coutts, A.J. Training Load and Its Role in Injury Prevention, Part 2: Conceptual and Methodologic Pitfalls. J. Athl. Train. 2020, 55, 893–901. [Google Scholar] [CrossRef]
- Impellizzeri, F.M.; Menaspà, P.; Coutts, A.J.; Kalkhoven, J.; Menaspà, M.J. Training Load and Its Role in Injury Prevention, Part I: Back to the Future. J. Athl. Train. 2020, 55, 885–892. [Google Scholar] [CrossRef]
- Staunton, C.A.; Abt, G.; Weaving, D.; Wundersitz, D.W.T. Misuse of the term ‘load’ in sport and exercise science. J. Sci. Med. Sport 2022, 25, 439–444. [Google Scholar] [CrossRef]
- Gabbett, T.J.; Domrow, N. Relationships between training load, injury, and fitness in sub-elite collision sport athletes. J. Sports Sci. 2007, 25, 1507–1519. [Google Scholar] [CrossRef]
- Gabbett, T.J.; Ullah, S. Relationship between running loads and soft-tissue injury in elite team sport athletes. J. Strength Cond. Res. 2012, 26, 953–960. [Google Scholar] [CrossRef]
- Bowen, L.; Gross, A.S.; Gimpel, M.; Bruce-Low, S.; Li, F.X. Spikes in acute:chronic workload ratio (ACWR) associated with a 5-7 times greater injury rate in English Premier League football players: A comprehensive 3-year study. Br. J. Sports Med. 2020, 54, 731–738. [Google Scholar] [CrossRef]
- Gabbett, T.J. Debunking the myths about training load, injury and performance: Empirical evidence, hot topics and recommendations for practitioners. Br. J. Sports Med. 2020, 54, 58–66. [Google Scholar] [CrossRef]
- Andrade, R.; Wik, E.H.; Rebelo-Marques, A.; Blanch, P.; Whiteley, R.; Espregueira-Mendes, J.; Gabbett, T.J. Is the acute: Chronic workload ratio (ACWR) associated with risk of time-loss injury in professional team sports? A systematic review of methodology, variables and injury risk in practical situations. Sports Med. 2020, 50, 1613–1635. [Google Scholar] [CrossRef] [PubMed]
- Osgnach, C.; Poser, S.; Bernardini, R.; Rinaldo, R.; di Prampero, P.E. Energy cost and metabolic power in elite soccer: A new match analysis approach. Med. Sci. Sports Exerc. 2010, 42, 170–178. [Google Scholar] [CrossRef] [PubMed]
- Clemente, F.M.; Silva, R.; Chen, Y.S.; Aquino, R.; Moreira Praca, G.; Castellano, J.; Nobari, H.; Mendes, B.; Rosemann, T.; Knechtle, B. Accelerometry-workload indices concerning different levels of participation during congested fixture periods in professional soccer: A pilot study conducted over a full season. Int. J. Environ. Res. Public Health 2021, 18, 1137. [Google Scholar] [CrossRef] [PubMed]
- Guitart, M.; Casals, M.; Casamichana, D.; Cortes, J.; Valle, F.X.; Mc Call, A.; Cos, F.; Rodas, G. Use of GPS to measure external load and estimate the incidence of muscle injuries in men’s football: A novel descriptive study. PLoS ONE 2022, 17, e0263494. [Google Scholar] [CrossRef]
- Buchheit, M.; Simpson, B.M. Player-tracking technology: Half-full or half-empty glass? Int. J. Sports Physiol. Perform. 2017, 12, 235–241. [Google Scholar] [CrossRef]
- Malone, S.; Owen, A.; Mendes, B.; Hughes, B.; Collins, K.; Gabbett, T.J. High-speed running and sprinting as an injury risk factor in soccer: Can well-developed physical qualities reduce the risk? J. Sci. Med. Sport 2018, 21, 257–262. [Google Scholar] [CrossRef]
- Millum, J.; Wendler, D.; Emanuel, E.J. The 50th anniversary of the Declaration of Helsinki: Progress but many remaining challenges. JAMA 2013, 310, 2143–2144. [Google Scholar] [CrossRef]
- Harriss, D.J.; Macsween, A.; Atkinson, G. Standards for ethics in sport and exercise science research: 2018 update. Int. J. Sports Med. 2017, 38, 1126–1131. [Google Scholar] [CrossRef]
- Krosshaug, T.; Andersen, T.E.; Olsen, O.E.; Myklebust, G.; Bahr, R. Research approaches to describe the mechanisms of injuries in sport: Limitations and possibilities. Br. J. Sports Med. 2005, 39, 330–339. [Google Scholar] [CrossRef]
- Marshall, S.W. Recommendations for defining and classifying anterior cruciate ligament injuries in epidemiologic studies. J. Athl. Train. 2010, 45, 516–518. [Google Scholar] [CrossRef]
- Waldén, M.; Krosshaug, T.; Bjørneboe, J.; Andersen, T.E.; Faul, O.; Hägglund, M. Three distinct mechanisms predominate in non-contact anterior cruciate ligament injuries in male professional football players: A systematic video analysis of 39 cases. Br. J. Sports Med. 2015, 49, 1452–1460. [Google Scholar] [CrossRef] [PubMed]
- Fuller, C.W.; Ekstrand, J.; Junge, A.; Andersen, T.E.; Bahr, R.; Dvorak, J.; Hägglund, M.; McCrory, P.; Meeuwisse, W.H. Consensus statement on injury definitions and data collection procedures in studies of football (soccer) injuries. Br. J. Sports Med. 2006, 40, 193–201. [Google Scholar] [CrossRef] [PubMed]
- Moon, J.R. Body composition in athletes and sports nutrition: An examination of the bioimpedance analysis technique. Eur. J. Clin. Nutr. 2013, 67 (Suppl. S1), 54–59. [Google Scholar] [CrossRef] [PubMed]
- Thoden, J.S.; Wilson, B.A.; MacDougall, J.D. Testing aerobic power. In Physiological Testing of the Elite Athlete; MacDougall, J.D., Wenger, H.A., Green, H.J., Eds.; Human Kinetics: Champaign, IL, USA, 1991; pp. 107–173. [Google Scholar]
- Stöggl, T.L.; Blumkaitis, J.C.; Strepp, T.; Sareban, M.; Simon, P.; Neuberger, E.W.I.; Finkenzeller, T.; Nunes, N.; Aglas, L.; Haller, N. The Salzburg 10/7 HIIT shock cycle study: The effects of a 7-day high-intensity interval training shock microcycle with or without additional low-intensity training on endurance performance, well-being, stress and recovery in endurance trained athletes—Study protocol of a randomized controlled trial. BMC Sports Sci. Med. Rehabil. 2022, 14, 84. [Google Scholar] [CrossRef]
- Gabbett, T.J.; Hulin, B.; Blanch, P.; Chapman, P.; Bailey, D. To couple or not to couple? For acute: Chronic workload ratios and injury risk, Does it really matter? Int. J. Sports Med. 2019, 40, 597–600. [Google Scholar] [CrossRef]
- Nobari, H.; Mainer-Pardos, E.; Zamorano, A.D.; Bowman, T.G.; Clemente, F.M.; Perez-Gomez, J. Sprint variables are associated with the odds ratios of non-contact injuries in professional soccer players. Int. J. Environ. Res. Public Health 2021, 18, 10417. [Google Scholar] [CrossRef]
- Nathan, A.L.; Simpkin, A.J.; Moseley, S.; Turner, G.; Homer, M.; Redgrave, A.; Pedlar, C.R.; Burden, R. Increased oxidative stress in injured and III elite international olympic rowers. Int. J. Sports Physiol. Perform. 2020, 15, 625–631. [Google Scholar] [CrossRef]
- Helgerud, J.; Rodas, G.; Kemi, O.J.; Hoff, J. Strength and endurance in elite football players. Int. J. Sports Med. 2011, 32, 677–682. [Google Scholar] [CrossRef]
- Tonnessen, E.; Hem, E.; Leirstein, S.; Haugen, T.; Seiler, S. Maximal aerobic power characteristics of male professional soccer players, 1989–2012. Int. J. Sports Physiol. Perform. 2013, 8, 323–329. [Google Scholar] [CrossRef]
- Vasileios, A.; Athanasios, S.; Antonios, S.; Nikos, G.; Giorgos, P. The increase of VO2max variation and the specific biochemical parameters in soccer players after a pre-season training program. J. Phys. Educ. Sport. 2018, 18, 686–694. [Google Scholar] [CrossRef]
- Altmann, S.; Kuberczyk, M.; Ringhof, S.; Neumann, R.; Woll, A. Relationships between performance test and match-related physical performance parameters—A study in professional soccer players across three seasons. Ger. J. Exerc. Sport Res. 2018, 48, 218–227. [Google Scholar] [CrossRef]
- Schwesig, R.; Schulze, S.; Reinhardt, L.; Laudner, K.G.; Delank, K.S.; Hermassi, S. Differences in player position running velocity at lactate thresholds among male professional german soccer players. Front. Physiol. 2019, 10, 886. [Google Scholar] [CrossRef] [PubMed]
- Reinhardt, L.; Schulze, S.; Schwesig, R.; Kurz, E. Physical match performance in sub-elite soccer players—Introduction of a new index. Int. J. Sports Med. 2020, 41, 858–866. [Google Scholar] [CrossRef] [PubMed]
- Garcia-Calvo, T.; Ponce-Bordon, J.C.; Pons, E.; Lopez Del Campo, R.; Resta, R.; Raya-Gonzalez, J. High metabolic load distance in professional soccer according to competitive level and playing positions. PeerJ 2022, 10, e13318. [Google Scholar] [CrossRef] [PubMed]
- Ciolac, E.; Mantuani, S.; Neiva, C.; Veradi, C.; Pêssoa-Filho, D.; Pimenta, L. Rating of perceived exertion as a tool for prescribing and self regulating interval training: A pilot study. Biol. Sport 2015, 32, 103–138. [Google Scholar] [CrossRef]
- Haddad, M.; Stylianides, G.; Djaoui, L.; Dellal, A.; Chamari, K. Session-RPE Method for Training Load Monitoring: Validity, Ecological Usefulness, and Influencing Factors. Front. Neurosci. 2017, 11, 612. [Google Scholar] [CrossRef]
- Tibana, R.A.; de Sousa, N.M.F.; Cunha, G.V.; Prestes, J.; Fett, C.; Gabbett, T.J.; Voltarelli, F.A. Validity of Session Rating Perceived Exertion Method for Quantifying Internal Training Load during High-Intensity Functional Training. Sports 2018, 6, 68. [Google Scholar] [CrossRef]
- Mann, R.H.; Williams, C.A.; Clift, B.C.; Barker, A.R. The Validation of Session Rating of Perceived Exertion for Quantifying Internal Training Load in Adolescent Distance Runners. Int. J. Sports Physiol. Perform. 2019, 14, 354–359. [Google Scholar] [CrossRef]
- Inoue, A.; Dos Santos Bunn, P.; do Carmo, E.C.; Lattari, E.; da Silva, E.B. Internal Training Load Perceived by Athletes and Planned by Coaches: A Systematic Review and Meta-Analysis. Sports Med. Open. 2022, 8, 35. [Google Scholar] [CrossRef]

| Playing Positions | Total (n = 23) | ||||
|---|---|---|---|---|---|
| GK (n = 3) | DF (n = 7) | MF (n = 8) | FW (n = 5) | ||
| Age [years] | 28.7 ± 6.1 | 23.7 ± 2.8 | 24.3 ± 3.0 | 23.4 ± 1.9 | 24.5 ± 3.5 |
| Height [m] | 1.93 ± 0.03 | 1.86 ± 0.07 | 1.79 ± 0.03 | 1.83 ± 0.10 | 1.84 ± 0.08 |
| Mass [kg] | 89.1 ± 11.1 | 86.4 ± 7.6 | 74.9 ± 6.1 | 80.1 ± 10.1 | 81.4 ± 9.4 |
| BMI [kg/m2] | 23.9 ± 2.4 | 25.0 ± 0.7 | 23.4 ± 1.5 | 23.9 ± 1.2 | 24.1 ± 1.5 |
| Body fat [%] | 12.2 ± 1.5 | 11.5 ± 3.1 | 12.0 ± 2.6 | 9.3 ± 1.8 | 11.3 ± 2.6 |
| Playing Positions | Total (n = 18) | |||
|---|---|---|---|---|
| DF (n = 7) | MF (n = 6) | FW (n = 5) | ||
| Total HMLD per load day [m] | 639 ± 84 (494–771) | 681 ± 147 (474–867) | 683 ± 77 (595–777) | 667 ± 109 (121–846) |
| Total HMLD [m/min] | 11.8 ± 1.2 (9.6–13.1) | 13.0 ± 2.1 (9.9–15.9) | 13.4 ± 1.0 (12.4–15.0) | 11.3 ± 3.9 (1.7–15.9) |
| Match HMLD [m] | 1.383 ± 253 (1.015–1.794) | 1.561 ± 303 (1.032–1.861) | 1.245 ± 335 (876–1.682) | 1.404 ± 304 (876–1.861) |
| Match HMLD [m/min] | 19.5 ± 1.9 (17.5–22.4) | 23.1 ± 3.2 (19.7–28.4) | 25.5 ± 1.8 (23.7–28.0) | 22.3 ± 3.4 (17.5–28.4) |
| Injuries [n]/Injured players [n] | 7/5 | 6/3 | 5/3 | 18/11 |
| Injury days | 36 ± 19 (10–62) | 66 ± 25 (46–94) | 32 ± 12 (19–43) | 43 ± 23 (10–94) |
| Load days | 164 ± 8 (152–176) | 152 ± 31 (77–174) | 165 ± 4 (160–170) | 160 ± 21 (77–176) |
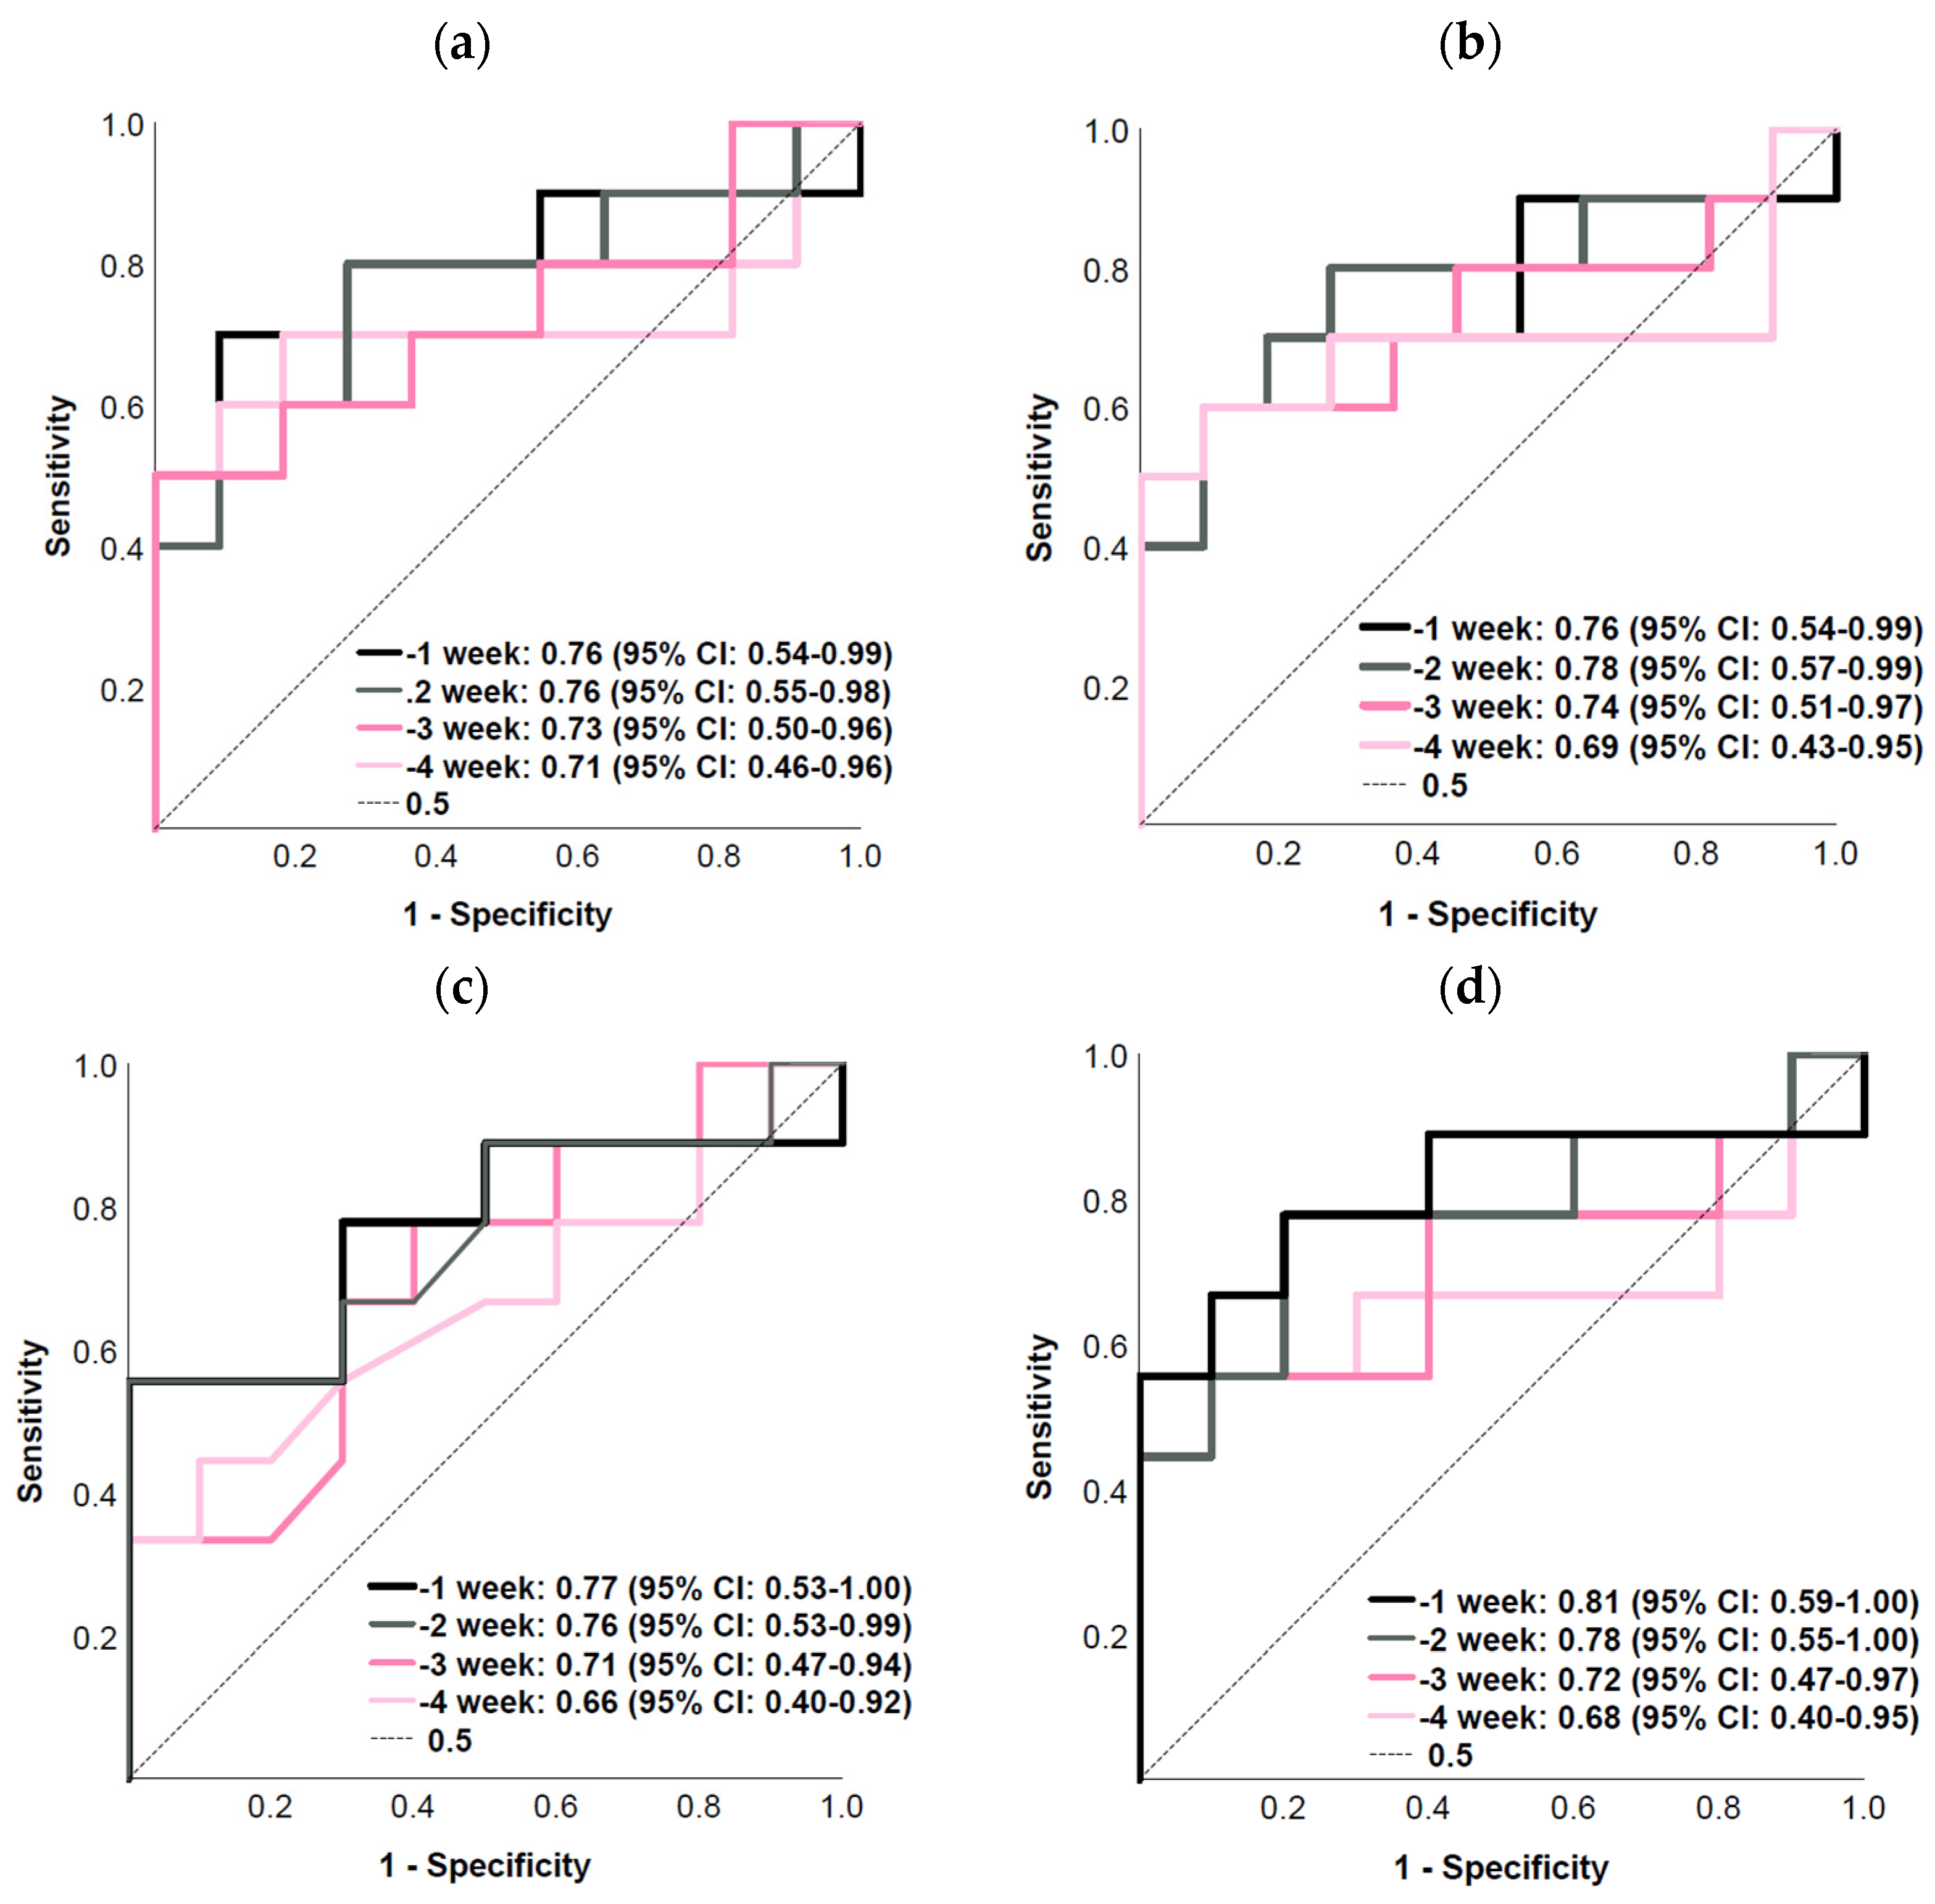
| Week before Injury | ||||||||||||||||
|---|---|---|---|---|---|---|---|---|---|---|---|---|---|---|---|---|
| 1 | 2 | 3 | 4 | |||||||||||||
| AUC | p | Cut-Off | Sens/ Spec | AUC | p | Cut-Off | Sens/ Spec | AUC | p | Cut-off | Sens/ Spec | AUC | p | Cut-Off | Sens/ Spec | |
| chronic | ||||||||||||||||
| v2 | 0.76 | 0.041 | 42.8 | 70/91 | 0.76 | 0.041 | 40.0 | 80/73 | 0.73 | 0.078 | 37.6 | 70/64 | 0.71 | 0.105 | 40.4 | 70/82 |
| v4 | 0.76 | 0.041 | 34.5 | 70/82 | 0.78 | 0.029 | 31.8 | 80/73 | 0.74 | 0.067 | 30.7 | 70/64 | 0.69 | 0.139 | 33.3 | 70/73 |
| VO2max | 0.77 | 0.050 | 9.70 | 78/70 | 0.76 | 0.055 | 9.4 | 67/70 | 0.71 | 0.131 | 8.5 | 78/60 | 0.66 | 0.236 | 8.5 | 67/50 |
| vLT | 0.81 | 0.022 | 40.7 | 78/80 | 0.78 | 0.041 | 38.6 | 78/80 | 0.72 | 0.102 | 34.9 | 78/60 | 0.68 | 0.191 | 38.3 | 67/70 |
| acute | ||||||||||||||||
| v2 | 0.56 | 0.673 | 47.4 | 40/73 | 0.54 | 0.778 | 49.1 | 50/82 | 0.73 | 0.078 | 28.8 | 90/64 | 0.73 | 0.078 | 43.6 | 60/91 |
| v4 | 0.57 | 0.573 | 33.7 | 60/54 | 0.53 | 0.833 | 33.7 | 50/54 | 0.73 | 0.078 | 23.5 | 90/64 | 0.76 | 0.049 | 36.1 | 60/91 |
| VO2max | 0.63 | 0.348 | 10.0 | 67/70 | 0.58 | 0.540 | 9.80 | 67/70 | 0.70 | 0.142 | 6.50 | 89/60 | 0.73 | 0.86 | 10.2 | 67/90 |
| vLT | 0.62 | 0.369 | 42.2 | 56/70 | 0.58 | 0.568 | 44.3 | 56/70 | 0.70 | 0.142 | 27.6 | 90/60 | 0.78 | 0.041 | 42.5 | 67/90 |
| ACWR | ||||||||||||||||
| v2 | 0.71 | 0.105 | 0.9 | 80/64 | 0.71 | 0.105 | 0.9 | 80/64 | 0.71 | 0.105 | 0.9 | 80/64 | 0.71 | 0.105 | 0.9 | 80/64 |
| v4 | 0.46 | 0.751 | 0.08 | 50/64 | 0.38 | 0.360 | 0.07 | 50/45 | 0.71 | 0.113 | 0.06 | 70/73 | 0.73 | 0.078 | 0.07 | 80/64 |
| VO2max | 0.48 | 0.903 | 0.02 | 56/40 | 0.41 | 0.488 | 0.02 | 67/30 | 0.71 | 0.131 | 0.02 | 78/60 | 0.68 | 0.178 | 0.02 | 67/60 |
| vLT | 0.49 | 0.967 | 0.09 | 56/70 | 0.39 | 0.438 | 0.08 | 56/40 | 0.76 | 0.060 | 0.07 | 78/80 | 0.67 | 0.206 | 0.08 | 67/60 |
Disclaimer/Publisher’s Note: The statements, opinions and data contained in all publications are solely those of the individual author(s) and contributor(s) and not of MDPI and/or the editor(s). MDPI and/or the editor(s) disclaim responsibility for any injury to people or property resulting from any ideas, methods, instructions or products referred to in the content. |
© 2024 by the authors. Licensee MDPI, Basel, Switzerland. This article is an open access article distributed under the terms and conditions of the Creative Commons Attribution (CC BY) license (https://creativecommons.org/licenses/by/4.0/).
Share and Cite
Marshall, R.P.; Schulze, S.; Droste, J.-N.; Riepenhof, H.; Delank, K.-S.; Kurz, E.; Schwesig, R. Is the Endurance Standardized ACWRHMLD or the Underlying Acute and Chronic Components Related to Injuries? Appl. Sci. 2024, 14, 9427. https://doi.org/10.3390/app14209427
Marshall RP, Schulze S, Droste J-N, Riepenhof H, Delank K-S, Kurz E, Schwesig R. Is the Endurance Standardized ACWRHMLD or the Underlying Acute and Chronic Components Related to Injuries? Applied Sciences. 2024; 14(20):9427. https://doi.org/10.3390/app14209427
Chicago/Turabian StyleMarshall, Robert Percy, Stephan Schulze, Jan-Niklas Droste, Helge Riepenhof, Karl-Stefan Delank, Eduard Kurz, and René Schwesig. 2024. "Is the Endurance Standardized ACWRHMLD or the Underlying Acute and Chronic Components Related to Injuries?" Applied Sciences 14, no. 20: 9427. https://doi.org/10.3390/app14209427
APA StyleMarshall, R. P., Schulze, S., Droste, J.-N., Riepenhof, H., Delank, K.-S., Kurz, E., & Schwesig, R. (2024). Is the Endurance Standardized ACWRHMLD or the Underlying Acute and Chronic Components Related to Injuries? Applied Sciences, 14(20), 9427. https://doi.org/10.3390/app14209427