Article

Weighted Matrix Factorization Recommendation Model Incorporating Social Trust

School of Computer Science and Engineering, Changchun University of Technology, Changchun 130012, China
*
Author to whom correspondence should be addressed.
Appl. Sci. 2024, 14(2), 879; https://doi.org/10.3390/app14020879
Submission received: 10 December 2023 / Revised: 10 January 2024 / Accepted: 18 January 2024 / Published: 19 January 2024
(This article belongs to the Section Computing and Artificial Intelligence)

Abstract

:
Utilizing user social networks can unearth more effective information to improve the performance of traditional recommendation models. However, existing models often solely utilize trust relationships and information, lacking efficient models that integrate with user historical ratings, as well as methods for accurately adjusting weights and filtering interfering data. This leads to the models’ inability to efficiently use social networks to enhance recommendation accuracy. Therefore, this paper proposes a novel trust-based weighted matrix factorization recommendation model, Trust-WMF. Initially, the model preliminarily calculates users’ predicted ratings for items using trust relationships in the social network and user similarity relations in user historical ratings, simultaneously dynamically integrating these two parts of predicted ratings using adaptive weights. Subsequently, the ratings are incorporated into an improved weighted matrix factorization model, allowing them to have different weights in training compared to user historical ratings. This enriches matrix information and reduces the impact of noise data, thus forming an efficient, unified, and trustworthy recommendation model. Finally, the model was compared and validated on the Epinions and Ciao datasets, with results confirming its efficiency.

1. Introduction

With the development of the Internet, information in the network has grown explosively, and the problem users face has shifted from a shortage of information in the past to how to efficiently filter and obtain valuable information in the current environment of information overload. To address this, recommendation systems [1] have emerged.
Traditional recommendation models include content-based recommendation models [2], collaborative filtering recommendation models (user-based [3] and item-based collaborative filtering [4]), and matrix factorization-based recommendation models [5]. The core idea of content-based recommendation models is to use the content attributes of items to recommend items similar to the user’s historical preferences. For example, if a user has liked many science fiction movies in the past, a content-based recommendation model might recommend more science fiction movies to that user. In content-based recommendation models, item features are typically constructed, and then the user’s preference model is learned based on past user behaviors like ratings or purchases. The recommendations are made according to this model.
Collaborative filtering models primarily recommend based on the similarity between users or items. There are two main types: user-based collaborative filtering and item-based collaborative filtering. In user-based collaborative filtering, the model finds other users with similar preferences to the target user by calculating the similarity between users. The model predicts the target user’s ratings for unrated items based on these users’ rating data and makes recommendations accordingly. The rating prediction is usually achieved by a weighted average of these similar users’ ratings, where the weights are the similarities between users. Compared to the user-based approach, item-based collaborative filtering focuses on the similarity between items. The model calculates the similarity between various items based on the ratings given by users to these items. If a group of users gives similar ratings to two different items, those items are considered similar. When a user rates an item highly, the model recommends other similar items based on the assumption that the user may have similar preferences for similar items. Both user-based and item-based collaborative filtering face the cold start problem [6]. When new users join the model, it is hard to find other users similar to them due to the lack of their historical ratings, making it difficult to provide effective recommendations; new items cannot be accurately compared and matched with existing items by the model until they receive enough user ratings; hence, they are hard to be recommended to users.
The core idea of recommendation models based on matrix factorization is to decompose a large user-item rating matrix into two smaller matrices to reveal the latent relationships between users and items. The model decomposes the user-item rating matrix into a user feature matrix and an item feature matrix, where the rows and columns of each matrix represent the latent features of users and items, respectively. These features, trained through algorithms, reflect the preferences of users and the attributes of items. The key to matrix factorization lies in training the model by minimizing the difference between the user rating matrix and the product of the decomposed user feature matrix and item feature matrix. Once these latent features are obtained, they can be used to predict the likely ratings of a user for unrated items through their interactions, thereby generating personalized recommendations. This method is suitable for processing large-scale datasets and can alleviate the cold start problem to some extent, but it still faces the issue of limited recommendation performance due to missing data in the user-item rating matrix.
With the rapid development of social networks, social recommendation has become an important research direction [7]. People’s choices and preferences are often influenced by other users in their social networks. For instance, when a user notices that a friend is particularly fond of a certain product, they often develop an interest in it too. By studying the social networks between users, such as friendships and trust, and combining these with traditional recommendation models, the accuracy and diversity of recommendations can be enhanced. This approach also helps alleviate issues, like data sparsity and cold starts, for new users.
Currently, researchers have proposed several recommendation methods that integrate social networks. The core of these methods is to utilize the user relationships within social networks to enhance the performance of recommendation models. Some models also combine matrix factorization [8,9], deep learning [10], and other elements to further improve the performance of recommendation models. However, most of the existing models mainly focus on how to enrich the available data information, such as by integrating social networks and user historical ratings and by deeply mining the explicit or implicit trust relationships among users in social networks. Yet, these models overlook the impact of the varying credibility of the added data information and the amount of noise data carried, which can affect the performance of recommendation models.
To address the aforementioned issues, this paper proposes a novel trust-based weighted matrix factorization recommendation model, Trust-WMF. Initially, it uses social networks and user historical ratings to obtain two sets of predicted ratings. Then, employing an adaptive weight strategy, it dynamically merges the overlapping parts of these two sets of predictions to generate a third set. This approach ensures that a user’s rating of an item is influenced not only by their own preferences but also by trust relationships within the social network. Subsequently, the matrix factorization model is improved to allow different parts of the ratings to have varying weights during training, enriching matrix information and reducing the impact of noise data. Finally, all three sets of predicted ratings are integrated into the improved weighted matrix factorization model to predict ratings for all unrated items.
The main contributions of this paper are as follows:
  • Before calculating the predicted ratings based on user historical ratings, two filtering layers are added to reduce the impact of noise data on the computation results.
  • Nonlinear fusion of similarity and trust relationships: A dynamically changing weight w is set to merge the similarity and trust relationships, where the variation of w is influenced by user historical ratings and the two filtering layers.
  • A new weighted matrix factorization model is proposed: By modifying the loss function of the existing matrix factorization model, this aims to assign different weights to different data during the matrix factorization process.

2. Related Work

The primary purpose of incorporating social networks is to utilize the trust relationships between users to alleviate the problem of data sparsity. In 2008, Ma et al. [11] proposed the SoRec model, which is based on probabilistic matrix factorization. It captures the feature vectors of both users and items by jointly considering the user rating matrix and the social network. In this model, a user’s feature vector is influenced not only by their own ratings but also by those they trust. The experimental results show that this model performs well in prediction accuracy, especially when users have few or no ratings, indicating that integrating users’ social network information into the recommendation model can significantly improve the accuracy of recommendations. Different from the way SoRec constructs social information, Yang et al. [12] proposed the TrustMF model, which starts from the genesis of trust relationships and models both trusting and being trusted behaviors separately. Experimental results demonstrate that considering the impact of user roles (trustor and trustee) in social recommendations effectively improves recommendation performance. Ma et al. [13] believe that a user’s ratings for items are influenced not only by their own preferences but also by those they trust. They proposed the RSTE model based on matrix factorization, which expresses a user’s rating for an item as the linear sum of two parts: the individual’s ratings for the item and the ratings given by those they trust. However, this model only considers the influence of trusted users on user ratings, neglecting their impact on user feature vectors. Jamali et al. [14] argue that users and their trusted users have similar feature vectors, and the similarity between these vectors depends on the user’s degree of trust in their trusted users. They introduced the SocialMF model based on trust propagation, where a user’s feature vector equals the average feature vector of their trusted users. Experiments show that trust propagation can effectively solve the cold start problem and significantly improve recommendation accuracy. Later, Ma et al. [15] introduced SoReg, a model with a similar concept to SocialMF, assuming that a user’s feature vector should be similar to their friends’ feature vectors, but this model uses social information to regularize user feature vectors. Guo et al. [16] believe that not only explicit user ratings and social relationships should be modeled but also users’ implicit behavior data and social relationships. Therefore, they introduced implicit social information into the SVD++ model [17], creating the TrustSVD model. By considering users’ implicit feedback and implicit social information in the model, the representation of a user’s features relies not only on the user feature vector but also on implicit feedback and implicit friend information, making the feature representation more consistent with real-world scenarios. Hwang et al. [18] proposed a new data imputation model that uses social networks to fill in missing parts of the user-item matrix, thereby reducing data sparsity.
In recent years, deep learning methods have gradually been integrated into recommendation models. He et al. [19] proposed a matrix factorization model combined with neural networks, NeuMF, which takes the embeddings of users and items as input. This model processes these inputs through two parallel structures: one part uses Generalized Matrix Factorization (GMF) to learn the linear relationships between users and items and the other part uses a multi-layer perceptron to learn the nonlinear relationships between them. Then, the outputs of these two parts are combined and passed through a neural network layer for final prediction. This approach, combining linear and nonlinear models, can better model the complex interactions between users and items in recommendation systems, thereby improving the accuracy of recommendations. Wu et al. [20] introduced a neural influence diffusion network recommendation model (DiffNet), which models the recursive social diffusion process for each user, capturing the influence diffusion hidden in high-order social networks during the user embedding process. However, this model overlooks the potential collaborative interests of users hidden in the user-item interest network. Subsequently, Wu et al. [21] proposed an improved version of the DiffNet model, DiffNet++, which models both neural influence diffusion and interest diffusion within a unified framework. Wan et al. [22] combined deep learning techniques with social trust relationships to propose the NLRDMF-DMDAECE model. This model uses Linear Representation Deep Matrix Factorization (LRDMF) and Non-Linear Representation Deep Matrix Factorization (NLRDMF) to enhance the initial accuracy of matrix factorization. It also employs a Deep Margin Denoising Autoencoder (Deep-MDAE) to extract latent representations from the trust relationship matrix, approximating the user factor matrix derived from the user-item rating matrix. However, existing graph-based methods fail to consider the biases of users and items. For instance, a low rating from a critical user might not necessarily indicate a negative attitude toward an item, as users tend to give low ratings in common scenarios. To address this issue, Chen et al. [23] proposed the graph-based decentralized collaborative filtering social recommendation model, GDSRec. This model views biases as vectors and integrates them into the process of learning representations for users and items. Statistical bias shifts are captured through decentralized neighborhood aggregation, while social connection strength is defined based on preference similarity and then incorporated into the model design.

3. User-Based Collaborative Filtering and Trust-Based Social Networks

3.1. User-Based Collaborative Filtering

The core idea of user-based collaborative filtering is to analyze and mine user historical ratings to calculate similarity between users. Then, based on these user similarities, it predicts ratings to make recommendations.
Methods for calculating similarity mainly include Euclidean distance, the Pearson correlation coefficient, cosine similarity, and modified cosine similarity. In this context, we use the Pearson correlation coefficient to calculate user similarity:
s i m u , v = i I u v R u i R ¯ u R v i R ¯ v i I u v R u i R ¯ u 2 i I u v R v i R ¯ v 2
where R represents the user-item rating matrix and R u i and R v i denote the ratings given by user u and user v to item i , respectively. R ¯ u and R ¯ v represent the average ratings of user u and user v . I u v is the set of items that have been rated by both user u and user v , and I u v is the number of items that have been commonly rated by both users u and v .
After calculating the similarity between users, the principle for predicting the ratings for each user u and each item i is as follows. Select the top u users who are most similar to the user for whom the prediction is being made. The predicted ratings for the user are then calculated based on the similarity between these selected users and the predicting user, as well as their ratings for item i . The formula for this calculation is:
r ^ u i = v N ( u ) s i m u , v r v i v N ( u ) s i m ( u , v ) I ( r v i > 0 )
where N ( u ) represents the set of users most similar to user u , s i m ( u , v ) is the similarity between users u and v , and r v i denotes the rating given by user v to item i . I ( r v i > 0 ) is an indicator function, signifying whether user v has rated item i (i.e., whether the rating is greater than 0). If user v has not rated item i , then user v is not included in the calculation of the predicted rating for item i .

3.2. Trust-Based Social Networks

Traditional recommendation models primarily rely on user historical ratings to predict ratings and make recommendations. However, in many cases, available user historical ratings for a user might be insufficient, making prediction difficult. At such times, social networks provide a new dimension, allowing researchers to utilize trust relationships among users within the social network for rating prediction.
In social networks, trust between users is often represented as binary values (0 or 1), where 0 denotes distrust and 1 denotes trust. For each user u and each item i , the principle for prediction is as follows. Select other users from the social network whom the predicting user trusts, and based on their ratings for item i , calculate the predicted rating for the predicting user. The basic prediction formula is:
r ^ u i = v T ( u ) r v i T ( u )
where T ( u ) represents the set of other users that user u trusts, T ( u ) represents the number of users in the set, and r v i indicates the rating given by user v to item i .

3.3. Nonlinear Integration of Similarity and Trust Relationships

By leveraging both user similarity-based collaborative filtering and trust-based social networks, two different types of predicted ratings can be obtained. Typically, the credibility and the amount of noise data contained in these two types of predicted ratings have different impacts on the final prediction outcome. Therefore, most models set a weight factor w to balance the influence of trust relationships and similarity relationships.
While setting the weight factor w can determine the extent to which trust and similarity relationships influence the outcome to some degree, this impact is more reflected in the overall combination of the two types of predicted ratings, without giving sufficient attention to individual differences within the whole. Additionally, the original user-item rating matrix not only exhibits sparsity but the number of trust relationships between users is also relatively limited. Therefore, these two types of predicted ratings only fill part of the gaps in the rating matrix, and the overlap in their predictions is also relatively low.
As illustrated in Figure 1’s user-item rating matrix, to better integrate these two types of predicted ratings and enrich the user-item rating matrix while reducing its sparsity, this paper divides the predicted ratings into three parts:
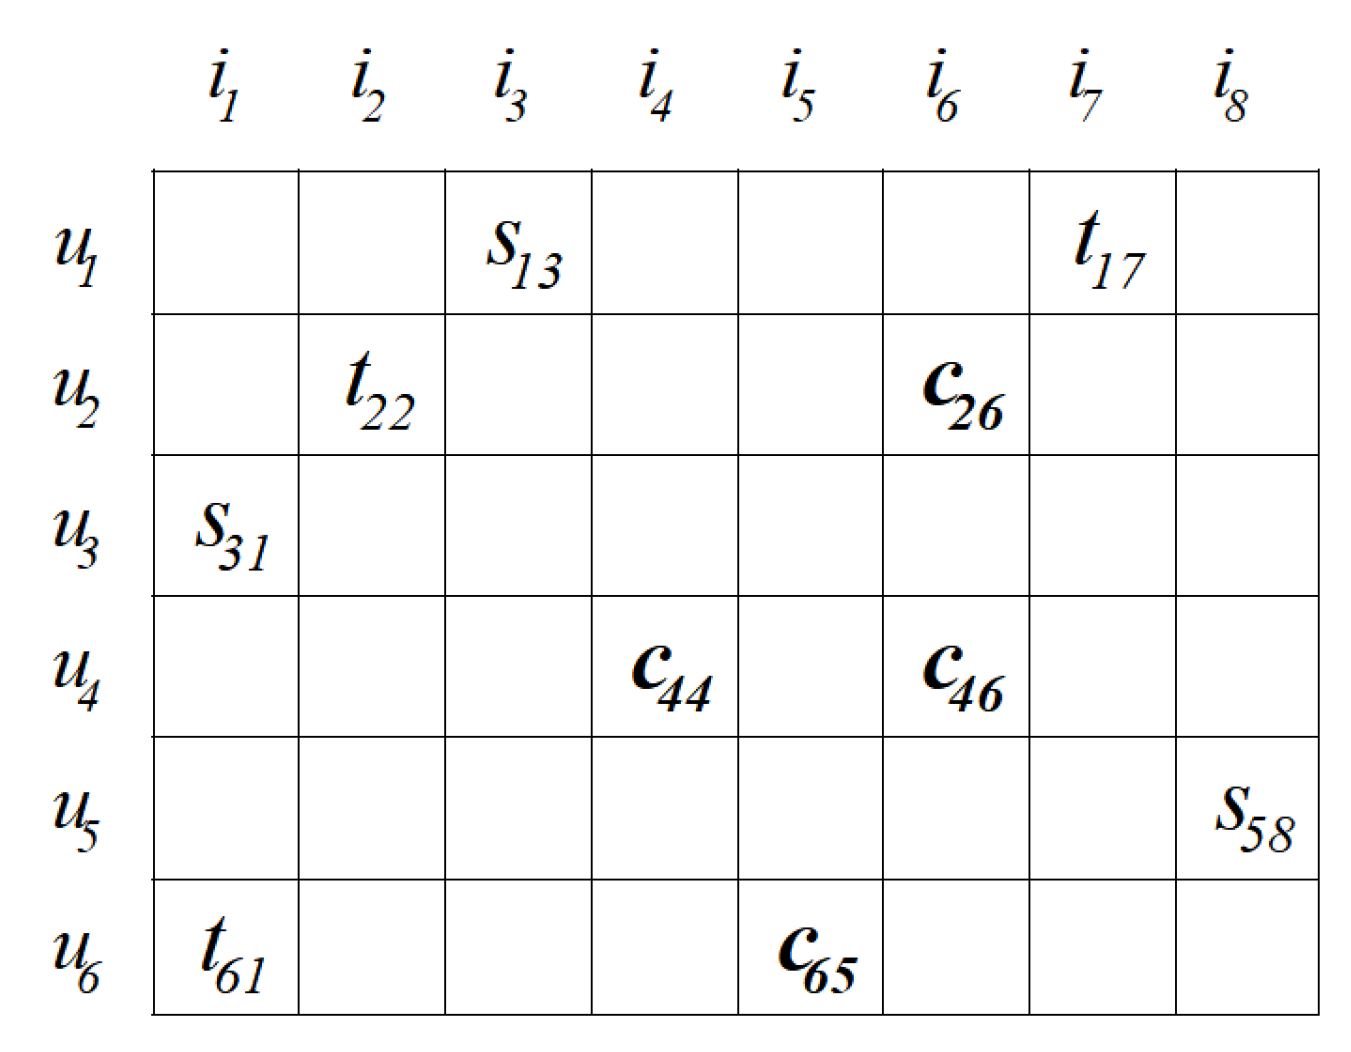
  • The first part consists of predicted ratings obtained solely from trust relationships. These ratings have no overlap with those obtained from similarity relationships and are represented in the matrix as t u i .
  • The second part includes predicted ratings derived solely from similarity relationships, distinct from those obtained from trust relationships. In the matrix, these ratings are denoted as s u i .
  • The third part is derived from the overlapping portion of the two types of predicted ratings, integrated together. This part is represented in the matrix as c u i .
Figure 1. Representation of the three parts of the predicted ratings in the matrix.
Applsci 14 00879 g001
By setting an adaptive weight factor w u i (ranging from 0 to 1), the overlapping parts of the two types of predicted ratings are dynamically integrated to obtain the value of c u i :
c u i = 1 w u i t u i + w u i s u i
The value of w u i is derived from user historical ratings. Before using Equation (2) to calculate the predicted ratings, this model sets two thresholds, θ 1 and θ 2 , to filter the data. This approach enhances the reliability of user similarity, thereby reducing the impact of noise data on the predicted ratings, and subsequently determines w u i .
The model sets the first quantity threshold, θ 1 , for the number of items commonly rated by users. The similarity between users is calculated using Equation (1) if the number I u v of items commonly rated by the users exceeds θ 1 . Otherwise, the similarity is set to 0.
The model sets a second similarity threshold, θ 2 , for the calculated similarity. The predicted ratings for a user are calculated using Equation (2) if the user similarity s i m ( u , v ) exceeds θ 2 . This ensures that the user set N ( u ) in Equation (2) only includes users with a high degree of similarity to user u , thereby further reducing the impact of noise data on the predicted ratings.
After filtering through the two thresholds, when using Equation (2) to calculate the predicted rating of user u for item i , the impact of noise data on the result becomes smaller. At the same time, the number of users in the set N ( u ) who have participated in rating item i by user u is obtained, denoted as m . The weight factor w u i can be calculated using the following piecewise function:
w u i = m n , 1 ,   1 m < n m n
In this context, n is a configurable parameter. Since w u i balances the weight of similarity and trust relationships in the third part of predicted ratings, the minimum value of m is 1. When the number of users participating in rating item i by user u is less than n , predicted ratings are determined by a combination of trust and similarity relationships. The closer m is to 1, the smaller w u i becomes, indicating a greater influence of trust relationships on the rating. When m is greater than or equal to n , the rating is entirely determined by similarity relationships. w u i is adaptively calculated by the model and is precise to each user’s rating, thus more effectively balancing the impact of trust and similarity relationships on the outcome.

4. Trust-Based Weighted Matrix Factorization

4.1. Bias-SVD Matrix Factorization

The core concept of matrix factorization is to map users and items into a common k-dimensional latent space. In this space, the interactions between users and items can be modeled using the inner product of vectors. Using this method, matrix factorization can capture latent patterns and relationships in the data, enabling the model to predict unknown user-item ratings.
Funk-SVD [24] is one of the earliest matrix factorization models used for sparse matrices. It decomposes an m × n matrix R m × n into a user-related matrix P m × k and an item-related matrix Q k × n :
R m × n P m × k Q k × n T
Through matrix factorization, user u obtains a feature vector p u representing their preferences, and item i obtains a feature vector q i representing its characteristics. Then, the predicted rating of item i by user u is calculated as the product of the feature vector p u of the user and the feature vector q i of the item:
r ^ u i = q i T p u
The core of matrix factorization is the optimization process, which aims to find the optimal P m × k and Q k × n T such that their product approximates the actual rating data R m × n as closely as possible. This is typically achieved by minimizing a loss function. The loss function for Funk-SVD is:
L = ( u , i ) R ( r u i q i T p u ) 2 + λ ( q i 2 + p u 2 )
where r u i represents the actual rating of user u for item i , and q i T p u   (derived from Equation (7)) represents the predicted rating of user u for item i . The first part of the loss function represents the mean squared error between the model’s predictions and the actual values, which is the core of the loss function. By minimizing this part, the prediction accuracy of the model can be directly optimized. The latter part of the loss function represents the regularization term. The regularization term imposes a penalty on the magnitude of the feature vectors, helping to control the complexity of the model. This can prevent overfitting on the training data, thereby improving the model’s generalization ability on unseen data. The regularization coefficient λ can be adjusted to control the degree of penalty on model complexity. A larger λ strengthens the penalty on model complexity, helping to reduce the risk of overfitting, but it may also lead to underfitting.
Then, the loss function is optimized using gradient descent, continuously adjusting the feature matrices to reduce the difference between predicted and actual ratings.
In practice, different users have varying standards for rating, and the quality of different items also varies. Factors that are unrelated to a user’s preference for an item but depend on the inherent characteristics of the user or the item are referred to as biases.
Bias-SVD [5] extends the Funk-SVD model by incorporating bias terms. This modification alters the prediction formula from the previous q i T p u to the following:
r ^ u i = u + b u + b i + q i T p u
In this modified formula, u represents the overall rating situation in the training data, typically set as the mean of the ratings in the training dataset. The value of u may vary depending on the rating habits of users in different datasets. b u and b i represent the biases of the user and the item, respectively. These biases are parameters that need to be trained.
The loss function for Bias-SVD also changes to:
L = ( u , i ) R ( r u i u b u b i q i T p u ) 2 + λ ( b u 2 + b i 2 + q i 2 + p u 2 )

4.2. Trust-WMF Recommendation Model

This paper designs a new type of trust network-based weighted matrix factorization recommendation model (Trust-WMF), whose architecture, as shown in Figure 2, is divided into four parts:
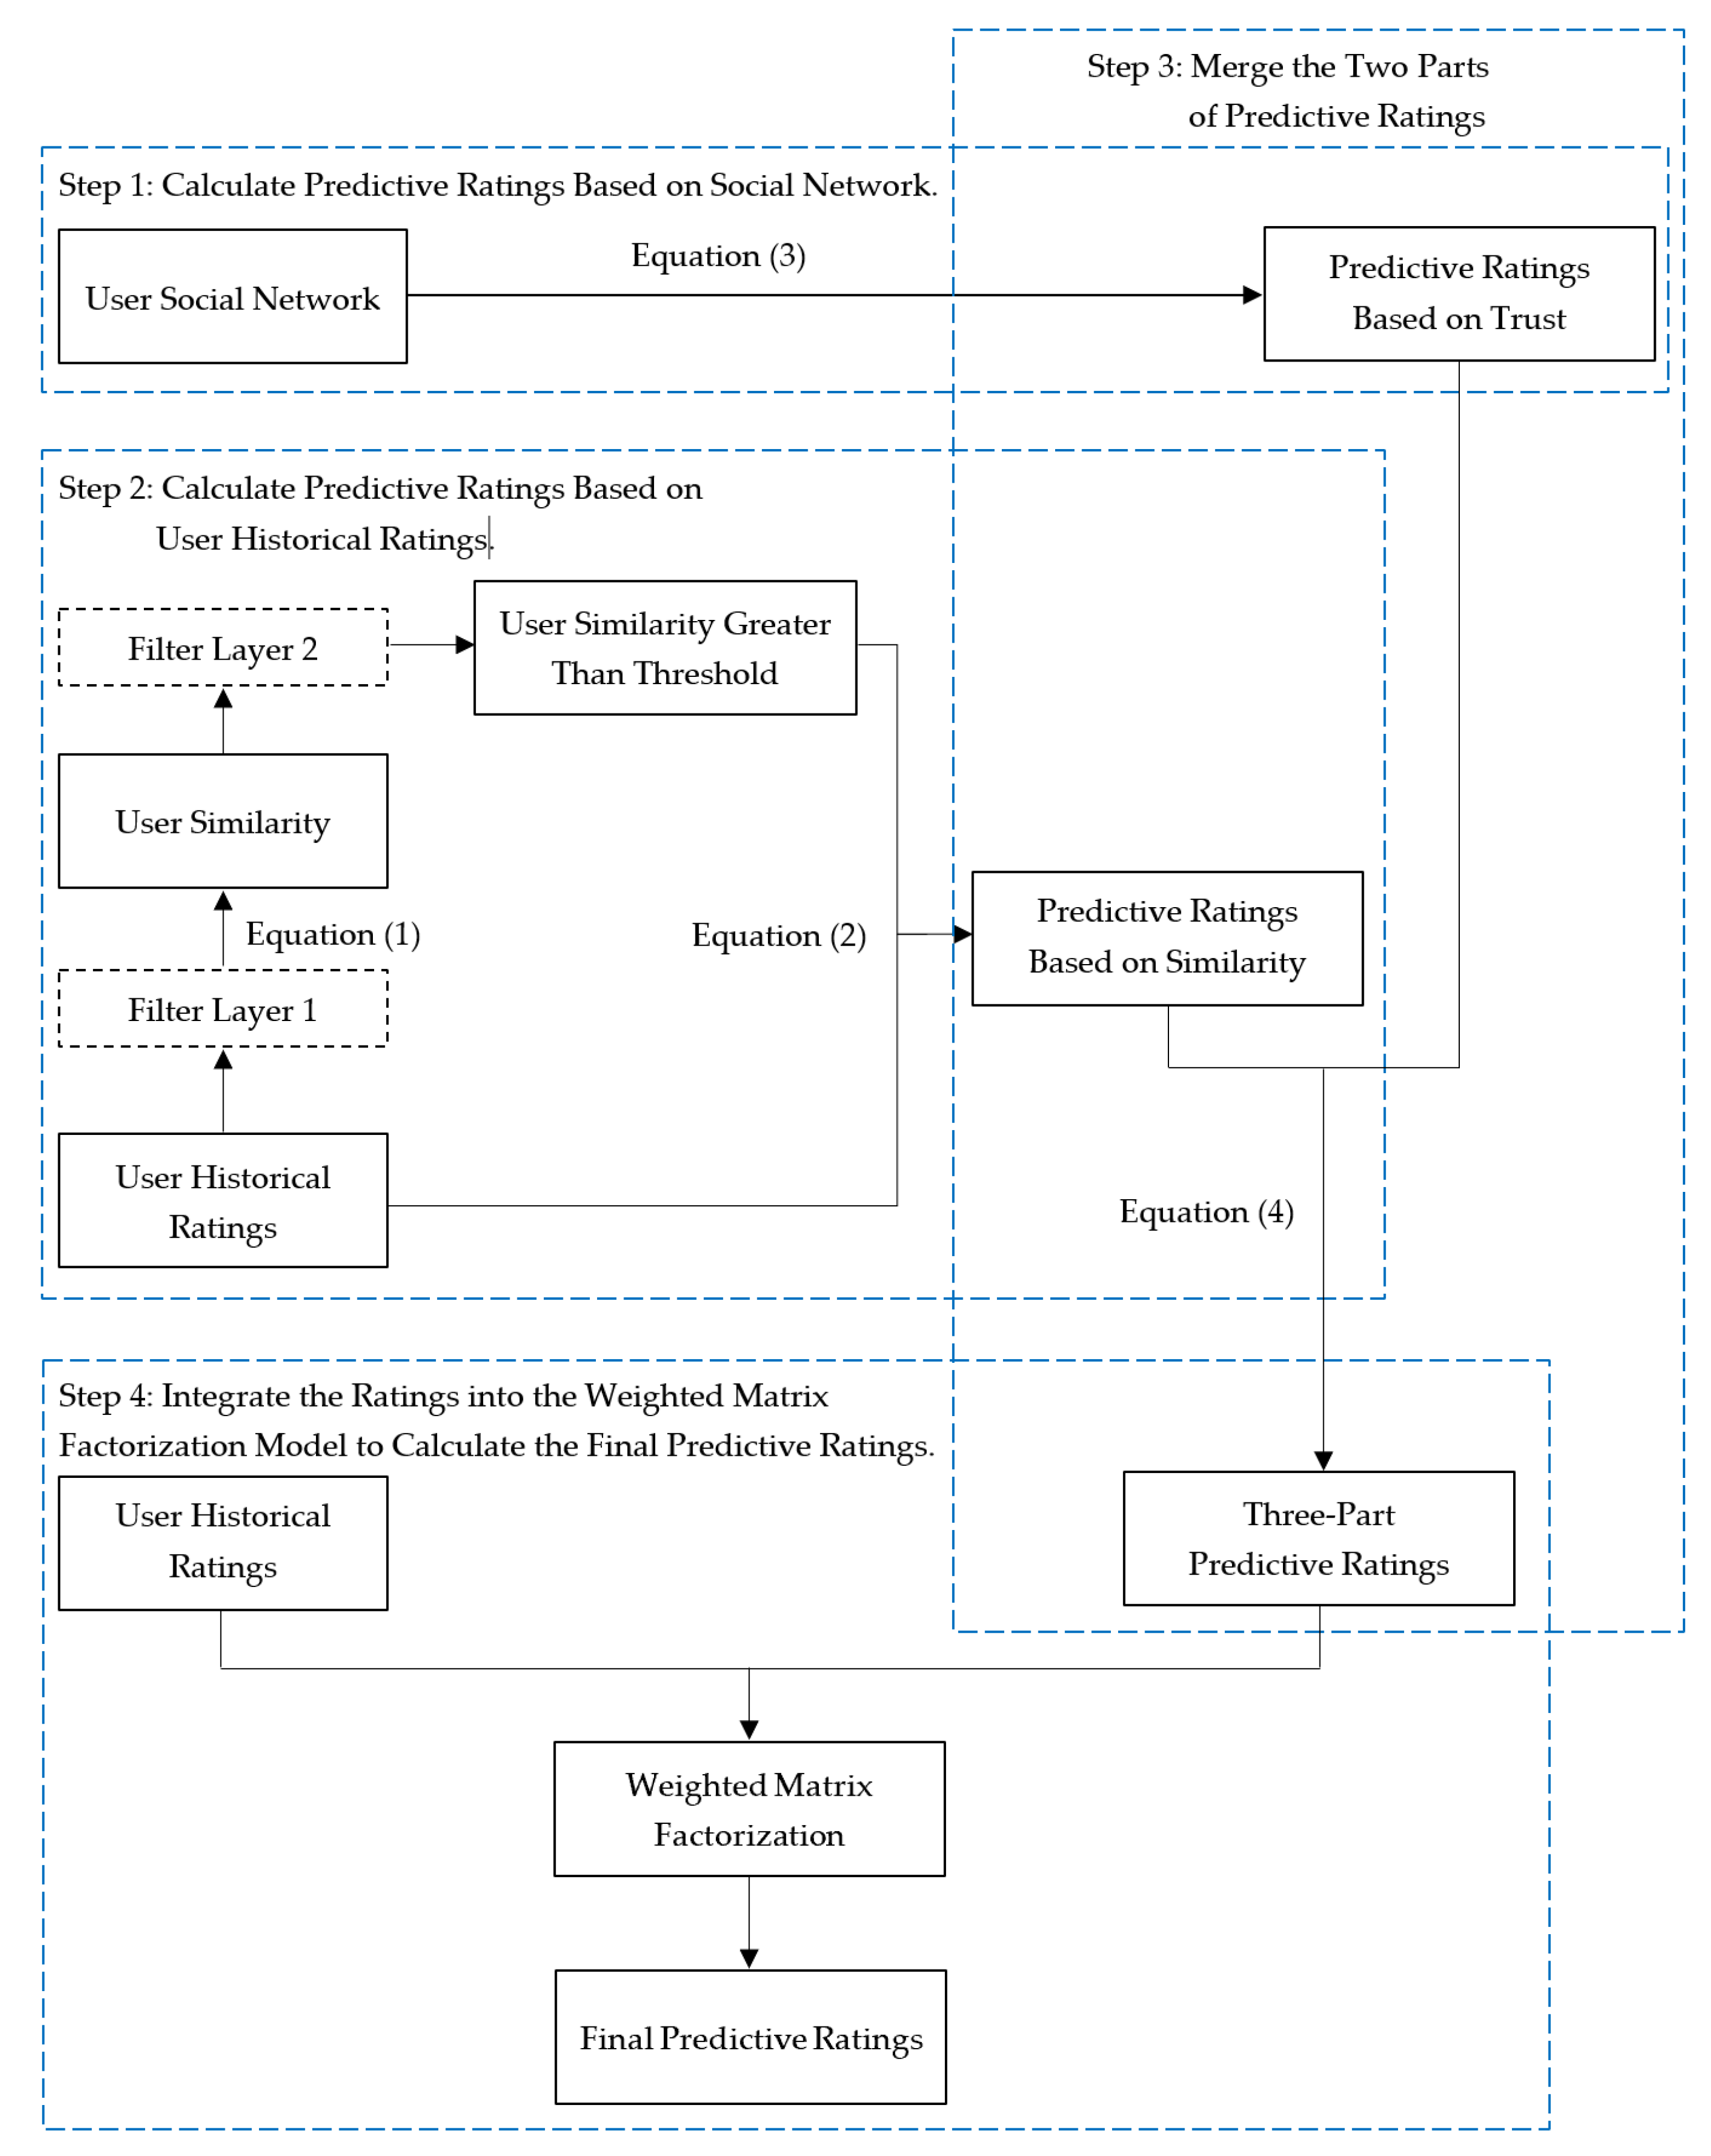
  • Utilizing Equation (3), predicted ratings based on the user’s social network are calculated.
  • Based on user historical ratings, the predicted ratings are calculated using Equations (1) and (2), and this part includes two filtering layers. The role of Filter Layer 1 is to screen out users with fewer commonly rated items before calculating the similarity between users, ensuring the reliability of the calculated user similarity. Filter Layer 2 aims to filter out pairs of users with low similarity before predicting ratings based on user similarity, further reducing the impact of noise data on predicted ratings.
  • Predicted ratings based on trust relationships and similarity relationships calculated in the first two parts are nonlinearly combined using Equation (4).
  • After combining the three parts of predicted ratings, they are integrated with user historical ratings, and the improved weighted matrix factorization model within the Trust-WMF recommendation model is used to further capture the latent features and relationships of users and items.
Figure 2. Architecture diagram of the Trust-WMF model.
Applsci 14 00879 g002
As shown in the diagram, the Trust-WMF model generates three parts of predicted ratings after the calculations in the first three steps. These predicted ratings need to be combined with user historical ratings to form four parts of data to be processed. Subsequently, these combined data undergo matrix factorization to yield the final predicted ratings. Since the four parts of ratings differ in credibility and the impact of noise data they contain on the results also varies, existing matrix factorization models cannot effectively distinguish these differences. Therefore, this paper proposes a new weighted matrix factorization model to address this issue.
The new weighted matrix factorization model achieves the goal of assigning different weights to different data parts by modifying the loss function of the Bias-SVD model. Its loss function contains two parts: one dealing with user historical ratings set R o r i g and the other handling the three parts of the predicted ratings set R p r e d . Both parts of the loss function include a core component representing the difference between the actual value r u i and the model’s predicted value (from Equation (9)) and a regularization part to prevent overfitting, with λ as the regularization coefficient. The specific loss formula is:
L = u , i R o r i g [ w o r i g r u i u b u b i q i T p u 2 + λ 1 b u 2 + b i 2 + λ 2 q i 2 + p u 2 ] + u , i R p r e d [ w p r e d r u i u b u b i q i T p u 2 + λ 3 b u 2 + b i 2 + λ 4 q i 2 + p u 2 ]
In Equation (11), it is evident that the primary difference between the two parts of the loss function lies in their coefficients. In the model, w o r i g represents the weight of the data in the user historical ratings set R o r i g . Since the original ratings have higher credibility and contain less noise data, the weight w o r i g is set to 1. w p r e d represents the weight of the data in the predicted ratings set R p r e d . According to the Trust-WMF model architecture, the predicted ratings set R p r e d is composed of three parts: the predicted ratings based on the user’s social network, the predicted ratings based on user historical ratings in the matrix, and their overlap. Correspondingly, the model divides w p r e d into three parts. The value of w p r e d is derived from the following piecewise function:
w p r e d = w 1 , w 2 , 1 w u i w 1 + w u i w 2 ,   ( u , i ) R 1 ( u , i ) R 2 ( u , i ) R 3    
where R 1 and R 2 represent the sets of predicted ratings based on the user’s social network and user historical ratings in the matrix, respectively, while R 3 is the set of predicted ratings for the overlapping part after fusion. The weight w u i is derived from Equation (5). In this model, w 1 and w 2 are the optimal weight values determined through experimentation and are constant.
The model also sets different regularization coefficients λ for the regularization part of the loss function. This allows for varying degrees of regularization to be applied to different types of model parameters, enabling better control over the curve of the loss function.
Based on the loss function, the model is trained and optimized using gradient descent. The first step involves calculating the partial derivatives of the parameters b u , b i , q i , and p u in the first part of Equation (11):
L b u = 2 w o r i g r u i u b u b i q i T p u + 2 λ 1 b u
L b i = 2 w o r i g r u i u b u b i q i T p u + 2 λ 1 b i
L q i = 2 w o r i g r u i u b u b i q i T p u p u + 2 λ 2 q i
L p u = 2 w o r i g r u i u b u b i q i T p u q i + 2 λ 2 p u
The partial derivatives obtained for the four parameters represent the gradient, indicating the direction of the steepest increase in the loss function. Therefore, to minimize the loss function, the iterative process involves subtracting the product of the gradient and the learning rate γ from these parameters:
b u = b u γ [ w o r i g r u i u b u b i q i T p u + λ 1 b u ]
b i = b i γ [ w o r i g r u i u b u b i q i T p u + λ 1 b i ]
q i = q i γ [ w o r i g r u i u b u b i q i T p u p u + λ 2 q i ]
p u = p u γ [ w o r i g r u i u b u b i q i T p u q i + λ 2 p u ]
Similarly, a similar operation process is applied to the second part of Equation (11).
Here, the learning rate is set as γ 1 and γ 2 , depending on whether the parameter belongs to the first or the second part of the loss function. Through iterative updates, the model refines the feature vectors of unknown users and items, leading to the final predicted ratings.

5. Experimental Evaluation

5.1. Experimental Environment and Datasets

All experimental evaluations presented in this research paper were performed within a consistent experimental environment, employing Ubuntu 20.04 as the operating system, an Intel(R) Xeon(R) Silver 4214R CPU operating at 2.40 GHz, manufactured by Intel Corporation (Santa Clara, CA, USA), and an NVIDIA Tesla T4 GPU with 16 GB of memory manufactured by NVIDIA Corporation (Santa Clara, CA, USA).
To validate the performance of the Trust-WMF model, experiments were conducted using two public datasets of different sizes and levels of sparsity: Epinions and Ciao.
Epinions is derived from a consumer review website (www.epinions.com) accessed on 1 December 2003, where users can write reviews and rate products. Additionally, users can establish trust networks by indicating which other users’ reviews they trust. Ciao is from an online shopping guide website (www.ciao.co.uk), accessed on 1 May 2011. It not only offers user ratings and review functionalities but also allows users to establish friendships, thereby creating a social network system.
The rating range for both datasets is 1–5, and the trust relationships between users are unidirectional. Table 1 describes the basic characteristics of these two datasets.

5.2. Evaluation Metrics

In the experiments, two classic evaluation metrics were used: Mean Absolute Error (MAE) and Root-Mean-Square Error (RMSE). These metrics measure the accuracy of the recommendation results by calculating the error between the user’s actual ratings and the predicted ratings. The smaller their values, the more precise the recommendation results are.
M A E = ( u , i ) R r u i r ^ u i R
R M S E = ( u , i ) R r u i r ^ u i 2 R
where R represents the set of rating data in the test set, r u i is the actual rating given by user u to item i , and r ^ u i is the predicted rating for user u on item i .
Additionally, in the evaluation experiments of this model, the R 2 metric was also used to measure the degree of fit between the model’s predicted values and the actual observed values, providing more detailed insights into the performance of the model.
R 2 = 1 ( u , i ) R ( r u i r ^ u i ) ( u , i ) R ( r u i r ¯ )
where r ¯ represents the average value of user ratings.

5.3. Comparison of Model Recommendation Performance

To validate the effectiveness of the Trust-WMF model in recommendation results, Trust-WMF was compared with the following recommendation models:
  • PMF [25]: Probabilistic Matrix Factorization Model: This model considers the latent factors of users and items under a Gaussian distribution in probabilistic matrix factorization;
  • SoRec [11]: It captures the latent features of users and items by jointly decomposing the user-item rating matrix and the user-user social network matrix;
  • SoReg [15]: This model uses social information to regularize the user feature vectors;
  • SocialMF [14]: It assumes that a user’s preference information largely depends on the preference information of their trusted friends, representing the user feature vector as the weighted average of their trusted friends’ feature vectors;
  • TrustMF [12]: This model originates from the genesis of trust relationships, separately modeling trusting and being trusted behaviors;
  • NeuMF [19]: This model combines neural networks with matrix factorization, using neural networks to replace the traditional inner product operation;
  • DiffNet++ [21]: Based on graph neural networks, model the high-order social influence diffusion in social networks and interest diffusion in interest networks within a unified model;
  • GDSRec [23]: Based on graph neural networks, this model considers attitude biases that might exist among different users as vectors and integrates these biases into the process of learning user and item representation vectors.
For the model evaluation, 80% of the data was randomly selected as the training set, and 5-fold cross-validation was conducted. For the Trust-WMF model, the parameter settings were as follows: learning rates γ 1   = 0.02 and γ 2 = 0.005 and regularization parameters λ 1 = 0.005, λ 2 = 0.5, λ 3 = 0.005, and λ 4 = 0.5. Additionally, the number of latent space features was set to 10. Table 2 shows the performance comparison of the Trust-WMF model and the aforementioned models on the Epinions and Ciao datasets.
Based on the results in the table, we can see:
  • Among all models, PMF, which only utilizes user historical ratings, has the lowest accuracy. Meanwhile, the accuracy of SoRec, SoReg, SocialMF, and TrustMF, which integrate user social networks, is higher than PMF. This indicates that incorporating user social networks effectively enhances the accuracy of recommendation models. Distinct from the modeling methods of SoRec, SoReg, and SocialMF, TrustMF considers from the perspective of the generation of trust relationships. It models trust and being trusted behaviors separately, mapping users into trustor feature vectors and trustee feature vectors. This approach enables more effective utilization of the relationships between users in social networks. Although the NeuMF model does not integrate user social networks, its accuracy is still higher than PMF, proving that using neural networks can learn deeper features of users and items, thus improving the accuracy of recommendation models.
  • The experimental results of the SoRec, SoReg, SocialMF, TrustMF, DiffNet++, and GDSRec models show that the accuracy of DiffNet++ and GDSRec is significantly higher than the other four models. All six models utilize user historical ratings and social networks, but DiffNet++ and GDSRec are trained based on graph neural network architecture. This suggests that graph neural networks enhance the precision of recommendation models. Unlike DiffNet++, which uses social networks to learn user representations, GDSRec improves model recommendation accuracy by correcting the final prediction scores by learning target users’ preferences by utilizing the preferences of other users related to the target user in the social network.
  • Compared to other models, the Trust-WMF model proposed in this paper has a lower MAE and RMSE, indicating that this model can effectively reduce the impact of noise when processing data. Additionally, the improved weighted matrix factorization method effectively controls the weight between different ratings, allowing the model to more accurately reflect user preferences and item characteristics when processing large-scale data.
  • The Trust-WMF model demonstrates superior recommendation accuracy on different scales in the Epinions and Ciao datasets compared to other models, indicating good robustness of the model and no bias toward specific datasets.

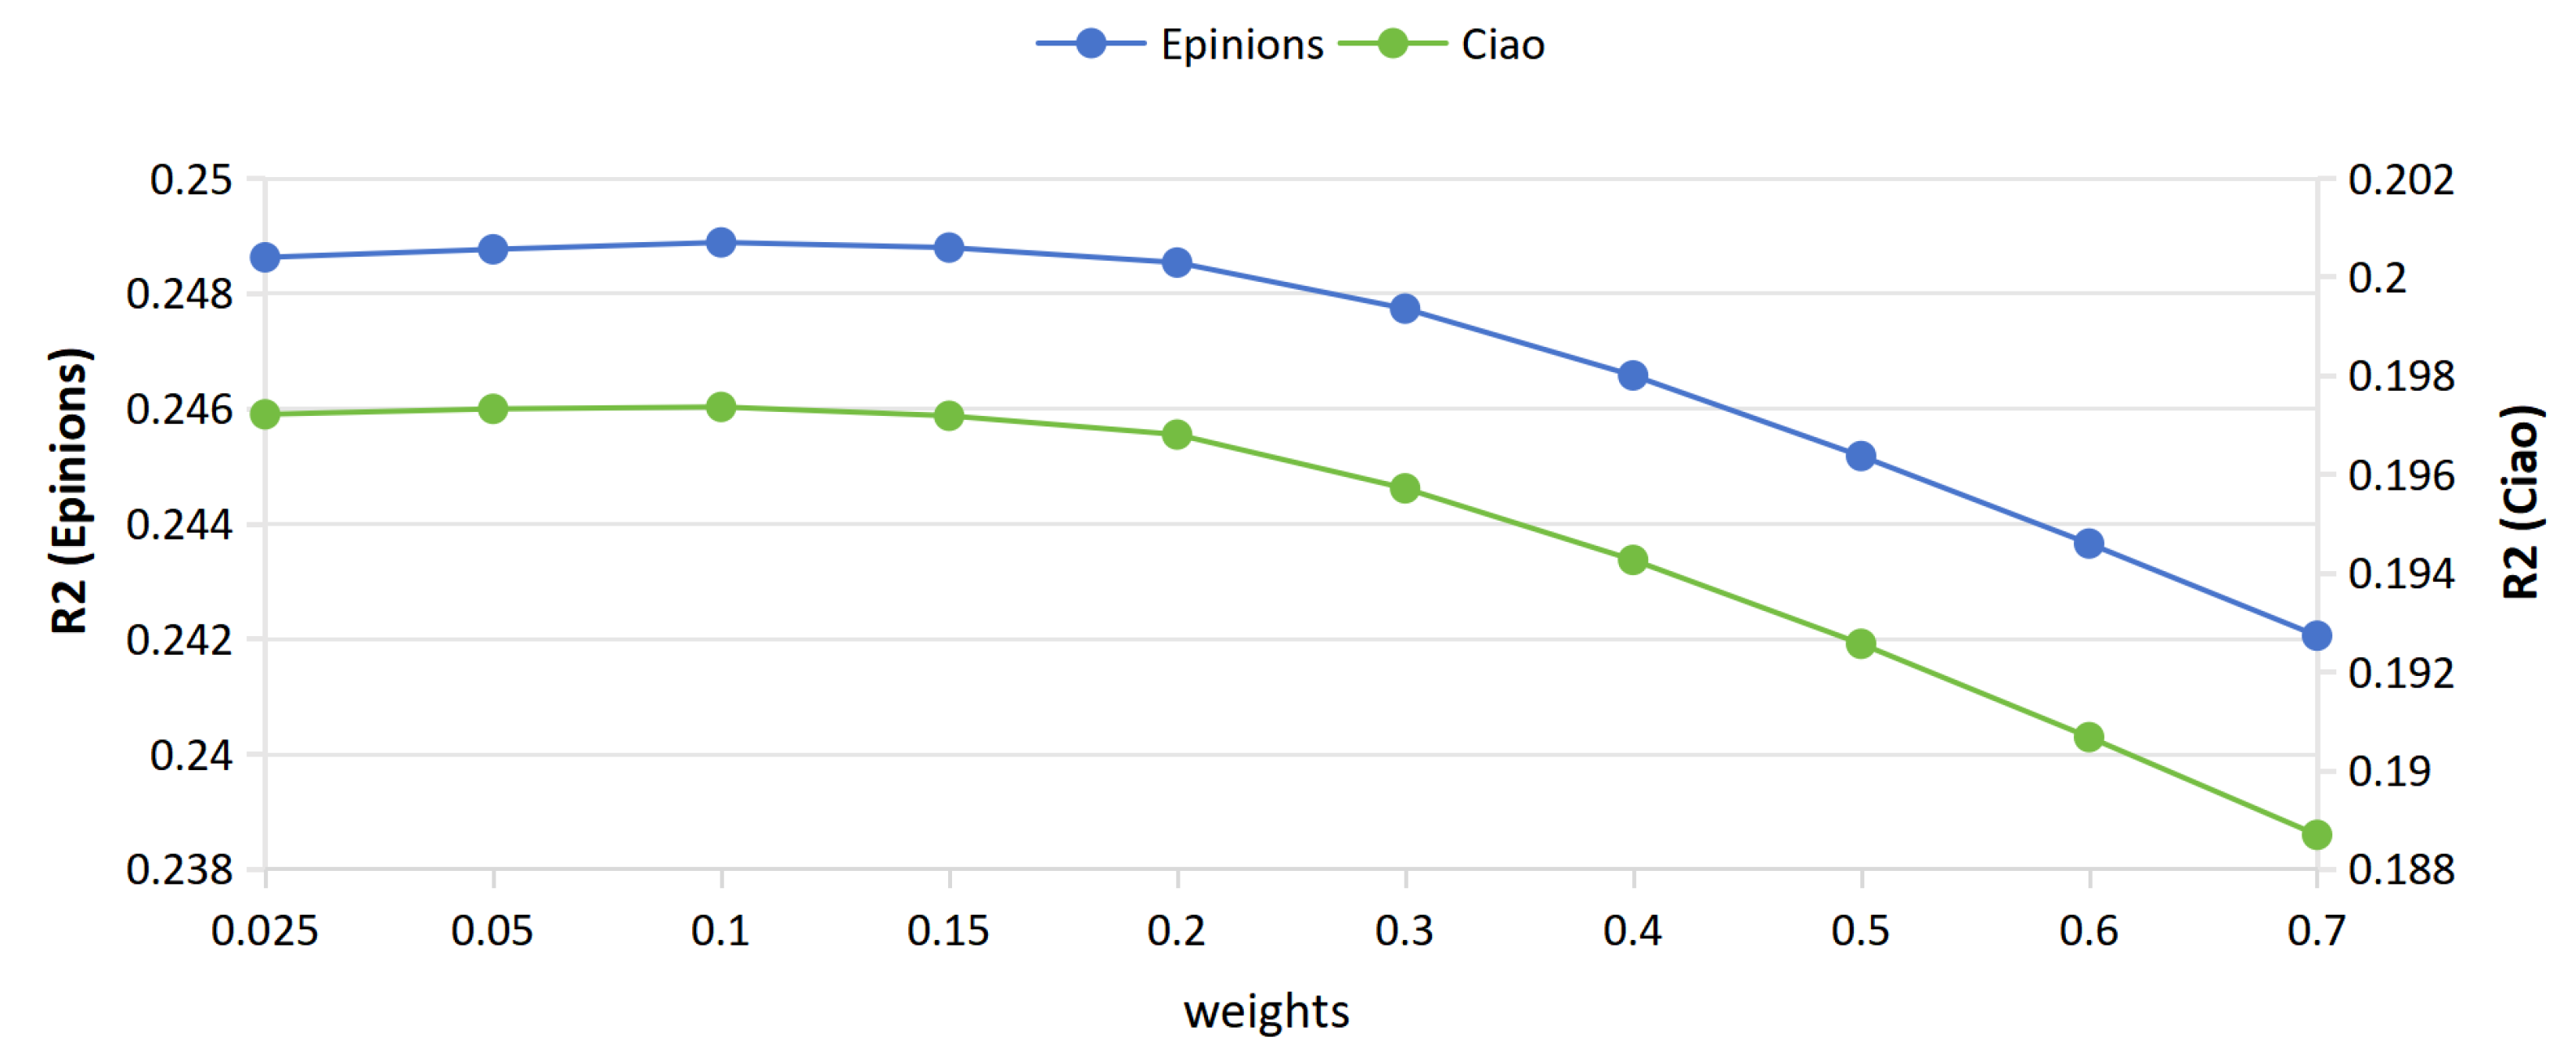
5.4. Impact of Parameters

This section analyzes the impact of the trust weight w 1 , similarity weight w 2 , and the combined weight w 3 on the recommendation accuracy of the Trust-WMF model.
The structural diagram of the Trust-WMF model (Figure 2) indicates that this paper divides user ratings into four parts. The first part is the predicted ratings calculated based on the social network; the second part is the predicted ratings calculated based on the user’s historical ratings; the third part is the predicted ratings derived from the integration of the overlapping portions of the first and second parts; and the fourth part is the user historical ratings. The first three parts together form the predicted ratings, corresponding to R p r e d in Equation (11), and the fourth part corresponds to R o r i g . In the fourth step of the model, it is necessary to combine these four parts of the ratings for weighted matrix factorization; hence, different weights need to be set for them. Since the fourth part represents the original user ratings, which are the most credible and have the least noise data, this part’s weight, w o r i g , is set as 1. However, since the predicted ratings based on the social network and user historical ratings are less credible than the original user ratings, theoretically, the trust weight w 1 for the first part, the similarity weight w 2 for the second part, and the weight w 3 for the ratings derived from the integration of the first three parts should be less than 1. Their specific optimal values will be determined by experiments in the following sections.
Figure 3 shows the impact of the trust weight w 1 and the similarity weight w 2 on the recommendation accuracy of the Trust-WMF model for different datasets, Epinions and Ciao, when only considering trust relationships (the first part of the data) or similarity relationships (the second part of the data), respectively.
As shown in Figure 3, for Epinions, the recommendation accuracy of the Trust-WMF model exhibits a clear trend under different parameter settings. For trust weight, the model’s recommendation accuracy increases with an increase in trust weight, reaching its peak when the trust weight is set to 0.2. Beyond this point, as the trust weight further increases, the recommendation accuracy begins to decline. The results indicate that for Epinions, a trust weight of 0.2 is optimal. Exceeding this value leads to the negative impact of noise data in trust relationships outweighing the effective information contained within, while a value below this does not fully leverage the effective information in trust relationships.
In contrast, for similarity weight, the recommendation accuracy of the Trust-WMF model peaks at a similarity weight of 0.1 and gradually decreases as the similarity weight is set below or above 0.1. This finding suggests that the optimal similarity weight for achieving the best recommendation accuracy when only considering similarity relationships is significantly lower than the trust weight required when only considering trust relationships, and the accuracy of the recommendation model that considers only trust relationships is superior to the accuracy of the recommendation model that considers only similarity relationships. This indicates that compared to user similarity relationships, user trust relationships contain richer effective information.
For Ciao, the recommendation accuracy of the Trust-WMF model shows a trend similar to that observed with Epinions under varying trust and similarity weights. The key difference lies in the optimal trust weight when only considering trust relationships. For Ciao, the optimal trust weight for the Trust-WMF model is 0.15, as opposed to 0.2 for Epinions. As inferred from Table 1, even though the density of social relationships in Epinions is much lower than Ciao, the rating density in Epinions is sparser compared to Ciao. Therefore, for Epinions, a higher trust weight is required to achieve the best recommendation accuracy compared to Ciao.
As can be seen in Figure 2, the three parts of data after integration include the predicted ratings obtained solely from trust relationships, those obtained solely from similarity relationships, and the ratings derived from the integration of the overlapping parts of these two types of predicted ratings. The respective weights of these three parts can be determined by Equation (12), with weight w 3 being the comprehensive weight after integration. As shown in the figure above, the accuracy of the recommendation model that considers only trust relationships is superior to the accuracy of the recommendation model that considers only similarity relationships. Therefore, in the three parts of the data, trust relationships should have a greater weight. The model fixes the ratio of trust weight w 1 to similarity weight w 2 at 2:1, thereby deriving different weights for w 3 . As shown in Figure 4, the integration of trust and similarity relationships further enhances the accuracy of the algorithm’s recommendations.
Figure 5 shows the impact of weight w 3 on the fit of the model for different datasets, Epinions and Ciao. The figure indicates that for both the Epinions and Ciao datasets, the model achieves optimal fit when the weight w 3 is 0.1. As the weight increases, the fit of the model gradually decreases. However, as shown in Figure 4, on the Epinions and Ciao datasets, the highest recommendation accuracy is achieved when the weights w 3 are 0.2 and 0.15, respectively. This suggests that in this model, fit does not always correlate positively with recommendation accuracy. Although increasing the weight w 3 reduces the fit, it may simultaneously increase the amount of effective information extracted by the model.

6. Conclusions

This paper introduces the Trust-WMF model, a weighted matrix factorization approach that integrates social networks with user historical ratings. The model leverages user trust relationships based on social networks and user similarity based on historical ratings to obtain two sets of preliminary predicted ratings. These ratings are then nonlinearly integrated using adaptive weights. Subsequently, the combined ratings are incorporated into an improved weighted matrix factorization model to fully exploit effective information and filter out noise data, thereby enhancing the model’s recommendation accuracy. Extensive experiments on the Epinions and Ciao datasets demonstrate that the Trust-WMF model effectively improves the performance of recommendation systems and reduces the error in rating predictions.
Future work will involve integrating graph neural networks to aggregate high-order neighbor information of users in social networks. This approach aims to mine more effective information, providing stronger support for weighted matrix factorization and ultimately enhancing the model’s recommendation performance.

Author Contributions

Conceptualization, H.P. and S.S.; methodology, H.P. and S.S.; software, S.S.; validation, H.P., S.S. and M.M.; formal analysis, H.P. and S.S.; investigation, H.P., S.S. and M.M.; resources, H.P., S.S. and M.M.; data curation, H.P. and S.S.; writing—original draft preparation, S.S.; writing—review and editing, H.P. and S.S.; visualization, H.P. and S.S.; supervision, H.P. and S.S.; project administration, H.P. and S.S.; funding acquisition, H.P. All authors have read and agreed to the published version of the manuscript.

Funding

This research was supported by the Science and Technology Department of Jilin Province by grant No. 20220201096GX.

Institutional Review Board Statement

Not applicable.

Informed Consent Statement

Not applicable.

Data Availability Statement

The datasets used for analysis in the current study can be found at https://www.cse.msu.edu/~tangjili/datasetcode/truststudy.htm (Ciao), and https://github.com/EnnengYang/DTMF/tree/master/Dataset/Epinions-665K (Epinions), accessed on 1 May 2023.

Conflicts of Interest

The authors declare no conflicts of interest.

References

  1. Schafer, J.B.; Konstan, J.; Riedl, J. Recommender systems in e-commerce. In Proceedings of the 1st ACM Conference on Electronic Commerce, Denver, CO, USA, 3–5 November 1999. [Google Scholar]
  2. Semeraro, G.; Lops, P.; Basile, P.; de Gemmis, M. Knowledge infusion into content-based recommender systems. In Proceedings of the Third ACM Conference on Recommender Systems, New York, NY, USA, 23–25 October 2009; pp. 301–304. [Google Scholar]
  3. Resnick, P.; Iacovou, N.; Suchak, M.; Bergstrom, P.; Riedl, J. Grouplens: An open architecture for collaborative filtering of netnews. In Proceedings of the 1994 ACM Conference on Computer Supported Cooperative Work, Chapel Hill, NC, USA, 22–26 October 1994; pp. 175–186. [Google Scholar]
  4. Linden, G.; Smith, B.; York, J. Amazon. com recommendations: Item-to-item collaborative filtering. IEEE Internet Comput. 2003, 7, 76–80. [Google Scholar] [CrossRef]
  5. Koren, Y.; Bell, R.; Volinsky, C. Matrix factorization techniques for recommender systems. Computer 2009, 42, 30–37. [Google Scholar] [CrossRef]
  6. Natarajan, S.; Vairavasundaram, S.; Natarajan, S.; Gandomi, A.H. Resolving data sparsity and cold start problem in collaborative filtering recommender system using linked open data. Expert Syst. Appl. 2020, 149, 113248. [Google Scholar] [CrossRef]
  7. Massa, P.; Bhattacharjee, B. Using trust in recommender systems: An experimental analysis. In Proceedings of the Trust Management: Second International Conference, iTrust 2004, Oxford, UK, 29 March–1 April 2004; pp. 221–235. [Google Scholar]
  8. De Meo, P. Trust prediction via matrix factorisation. ACM Trans. Internet Technol. 2019, 19, 1–20. [Google Scholar] [CrossRef]
  9. Han, L.; Chen, L.; Shi, X. Recommendation Model Based on Probabilistic Matrix Factorization and Rated Item Relevance. Electronics 2022, 11, 4160. [Google Scholar] [CrossRef]
  10. Fan, W.; Li, Q.; Cheng, M. Deep modeling of social relations for recommendation. In Proceedings of the AAAI Conference on Artificial Intelligence, New Orleans, LA, USA, 2–7 February 2018. [Google Scholar]
  11. Ma, H.; Yang, H.; Lyu, M.R.; King, I. Sorec: Social recommendation using probabilistic matrix factorization. In Proceedings of the 17th ACM Conference on Information and Knowledge Management, Napa Valley, CA, USA, 26–30 October 2008; pp. 931–940. [Google Scholar]
  12. Yang, B.; Lei, Y.; Liu, J.; Li, W. Social collaborative filtering by trust. IEEE Trans. Pattern Anal. Mach. Intell. 2016, 39, 1633–1647. [Google Scholar] [CrossRef] [PubMed]
  13. Ma, H.; King, I.; Lyu, M.R. Learning to recommend with social trust ensemble. In Proceedings of the 32nd International ACM SIGIR Conference on Research and Development in Information Retrieval, Boston, MA, USA, 19–23 July 2009; pp. 203–210. [Google Scholar]
  14. Jamali, M.; Ester, M. A matrix factorization technique with trust propagation for recommendation in social networks. In Proceedings of the Fourth ACM Conference on Recommender Systems, Barcelona, Spain, 26–30 September 2010; pp. 135–142. [Google Scholar]
  15. Ma, H.; Zhou, D.; Liu, C.; Lyu, M.R.; King, I. Recommender systems with social regularization. In Proceedings of the Fourth ACM International Conference on Web Search and Data Mining, Hong Kong, China, 9–12 February 2011; pp. 287–296. [Google Scholar]
  16. Guo, G.; Zhang, J.; Yorke-Smith, N. Trustsvd: Collaborative filtering with both the explicit and implicit influence of user trust and of item ratings. In Proceedings of the AAAI Conference on Artificial Intelligence, Austin, TX, USA, 25–30 January 2015. [Google Scholar]
  17. Koren, Y. Factorization meets the neighborhood: A multifaceted collaborative filtering model. In Proceedings of the 14th ACM SIGKDD International Conference on Knowledge Discovery and Data Mining, Las Vegas, NV, USA, 24–27 August 2008; pp. 426–434. [Google Scholar]
  18. Hwang, W.-S.; Li, S.; Kim, S.-W.; Lee, K. Data imputation using a trust network for recommendation via matrix factorization. Comput. Sci. Inf. Syst. 2018, 15, 347–368. [Google Scholar] [CrossRef]
  19. He, X.; Liao, L.; Zhang, H.; Nie, L.; Hu, X.; Chua, T.-S. Neural collaborative filtering. In Proceedings of the 26th International Conference on World Wide Web, Perth, Australia, 3–7 April 2017; pp. 173–182. [Google Scholar]
  20. Wu, L.; Sun, P.; Fu, Y.; Hong, R.; Wang, X.; Wang, M. A neural influence diffusion model for social recommendation. In Proceedings of the 42nd International ACM SIGIR Conference on Research and Development in Information Retrieval, Paris, France, 21–25 July 2019; pp. 235–244. [Google Scholar]
  21. Wu, L.; Li, J.; Sun, P.; Hong, R.; Ge, Y.; Wang, M. Diffnet++: A neural influence and interest diffusion network for social recommendation. IEEE Trans. Knowl. Data Eng. 2020, 34, 4753–4766. [Google Scholar] [CrossRef]
  22. Wan, L.; Xia, F.; Kong, X.; Hsu, C.-H.; Huang, R.; Ma, J. Deep matrix factorization for trust-aware recommendation in social networks. IEEE Trans. Netw. Sci. Eng. 2020, 8, 511–528. [Google Scholar] [CrossRef]
  23. Chen, J.; Xin, X.; Liang, X.; He, X.; Liu, J. GDSRec: Graph-Based Decentralized Collaborative Filtering for Social Recommendation. IEEE Trans. Knowl. Data Eng. 2022, 35, 4813–4824. [Google Scholar]
  24. Claypool, M.; Gokhale, A.; Miranda, T.; Murnikov, P.; Netes, D.; Sartin, M. Combining Content-Based and Collaborative Filters in an Online Newspaper. In Proceedings of the SIGIR’99 Workshop on Recommender Systems: Algorithms and Evaluation, Berkeley, CA, USA, 19 August 1999. [Google Scholar]
  25. Mnih, A.; Salakhutdinov, R.R. Probabilistic matrix factorization. Adv. Neural Inf. Process. Syst. 2007, 20, 1257–1264. [Google Scholar]
Figure 3. Impact of w1 and w2 weights on model accuracy on Epinions and Ciao.
Applsci 14 00879 g003
Figure 4. Impact of w1, w2, and w3 weights on model accuracy on Epinions and Ciao.
Applsci 14 00879 g004
Figure 5. Impact of w3 weight on the fit of the model on Epinions and Ciao.
Applsci 14 00879 g005
Table 1. Information about the datasets.
DatasetUsersItemsRatingsRating DensitySocial RelationshipsSocial Relationship Density
Epinions49,289139,738664,8240.0097%487,1830.0201%
Ciao7375105,114284,0860.0366%111,7810.2055%
Table 2. Performance comparison of different approaches.
DatasetEvaluation MetricsPMFSoRecSoRegSocial
MF
Trust
MF
Neu
MF
DiffNet++GDSRecTrustWMF
EpinionsMAE0.99520.89610.91190.88370.84100.90720.82010.80470.8013
RMSE1.21281.14371.17031.13281.13951.14761.06351.05661.0527
CiaoMAE0.90210.84100.86110.82700.76900.80620.73980.73230.7188
RMSE1.12381.06521.08481.05011.04791.06170.97740.97400.9562
Disclaimer/Publisher’s Note: The statements, opinions and data contained in all publications are solely those of the individual author(s) and contributor(s) and not of MDPI and/or the editor(s). MDPI and/or the editor(s) disclaim responsibility for any injury to people or property resulting from any ideas, methods, instructions or products referred to in the content.

