Abstract
Ensuring the reliability of process gas compressors is critical for underground gas storage, as piston rod fractures can lead to serious accidents, such as natural gas leaks or explosions. On-time monitoring and early detection play a vital role in preventing catastrophic consequences, minimising costs, and reducing production losses due to unplanned downtime. This study presents a novel accelerated life-testing method designed to replicate the fracture events of reciprocating compressor piston rods. By accelerating the induced crack initiation and propagation to the final fracture, comprehensive analyses of the fracture results are performed to reveal the piston rod fracture mechanism and the resulting secondary damage to the unit. The research further presents an innovative approach for identifying piston rod crack propagation by means of acoustic emission. Through kinetic analysis and time–frequency domain analysis, the study elucidates two mechanisms responsible for triggering crack signals during the compressor operation: the contact impact between the crosshead pin and the bearing due to the piston rod load reversal, and crack propagation occurring before the maximum tensile load is reached. In addition, the study identifies the piston rod crack expansion signal frequency band and achieves a high-sensitivity identification of crack dynamic growth by extracting signal sub-band features associated with crack propagation. Then, a prediction model of the fatigue crack growth rate was established based on the AE energy release rate, which provides a quantitative assessment of dynamic crack propagation during compression. This method aims to provide a maintenance strategy for piston rod fractures, thereby increasing the operational safety of critical dynamic equipment in underground gas storage.
1. Introduction
Underground gas storage (UGS) is a notable energy solution that offers significant advantages, including a large gas storage capacity, a wide peaking range, cost-effectiveness, and high levels of safety and reliability. As a result, UGS is widely recognised as an outstanding and effective approach to managing the seasonal nature of gas demand and providing strategic gas reserves [1]. The UGS operational framework typically includes two basic phases: injection and withdrawal (I/W). During periods of reduced demand, natural gas is injected into the storage field, while during periods of increased demand, natural gas is withdrawn from the storage field [2]. Essential to this process are gas compressors, which facilitate the injection of gas from the pipeline into the UGS and the subsequent withdrawal of gas from the UGS for injection into the pipeline [3]. This orchestration ensures the provision of an efficient, safe, and reliable energy supply [4,5].
The process gas compressor system designed for UGS has distinctive characteristics, characterised by a wide range of gas injection volumes, significant variations in the gas injection pressure, and frequent transitions between the gas injection and withdrawal. In this context, reciprocating compressors emerge as the preferred pressurisation equipment for natural gas storage systems due to their ability to achieve high-pressure ratios, optimum efficiency, increased flow rates, and adaptability to a wide range of operating conditions [6,7]. However, the use of reciprocating compressors presents challenges associated with unplanned downtime and significant maintenance costs. These challenges stem primarily from the frequent and abrupt nature of core component failures, including failures such as valve leakage and fractures [8,9], bearing bush wear issues [10,11], and piston rod fractures [12]. In particular, piston rod fractures account for a significant proportion of mechanical failures in reciprocating compressors, estimated at around a quarter of reported incidents [13]. The consequences of fractured piston rods can be severe, ranging from catastrophic chain reactions to extreme outcomes, such as explosions and fires, highlighting the need for the rapid and accurate detection of such failures [14,15,16].
There is a pressing need for effective solutions that facilitate the real-time monitoring and early warning of faults and failures during the operation management of machine systems [17]. While considerable attention has been paid to compressor fault diagnosis [18,19,20] to distinguish abnormal from normal conditions [21], the intricate character of reciprocating compressors presents significant challenges. These challenges arise from the complex structural and motion patterns inherent in such mechanical devices, resulting in signals with multiple sources of influence [22,23]. The existing literature on this topic is limited, with few studies dealing with the diagnosis of piston rod fractures during operational phases. Li et al. [24] proposed the use of the peak-to-peak value of the piston rod displacement for fracture detection, correlating it with increased vibration. On the other hand, Ma et al. [12] used acoustic emission (AE) and a fatigue testing machine to monitor cracks and detect piston rod fractures. In our previous investigations, we systematically described the fault propagation chain associated with piston rod thread loosening due to lateral forces and piston drop due to rider band wear, ultimately leading to piston rod fracture. This comprehensive analysis was carried out from a failure source perspective using both multibody dynamics analysis and finite element analysis [25]. Subsequent research has been extended by introducing the characteristic spectrum of the vibration signals, which enables the quantitative diagnosis of piston rod thread loosening [26]. However, the monitoring of crack initiation and propagation remains a critical component of piston rod fracture prevention. Despite current research advances in the comprehension of failure mechanisms and causative fault diagnosis methods, there is still a significant research gap in the diagnosis of piston rod cracks during compressor operation.
The piston rod in a reciprocating compressor is subjected to alternating tensile and compressive loads during its operating cycles. Previous studies have predominantly linked piston rod failure to factors such as reduced fatigue life due to manufacturing defects [27], improper installation [28], additional external stress concentration [29,30], and changes in the operating conditions [31]. Fatigue as a phenomenon occurs across scales and loads, from the microscale to the macroscale [32]. Depending on the material, a significant portion (50–90%) of the fatigue life is exhausted before cracking occurs [33]. Once fatigue cracks occur, the stress state of the piston rod gradually deteriorates, posing a threat to the safety of UGS operations.
AE technology serves as one of the structural health monitoring techniques capable of detecting crack growth in real time using highly sensitive sensors. AE involves the propagation of elastic waves within a material, driven by structural changes induced by plastic deformation, crack growth, and the redistribution of internal stresses, ultimately leading to the release of energy [34]. This technology is currently being applied to various materials, including metals [35], concrete [36], composites [37], and polyethene [38], and to various engineering structures, such as bridges [39], pressure vessels [40], transformers [41], aircraft structures [42], and railway axles [43], for damage monitoring and identification. In the field of compressors, AE has been mainly used to detect valve leakage [14,44]. Several studies have shown that AE parameters extracted from detected AE waves are closely related to the progression of fatigue damage. For example, Vanniamparambil et al. [45] identified cracks in metal specimens by quantifying AE information and found a transition from a low-frequency continuous-type waveform to a high-frequency burst-type waveform associated with crack initiation. Chai et al. [46] demonstrated a linear quantitative relationship on a logarithmic scale between the fatigue crack growth rate and AE parameters, with the AE energy providing a qualitative identification of fatigue damage. Despite these findings, the mechanisms underlying the effect of complex load excitation on piston rod crack propagation in compressors and the methods for extracting characteristics from AE signals during the fatigue fracture of piston rods remain unexplored.
Monitoring the fracture behaviour of piston rods is an important research topic in compressor dependability, particularly as the failure of piston rods in scenarios with flammable and explosive gases can result in significant economic losses and pose a significant risk to the safety of personnel. This study first conducted an accelerated life test to capture AE signals throughout the piston rod fracture process in an industrial reciprocating compressor. A comprehensive analysis of the results obtained elucidates the progressive stages of piston rod fracture and the subsequent developments. In addition, two different AE signal-generation mechanisms associated with the emergence and propagation of piston rod cracks during compressor operation were elucidated to obtain the AE signal time-domain and frequency-domain characteristics of the crack propagation. Subsequently, by extracting the sub-band characteristics of the crack propagation-related signals, a highly sensitive identification approach for dynamic crack growth in piston rods was achieved. Then, a prediction model of the fatigue crack growth rate was established based on the AE energy release rate, which provides a quantitative assessment of the dynamic crack propagation during compressor. This study aims to provide a timely warning and maintenance strategy for piston rod fracture failures, which is expected to greatly improve the reliability and safety of process compressors in UGS.
2. Experimental Research
2.1. Accelerated Life Test of the Piston Rod
In this study, an industrial two-stage, double-acting, water-cooled reciprocating compressor was modified for experimental purposes, as shown in Figure 1. The structure of reciprocating compressors involves screwing the piston rod into the crosshead, preloaded by a locknut. The compressor is driven by an electric motor, the detailed specifications of which are given in Table 1.
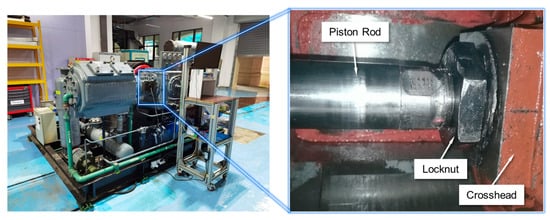
Figure 1.
Experimental setup.

Table 1.
Technical parameters of the reciprocating compressor.
The primary objective of this experiment was to investigate the signal characteristics associated with crack initiation, subsequent crack propagation, and the ultimate failure of the piston rod under operating conditions within a compressor. To increase the efficiency of the testing process, an accelerated life test was used to induce the failure of the piston rod. The experimental modification for the piston rod accelerated fracture test is shown in Figure 2. To increase the reciprocating inertia force, the piston was replaced by a solid structure with a reciprocating inertia mass of 65 kg. Safety precautions were taken in the form of polyurethane pads attached to the piston at both the head and crankshaft ends to mitigate more serious consequences, such as a broken piston rod or the piston colliding with the block, which could damage either the piston or the cylinder. A small diameter prefabricated fracture rod was inserted between the piston rod and crosshead and threaded through the connection block (the prefabricated fracture rod thread M16 × 1.5 and the crosshead thread M33 × 1.5). The two ends of the prefabricated breaker bar were securely fixed to the piston rod and connecting rod, respectively, using a threaded construction. The Q235 was chosen as the material for the prefabricated fracture rod, which is characterised by a low yield strength, tending to deform plastically in areas of stress concentration. This can lead to stress concentrations in these areas, thus making cracks easier to generate for accelerated life testing. The piston, piston rod, and connecting parts were made from 40 Cr. The photograph in Figure 3 provides a visual representation of the fully assembled accelerated life-test structure.
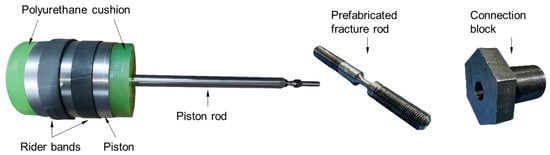
Figure 2.
Design of the accelerated life-test components.
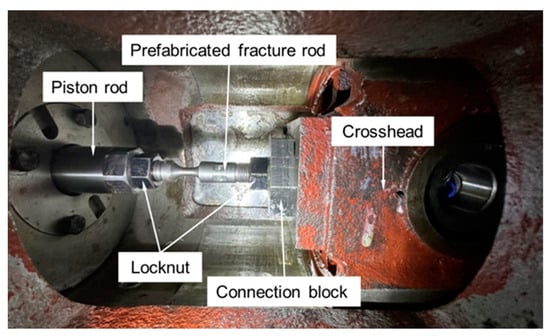
Figure 3.
Photograph of the assembled accelerated life structure.
To determine the dimensions of the prefabricated rod, calculations based on operating loads and material fatigue properties are essential. In a reciprocating compressor, the crankshaft is driven and rotated by external forces, which are then translated into a reciprocating motion of the piston through a connecting rod mechanism; the piston rod of a compressor is subjected to cyclical alternating tensile and compressive loads during operation, as depicted in Figure 4. The crankshaft has a radius of . The motion of the connecting rod can be reduced to two masses: one moving with the centre of the crank pin and the other moving with the centre of the crosshead pin. The length of the connecting rod is , and the ratio of to is . The reciprocating inertial force is the product of the reciprocating inertial mass and the acceleration, and its direction is always opposite to that of the acceleration. Thus, the reciprocating inertia force generated can be calculated as
where the instantaneous position of the crank is expressed as the angle between the crank and the centre line of the cylinder. For consistency, the angle is counted from the top dead centre (TDC).
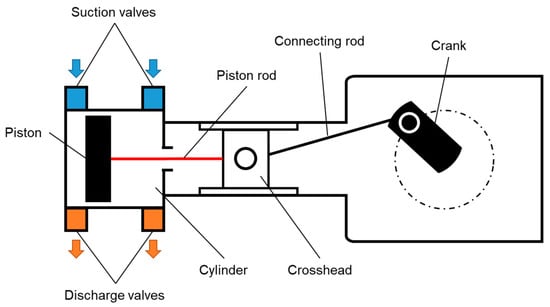
Figure 4.
Schematic diagram of a single-row double-acting reciprocating compressor.
Theoretical analysis indicates that the load on the piston rod includes the combination of the gas force, reciprocating inertia, and frictional force along the piston axis. To minimise the effects of piston rod fracture during the test, the suction and discharge valves of the compressor were configured to remain open, preventing gas compression and keeping the compressor in an unloaded state throughout the test. As a result, the primary influence on the piston rod load was from the reciprocating inertia forces. The S–N curve, which represents the fatigue response of a material to different levels of stress, uses S to represent the applied stress amplitude and N to represent the corresponding number of cycles to failure. This curve is essential for estimating the fatigue life of a material at various stress levels, a critical factor in the design of the test load and the size of the fatigue rod. The Basquin equation [47], a power law relationship, shows the linear relationship between the stress range () on the y-axis and the number of cycles to failure () on the x-axis, plotted on a logarithmic scale, as shown in Figure 5.
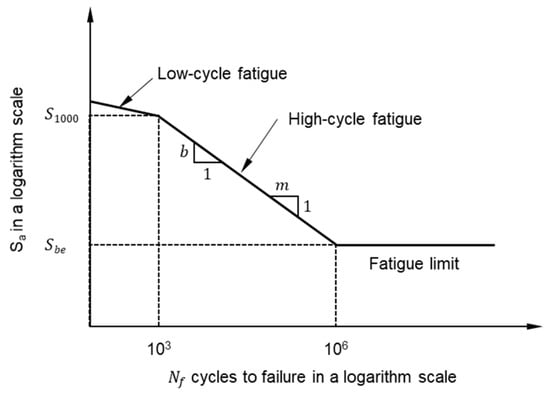
Figure 5.
Schematic representation of an S–N curve.
It can be defined as
where is the number of cycles to failure, and is the stress range (MPa) and the fatigue proprieties of material and . In this work, for the experimental parameter C = 24.54 = −8.0677 (R = −1), the previous literature was used [48].
In this work, the designed repetition of about cycles, extrapolated from the S–N life curve, requires (R = −1) to be approximately 306.65 MPa, as shown in Figure 6a. The minimum diameter of the prefabricated fracture rod was determined to be 6 mm. The Q235 tensile strength of 450 MPa was taken according to Goodman’s diagram [49] using Equation (3). The stress amplitude was estimated to be 289.50 MPa at a reciprocating inertial mass of 65 kg and a compressor operating speed of about 316 rpm, with the prefabricated breaker bar taken at 6 mm at the minimum diameter, as shown in Figure 6b. The (R = −1) reached 308.52 MPa, which met the requirements of the accelerated life test.
where is the actual stress amplitude, is the actual average stress, and is the tensile strength.
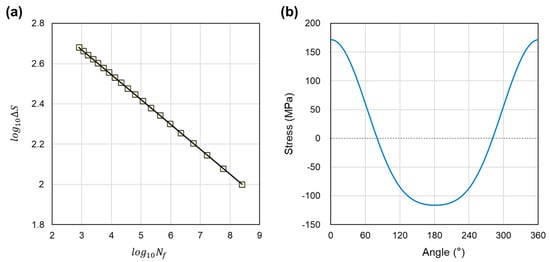
Figure 6.
Fatigue life estimation in the experiment. The S–N curve of the Q235 (a); the stress change curve at the smallest diameter of the prefabricated fracture rod for one cycle of the compressor operation (b).
2.2. Acquisition of Signals
To facilitate the diagnosis of piston rod crack propagation, the experiment used the monitoring of the AE signal from the crosshead and TDC signal. To continuously monitor the AE signal at the crosshead position, an AE transducer was mounted on the side of the crosshead, as shown in Figure 6. This placement was necessitated by the limited space within the crosshead chute. Before the sensor installation, the surface was ground to remove any existing paint. In addition, to ensure the durability and longevity of the sensor, the exterior was shielded with aluminium foil tape for electromagnetic protection and coated with silicone to provide a barrier against oil exposure. Following the results of prior research, it has been observed that, when fatigue cracks propagate within metal plates, the AE waveforms exhibit distinct frequency peaks lying between 70 and 300 kHz [50,51,52]. Consequently, considering the principles of the sampling theorem, as well as the sampling frequency parameter employed in preceding crack surveillance investigations, it was determined that an optimal sampling frequency of 1 MHz was chosen to record the AE data [46].
An optical sensor was mounted on the compressor frame to establish the correlation between the piston position and the angle of rotation of the crankshaft and flywheel, as shown in Figure 7. The TDC signal was picked up by the sensor and approximated by a specially designed nut mounted on the flywheel. When the TDC was reached during the working cycle, an impulse signal was generated which set the crank angle to 0°. The presence of a flywheel in the reciprocating compressor was assumed to maintain a constant angular velocity of the crankshaft and increase its moment of inertia. The remote optical sensor had an accuracy of less than ±0.2%.
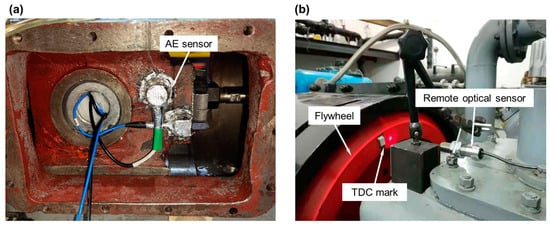
Figure 7.
Acquisition of signals. Installation of the AE sensor (a); monitoring of the TDC signal (b).
3. Methodology
The reciprocating compressor mechanism is a complex system with multiple sources of excitation, leading to a scenario where pertinent information about the piston rod and its fracture condition is obscured by signals from the operation of other components. To overcome this challenge, signal processing techniques are used to first identify the signal band associated with piston rod fractures. The relevant signal within this band is then extracted and the parameters which are sensitive to crack growth are calculated. Figure 8 outlines the research methodology used in this work to identify cracks in the piston rod.
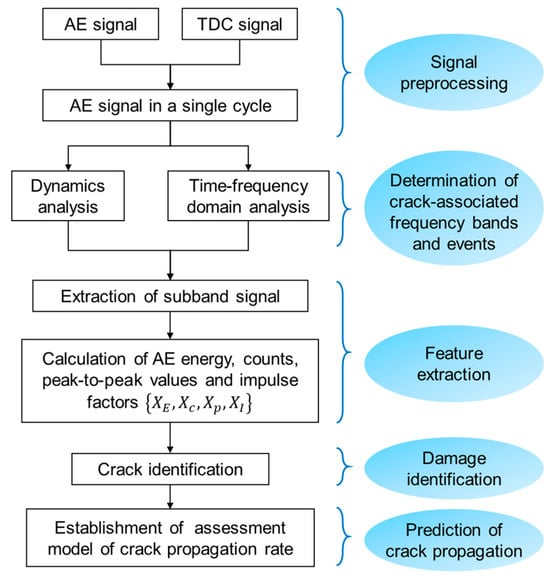
Figure 8.
Schematic diagram of the research methodology.
First, the AE signal is segmented into the crank angle domain from 0 to 360° based on the TDC signal. Next, kinetic and time–frequency domain analyses are performed to identify the frequency bands and events correlated with the crack. The continuous wavelet transform [53] is used to analyse the signal in both the time and frequency domains to determine the sensitive frequency band and crack-associated events. The sub-band AE signal is then extracted by bandpass filtering the original signal.
The AE is recorded as a series of voltage amplitudes at uniform time intervals, which presents a challenge to direct analysis. Consequently, several characteristic parameters are used to describe the AE signal. Parameters describing the characteristics of the AE waveform include the amplitude, rise time, duration, counts/ringing counts, etc., as shown in Figure 9.
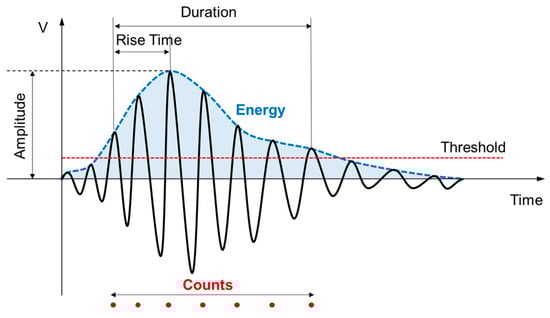
Figure 9.
Variation curve of the envelope margin coefficient of the AE signal.
The envelope is an indicator of variations in the signal amplitude and waveform. The energy of the AE signal can be determined by calculating the area enclosed by the envelope waveform and the coordinate axis. The Hilbert amplitude demodulation [54] method is then integrated to obtain the envelope of the corresponding sub-band signal.
Assuming that the measured signal is , then, from the Hilbert transform, we can know:
Equations (4) and (5) are Hilbert transform pairs, so the analytical signal of is:
The envelope of the signal is represented by the amplitude of the analytical signal . The AE energy is then calculated according to Equation (7).
Finally, considering the inclusion of crack growth produces high-frequency signals of short duration and high amplitude. After obtaining the signal envelope for one cycle, the impulse factor is calculated by Equations (8)–(10) to reflect the mutations in the signal and identify the crack.
where is the max value of the signal and is the average value of the signal.
The peak-to-peak values, , are calculated as follows.
The AE count, , is obtained by counting the number of times the signal exceeds the threshold in a cycle. Based on the above calculations, a four-dimensional feature vector consisting of the AE energy, counts, peak-to-peak values, and impulse factor can be developed. Finally, based on the relationship between the feature parameters and the crack growth rate, the evaluation mode of the crack propagation rate can be established.
4. Results and Discussion
4.1. Detailed Aftermath of the Piston Rod Fracture
In the first case, the piston rod fracture occurred as the piston moved to the BDC (bottom dead centre) position. Once the piston rod was completely broken, the piston and rod relied on their inertia to decelerate and continue to decelerate towards the BDC. During this time, the crosshead was still being driven towards the BDC by the crank linkage, causing both to move away from the break position. As the crosshead passed the BDC and moved towards the TDC, it collided with the piston rod, with the fracture position being the first point of contact, producing a large impact signal. The uneven surface of the fracture caused the contact path to frictionally slip to one side, resulting in an oblique plane that is not perpendicular to the horizontal axis. The impact caused a secondary fracture at the thread connecting the prefabricated fracture rod to the piston rod, and the fractured part fell into the crosshead slide and was jack-knifed to the underside of the oil scraper by the crosshead movement, as shown in Figure 10. In addition, the noncoaxial impact caused the piston rod to bend approximately 2° to one side, creating friction with the surface of the stuffing box. The stuffing box structure cut away part of the piston rod surface, leaving visible signs of wear. What is more, the impact caused significant deformation in the rear half of the preload nut, which was connected to the crosshead. The secondary impact and friction generated significant kinetic energy which was converted to heat at the point of contact, resulting in black carbonised hydraulic oil on the surface at the point of severe impact and friction. It is worth noting that, if the compressed gas were flammable and explosive, the point of impact could act as an ignition source, and sparks from the tiny metal particles could ignite the compressed gas and cause an explosion, which could be fatal to the compressor.
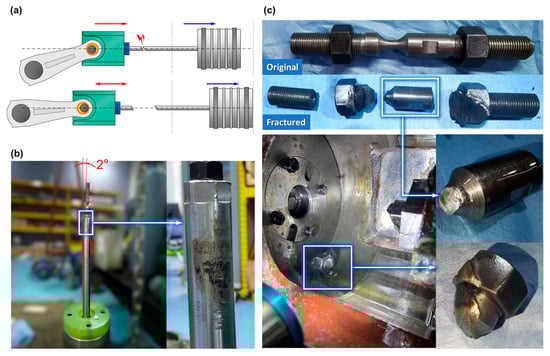
Figure 10.
Prefabricated fractured rods after the secondary fracture. Schematic diagram of the secondary collision at the fracture (a); bending and wear of the piston rods due to collision (b); photographs of the prefabricated fracture rod after the secondary fracture (c).
In the other case, the fracture occurs as the piston moves to the TDC. After the fracture occurred, the piston and piston rod moved under inertia to the TDC, where they came to rest under the cushioning effect of the polyurethane pad. Fortunately, in this case, the piston and piston rod run beyond the TDC position, and therefore no secondary impact is generated at the fracture position. In practice, however, without the cushioning effect of the polyurethane rubber seal, the piston would collide with the cylinder wall, which, in severe cases, can lead to cylinder rupture and flammable gas leakage, resulting in an ignition explosion. The fracture morphology of the prefabricated fracture rod, shown in Figure 11, was retained. The crack in the piston rod develops gradually from the surface on one side of the piston rod. After the initial crack is formed during the fatigue fracture process, a slight increase in the crack length is formed as the number of cycles increases. When the fatigue crack has expanded to about 1/2 the diameter and the remaining section is so small that it is close to plastic instability, the material will rapidly undergo plastic tearing. The remaining sections can be pulled off one by one with only a small number of cycles. At this point, it is almost irrelevant to the alternating stress fatigue mechanism, but should be part of the plastic fracture process, very similar to the mechanism of shear lip formation in a ductile fracture.
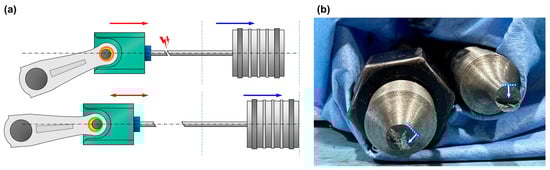
Figure 11.
Fracture occurring when the piston is running towards the TDC. Schematic diagram of the secondary collision at the cylinder head end (a); photographs of the fracture morphology of the prefabricated fracture rods (b).
4.2. Crack Signal Initiation Mechanism
A comparison of the time-domain waveforms and time–frequency spectrums of the AE signals in the crack-free and crack-propagation stages is shown in Figure 12. The time-domain signals show a significant increase in the amplitude of the AE signal from approximately 3 V to 10 V during the crack extension. In the absence of crack propagation, the impact signals are predominantly clustered in the low-frequency band around 35 kHz at the 80–100° and 260–280° stages. As the crack propagates rapidly, noticeable impact signals appear at 80–100° and 260–280°. A phase characterised by the coexistence of sudden impact signals and continuous AE signals of increasing amplitude appears at 310–360°. This segment is mainly concentrated in the 70–150 kHz frequency band, as shown in the red dashed box in Figure 12d. The occurrence of these signals corresponds to the phase angle associated with the rod load commutation and the subsequent change in the rod load.
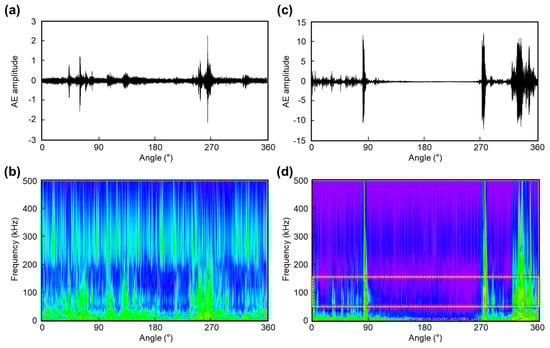
Figure 12.
Time-domain AE signals and time–frequency spectrum. Time-domain AE signal in the stage of no crack propagation (a); time–frequency spectrum of the AE signal in the stage of no crack propagation (b); time–domain AE signal in the stage of rapid crack propagation (c); time–frequency spectrum of the signal in the stage of rapid crack propagation (d).
During the operational cycle, the piston rod experiences cyclic tensile and compressive loads, which exert pressure on the crosshead pin towards one side of the small bearing of the connecting rod, creating a clearance on the opposite side to allow for the entry of lubricating oil and to achieve cooling, as shown in Figure 13a. The reversal of the piston rod load must be sustained for a particular period to ensure sufficient lubrication. In Figure 13b, impacts R1 and R2 occur when the piston rod load is at zero, leading to the switch of the contact position of the bearing and pin, generating an impact event. The stress cloud illustrates that, at impact R1, the bearing and pin contact position switches from the head end to the crank end, imposing an impact force on the piston rod in the compression direction. Conversely, at impact R2, the contact position changes from the crank end to the head end, resulting in an impact in the tensile direction on the piston rod, which serves as the primary trigger for the extension of cracks in the piston rod. The fatigue cracks gradually develop and propagate as the number of cycles increases, and there is a clear tendency for the amplitude of the AE signal to increase at the R2 impact position.
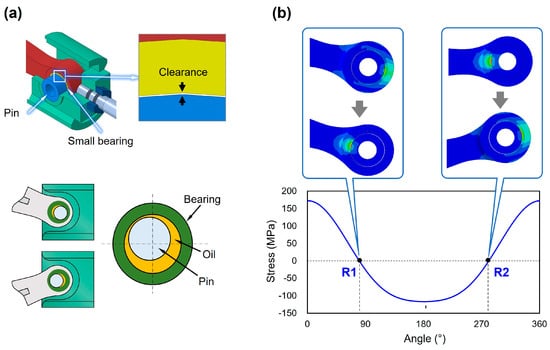
Figure 13.
The load reversal induced the commutation of the contact between the pin and bearing. Schematic diagram of the pin and bearing contact position reversal for lubrication (a); variation in the contact position with the rod load curve (b).
In addition, during the fatigue process, the material is subjected to stress changes through alternating cycles of loading and unloading. Even in regions where the point of maximum stress has not been reached, the material may encounter small stress concentrations induced by cyclic loading. These concentrations may be sufficient to initiate and propagate cracks before the point of maximum stress is reached. Consequently, events in the AE signal indicative of crack propagation appear in the high-frequency band when the piston rod is under stress and the piston has not yet reached the TDC (), as shown in Figure 12d.
In light of the previous analysis, the AE signals are subjected to bandpass filtering in the range of 70–150 kHz. Figure 14 shows the sub-band signals at various stages. In a single cycle of signals in Figure 14b,c, the manifestation of crack signals occurs primarily in the form of impact signals corresponding to the rod load commutation points R1 and R2, along with a series of consecutive, relatively low-amplitude impact signals, denoted as T. Conversely, in the absence of a crack signal, as shown in Figure 14a, the AE amplitude remains at only less than 0.15, which is more than ten times smaller than that observed in the presence of a crack signal. Consequently, the sub-band signals serve as effective representations of the crack propagation components. Following the aforementioned analysis, a value of 0.15 is employed as the threshold for the AE counting in the subsequent computation of the eigenvalues.
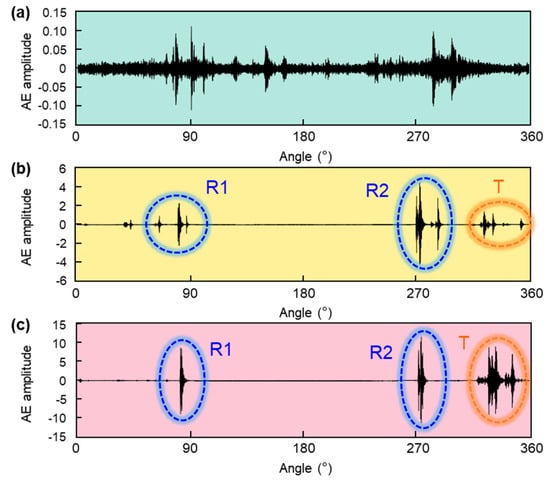
Figure 14.
Sub-band AE signals at different stages (70–150 kHz). No crack propagation (a). The early stage of crack propagation (b). The stage of approaching fracture (c).
4.3. Damage Identification
Piston rod fracture induces a high-frequency AE signal, primarily due to the rapid release of stored elastic energy within the material during fracture. The combination of the high fracture rate, low ductility, and rapid crack propagation contributes to steep strain gradients in the crack tip path, resulting in the generation of high-frequency stress waves. These events are associated with the formation of microcracks and the release of stored elastic energy in the form of high-frequency stress waves. The deformation or fracture of metals initiates various microstructural changes, including the formation [55] and propagation of dislocations [56], cracks [57,58], and other defects, which cause rapid fluctuations in the local stress field within the material. Consequently, this phenomenon leads to the propagation of stress waves throughout the material. The signal analysis results from the previous section suggest that, during the load reversal of the piston rod in a compressor, a significant crack signal is triggered when the piston rod experiences an impact along the tensile direction generated by the contact between the crosshead pin and the bearing during the reversal direction. Both this impact force and cyclic tensile loading can initiate crack propagation, which can be effectively detected by the AE signal.
Following the above analysis, the initial AE signal was subjected to filtering, with a focus on retaining signal band components between 70 and 150 kHz. For a single-cycle AE sub-band signal, distinct calculations are performed for AE counts, energy, peak-to-peak values, and waveform factors. Figure 15 depicts the changes in the various AE parameters concerning the number of fatigue loading cycles.
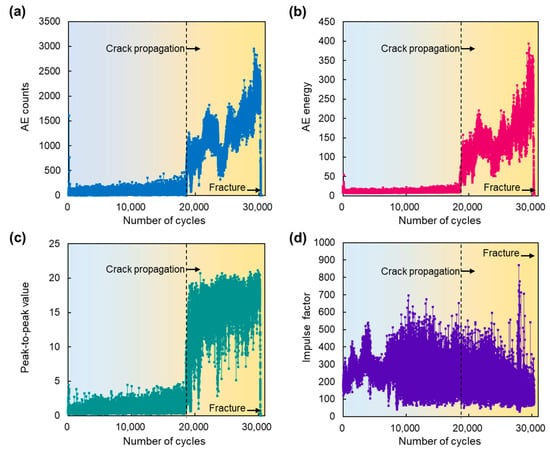
Figure 15.
The variation in the different AE parameters to the fatigue loading times. AE counts (a); AE energy (b); peak-to-peak value (c); impulse factor (d).
In Figure 15a,b, the AE counts and energy exhibit heightened sensitivity to the rapid crack propagation. A marginal increase in their fluctuation ranges is observed within the initial 20,000 cycles, indicating the initiation of a limited number of microcracks. The AE counts experience a doubling of the peak fluctuation from less than 150 to 300, while the peak AE energy rises from 15 to 25 during this early stage. As the crack enters the phase of rapid expansion (post–20,000 cycles), both the AE counts and energy values demonstrate a pronounced escalation, attributable to the emergence of numerous high-amplitude impact components associated with crack expansion. Before 25,000 cycles, fluctuations in their growth patterns suggest some discontinuity in the initial stages of crack extension. Beyond 25,000 cycles, with the formation of macroscopic cracks, the cross-sectional area supporting the load diminishes, intensifying the stress concentration and accelerating the crack extension. Consequently, the AE counts and energy exhibit sustained increases. Linear fitting estimates indicate that, during the rapid crack expansion phase after 20,000 cycles, the growth rate of the AE counts is approximately 20 times that before 20,000 cycles, and the growth rate of the AE energy is approximately 30 times, highlighting their increased sensitivity as indicators of crack expansion.
On the other hand, the peak-to-peak and waveform indices of the signals show increased sensitivity during the rapid propagation phase of the crack. As shown in Figure 15c, the amplitude of the AE signal increases significantly from less than 5 to the 15–20 range as crack propagation intensifies. The impulse index, a dimensionless parameter used to detect the presence of impact in the signal, shows an early response, revealing a burst-type signal due to crack formation around 10,000 cycles. In the later stages, the impulse index decreases slightly as the crack expansion component of the signal continues to increase due to tensile loading. However, as the fracture stage approaches, the rapid growth of the crack generates a significant number of impulse signals, resulting in a significant increase in the impulse index before 30,000 cycles, peaking at almost 900, as illustrated in Figure 15d.
A comparative analysis of the evolution of various time-domain parameters suggests that the AE counts and energies provide a more direct and intuitive means of identifying rapid crack extension. Simultaneously, the impulse factor demonstrates the ability to characterise the emergence of crack-extending impact-like AE signal components at an earlier stage. As shown in Figure 16, upon a sudden change in the characteristic parameters of the AE signals, the compressor was stopped, and an examination of the prefabricated fractured rods was conducted using the dye-penetrant testing method [59]. Surface cracks with an approximate length of 1.17 mm were detected. Therefore, the use of these four parameters allows for the accurate identification of rod crack existence during compressor operation, facilitating the early warning of rod failure. In this experiment with 316 rpm, the crack propagation warning can be provided approximately 30 min (around 10,000 cycles) before the fracture, providing sufficient operating time to shut down the compressor for maintenance.
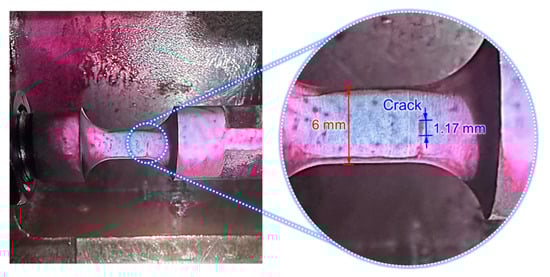
Figure 16.
Dye-penetrant testing of crack on the prefabricated fracture rod.
4.4. Prediction of the Fatigue Crack Growth Rate
To carry out a quantitative investigation of the AE parameters in the crack propagation process, this section begins with a finite element analysis of the prefabricated fracture rod, as shown in Figure 17a. The prefabricated fracture rod, consisting of Q235 material with a density of 7850 kg/m3, a Young’s modulus of 210 GPa, and a Poisson’s ratio of 0.28, is simulated. A solid support constraint is applied to one end of the rod, while the rod load calculated using Equation (1) is applied to the opposite side. The model is discretised using a tetrahedral mesh, with the mesh refined to 0.5 mm at the thin rod diameter and transition fillet, and to 2 mm in other regions. Several simulations with different mesh densities are performed to evaluate the mesh independence. Following the mesh-refinement rule, denser meshes are generated, demonstrating consistency and convergence in the simulation results. The average stress change in the centre section of the thin section of the prefabricated fracture rod in models with mesh sizes of 0.6 mm, 0.5 mm, and 0.4 mm at the transition fillet and thin rod diameter is less than 5%. The final model is constructed with 103,568 meshes using a mesh scheme of 103,568.
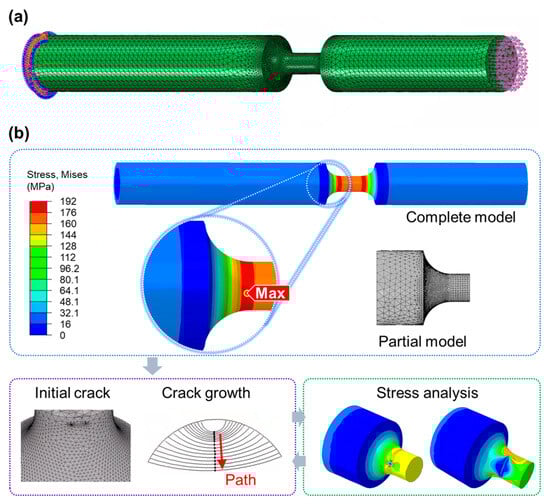
Figure 17.
Finite element analysis of the crack propagation of prefabricated fracture rods. Finite element model (a); crack propagation analysis process (b).
When the rod was loaded, the stress intensity factor at the crack tip was determined using the M-integral method. The crack propagation equation, represented by the Paris equation (Equation (12)), was used for the piston rod material, specifically the Q235 with the coefficients set at and set at 2.83. The fatigue threshold, denoted , was set at 6.35 and the fracture toughness was characterised by 110.7 [60].
where is the crack propagation rate, mm/cycle; is the stress intensity factor of the corresponding section, ; is the stress amplitude of the corresponding nominal section, MPa; is the crack length, mm; and are the material correlation constants, respectively.
Following the crack tip mesh-refinement and propagation calculations, the submodel mesh is updated and integrated into the full model for further iterations in subsequent finite element analyses. The calculation results use the midpoint of the crack tip length as the reference point for calculating the crack path length. The AE counts and energy data are extracted for 11,586 cycles during the period from thew mutation onset to the prefracture and correlated with the crack length data, as shown in Figure 18a,b. The observed correspondence between the crack propagation cycle and the actual fracture cycle period indicates that the simulation results can serve as a basis for the crack propagation rate analysis. Polynomial fitting of the variation curves for the AE counts and AE energy are performed to identify the trend of the parameter changes. Notably, the trends of the AE counts and AE energy show good agreement with the increment trend of the crack length, especially in approximately the first 8000 crack propagation cycles. To investigate the ability of the AE parameters to quantitatively describe the crack growth rate, the logarithmic relationship between the rate of change in the AE parameters and the crack growth rate is plotted in Figure 18c. It can be seen that the relationship between the rate of change in the AE energy and the crack growth rate shows a more favourable linear relationship with a smaller R2. The slightly inferior performance of the AE counts can be attributed to the strong influence of the chosen threshold value in the calculation of the AE counts. Therefore, the subsequent development of a prediction model is possible:
where is the crack growth rate, is the AE energy release rate, and and are the model parameters.
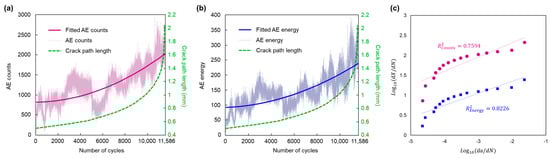
Figure 18.
The quantitative relationship between the AE parameters and crack propagation process. AE counts (a); AE energy (b); linear correlation between the fatigue crack growth rate and AE counts and AE energy (c).
The proposed model is significant, in that it estimates the crack propagation rate by analysing the AE energy generated during fatigue loading. This allows the crack propagation length to be estimated within the monitoring period, thus facilitating timely warnings and real-time assessments of the severity of piston rod fracture failures.
4.5. Maintenance Strategy Based on AE
Based on the above research and analysis, this study presents a piston rod maintenance strategy based on AE signals. From a qualitative perspective, the criteria for identifying significant damage in the piston rod include a notable increase in the counts, energy, peak-to-peak, and impulse factor of the AE data. This increase signals an escalation of the fatigue damage within the material, leading to the formation of an alarming hazardous condition. Quantitatively, the crack propagation rate model based on the AE energy proposed here facilitates the calculation of the remaining life in a state where initial cracks are known. However, in real-world engineering scenarios, there may be the randomness of monitoring moments and the potential absence of initial crack parameters. Consequently, quantitative calculations can determine the crack propagation within any given time interval, allowing comparison with the critical fracture size of the material to determine the need for immediate shutdown. In conclusion, the AE-based method outlined in this paper serves as a valuable approach to identifying crack damage and assessing the rate of growth of cracks in piston rods. It provides a practical strategy for both qualitative damage identification and the quantitative assessment of crack propagation, thereby serving as an effective tool for diagnosing compressor failures and facilitating predictive maintenance in UGS facilities.
5. Conclusions
With the aim of real-time monitoring and early detection to prevent catastrophic consequences of piston rod fracture, this work proposed an AE-based approach for crack propagation monitoring and the early warning of reciprocating compressor piston rod fractures, with the hope of contributing to ensuring the operational safety of core process gas equipment in UGS. Several conclusions can be drawn.
- (1)
- Accelerated life experiments have effectively reproduced the occurrence of piston rod fracture accidents and their subsequent effects. In one particular scenario, the fracture of the piston rod resulted in secondary effects, such as the impact, deformation, and further fractures at the fracture site. In addition, the inertia of the piston could cause it to collide with the cylinder wall, resulting in cylinder destruction and a significant leakage of compressed gas. The severity of these failures highlights the factors that contribute to the potential explosion in a natural gas compressor resulting from a fractured piston rod, and emphasizes the importance of real-time crack detection and monitoring.
- (2)
- The AE signal in the 70–150 kHz range is sensitive to the appearance and intensive development of crack propagation within an operating cycle. In the cyclic operation of a compressor, the appearance of transient impact-type AE crack signals is correlated, in the angular domain, with the moments of switching between piston rod load stretching and compression, and with the moments before the piston rod is subjected to the peak of the tensile load.
- (3)
- The AE count, energy, peak-to-peak, and impulse factor show a sensitive response to cracking when the crack enters a rapid propagation phase. Qualitatively, these parameters can be used as effective indicators for early crack identification and the warning of piston rod fracture failures during compressor operation. The crack propagation warning can be provided approximately 10,000 cycles before fracture, providing sufficient operating time to shut down the compressor for maintenance. In addition, it is expected that further research will enable the application of this methodology to other fracture-prone compressor components, such as valve plates, crosshead sliders, connecting rods, bolts, crankshafts, etc.
- (4)
- The linear relationship established between the rate of change in the AE energy and the crack growth rate was demonstrated, and a predictive model for the crack growth rate was established. This model proves beneficial for the early-warning and real-time assessment of the severity of piston rod cracking failures. Quantitatively, the calculation of the crack propagation length at specific time intervals allows comparison with the critical fracture size of the material, thus allowing the assessment of the urgency of immediate shutdown, serving as an effective tool for diagnosing compressor failures and supporting predictive maintenance in underground gas storage (UGS) facilities.
Author Contributions
Conceptualisation: X.L., X.P. and Y.G; methodology: X.L. and Z.C.; software: X.L.; validation: X.L. and S.W.; writing—original draft preparation, X.L.; writing—review and editing, Y.G. and X.P.; visualisation: X.L. and Z.C.; supervision: X.J.; project administration: Y.G. and X.J. All authors have read and agreed to the published version of the manuscript.
Funding
This work was supported by the China Petrochemical Corporation Project “Research on the core technology of the first and second compressors of a high-pressure polyethene plant” (nos. 30000000-22-ZC0607-0605 and 13300000-22-ZC0607-0030).
Institutional Review Board Statement
No relevant Institutional Review Board Statement and approval number.
Informed Consent Statement
This study did not involve human research.
Data Availability Statement
Data used to support the findings of this study may be available from the corresponding author upon request, subject to the relevant data protection laws. The data are not publicly available due to privacy.
Conflicts of Interest
The authors declare no conflicts of interest.
References
- Ban, S.; Liu, H.; Wei, X.; Shi, X.; Mao, H.; Song, Y.; Tan, H. The Application of the Fuzzy Comprehensive Evaluation Method in the Sealing Evaluation of Caprocks in Underground Gas Storage. Appl. Sci. 2023, 13, 9753. [Google Scholar] [CrossRef]
- Azin, R.; Izadpanahi, A. Gas Injection for Underground Gas Storage (UGS). In Fundamentals and Practical Aspects of Gas Injection. Petroleum Engineering; Azin, R., Izadpanahi, A., Eds.; Springer: Cham, Switzerland, 2021. [Google Scholar] [CrossRef]
- Kurz, R.; Brun, K. Upstream and midstream compression applications—Part 1: Applications. In Proceedings of the ASME Turbo Expo 2012: Turbine Technical Conference and Exposition, Copenhagen, Denmark, 11–15 June 2012. GT2012-68005:11-21. [Google Scholar] [CrossRef]
- Evans, D.J.; Chadwick, R.A. Underground gas storage: An introduction and UK perspective. Geol. Soc. London Spec. Publ. 2009, 313, 1–11. [Google Scholar] [CrossRef]
- U.S. EPA Office of Air Quality Planning and Standards. Oil and Natural Gas Sector Compressors 2014. Available online: https://www.ourenergypolicy.org/wp-content/uploads/2014/04/epa-compressors.pdf (accessed on 18 January 2024).
- White, B.; Kreuz, T.; Simons, S. Compression Machinery for Oil and Gas, Chapter 9—Midstream; Gulf Professional Publishing: Houston, TX, USA, 2019; pp. 387–400. [Google Scholar] [CrossRef]
- Milojević, S.; Marić, J.; Stopka, O.; Krstić, B.; Stojanović, B. Correlation between Emission and Combustion Characteristics with the Compression Ratio and Fuel Injection Timing in Tribologically Optimized Diesel Engine. Tech. Gaz. 2022, 29, 1210–1219. [Google Scholar] [CrossRef]
- Sun, X.; Wang, Y.; Zhang, J.; Lei, F.; Zhao, D.; Hong, H. Multi-Objective Optimization Design of Key Parameters of a Stepless Flow Control System with Multi-System Coupling Characteristics. Appl. Sci. 2022, 12, 1301. [Google Scholar] [CrossRef]
- Xiao, S.; Nie, A.; Zhang, Z.; Liu, S.; Song, M.; Zhang, H. Fault diagnosis of a reciprocating compressor air valve based on deep learning. Appl. Sci. 2022, 10, 6596. [Google Scholar] [CrossRef]
- Zhao, H.; Li, X.; Liu, Z.; Wen, H.; He, J. A Double Interpolation and Mutation Interval Reconstruction LMD and Its Application in Fault Diagnosis of Reciprocating Compressor. Appl. Sci. 2023, 13, 7543. [Google Scholar] [CrossRef]
- Mikic, D.; Desnica, E.; Asonja, A.; Stojanovic, B.; Epifanic, P.V. Reliability analysis of ball bearing on the crankshaft of piston compressors. J. Balk. Tribol. Assoc. 2016, 22, 5060–5070. [Google Scholar]
- Ma, B.; Gao, J.; Jiang, Z. Research on the piston rod fracture early warning technique of reciprocating compressor. J. Mech. Strength 2008, 30, 445–449. [Google Scholar]
- Chen, J.; Du, P.; Zhou, G. The fracture reasons’ statistic analysis of piston rods of Reciprocating Compressors. J. Qingdao Univ. Sci. Technol. (Nat. Sci. Ed.) 2022, 23, 56–58. [Google Scholar] [CrossRef]
- Wang, Y.; Xue, C.; Jia, X.; Peng, X. Fault diagnosis of reciprocating compressor valve with the method integrating acoustic emission signal and simulated valve motion. Mech. Syst. Signal Process. 2015, 22, 197–212. [Google Scholar] [CrossRef]
- Sharma, V.; Parey, A. Performance evaluation of decomposition methods to diagnose leakage in a reciprocating compressor under limited speed variation. Mech. Syst. Signal Process. 2019, 125, 275–287. [Google Scholar] [CrossRef]
- Fang, Z.; Wang, W.; Cao, Y.; Li, Q.; Lin, Y.; Li, T.; Wu, D. Reciprocating compressors intelligent fault diagnosis under multiple operating conditions based on adaptive variable scale morphological filter. Measurement 2024, 224, 113778. [Google Scholar] [CrossRef]
- Qin, Q.; Jiang, Z.N.; Feng, K.; He, W. A novel scheme for fault detection of reciprocating compressor valves based on basis pursuit, wave matching and support vector machine. Measurement 2012, 45, 897–908. [Google Scholar] [CrossRef]
- He, L.; Mak, H.; Rong, Y. Operations Management of Vehicle Sharing Systems. In Sharing Economy; Hu, M., Ed.; Springer Series in Supply Chain Management: Berlin/Heidelberg, Germany, 2019; Volume 6, pp. 309–327. [Google Scholar] [CrossRef]
- Pichler, K.; Lughofer, E.; Pichler, M.; Buchegge, T.; Klement, E.P.; Huschenbett, M. Fault detection in reciprocating compressor valves under varying load conditions. Mech. Syst. Signal Process. 2016, 70–71, 104–119. [Google Scholar] [CrossRef]
- Li, X.; Peng, X.; Zhang, Z.; Jia, X.; Wang, Z. A new method for nondestructive fault diagnosis of reciprocating compressor by means of strain-based p–V diagram. Mech. Syst. Signal Process. 2019, 133, 106268. [Google Scholar] [CrossRef]
- Qiao, Z.; Lei, Y.; Li, N. Applications of stochastic resonance to machinery fault detection: A review and tutorial. Mech. Syst. Signal Process. 2019, 122, 502–536. [Google Scholar] [CrossRef]
- Zhao, N.; Zhang, J.; Mao, Z.; Jiang, Z. Variational time–frequency adaptive decomposition of machine multi-impact vibration signals. Mech. Syst. Signal Process. 2023, 189, 110084. [Google Scholar] [CrossRef]
- Tang, Y.; Feng, L. Fault Feature Extraction of Reciprocating Compressor Based on Adaptive Waveform Decomposition and Lempel-Ziv Complexity. IEEE Access. 2019, 7, 82522–82531. [Google Scholar] [CrossRef]
- Li, X.; Jiang, Z.; Tong, Y.; Liu, S.; Zhang, J. Research on fault diagnosis method of the piston rod fracture based on the piston rod displacement signal of reciprocating compressor. Fluid Mach. 2017, 45, 45–48. [Google Scholar]
- Li, X.; Guo, Y.; Xiong, W.; Jia, X.; Peng, X. Fracture mechanism and fault evolution of piston rod in hydrogen reciprocating compressor. Int. J. Hydrogen Energy 2024, 50, 942–958. [Google Scholar] [CrossRef]
- Li, X.; Diao, A.; Guo, Y.; Jia, X.; Zhang, C.; Peng, X. Quantitative diagnosis of loose piston rod threads in reciprocating compressors for hydrogen storage and transport. Int. J. Hydrogen Energy 2023, 49, 37013–370030. [Google Scholar] [CrossRef]
- Mitrofanov, A.V.; Baryshov, S.N. Analysis of Failure of Gas Compressor Piston Rod. Chem Pet. Eng 2014, 49, 594–599. [Google Scholar] [CrossRef]
- Lee, S.; Yang, J. Analysis and troubleshooting of a piston rod failure of RC. In Proceedings of the 48th Turbomachinery & 35th Pump Symposia 2019, Houston, TX, USA, 10–12 September 2019; Available online: https://documents.pub/document/analysis-and-troubleshooting-of-a-piston-rod-failure-of-rc.html?page=1 (accessed on 18 January 2024).
- Liu, X.; Luo, Y.; Wang, Z. Fatigue analysis of the piston rod in a Kaplan turbine based on crack propagation under unsteady hydraulic loads. IOP Conf. Ser. Earth Environ. Sci. 2014, 22, 012017. [Google Scholar] [CrossRef]
- Luo, Y.; Wang, Z.; Zeng, J.; Lin, J. Fatigue of piston rod caused by unsteady, unbalanced, unsynchronized blade torques in a Kaplan turbine. Eng. Fail. Anal. 2010, 17, 192–199. [Google Scholar] [CrossRef]
- Knez, M.; Glodež, S.; Kramberger, J. Fatigue assessment of piston rod threaded end. Eng. Fail. Anal. 2009, 16, 1977–1982. [Google Scholar] [CrossRef]
- Karimian, S.F.; Modarres, M.; Bruck, H.A. A new method for detecting fatigue crack initiation in aluminum alloy using acoustic emission waveform information entropy. Eng. Fract. Mech. 2020, 223, 106771. [Google Scholar] [CrossRef]
- Bannantine, J.A.; Comer, J.J.; Handrock, J.L. Fundamentals of Metal Fatigue Analysis; Prentice Hall: Englewood Cliffs, NJ, USA, 1990. [Google Scholar]
- Kahirdeh, A.; Khonsari, M.M. Energy dissipation in the course of the fatigue degradation: Mathematical derivation and experimental quantification. Int. J. Solids Struct. 2015, 77, 74–85. [Google Scholar] [CrossRef]
- Garrett, J.C.; Mei, H.; Giurgiutiu, V. An Artificial Intelligence Approach to Fatigue Crack Length Estimation from Acoustic Emission Waves in Thin Metallic Plates. Appl. Sci. 2022, 12, 1372. [Google Scholar] [CrossRef]
- Ohno, K.; Ohtsu, M. Crack classification in concrete based on acoustic emission. Constr Build Mater. 2010, 24, 2339–2346. [Google Scholar] [CrossRef]
- Roundi, W.; Mahi, A.E.; Gharad, A.E.; Rebiere, J.L. Acoustic emission monitoring of damage progression in Glass/Epoxy composites during static and fatigue tensile tests. Appl. Acoust. 2018, 132, 124–134. [Google Scholar] [CrossRef]
- Casiez, N.; Deschanel, S.; Monnier, T.; Lame, O. Acoustic emission from the initiation of plastic deformation of Polyethylenes during tensile tests. Polymer 2014, 55, 6561–6568. [Google Scholar] [CrossRef]
- Nair, A.; Cai, C.S. Acoustic emission monitoring of bridges: Review and case studies. Eng. Struct 2010, 32, 704–1714. [Google Scholar] [CrossRef]
- Chou, H.; Mouritz, A.P.; Bannister, M.K.; Bunsell, A.R. Acoustic emission analysis of composite pressure vessels under constant and cyclic pressure. Compos. Part A Appl. Sci. Manuf. 2015, 70, 111–120. [Google Scholar] [CrossRef]
- Thungsuk, N.; Mungkung, N.; Songruk, A.; Tunlasakun, K.; Tikakosol, K.; Nilawat, S.; Boonsomchuae, K.; Yuji, T.; Arunrungrusmi, S.; Kinoshita, H. The Investigation of Detect Position of Partial Discharge in Cast-Resin Transformer Using High-Frequency Current Transformer Sensor and Acoustic Emission Sensor. Appl. Sci. 2022, 12, 1310. [Google Scholar] [CrossRef]
- Geng, R.; Jing, P. Acoustic Emission: An indispensable structural health monitoring means for aircraft. Adv. Acoust. Emiss. Technology. Springer Proc. Phys. 2014, 158, 503–512. [Google Scholar] [CrossRef]
- Carboni, M.; Crivelli, D. An acoustic emission based structural health monitoring approach to damage development in solid railway axles. Int. J. Fatigue 2020, 139, 105753. [Google Scholar] [CrossRef]
- Ali, S.M.; Hui, K.H.; Hee, L.M.; Leong, S. Automated valve fault detection based on acoustic emission parameters and support vector machine. Alex. Eng. J. 2018, 57, 491–498. [Google Scholar] [CrossRef]
- Vanniamparambil, P.A.; Guclu, U.; Kontsos, A. Identification of crack initiation in aluminum alloys using acoustic emission. Exp. Mech. 2015, 55, 837–850. [Google Scholar] [CrossRef]
- Chai, M.; Hou, X.; Zhang, Z.; Duan, Q. Identification and prediction of fatigue crack growth under different stress ratios using acoustic emission data. Int. J. Fatigue 2022, 160, 106860. [Google Scholar] [CrossRef]
- Basquin, O.H. The exponential law of endurance tests. Am. Soc. Test. Mater. 1910, 10, 625. [Google Scholar]
- Fan, J.; Guo, X.; Wu, C.; Deng, D. Fast Evaluation of Fatigue Behavior of Q235 Steel by Infrared Thermography and Energy Approach. J. Mater. Eng. 2012, 2, 71–76. [Google Scholar]
- Boyce, M.P. Gas Turbine Engineering Handbook, 4th ed.; Elsevier: Amsterdam, The Netherlands, 2012; pp. 493–514. [Google Scholar] [CrossRef]
- Han, Z.; Luo, H.; Sun, C.; Li, J.; Papaelias, M.; Davis, C. Acoustic emission study of fatigue crack propagation in extruded AZ31 magnesium alloy. Mater. Sci. Eng. A 2014, 597, 270–278. [Google Scholar] [CrossRef]
- Li, D.; Kuang, K.; Koh, C. Fatigue crack sizing in rail steel using crack closure-induced acoustic emission waves. Meas. Sci. Technol. 2017, 28, 065601. [Google Scholar] [CrossRef]
- Li, L.; Zhang, Z.; Shen, G. Influence of grain size on fatigue crack propagation and acoustic emission features in commercial-purity zirconium. Mater. Sci. Eng. A 2020, 636, 35–42. [Google Scholar] [CrossRef]
- Rioul, O.; Vetterli, M. Wavelets and signal processing. IEEE Signal Process. Mag. 1991, 8, 14–38. [Google Scholar] [CrossRef]
- Nuttall, A.H.; Bedrosian, E. On the quadrature approximation on the Hilbert transform of modulated signals. Proc. IEEE 1966, 54, 1458–1459. [Google Scholar] [CrossRef]
- Wang, Q.; Chu, F. Experimental determination of the rubbing location by means of acoustic emission and wavelet transform. J. Sound Vib. 2001, 248, 91–103. [Google Scholar] [CrossRef]
- Sause, M.G.R.; Gribov, A.; Unwin, A.R.; Horn, S. Pattern recognition approach to identify natural clusters of acoustic emission signals. Pattern Recognit. Lett. 2012, 33, 17–23. [Google Scholar] [CrossRef]
- McBride, S.L.; MacLachlan, J.W.; Paradis, B.P. Acoustic emission and inclusion fracture in 7075 aluminum alloys. J. Nondestruct. Eval. 1981, 2, 35–41. [Google Scholar] [CrossRef]
- Joseph, R.; Bhuiyan, M.Y.; Giurgiutiu, V. Acoustic emission from vibration of cracked sheet-metal sample. Eng. Fract. Mech 2019, 217, 106544. [Google Scholar] [CrossRef]
- Casali, D.R.; Heath, G.; Nad, S. Using Fundamental Concepts to Determine How to Monitor Dye Penetrant Use. J. Fail. Anal. Prev. 2019, 19, 45–52. [Google Scholar] [CrossRef]
- Qin, D.; Xie, L. Modern Machinery Design Manual, 2nd ed.; Chemical Industry Press: Beijing, China, 2019; Volume 6, ISBN 978-7-122-33384-1. [Google Scholar]
Disclaimer/Publisher’s Note: The statements, opinions and data contained in all publications are solely those of the individual author(s) and contributor(s) and not of MDPI and/or the editor(s). MDPI and/or the editor(s) disclaim responsibility for any injury to people or property resulting from any ideas, methods, instructions or products referred to in the content. |
© 2024 by the authors. Licensee MDPI, Basel, Switzerland. This article is an open access article distributed under the terms and conditions of the Creative Commons Attribution (CC BY) license (https://creativecommons.org/licenses/by/4.0/).