Article

Machine Learning for Predicting Neurodevelopmental Disorders in Children

1
Department of Speech and Language Therapy, School of Health Sciences, University of Ioannina, Panepistimioupoli B’, 45500 Ioannina, Greece
2
Laboratory of New Technologies and Distance Learning, Department of Early Childhood Education, School of Education, University of Ioannina, Panepistimioupoli, 45110 Ioannina, Greece
3
Department of Informatics and Telecommunications, University of Ioannina, 47150 Kostaki Artas, Greece
4
Department of Economics, University of Foggia, 1 Romolo Caggese Street, 71121 Foggia, FG, Italy
*
Author to whom correspondence should be addressed.
Appl. Sci. 2024, 14(2), 837; https://doi.org/10.3390/app14020837
Submission received: 26 December 2023 / Revised: 15 January 2024 / Accepted: 16 January 2024 / Published: 18 January 2024

Abstract

:

Featured Application

This study is an extension of the “Smart Computing Models, Sensors, and Early Diagnostic Speech and Language Deficits Indicators in Child Communication” project, abbreviated “SmartSpeech”. The primary goal of SmartSpeech is to assist clinicians in identifying neurodevelopmental disorders in children. To that end, a serious game has been designed to evaluate the child’s developmental profile. The current study aims to explore the enhancement of the SmartSpeech machine learning model efficacy capturing underlying patterns in the data. This study holds great potential for advancing our understanding of children’s neurodevelopmental disorders and further upgrading the accuracy of digital diagnostic tools.

Abstract

Developmental domains like physical, verbal, cognitive, and social-emotional skills are crucial for monitoring a child’s growth. However, identifying neurodevelopmental deficiencies can be challenging due to the high level of variability and overlap. Early detection is essential, and digital procedures can assist in the process. This study leverages the current advances in artificial intelligence to address the prediction of neurodevelopmental disorders through a comprehensive machine learning approach. A novel and recently developed serious game dataset, collecting various data on children’s speech and linguistic responses, was used. The initial dataset comprised 520 instances, reduced to 473 participants after rigorous data preprocessing. Cluster analysis revealed distinct patterns and structures in the data, while reliability analysis ensured measurement consistency. A robust prediction model was developed using logistic regression. Applied to a subset of 184 participants with an average age of 7 years, the model demonstrated high accuracy, precision, recall, and F1-score, effectively distinguishing between instances with and without neurodevelopmental disorders. In conclusion, this research highlights the effectiveness of the machine learning approach in diagnosing neurodevelopmental disorders based on cognitive features, and offers new opportunities for decision making, classification, and clinical assessment, paving the way for early and personalized interventions for at-risk individuals.

1. Introduction

Neurodevelopmental disorders (NDs) refer to a range of conditions that impact the development and functioning of the brain, leading to difficulties in communication, learning, social interaction, behavior, cognition, and emotional functioning [1,2]. NDs are defined by persistent difficulties in acquiring, understanding, and/or using spoken or written language, leading to an inability to express oneself, engage in meaningful conversations, and fully participate in social and professional interactions and effective communication [2,3,4,5,6,7,8,9,10]. NDs affect more than 10% of people globally, triggering long-term consequences and a significant economic burden [11]. NDs include the following [1,12,13]:
  • Autism spectrum disorders (ASD), which are characterized by behavior and communication difficulties;
  • Attention deficit hyperactivity disorder (ADHD), which is characterized by inattention, impulsivity, and hyperactivity;
  • Intellectual disability (ID), indicated by cognitive impairments;
  • Specific learning disorder (SLD), characterized by a deficiency in communication;
  • Communication disorders (CDs), illustrated by persistent difficulties in language acquisition and usage.
The field of neurodevelopmental disorders and their identification has become increasingly complex and challenging [14]. Identifying neurodevelopmental disorders poses significant challenges due to the complexity and variability of their symptoms and presentations [15,16,17]. While medical advancements have helped, inaccurate diagnosis and comorbidities make it hard to establish precise diagnostic boundaries [18]. Particularly, more than one-third of individuals with ASD exhibit symptoms that match criteria for various disorders, resulting in numerous possible diagnostic combinations. Further, traditional diagnostic methods often rely on subjective observations and lengthy assessments, leading to delayed or inaccurate diagnoses [3,19,20,21]. Early detection is crucial as the developing brain is adaptable, allowing for the creation of compensation mechanisms. Rapid medical intervention can contribute to the reduction or mitigation of symptoms, ultimately enhancing the individual’s overall quality of life [18].
With advancements in technology, specifically in the domain of machine learning (ML), researchers are exploring innovative ways to enhance the accuracy and efficiency of diagnosing the risk of NDs. The potential of ML algorithms to analyze large amounts of complex data is enormous [18]. These algorithms can identify patterns and connections within the data that may be difficult for humans to comprehend, laying the groundwork for more accurate and efficient diagnostic tools to assist clinicians’ early detection and supporting children with NDs in a critical period where early intervention can significantly impact long-term outcomes [18,22,23,24].
Numerous studies have been conducted on various types of NDs, using a wide range of ML techniques for diverse sorts of data for diagnostic and prediction processes, employing efficient and sophisticated standards to attain accuracy and cost-effectiveness [6,15,25,26]. These ML techniques mainly employ supervised (like regression, support vector machines (SVMs), decision trees, artificial neural networks (ANNs), and Bayesian logic), and unsupervised learning methods (like clustering, association rules, and dimensionality reduction) [27]. Semi-supervised learning and reinforcement learning techniques are used less frequently [27].
The current literature reports ML classifiers used to diagnose ASD, developmental language disorder (DLD), and global developmental delay (GDD) in preschoolers [24]. To be precise, different models were utilized, including neural networks, decision trees, support vector machines, XGBoost (eXtreme Gradient Boosting), and logistic regression, while accuracy was evaluated by twelve doctors. The study reported the potential for improving our understanding of these disorders’ diagnosis based on behavioral and developmental features. In a different study, reduced motor synergies can lead to motor control issues in individuals with ASD, and an early detection of motor impairments has been suggested that can effectively differentiate between ASD and typically developed (TD) individuals using a SVM with a radial basis function (RBF) [28]. In another research study, a face recognition framework to detect early signs of ASD analyzed facial traits and eye contact using k-means clustering; unsupervised learning has been suggested to assist medical professionals accurate clinical decisions [29]. Also using the k-means algorithm, Vargason et al., studied ASD and found three distinct categories of children with ASD [30]. They also found that developmental delay, gastrointestinal issues, and immunological imbalances are common comorbidities associated with ASD. These findings can help identify comorbidities and subgroups within the ASD population. Moreover, ML-based evaluation was proposed to detect heart rate variability in children with ASD dealing with bradycardia (low heart rates) [31]. Most cardiovascular conditions in children with ASD are congenital. Other researchers used eye-tracking data in ML to screen for ASD [32], and their neural network model outperformed traditional methods, indicating that eye-tracking data could help doctors to quickly and accurately identify autism.
Early indicators of ADHD and ASD have been reported with ML and deep learning (DL) approaches, utilizing convolutional neural networks (CNNs) and deep learning APIs [15]. DL techniques and CNNs have utilized personalized spatial-frequency anomalies in EEG power spectrum density to identify ADHD in children [33]. Also, a CNN have been used to distinguish ADHD from healthy controls by using stacked multi-channel EEG time-frequency decompositions [34]. ML prediction with EEG signals’ morphological and feature extraction techniques were analyzed employing the Bernoulli naive Bayes classifier, and outperformed others in the distinction of ADHD [35].
Researchers have developed a new method to categorize adolescents with intellectual impairments, involving the extraction of speech features from linear predictive coding (LPC)-based cepstral parameters and mel-frequency cepstral coefficients (MFCC) [36]. The utilized classification models were k-nearest neighbor (k-NN), support vector machine (SVM), linear discriminant analysis (LDA), and radial basis function neural network (RBFNN), with findings suggesting that the proposed methodology can help speech pathologists in estimating intellectual disabilities at an early age. Further, ML on resting-state electroencephalography recordings attempted to distinguish healthy individuals from those with intellectual and developmental disorders [37]. Their approach achieved a balanced accuracy of 91.67% and identified a lower beta activity in the 19.5–21 Hz range as the most distinguishing characteristic for individuals with these disorders. Furthermore, ML and regression models were compared for early ASD and ID diagnosis [38]. Using logistic regression, SVM, and ensemble learning techniques, 241 children with ASD were diagnosed. Of these children, 40.66% had both ASD and ID, and the researchers’ findings suggested that ML models based on socio-demographic and behavioral observation data, like SVM, may better identify autistic children with ID than regression models. More studies reveal the ML efficiency in SLD [10,21,39,40], and CD [41]. A common observation in real-world scenarios is that multiple disorders can be further explored in research, examining their co-occurrence within a person [6,15,19,25,42,43].
Consequently, there is a growing need for automated diagnostic tools to help experts accurately and efficiently identify NDs in children. SmartSpeech (Ioannina, Greece) is an innovative system that uses a serious game and a machine learning model to assess a child’s developmental profile [19,43]. The aim of this study is to improve the model’s ability to capture complex patterns in the game dataset that are difficult for humans to comprehend, enhancing its accuracy. This study can contribute to advance our understanding of NDs, aid clinicians in early detection, support children with NDs during a crucial period, and improve digital diagnostic tools. This study employs a complete machine learning strategy with logistic regression, using Thurstone’s factor score estimation on the SmartSpeech game dataset to make predictions about NDs.

2. Materials and Methods

This study is an extension of the ongoing project SmartSpeech, with the full title “Smart Computing Models, Sensors, and Early diagnostic speech and language deficiencies indicators in Child Communication”, funded by the Region of Epirus and supported by the European Regional Development Fund (ERDF). Participants were recruited through public and private health and education establishments, with most of them being young children. Prior to the start of the study, parents were informed of the project’s scope and protocols, provided with written consent forms, and shared information about their child’s developmental and communication skills. They were also informed that the study had been approved by the University of Ioannina Research Ethics Committee, in compliance with the General Data Protection Regulation (GDPR).
During the project’s data collection, the children played a serious game (SG) that was part of the SmartSpeech system. The SG activities were designed to collect data on the children’s developmental skills and biometric measurements to examine potential biomarkers for classification purposes. The game dataset included variables that were child responses quantified from two sources: hand movements on the touch screen (such as solving puzzles, manipulating items on the touchscreen, or identifying images and forms) and verbal responses to questions or executing commands (such as recalling names/events, recognizing emotions, or answering with vocal replies). It is important to note that this study only focuses on the dataset gathered from the SG activities, excluding biometric measurements [19,43]. The children participated in a range of activities that were presented in an engaging and visually appealing manner.
To recognize the children’s verbal responses, we used the CMUSphinx voice-to-text program (Pittsburgh, PA, USA) [44]. This program is accessible, open-source, and compatible with both desktop and mobile platforms. Additionally, we designed and trained a Greek language model using this program [45].

2.1. Data Measurements

Most prediction models classify the data points they use into four categories: (i) true positive (TP): the individual being referred to does indeed have NDs, and our prediction correctly identified that the person has NDs; (ii) true negative (TN): the individual does not have NDs, and our prediction correctly identified that the individual does not have NDs; (iii) false positive (FP): despite the absence of actual NDs in the individual, our prediction erroneously indicated the presence of NDs (this type of problem is called a Type 1 error); and (iv) false negative (FN): despite the presence of NDs in the subject, our prediction erroneously indicated that the individual does not have NDs (this type of problem is called a Type 2 error).
For the classification of the datasets, the reported accuracy is the average classification accuracy as measured in the test set. Accuracy is a metric that quantifies the likelihood of the classifier correctly predicting the number of outcomes. To put it simply, it represents the ratio of accurate predictions to the overall number of guesses. Accuracy is expressed in Equation (1):
A c c u r a c y = T P + T N T P + T N + F P + F N
Next, the precision metric measures how accurate our positive predictions were, i.e., what percentage of forecasted positive points actually happened. Precision is defined in Equation (2).
P r e c i s i o n = T P T P + F P
Next, the recall metric measures the ratio of correctly identified positive events by our model. Put simply, it evaluates the accuracy of our model in effectively classifying positive cases among all cases designated as positive. Recall and sensitivity are equivalent. Equation (3) defines recall.
R e c a l l = T P T P + F Ν
Finally, the F1 score is a performance metric that assesses the efficacy of a model in terms of both precision and recall. It ranges from 0 to 1, with a higher value indicating better performance. It is particularly useful in situations where maintaining a balance between false positives and false negatives is critical, such as in medical diagnosis or fraud detection. Equation (4) defines the F1 score:
F 1 = 2 × P r e c i s i o n × R e c a l l P r e c i s i o n + R e c a l l

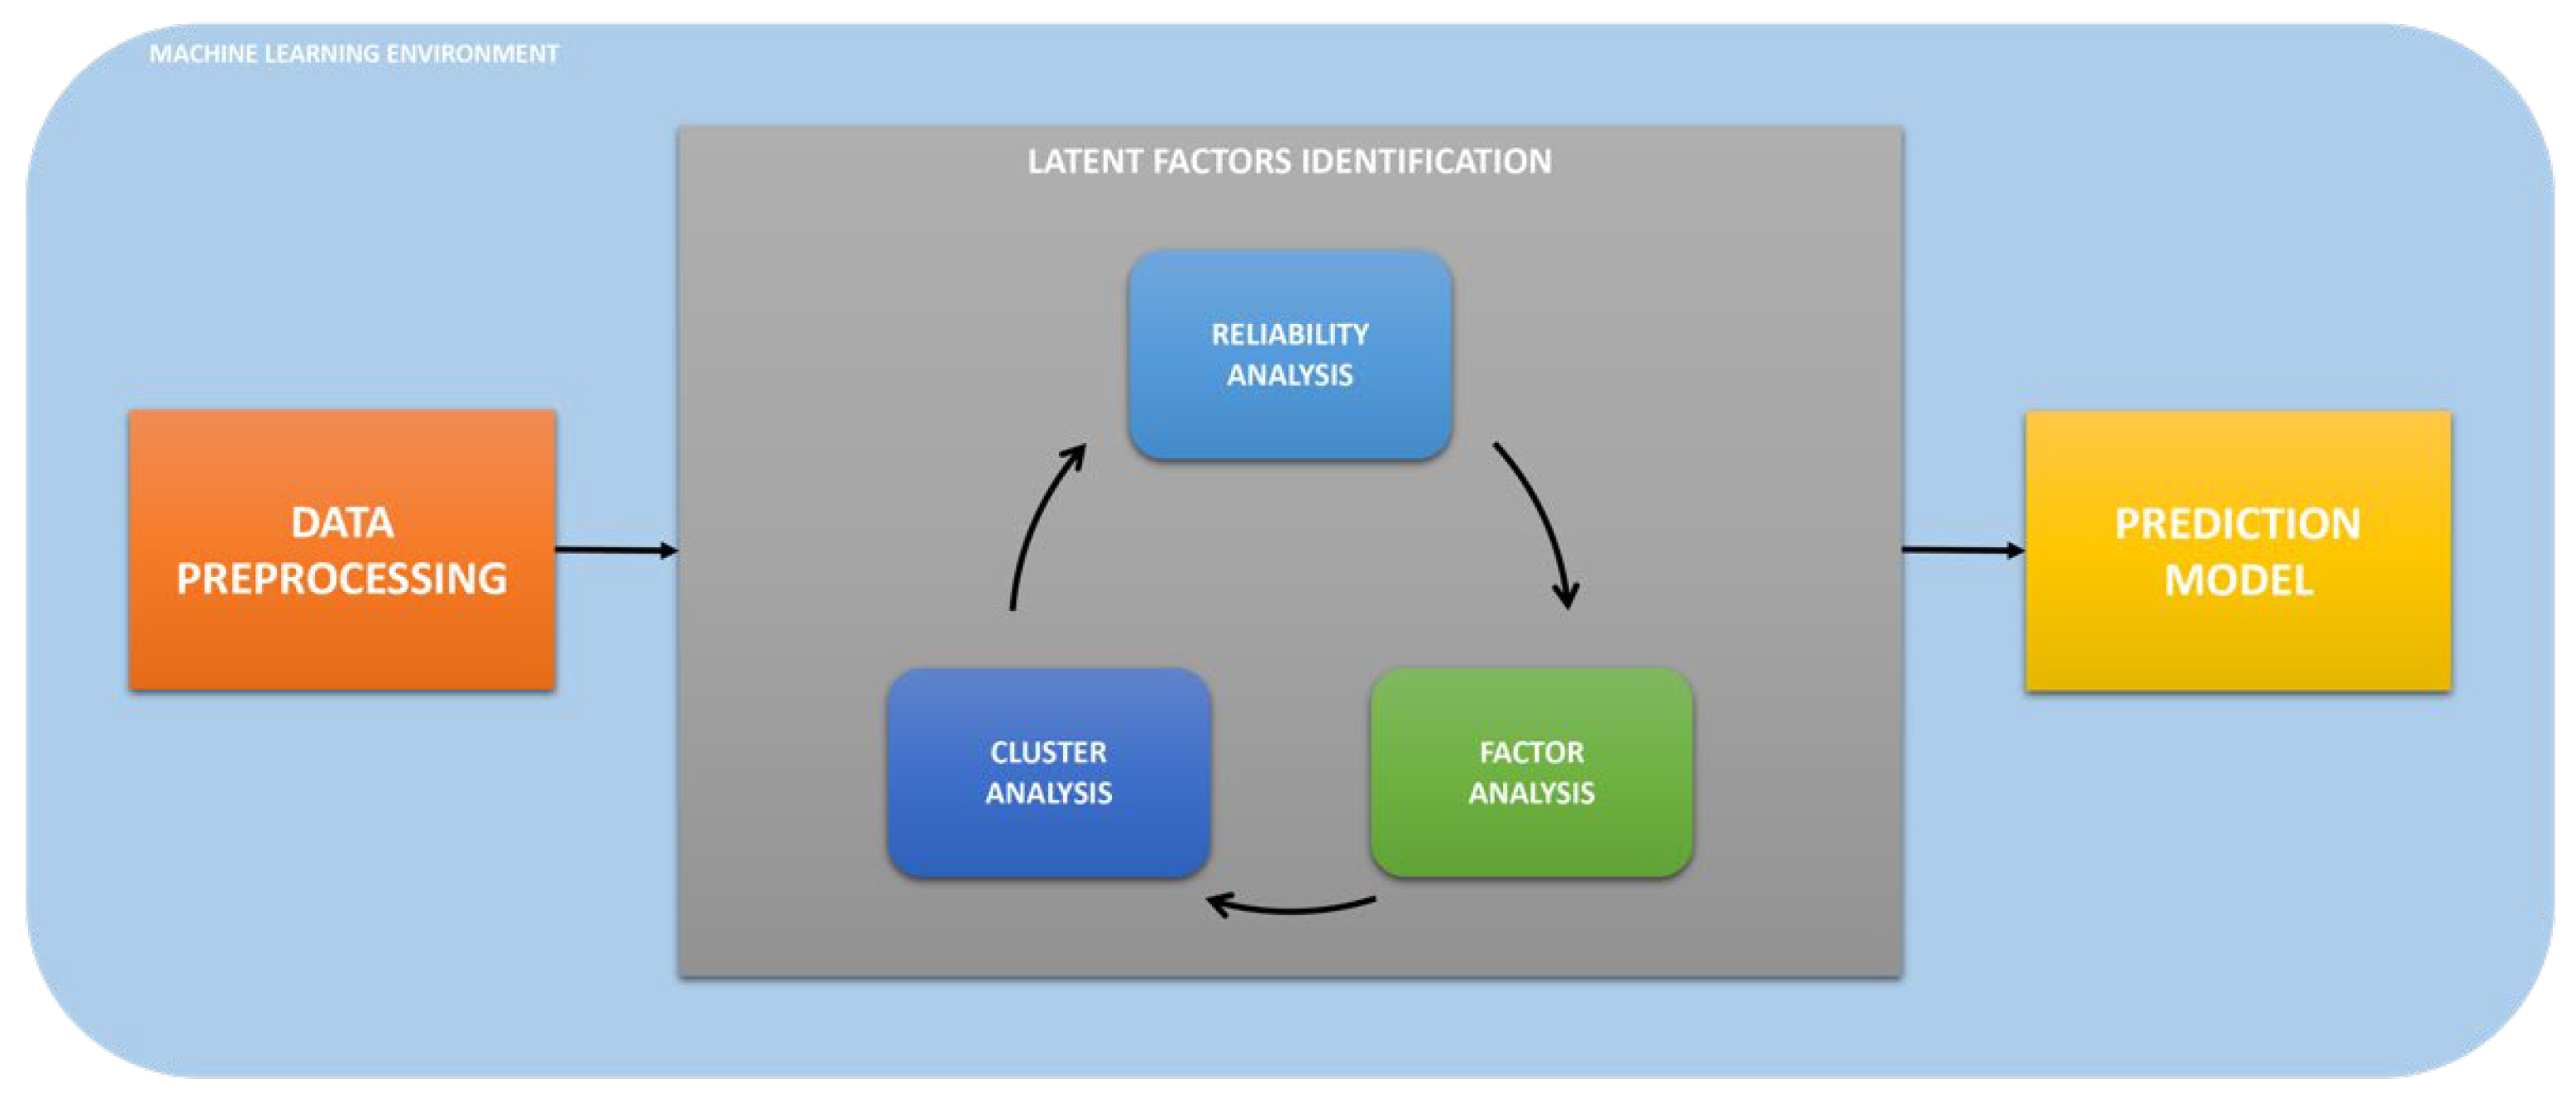
2.2. Analysis Workflow

Our analysis workflow has been divided into the following fundamental phases to achieve accurate and meaningful results.
In the first phase, we paid particular attention to data preprocessing, a crucial step to ensuring data quality and cleanliness. During this phase, we handled any missing values, removed outlier data, and standardized variables to make the data consistent and homogeneous.
Next, we performed a cluster analysis in the second phase to group similar variables into homogeneous clusters. This procedure allowed us to identify patterns and structures within the data, revealing any groupings of participants with similar characteristics.
In the third phase, we conducted a reliability analysis to assess the consistency and reliability of our variables’ measurements. This analysis allowed us to verify the stability of the measures over time and ensure the validity of the obtained results.
Subsequently, in the fourth phase, we engaged in a factor analysis on the initial 13 variables, which led to the identification of five latent factors. These factors precisely aligned with the clusters identified in the cluster analysis, providing deeper insights into the underlying dimensions of our data.
After completing the factor analysis, we moved on to the fifth and final phase of our workflow, where we developed a predictive mdel based on machine learning techniques. Using the logistic regression model, we predicted the presence of an ND based on the latent factors identified in the cluster analysis. This prediction model allowed us to obtain accurate and clinically relevant results, providing valuable insights for early diagnosis and treatment of NDs. The methodological workflow is illustrated in Figure 1.
Through this comprehensive and in-depth analysis workflow, our study aims to provide a deeper understanding of NDs and develop a precise and reliable predictive model for their identification. The results obtained could significantly contribute to clinical practice and neurological research, enabling the early detection of at-risk subjects and providing targeted and personalized support for their well-being and development.

2.3. Application Context

In this study, we utilize a novel and recently developed serious game dataset that collects various data on children’s speech and linguistic responses [19].
The initial dataset consisted of 520 instances, which, after undergoing the first phase of preprocessing, was reduced to 473 participants. Analyses were performed on this sample to obtain reliable data for a more robust model. Finally, predictive analyses were conducted on a subset of 184 participants with an average age of 7 years.
The analyses were conducted using Orange Data Mining v3.36 on an Apple M1 Pro system with 16 GB RAM and 1 TB storage, operating on macOS Sonoma 14.2.1. This setup, coupled with the application of advanced machine learning techniques, ensured the efficiency and reproducibility of our analyses. The significance of such machine learning methodologies in extracting meaningful insights and predictive models from complex data sets has been previously underscored and validated in similar studies within the field of public health performance assessment [46].

2.4. Data Preprocessing

In phase number 1 of the preprocessing in the machine learning environment, we performed the following operations:
  • We addressed the issue of missing data, which constituted 2.1% of the initial dataset comprising 520 instances, by employing the “impute” widget of the Orange data mining software. Specifically, we utilized a model-based imputer (simple tree) approach. This method constructs a decision tree for each attribute with missing values, using the remaining attributes to predict and impute the missing data. This technique is particularly noted for its ability to maintain the intrinsic structure of the data and provide a statistically sound solution for handling incomplete observations in datasets.
  • We selected the 13 features under study using the “select column” widget.
  • We standardized the selected variables using the “continue” widget, with mean = 0 and SD = 1.
  • We considered only inliers using the “outliers” widget.
The descriptive statistics of the resulting dataset are shown in Table 1.

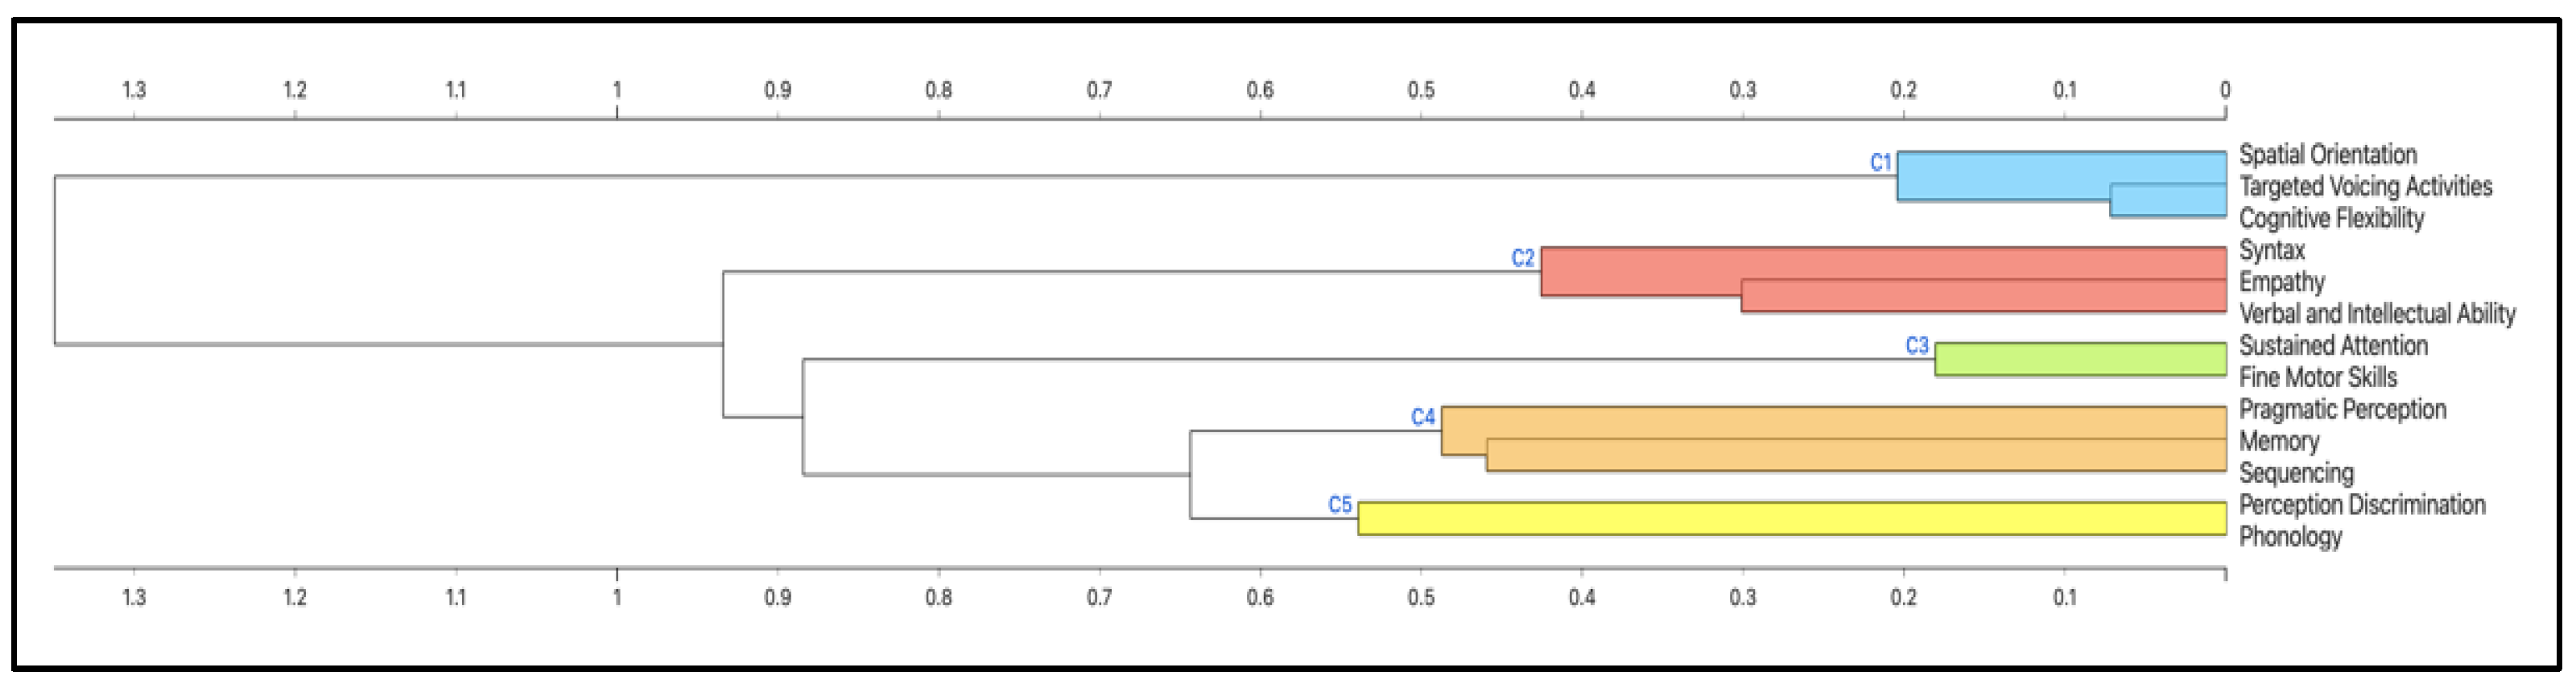
2.5. Cluster Analysis

A hierarchical clustering analysis was conducted using the Spearman distance metric and Ward linkage. This helped to identify and differentiate various attributes within five distinct groups, which are illustrated in the dendrogram of Figure 2. Because the 13 variables being looked at were not spread out in a normal way, it was important to use the Spearman correlation distance metric and Ward linkage. The Spearman correlation metric calculates the linear correlation between the ranks of variable values, and then remaps them as a distance within the interval of 0 to 1. This metric focuses on the rankings of variables rather than their actual values. Ward linkage, on the other hand, is a technique that determines the distance between clusters in a hierarchical clustering process. It follows a “bottom-up” approach where each observation begins in its own cluster, and clusters are merged as one works up the hierarchy. The goal is to minimize the variation within the joined clusters. These methods were used to figure out the distances between variables in our dataset using the Orange Visual Programming tool. This made it easier to group variables based on how similar they were in rank, and it revealed five clear clusters (see Figure 2): C1. Verbal Development and Spatial Reasoning, C2. Language Proficiency and Psychoemotional Development, C3. Cognition and Attention Development, C4. Pragmatical Competence, and C5. Auditory Processing and Phonological Ability.

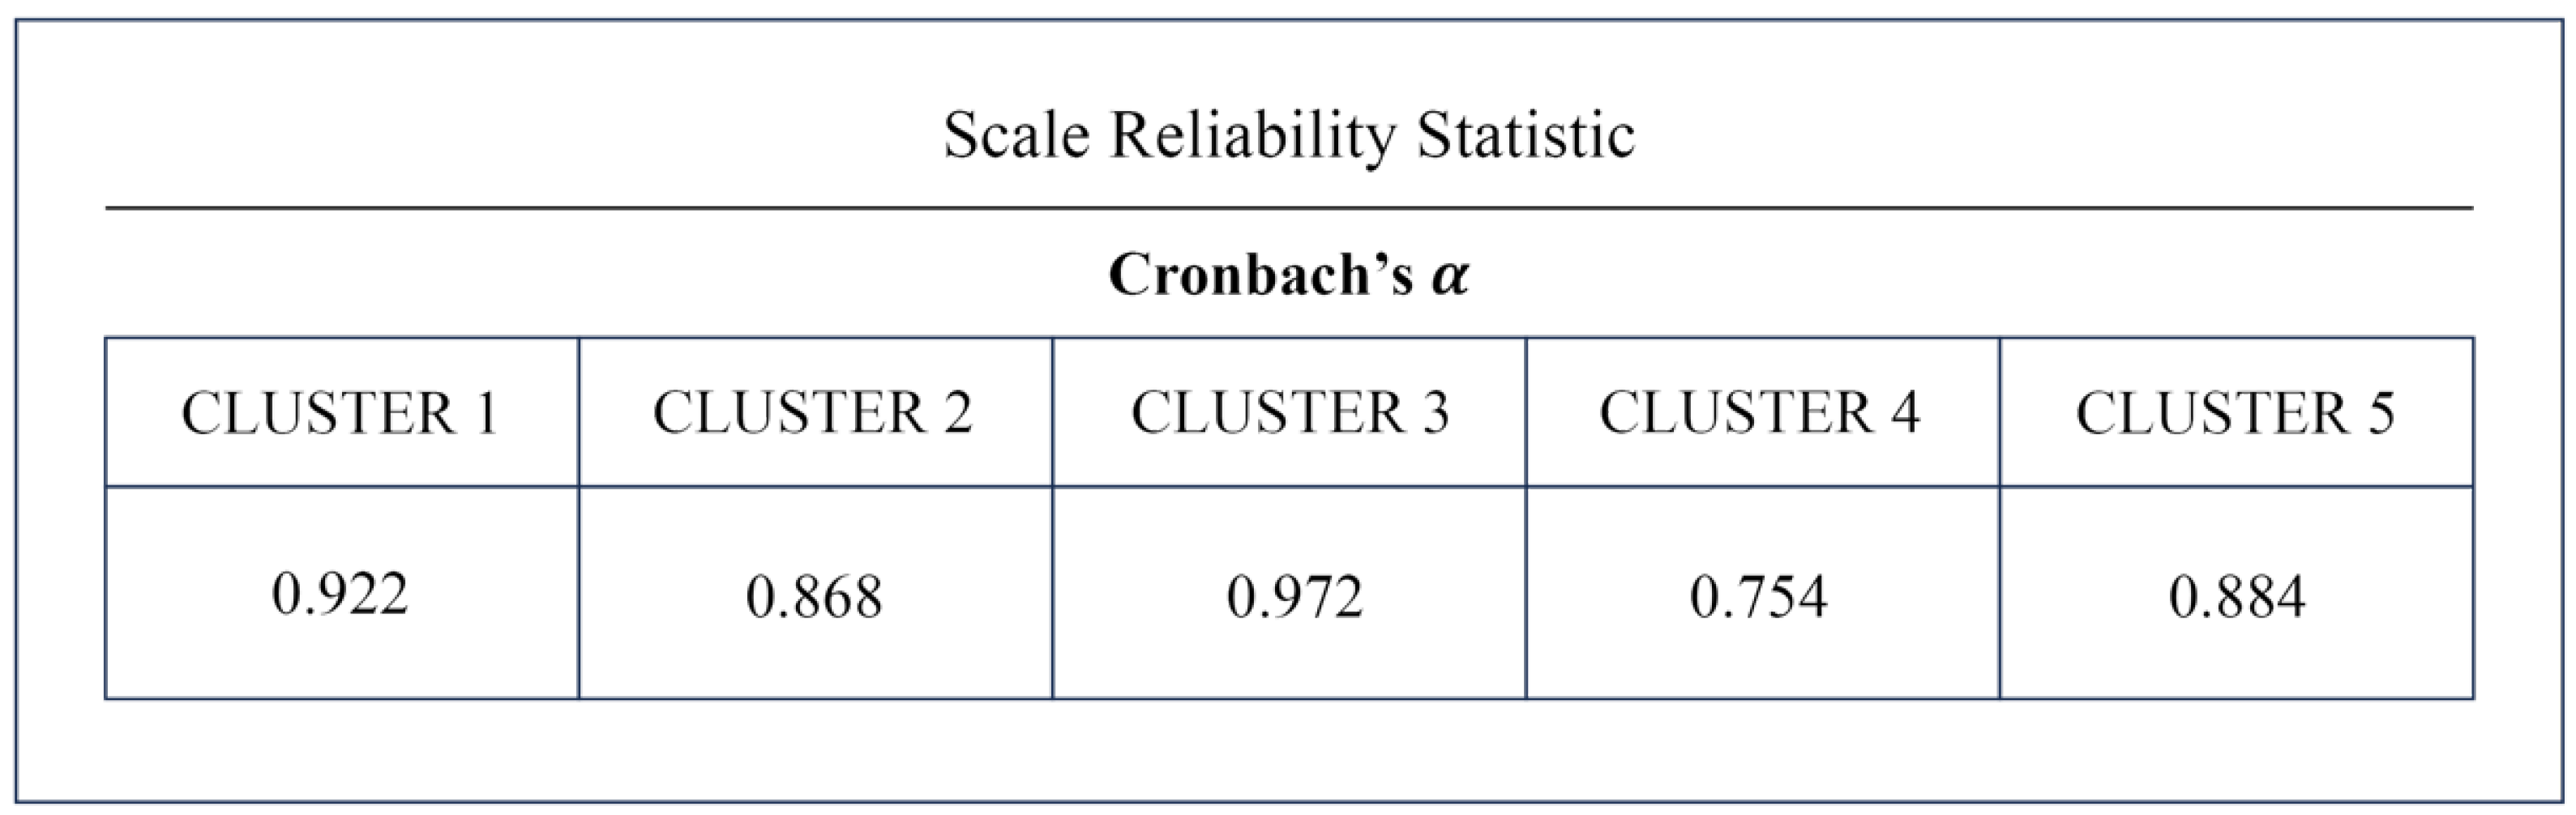
2.6. Reliability Analysis

We performed the reliability analysis of the five clusters identified earlier. The aim was to assess the internal consistency of the measures within each cluster and determine if the selected variables reliably represent the latent factor identified for each cluster.
By calculating Cronbach’s alpha for the five clusters, we obtained the results shown in Figure 3. The calculated Cronbach’s alpha indicates that the selected variables within the two clusters are consistent with each other and reliably measure the respective single cluster.
These results further confirm the choice of a single factor for each cluster, as the data suggest a strong internal consistency of the measures within each cluster.

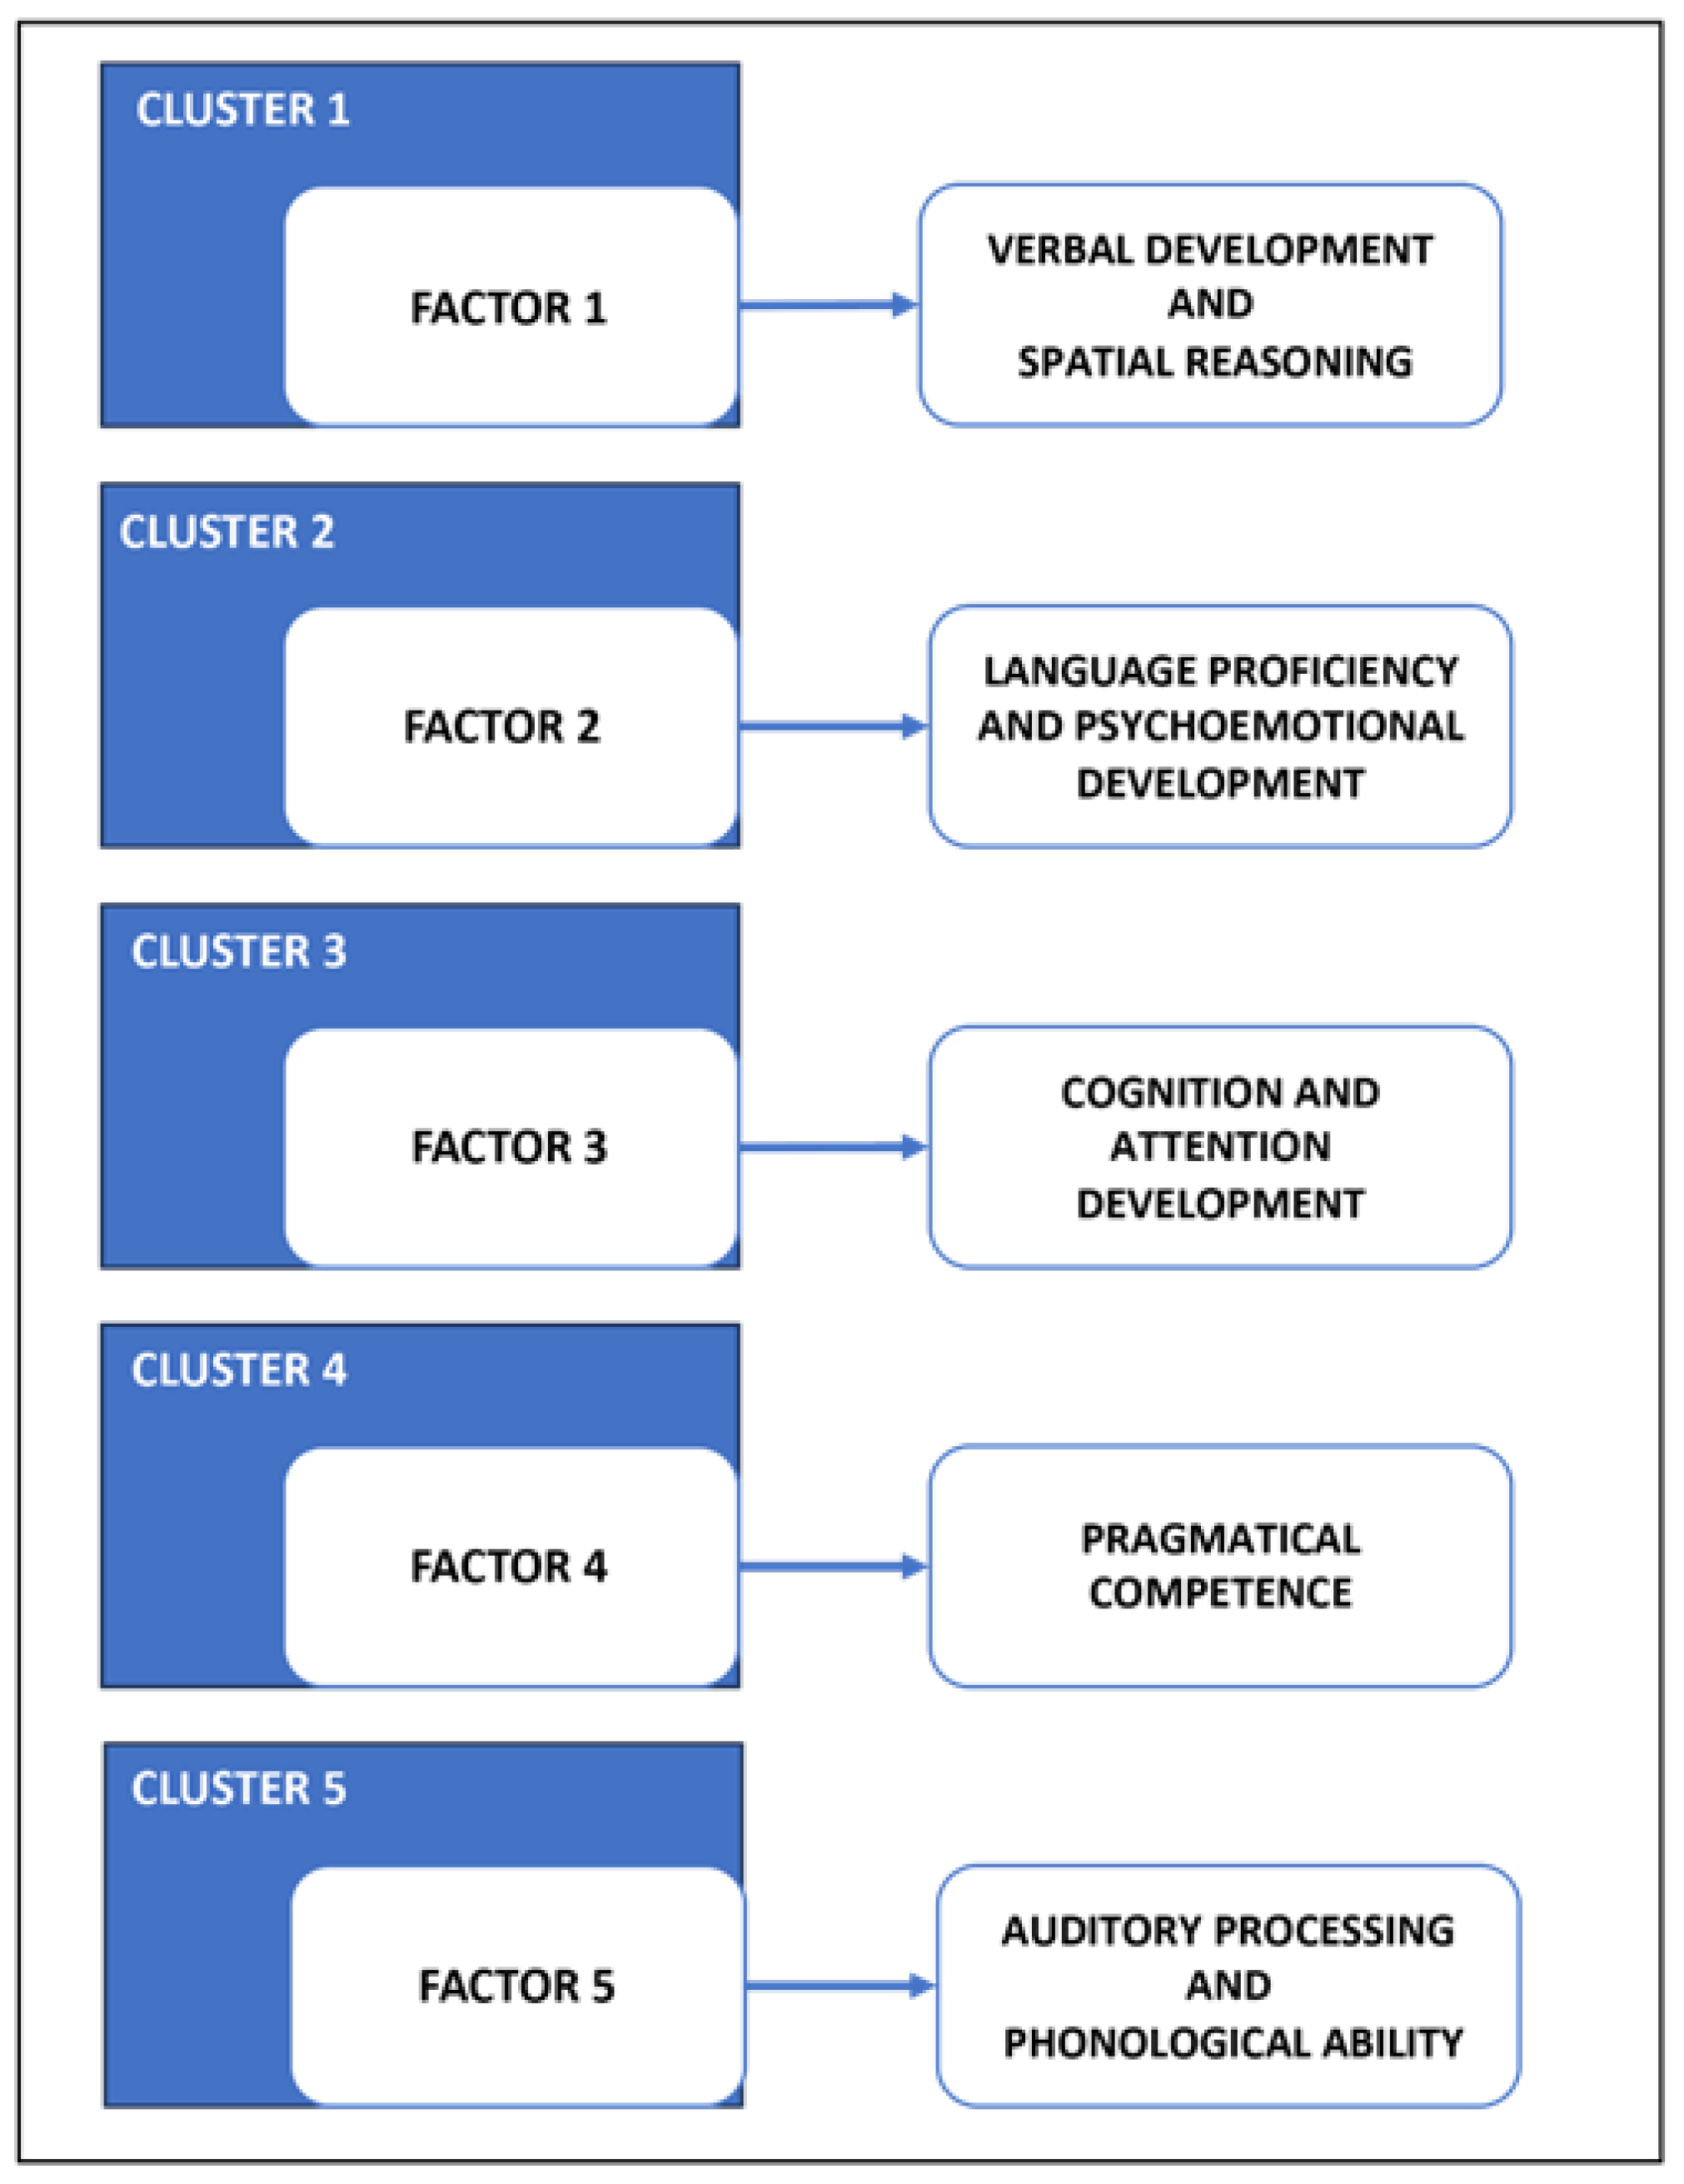
2.7. Factor Analysis

The exploratory factor analysis of the 13 selected variables revealed significant findings. The minimum residual extraction method was used in combination with a ‘varimax’ rotation to optimize the clarity and simplicity of factor interpretation. Five latent factors emerged, explaining 76.2% of the total variance. All variables show correlations with their respective factors, indicating a strong association among them. Bartlett’s test of sphericity confirmed the presence of a significant factor structure in the cluster, with a p-value below 0.001. Additionally, the Kaiser–Meyer–Olkin measure of sampling adequacy (KMO MSA) indicates that the data are suitable for factor analysis in the cluster (0.872). A screening test based on parallel analysis confirmed the importance of the five latent factors. These results indicate the presence of five latent factors that consistently explain the observed variations in their respective variables.
The cluster, reliability, and factor analyses highlight the identification of latent factors that align with the respective clusters highlighted among reliable and consistent variables, forming a more robust model. The five identified factors are renamed as follows (Figure 4):
The factor scores following the factor analysis were estimated using Thurstone’s method. This well-established technique employs a regression approach, where the observed variables are regressed on the extracted factors, allowing for the calculation of factor scores from the regression predictions. Thurstone’s method is valued for its robustness and appropriateness in factor score estimation, as it effectively captures the relationships between observed variables and latent factors, ensuring that the factor scores accurately represent the underlying constructs for further analysis and interpretation. The dataset, prepared for the predictive model and comprising 184 instances with an average age of about 7 years, incorporates latent factors as features and the dichotomous variable “disorder” as the target. This structure highlights the relationship between the latent factors and the presence or absence of NDs, facilitating interpretation and use in prediction.

2.8. Prediction Model

The predictive model will use a logistic regression algorithm to forecast the presence of NDs based on the five clusters, C1–C5.
The logistic regression technique is used to predict binary classifications in healthcare decision making by relying on the given features [18,47]. It is frequently employed to predict the presence or absence of an ND. This algorithm is known for its computational efficiency and quick training time. The coefficients associated with each feature indicate the direction and strength of the relationship, providing a straightforward interpretation of results. In this technique, the input feature values (e.g., C1–C5) are used to compute a weighted sum based on the acquired coefficients. The outcome is then subjected to the logistic function, which converts the continuous output into a probability value ranging from 0 to 1.
For example, if the probability is greater than 0.5, the model predicts the presence of NDs (class 1); otherwise, it predicts the absence of NDs (class 0).
For the external validation of the predictive model, a cohort comprising 184 individuals, approximately 7 years of age, was employed. This subset was strategically chosen to reflect a specific demographic within the target population. In contrast, the training phase utilized an expanded initial dataset of 473 subjects, whose ages ranged from 3 to 52 years. This methodology was meticulously designed to ascertain the model’s robustness and its generalizability across a heterogeneous and broader population spectrum.
The predictive algorithm was used in age group 3, consisting of 184 participants with an average age of approximately 7 years, whose descriptive statistics are presented in Figure 5.

3. Experimental Results and Discussion
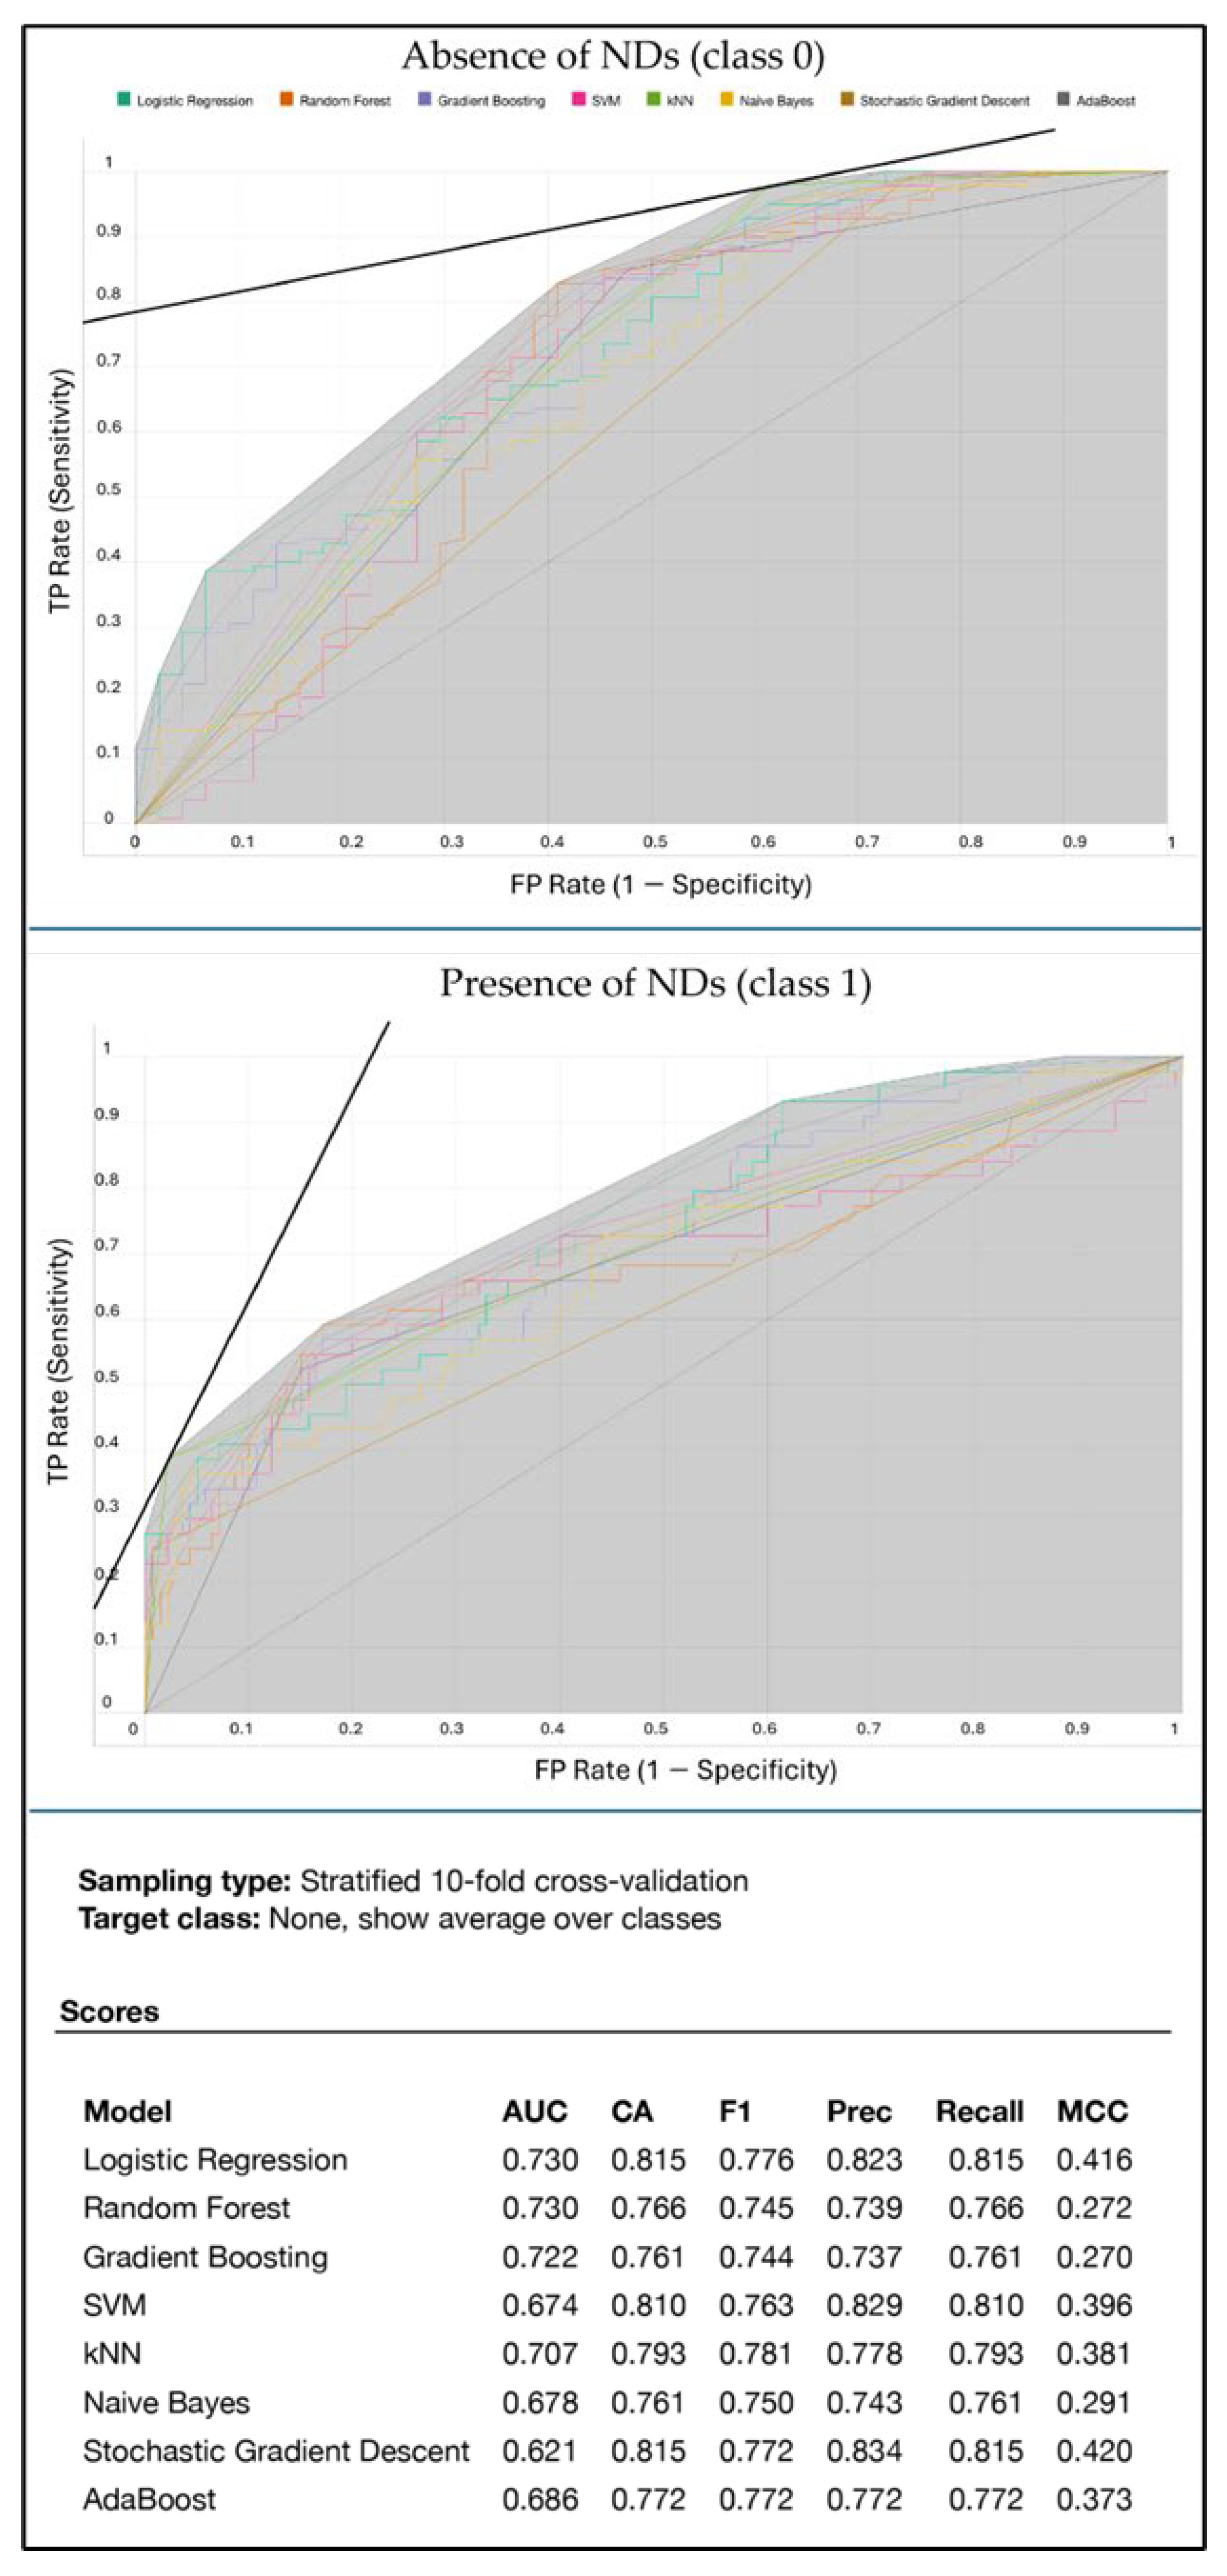
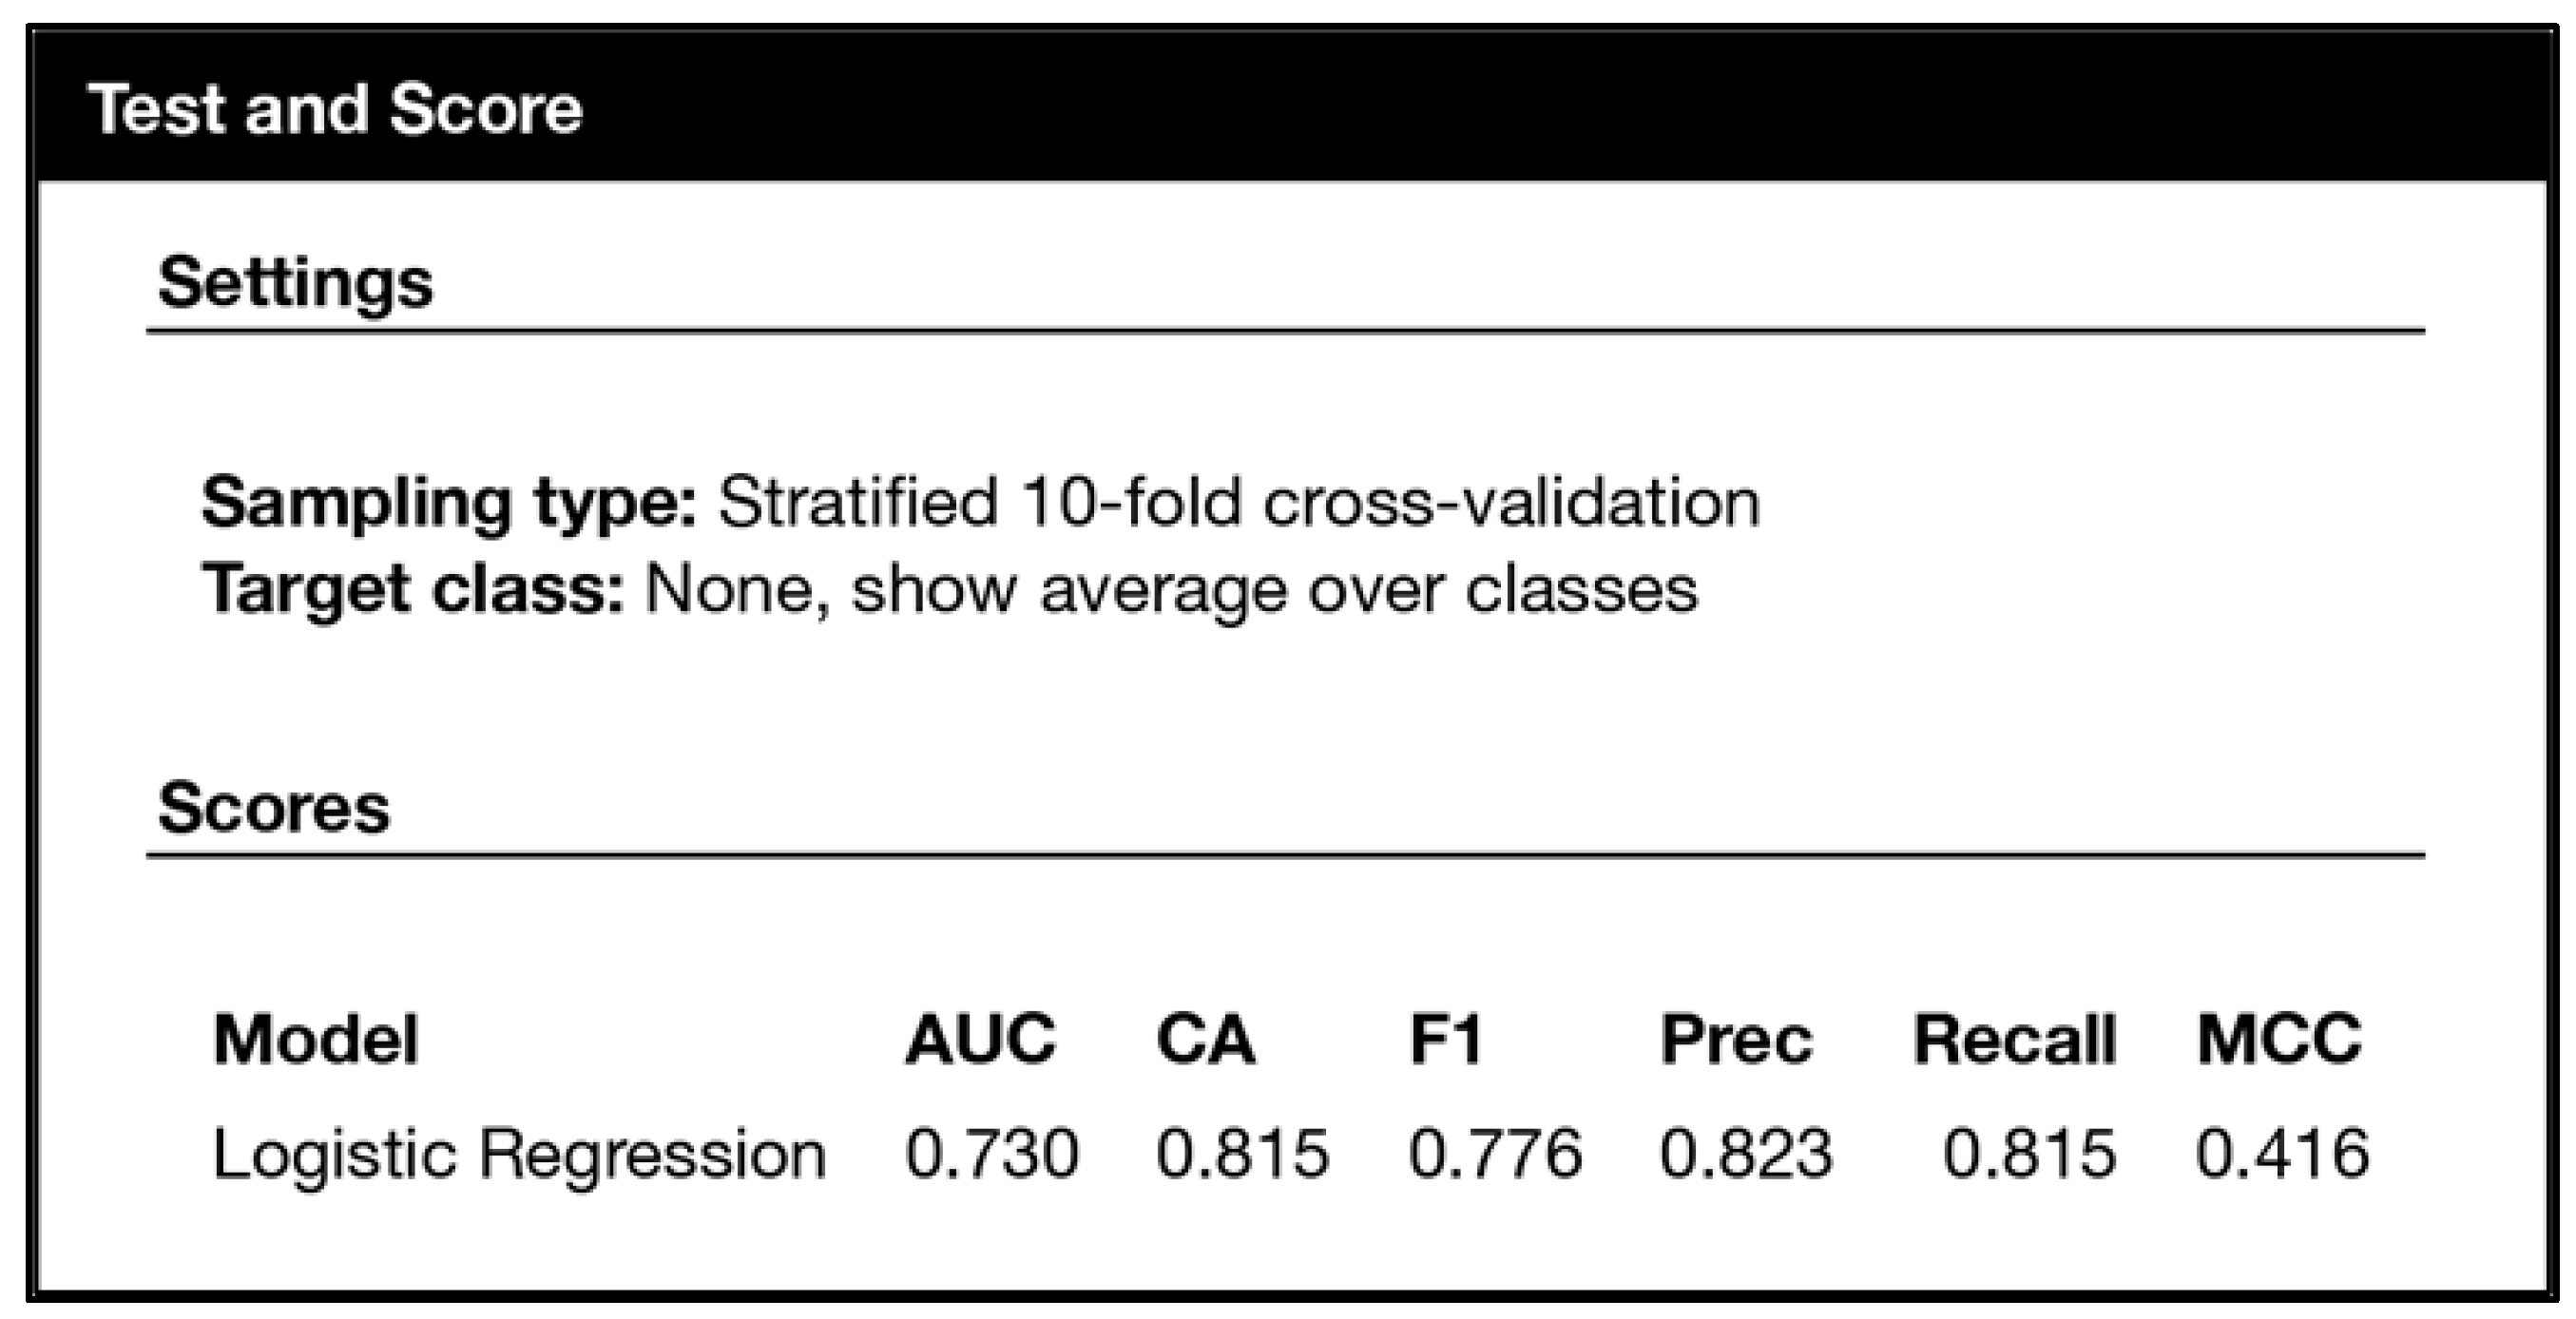
For an exhaustive evaluation of the model’s performance, we incorporated an analysis of the confusion matrix and receiver operating characteristic (ROC) curves. The confusion matrix elucidated a substantial concordance between the model’s prognostications and the actual classifications: 81.2% of cases without NDs (class 0) were correctly identified (true negatives), while 85.7% of cases with NDs (class 1) were accurately classified (true positives). Conversely, 18.8% of cases were erroneously classified as non-NDs (false positives), and 14.3% of non-ND cases were misclassified as NDs (false negatives), as delineated in Figure 6.
Furthermore, the ROC curves for both categories (absence and presence of NDs) were incorporated to furnish a visual elucidation of the model’s discriminative capacity. These curves exhibit pronounced class separation, with elevated area under the curve (AUC) values signifying the model’s robust capability to correctly classify cases based on the presence of NDs (Figure 7). The inclusion of these visual and statistical analyses not only augments our comprehension of the model’s performance but also lays a substantial groundwork for subsequent inquiries and practical implementations in our study.
We introduced an analytical extension to the logistic regression model for predicting NDs, embodied in the integration of a sophisticated nomogram. This tool, fundamental in the interpretation of predictive models, transforms complex results into an intuitive visual representation, offering a quantitative and qualitative understanding of the impact of each predictive variable. The nomogram, built on a foundation of carefully calibrated parameters, illuminates the probability of absence (target class 0) and presence (target class 1) of NDs with extraordinary precision.
For the absence of NDs, a total probability of 81% and a log-odds ratio of 5.79 are manifested through a mosaic of attributes: “Language Proficiency and Social” (2.64 points, value 0.9), “Text Comprehension and Processing” (0.6 points, value −0.7), “Cognitive Precision” (1.38 points, value 0.4), “Auditory Processing Skills” (1.13 points, value 0.4), and “Cognitive Communication Skills” (0.05 points, value 0.1). In contrast, the presence of NDs, with a total probability of 19% and a log-odds ratio of 5.05, is influenced differently by these same attributes, reflecting the complex nature of neurodevelopmental disorders.
The detailed analysis of the nomogram, illustrated in Figure 8, reveals a dynamic and significant correlation between the variables and the probability of the presence of NDs. Each line in the nomogram, with its length and direction, not only indicates the importance and influence on the prediction but also tells a story of how the variables interact in a complex clinical context. The points assigned to each variable represent their relative weight in the model; higher values indicate a greater impact on the outcome probability. In particular, we observed that reducing the values of “Language Proficiency and Social”, “Text Comprehension and Processing”, “Cognitive Precision”, and “Auditory Processing Skills”, while increasing “Cognitive Communication Skills”, results in a marked increase in the predicted probability of the presence of NDs. This observation underscores the critical importance and sensitivity of the selected variables in our model and opens new perspectives for future investigations, suggesting specific pathways through which targeted interventions could positively influence the incidence and management of NDs.
The coefficients represent the effect of predictor variables on the log-odds of the binary target variable (ND). Let us see the interpretations for each coefficient (Figure 9).
In summary, the coefficients of the logistic regression model provide information about the effect of predictor variables on the log-odds of having ND. For example, higher “Verbal Development and Spatial Reasoning” and “Cognition and Attention Development” are associated with an increase in the log-odds of having ND, while increases in the other variables are associated with a decrease in the log-odds of having ND.

3.1. Experiments

At the heart of our scientific investigation into neurodevelopmental disorders in children, we have adopted a rigorous and cutting-edge methodological approach to select the most effective predictive model. Figure 10 represents the culmination of this analytical process, offering a detailed report of the metrics for all considered regressors. This visualization not only embodies our dedication to scientific precision but also serves as a critical reference point for understanding the comparative performance of various models.
Figure 10 illustrates the performance of models such as logistic regression, random forest, gradient boosting, SVM, kNN, naive Bayes, stochastic gradient descent (SGD), and AdaBoost, evaluated through rigorous metrics such as area under the ROC curve (AUC), accuracy (CA), F1 score (F1), precision (Prec), recall, and Matthews correlation coefficient (MCC). These metrics have been carefully selected to provide a holistic and multidimensional evaluation of each model’s capabilities, ensuring that our final choice is informed by a complete understanding of their performance.
Logistic regression emerges as a beacon of excellence in this analytical landscape, distinguishing itself for its superior discrimination ability and an optimal balance between precision and sensitivity. With an AUC of 0.730, accuracy of 0.815, F1 score of 0.776, precision of 0.823, and recall of 0.815, this model not only demonstrates an excellent ability to distinguish between classes but also provides a clear and direct interpretation of its predictions, a crucial aspect for clinical application.
External validation on an independent cohort has further strengthened our confidence in logistic regression, confirming its robustness and applicability to a broader and more heterogeneous population. This step was crucial to ensure that the selected model is not only accurate and reliable on the training dataset but also generalizable and applicable in real-world scenarios. Despite a slight decrease in performance with an AUC of 0.729, accuracy of 0.725, F1 score of 0.686, precision of 0.703, and recall of 0.725, the model maintains a strong discriminative ability and a good balance between key metrics.
The AUC curves presented in Figure 10 offer an immediate visual comparison of each model’s ability to balance true positives and false positives, further highlighting the superiority of logistic regression in the context of our evaluation criteria. This visual comparison not only confirms our choice but also provides a transparent and quantifiable basis for the decision, ensuring that the selected model is the most suitable to guide informed and accurate clinical decisions.
The performance indicators of the predictive model, using a logistic regression algorithm to forecast the presence of NDs, are described in Figure 11.
This indicates that the model is achieving a good balance between accuracy, precision, and recall. The model was evaluated using stratified 10-fold cross-validation. An AUC of 0.7229 suggests that the model has a reasonably good discriminative capacity between the two classes (presence or absence of NDS), while an accuracy of 0.8152 indicates that approximately 81.52% of instances are correctly classified by the model.
The F1-score, which considers both precision and recall, is also quite high with a value of 0.7763, indicating that the model is performing well in identifying true positive instances while minimizing false positives and false negatives. With a precision value of 0.822616, the model has a good proportion of correct positive predictions compared to all positive predictions. This indicates that when the model predicts that an instance belongs to the positive class, it is correct about 82.26% of the time.
These results indicate that the model has a good ability to discriminate between the classes, achieving a balance between precision and recall. Overall, the model appears to be effective in predicting the presence of NDs based on the provided features.

3.2. Advantages and Limitations of Applying Machine Learning in the Study of Neurodevelopmental Disorders

The adoption of machine learning in our study represents a data-driven approach that unveils patterns and correlations not immediately evident through traditional analytical methods. The ability to process and analyze large volumes of data allows the use of complex and detailed datasets that enhance the quality of predictions. For instance, machine learning has been instrumental in developing personalized assistive tools, demonstrating significant potential in enhancing the educational and social development of children with various neurodevelopmental disorders. This approach has shown promise in improving their social interaction and supportive education, indicating a promising direction for enhancing care and education in these areas [48]. Similarly, the investigation into the use of machine learning-based diagnostic techniques for the early prediction of neurodevelopmental disorders in children highlighted reduced intervention time and increased accuracy [15].
The ability to compare different models, such as logistic regression, random forest, and SVM, enables us to select the best performing and most suitable one for the specific context of the study. The use of stratified 10-fold cross-validation provides a reliable estimate of the model’s performance and minimizes the risk of overfitting, while validation on an independent external cohort confirms the generalizability of the models to a broader population, increasing the robustness of the study. However, it is important to recognize the limitations associated with these methods. The complexity and interpretation of some machine learning models can be daunting, especially for those without specific training. Studies that have explored the use of machine learning to analyze qualitative data have indicated that, although it can provide valuable insights, it requires careful interpretation and validation [49].
The quality and reliability of predictions strongly depend on the quality of the input data; erroneous, incomplete, or biased data can lead to misleading results. Despite the use of cross-validation, there is always a risk of overfitting, especially when working with small datasets or a high number of features. Moreover, the literature analysis has highlighted how many machine learning models can be sensitive to imbalanced datasets, affecting their ability to generalize to new data [38]. Finally, the configuration, interpretation, and validation of models require in-depth knowledge and specific skills, which can limit accessibility for some research teams. Studies that have developed models to differentiate individuals with specific conditions have highlighted the complexity involved in developing and interpreting these models [50].
In conclusion, while the machine learning-based approach offers numerous advantages in terms of analytical capacity and data processing, a deep understanding of its limitations and challenges is essential to ensure that the results are interpreted correctly and used responsibly in a clinical context. This balance between the advantages and limitations of machine learning guides our study towards a rigorous and informed scientific investigation, aiming to provide more effective and reliable tools for the diagnosis and treatment of neurodevelopmental disorders.

4. Conclusions

This study is an in-depth analysis providing a deeper understanding of NDs with the development of a precise and reliable predictive model, using a logistic regression algorithm to forecast the presence of NDs.
The phases of this study’s analysis to achieve accurate and meaningful results were as follows: (i) data preprocessing for data consistency and homogeneity; (ii) cluster analysis for grouping similar observations into homogeneous clusters; (iii) reliability analysis to assess the consistency and reliability of our variables’ measurements; (iv) factor analysis for the identification of latent factors that align with the respective clusters highlighted among reliable and consistent variables, forming a more robust model; and (v) a predictive model based on machine learning techniques using the logistic regression model, through which we predicted the presence of an ND based on the clusters identified in the cluster analysis.
The results of this study are comparable with two previous experiments on the SmartSpeech game score dataset [19,45]. This study’s prediction model has better accuracy, 81.52%, than the best performing method of those studies, which was the Grammatical Evolution variant named GenClass, with an accuracy of 79.56%. Moreover, the precision and recall metrics are superior in this study’s prediction model.
The findings of this study have given us a prediction model that is more accurate and clinically relevant. This model can help clinicians with the early diagnosis and treatment of NDs by providing valuable insights. This study encourages further research to focus on finding new ways to make models that help children with NDs deal with real-life problems more effectively. These models should be easy to understand, flexible, and more helpful.

Author Contributions

Conceptualization, E.I.T. and J.P.; methodology, E.I.T. and J.P.; data curation, V.S. and J.P.; writing—original draft preparation, E.I.T., V.S. and I.G.T.; writing—review and editing, E.I.T., I.G.T. and J.P.; visualization, E.I.T. and V.S.; supervision, E.I.T.; project administration, E.I.T.; funding acquisition, E.I.T. All authors have read and agreed to the published version of the manuscript.

Funding

This research was funded by the project titled “Smart Computing Models, Sensors, and Early Diagnostic Speech and Language Deficiencies Indicators in Child Communication”, with code HP1AB-28185 (MIS: 5033088), supported by the European Regional Development Fund (ERDF).

Institutional Review Board Statement

The study was conducted in accordance with the Declaration of Helsinki and approved by the Research Ethics Committee of the University of Ioannina, Greece, (protocol code 18435 on 15 May 2020).

Informed Consent Statement

Informed written consent was obtained from all participating parents, after informing them regarding the study’s compliance with GDPR regulations.

Data Availability Statement

The data presented in this study are available on request from the corresponding author. The data are not publicly available as participants of this study did not give written consent for their data to be shared publicly, so due to privacy restrictions and the sensitive nature of this research, data sharing is not applicable to this article.

Acknowledgments

We wish to thank all the participants for their valuable contribution in this study as well as administrative and technical support.

Conflicts of Interest

The authors declare no conflicts of interest. The funders had no role in the design of the study; in the collection, analyses, or interpretation of data; in the writing of the manuscript; or in the decision to publish the results.

Abbreviations

The following abbreviations are used in this manuscript (presented in alphabetical order):
ADHDattention deficit hyperactivity disorder
ASDsautism spectrum disorders
AUCarea under the curve
CAaccuracy
CDscommunication disorders
CNNconvolutional neural networks
DLdeep learning approaches
DLDdevelopmental language disorder
F1F1 score
FNfalse negative
FPfalse positive
GDDglobal developmental delay
GDPRgeneral data protection regulation
IDintellectual disability
k-NNk-nearest neighbor
LDAlinear discriminant analysis
LPClinear predictive coding
MCCMatthews correlation coefficient
MFCCmel-frequency cepstral coefficients
MLmachine learning
NDsneurodevelopmental disorders
Precprecision
RBFradial basis function
RBFNNradial basis function neural network
ROCreceiver operating characteristic
SGserious game
SGDstochastic gradient descent
SLDspecific learning disorder
SVMsupport vector machine
TDtypically developed individuals
TNtrue negative
TPtrue positive

References

  1. American Psychiatric Association. Diagnostic and Statistical Manual of Mental Disorders, 5th ed.; American Psychiatric Association: Arlington, VA, USA, 2013; ISBN 978-0-89042-555-8. [Google Scholar]
  2. Thapar, A.; Cooper, M.; Rutter, M. Neurodevelopmental Disorders. Lancet Psychiatry 2017, 4, 339–346. [Google Scholar] [CrossRef] [PubMed]
  3. Kwame, A.; Petrucka, P.M. A Literature-Based Study of Patient-Centered Care and Communication in Nurse-Patient Interactions: Barriers, Facilitators, and the Way Forward. BMC Nurs. 2021, 20, 158. [Google Scholar]
  4. Homberg, J.R.; Kyzar, E.J.; Nguyen, M.; Norton, W.H.; Pittman, J.; Poudel, M.K.; Gaikwad, S.; Nakamura, S.; Koshiba, M.; Yamanouchi, H.; et al. Understanding Autism and Other Neurodevelopmental Disorders through Experimental Translational Neurobehavioral Models. Neurosci. Biobehav. Rev. 2016, 65, 292–312. [Google Scholar] [CrossRef] [PubMed]
  5. Vakadkar, K.; Purkayastha, D.; Krishnan, D. Detection of Autism Spectrum Disorder in Children Using Machine Learning Techniques. SN Comput. Sci. 2021, 2, 386. [Google Scholar] [CrossRef] [PubMed]
  6. De Barros, F.R.D.; da Silva, C.N.F.; de Castro Michelassi, G.; Brentani, H.; Nunes, F.L.; Machado-Lima, A. Computer Aided Diagnosis of Neurodevelopmental Disorders and Genetic Syndromes Based on Facial Images-a Systematic Literature Review. Heliyon 2023, 9, e20517. [Google Scholar]
  7. Lombardo, M.V.; Pierce, K.; Eyler, L.T.; Carter Barnes, C.; Ahrens-Barbeau, C.; Solso, S.; Campbell, K.; Courchesne, E. Different Functional Neural Substrates for Good and Poor Language Outcome in Autism. Neuron 2015, 86, 567–577. [Google Scholar] [CrossRef]
  8. Young, S.; Adamo, N.; Ásgeirsdóttir, B.B.; Branney, P.; Beckett, M.; Colley, W.; Cubbin, S.; Deeley, Q.; Farrag, E.; Gudjonsson, G. Females with ADHD: An Expert Consensus Statement Taking a Lifespan Approach Providing Guidance for the Identification and Treatment of Attention-Deficit/Hyperactivity Disorder in Girls and Women. BMC Psychiatry 2020, 20, 404. [Google Scholar] [CrossRef]
  9. Abi-Jaoude, E.; Naylor, K.T.; Pignatiello, A. Smartphones, Social Media Use and Youth Mental Health. Can. Med. Assoc. J. 2020, 192, E136–E141. [Google Scholar] [CrossRef] [PubMed]
  10. Filippello, P.; Buzzai, C.; Messina, G.; Mafodda, A.V.; Sorrenti, L. School Refusal in Students with Low Academic Performances and Specific Learning Disorder. The Role of Self-Esteem and Perceived Parental Psychological Control. Int. J. Disabil. Dev. Educ. 2020, 67, 592–607. [Google Scholar] [CrossRef]
  11. Bourgeron, T. What Do We Know about Early Onset Neurodevelopmental Disorders? In Translational Neuroscience: Toward New Therapies; MIT Press: Cambridge, MA, USA, 2015. [Google Scholar]
  12. American Psychiatric Association. DSM-5 Intellectual Disability Fact Sheet. 2013. Available online: https://www.psychiatry.org/File%20Library/Psychiatrists/Practice/DSM/APA_DSM-5-Intellectual-Disability.pdf (accessed on 25 December 2023).
  13. Harris, J.C. New Classification for Neurodevelopmental Disorders in DSM-5. Curr. Opin. Psychiatry 2014, 27, 95–97. [Google Scholar] [CrossRef]
  14. Merrells, J.; Buchanan, A.; Waters, R. “We Feel Left out”: Experiences of Social Inclusion from the Perspective of Young Adults with Intellectual Disability. J. Intellect. Dev. Disabil. 2019, 44, 13–22. [Google Scholar]
  15. Alam, S.; Raja, P.; Gulzar, Y. Investigation of Machine Learning Methods for Early Prediction of Neurodevelopmental Disorders in Children. Wirel. Commun. Mob. Comput. 2022, 2022, 5766386. [Google Scholar] [CrossRef]
  16. van Rooij, D.; Zhang-James, Y.; Buitelaar, J.; Faraone, S.V.; Reif, A.; Grimm, O. Structural Brain Morphometry as Classifier and Predictor of ADHD and Reward-Related Comorbidities. Front. Psychiatry 2022, 13, 869627. [Google Scholar] [PubMed]
  17. Wong, J.; Cohn, E.S.; Coster, W.J.; Orsmond, G.I. “Success Doesn’t Happen in a Traditional Way”: Experiences of School Personnel Who Provide Employment Preparation for Youth with Autism Spectrum Disorder. Res. Autism Spectr. Disord. 2020, 77, 101631. [Google Scholar] [CrossRef]
  18. Moreau, C.; Deruelle, C.; Auzias, G. Machine Learning for Neurodevelopmental Disorders. In Machine Learning for Brain Disorders; Colliot, O., Ed.; Humana: New York, NY, USA, 2023; ISBN 978-1-07-163194-2. [Google Scholar]
  19. Toki, E.I.; Tatsis, G.; Tatsis, V.A.; Plachouras, K.; Pange, J.; Tsoulos, I.G. Applying Neural Networks on Biometric Datasets for Screening Speech and Language Deficiencies in Child Communication. Mathematics 2023, 11, 1643. [Google Scholar] [CrossRef]
  20. Rice, C.E.; Carpenter, L.A.; Morrier, M.J.; Lord, C.; DiRienzo, M.; Boan, A.; Skowyra, C.; Fusco, A.; Baio, J.; Esler, A.; et al. Defining in Detail and Evaluating Reliability of DSM-5 Criteria for Autism Spectrum Disorder (ASD) among Children. J. Autism Dev. Disord. 2022, 52, 5308–5320. [Google Scholar] [CrossRef] [PubMed]
  21. Fletcher, J.M.; Miciak, J. The Identification of Specific Learning Disabilities: A Summary of Research on Best Practices; Meadows Center for Preventing Educational Risk: Austin, TX, USA, 2019. [Google Scholar]
  22. Heller, M.D.; Roots, K.; Srivastava, S.; Schumann, J.; Srivastava, J.; Hale, T.S. A Machine Learning-Based Analysis of Game Data for Attention Deficit Hyperactivity Disorder Assessment. Games Health J. 2013, 2, 291–298. [Google Scholar] [CrossRef] [PubMed]
  23. Kou, J.; Le, J.; Fu, M.; Lan, C.; Chen, Z.; Li, Q.; Zhao, W.; Xu, L.; Becker, B.; Kendrick, K.M. Comparison of Three Different Eye-tracking Tasks for Distinguishing Autistic from Typically Developing Children and Autistic Symptom Severity. Autism Res. 2019, 12, 1529–1540. [Google Scholar] [CrossRef]
  24. Wei, Q.; Xu, X.; Xu, X.; Cheng, Q. Early Identification of Autism Spectrum Disorder by Multi-Instrument Fusion: A Clinically Applicable Machine Learning Approach. Psychiatry Res. 2023, 320, 115050. [Google Scholar] [CrossRef] [PubMed]
  25. Iwauchi, K.; Tanaka, H.; Okazaki, K.; Matsuda, Y.; Uratani, M.; Morimoto, T.; Nakamura, S. Eye-Movement Analysis on Facial Expression for Identifying Children and Adults with Neurodevelopmental Disorders. Front. Digit. Health 2023, 5, 952433. [Google Scholar] [CrossRef]
  26. Andrés-Roqueta, C.; Katsos, N. A Distinction Between Linguistic and Social Pragmatics Helps the Precise Characterization of Pragmatic Challenges in Children with Autism Spectrum Disorders and Developmental Language Disorder. J. Speech Lang. Hear. Res. 2020, 63, 1494–1508. [Google Scholar] [CrossRef]
  27. Song, C.; Jiang, Z.-Q.; Liu, D.; Wu, L.-L. Application and Research Progress of Machine Learning in the Diagnosis and Treatment of Neurodevelopmental Disorders in Children. Front. Psychiatry 2022, 13, 960672. [Google Scholar] [CrossRef]
  28. Emanuele, M.; Nazzaro, G.; Marini, M.; Veronesi, C.; Boni, S.; Polletta, G.; D’Ausilio, A.; Fadiga, L. Motor Synergies: Evidence for a Novel Motor Signature in Autism Spectrum Disorder. Cognition 2021, 213, 104652. [Google Scholar] [CrossRef]
  29. Akter, T.; Ali, M.H.; Khan, M.I.; Satu, M.S.; Uddin, M.J.; Alyami, S.A.; Ali, S.; Azad, A.; Moni, M.A. Improved Transfer-Learning-Based Facial Recognition Framework to Detect Autistic Children at an Early Stage. Brain Sci. 2021, 11, 734. [Google Scholar] [CrossRef] [PubMed]
  30. Vargason, T.; Frye, R.E.; McGuinness, D.L.; Hahn, J. Clustering of Co-Occurring Conditions in Autism Spectrum Disorder During Early Childhood: A Retrospective Analysis of Medical Claims Data. Autism Res. 2019, 12, 1272–1285. [Google Scholar] [CrossRef] [PubMed]
  31. Mohammed, V.A.; Mohammed, M.A.; Mohammed, M.A.; Logeshwaran, J.; Jiwani, N. Machine Learning-Based Evaluation of Heart Rate Variability Response in Children with Autism Spectrum Disorder. In Proceedings of the 2023 Third International Conference on Artificial Intelligence and Smart Energy (ICAIS), Coimbatore, India, 2–4 February 2023; pp. 1022–1028. [Google Scholar]
  32. Kanhirakadavath, M.R.; Chandran, M.S.M. Investigation of Eye-Tracking Scan Path as a Biomarker for Autism Screening Using Machine Learning Algorithms. Diagnostics 2022, 12, 518. [Google Scholar] [CrossRef]
  33. Chen, H.; Song, Y.; Li, X. Use of Deep Learning to Detect Personalized Spatial-Frequency Abnormalities in EEGs of Children with ADHD. J. Neural Eng. 2019, 16, 066046. [Google Scholar] [CrossRef] [PubMed]
  34. Dubreuil-Vall, L.; Ruffini, G.; Camprodon, J.A. Deep Learning Convolutional Neural Networks Discriminate Adult ADHD From Healthy Individuals on the Basis of Event-Related Spectral EEG. Front. Neurosci. 2020, 14, 251. [Google Scholar] [CrossRef]
  35. Ahire, N.; Awale, R.; Wagh, A. Electroencephalogram (EEG) Based Prediction of Attention Deficit Hyperactivity Disorder (ADHD) Using Machine Learning. Appl. Neuropsychol. Adult 2023, 1–12. [Google Scholar] [CrossRef]
  36. Aggarwal, G.; Singh, L. Comparisons of Speech Parameterisation Techniques for Classification of Intellectual Disability Using Machine Learning. In Research Anthology on Physical and Intellectual Disabilities in an Inclusive Society; IGI Global: Hershey, PA, USA, 2022; pp. 828–847. [Google Scholar]
  37. Breitenbach, J.; Raab, D.; Fezer, E.; Sauter, D.; Baumgartl, H.; Buettner, R. Automatic Diagnosis of Intellectual and Developmental Disorder Using Machine Learning Based on Resting-State EEG Recordings. In Proceedings of the 2021 17th International Conference on Wireless and Mobile Computing, Networking and Communications (WiMob), Bologna, Italy, 11–13 October 2021; pp. 7–12. [Google Scholar]
  38. Song, C.; Jiang, Z.-Q.; Hu, L.-F.; Li, W.-H.; Liu, X.-L.; Wang, Y.-Y.; Jin, W.-Y.; Zhu, Z.-W. A Machine Learning-Based Diagnostic Model for Children with Autism Spectrum Disorders Complicated with Intellectual Disability. Front. Psychiatry 2022, 13, 993077. [Google Scholar] [CrossRef]
  39. Haft, S.L.; Greiner de Magalhães, C.; Hoeft, F. A Systematic Review of the Consequences of Stigma and Stereotype Threat for Individuals with Specific Learning Disabilities. J. Learn. Disabil. 2023, 56, 193–209. [Google Scholar] [CrossRef]
  40. Nilsson Benfatto, M.; Öqvist Seimyr, G.; Ygge, J.; Pansell, T.; Rydberg, A.; Jacobson, C. Screening for Dyslexia Using Eye Tracking during Reading. PLoS ONE 2016, 11, e0165508. [Google Scholar] [CrossRef] [PubMed]
  41. Chawla, M.; Panda, S.N.; Khullar, V. Assistive Technologies for Individuals with Communication Disorders. In Proceedings of the 2022 10th International Conference on Reliability, Infocom Technologies and Optimization (Trends and Future Directions) (ICRITO), Noida, India, 13 October 2022; pp. 1–5. [Google Scholar]
  42. Jacobs, G.R.; Voineskos, A.N.; Hawco, C.; Stefanik, L.; Forde, N.J.; Dickie, E.W.; Lai, M.-C.; Szatmari, P.; Schachar, R.; Crosbie, J.; et al. Integration of Brain and Behavior Measures for Identification of Data-Driven Groups Cutting across Children with ASD, ADHD, or OCD. Neuropsychopharmacology 2021, 46, 643–653. [Google Scholar] [PubMed]
  43. Toki, E.I.; Tatsis, G.; Tatsis, V.A.; Plachouras, K.; Pange, J.; Tsoulos, I.G. Employing Classification Techniques on SmartSpeech Biometric Data towards Identification of Neurodevelopmental Disorders. Signals 2023, 4, 401–420. [Google Scholar] [CrossRef]
  44. CMUSphinx 2022. Available online: https://cmusphinx.github.io/2022/10/release/ (accessed on 25 December 2023).
  45. Pantazoglou, F.K.; Papadakis, N.K.; Kladis, G.P. Implementation of the Generic Greek Model for CMU Sphinx Speech Recognition Toolkit. In Proceedings of the eRA-12 International Scientific Conference, Athens, Greece, 24–26 October 2017. [Google Scholar]
  46. Santamato, V.; Esposito, D.; Tricase, C.; Faccilongo, N.; Marengo, A.; Pange, J. Assessment of Public Health Performance in Relation to Hospital Energy Demand, Socio-Economic Efficiency and Quality of Services: An Italian Case Study. In Proceedings of the Computational Science and Its Applications—ICCSA 2023 Workshops, Athens, Greece, 3–6 July 2023; Proceedings, Part III; Springer: Berlin/Heidelberg, Germany, 2023; pp. 505–522. [Google Scholar]
  47. Shipe, M.E.; Deppen, S.A.; Farjah, F.; Grogan, E.L. Developing Prediction Models for Clinical Use Using Logistic Regression: An Overview. J. Thorac. Dis. 2019, 11, S574–S584. [Google Scholar] [CrossRef] [PubMed]
  48. Barua, P.D.; Vicnesh, J.; Gururajan, R.; Oh, S.L.; Palmer, E.; Azizan, M.M.; Kadri, N.A.; Acharya, U.R. Artificial Intelligence Enabled Personalised Assistive Tools to Enhance Education of Children with Neurodevelopmental Disorders—A Review. Int. J. Environ. Res. Public Health 2022, 19, 1192. [Google Scholar] [CrossRef]
  49. Bastiaansen, J.A.J.; Veldhuizen, E.E.; De Schepper, K.; Scheepers, F.E. Experiences of Siblings of Children with Neurodevelopmental Disorders: Comparing Qualitative Analysis and Machine Learning to Study Narratives. Front. Psychiatry 2022, 13, 719598. [Google Scholar] [CrossRef]
  50. Donnelly, N.; Cunningham, A.; Salas, S.M.; Bracher-Smith, M.; Chawner, S.; Stochl, J.; Ford, T.; Raymond, F.L.; Escott-Price, V.; van den Bree, M.B.M. Identifying the Neurodevelopmental and Psychiatric Signatures of Genomic Disorders Associated with Intellectual Disability: A Machine Learning Approach. Mol. Autism 2023, 14, 19. [Google Scholar] [CrossRef]
Figure 1. Methodological workflow.
Applsci 14 00837 g001
Figure 2. Dendrogram of the 13 variables considered.
Applsci 14 00837 g002
Figure 3. Cronbach’s alpha for the five clusters.
Applsci 14 00837 g003
Figure 4. Latent factors identified.
Applsci 14 00837 g004
Figure 5. Descriptive statistics of 184 participants.
Applsci 14 00837 g005
Figure 6. Confusion matrix.
Applsci 14 00837 g006
Figure 7. ROC curves for ND presence and absence.
Applsci 14 00837 g007
Figure 8. Nomogram of variables affecting ND probability.
Applsci 14 00837 g008
Figure 9. Model coefficients.
Applsci 14 00837 g009
Figure 10. Comparative ROC curves and performance parameters of machine learning models.
Applsci 14 00837 g010
Figure 11. Model’s performance indicators.
Applsci 14 00837 g011
Table 1. Descriptive statistics.
NMissing Mean Median SD Minimum Maximum Shapiro–Wilk
W 1p
Verbal and Intellectual Ability47300.010440.21260.988−3.141.9670.867<0.001
Targeted Voicing Activities4730−0.01477−0.19420.987−1.392.2370.945<0.001
Syntax4730−0.00858−0.11870.966−2.073.7540.973<0.001
Phonology47300.006960.15220.996−2.660.7280.709<0.001
Pragmatic Perception4730−0.00269−0.19560.996−1.051.5390.835<0.001
Fine Motor Skills47300.048760.68050.976−2.080.6800.668<0.001
Spatial Orientation4730−0.007360.04390.983−2.472.5830.967<0.001
Sequencing47300.023510.27850.971−3.232.1520.909<0.001
Memory4730−0.01280−0.25550.995−1.272.5520.915<0.001
Perception/Discrimination47300.031790.66581.001−3.250.6660.673<0 .001
Sustained Attention4730 0.007650.49870.966−2.221.9340.742<0.001
Cognitive Flexibility4730−0.007140.12781.000−2.671.5380.856<0.001
Empathy47300.023120.32070.964−2.922.3940.887<0.001
1 “W” in the Shapiro–Wilk test is a test statistic that assesses the normality of data distribution. Values closer to 1 indicate a greater conformity of the data to a normal distribution.
Disclaimer/Publisher’s Note: The statements, opinions and data contained in all publications are solely those of the individual author(s) and contributor(s) and not of MDPI and/or the editor(s). MDPI and/or the editor(s) disclaim responsibility for any injury to people or property resulting from any ideas, methods, instructions or products referred to in the content.

