Abstract
Taiwan’s power system operates as an isolated grid, preventing the export of surplus energy. Excess electricity is either stored or discarded (curtailed). This study aims to estimate the energy storage requirement for the day with the most extreme electricity consumption behavior in a year without energy curtailment. Based on the installed capacity and actual power generation of renewable energy sources in 2022, this research estimates the power generation per GW of the installed capacity at full load. Integrating the government’s annual installation capacity plans, this study forecasts the annual power generation of renewable sources. Using the electrical load during the 2023 Spring Festival as a baseline and assuming an annual electricity consumption growth rate of 2%, combined with a minimum gas power output of approximately 6 GW, this study calculates the unused power generation, which represents the pumped-storage hydroelectricity and battery energy storage systems requirements for that day under a no-curtailment scenario. Considering the semi-annual adjustments in installation planning, this study’s code is open-sourced and designed to provide updated results with new planning data input, facilitating ongoing adjustments.
1. Introduction
In recent years, Taiwan has set a goal of achieving a 20% renewable energy proportion in its power generation by 2025 by actively promoting the development of wind and solar photovoltaic (PV) energy. By 2025, the installed capacity of offshore wind power is expected to reach 5.6 GW, with plans to add 1.5 GW of capacity annually until 2035. For solar PV, the goal is to achieve 20 GW of installed capacity, with an annual increase of 2 GW until 2030, totaling an additional 11 GW between 2026 and 2030. However, the development of renewable energy faces several challenges. As the penetration of renewable energy in the power system increases, controlling the system becomes more difficult [1,2]. Unlike conventional power generation, renewable energy generation is affected by climate and weather and cannot be controlled by adjusting fuel input [3]. Hence, with high renewable penetration, situations may arise where generation exceeds consumption, leading to curtailment. Although shutting down conventional generators can alleviate this issue, sufficient traditional units are needed to stabilize the grid frequency and voltage [4], so they cannot be entirely shut down. In situations where there is a large gap between generation and consumption, the appropriate addition of energy storage systems can effectively reduce or even resolve curtailment issues [5,6,7]. Energy storage systems can also supply electricity when renewable generation is low [8], reducing traditional generation and thereby lowering CO2 emissions [9,10].
Due to the instability of renewable sources, traditional units will need a faster response capability [11]. Gas units, compared to coal units, can start up more quickly. When the proportion of renewable energy is high, power systems will mainly rely on gas generation [12]. Coal-fired units will be reduced during allowed conditions.
This study utilized a full year’s hourly data from Texas to evaluate the hydrogen storage needs for various renewable energy penetrations [13]. Additionally, an analysis of 35 years of hourly data was conducted to determine the energy storage requirements within a 100% renewable penetration in Germany [14]. This study used nine years of hourly data in the UK to evaluate the energy storage needs and economic costs of different solar-to-wind ratios under the penetration rate of 100–125% (curtailment) [15]. As far as the author knows, the mainstream literature usually considers the situation where the proportion of renewable energy is close to 100%. The relevant articles do not consider the energy storage needs of an independent system that was planned by the government in recent years.
2. Research Methodology
2.1. Electricity Consumption Data
Taiwan’s electricity load throughout the year is about 20–40 GW, while the lowest load occurs during the Spring Festival. In this period, the electricity load is the lowest when it is only about 16 GW in the early morning and about 19 GW at noon, as shown by the significant difference (dark blue area) at the bottom of Figure 1. As Taiwan is located in the Northern Hemisphere, solar power generation in winter will be slightly lower than in summer. Wind power generation depends on the monsoon, which occurs mainly in winter, as shown in Figure 2. As the Spring Festival has the lowest electricity load and abundant wind power generation, it is the annual period when energy storage is most needed in Taiwan.
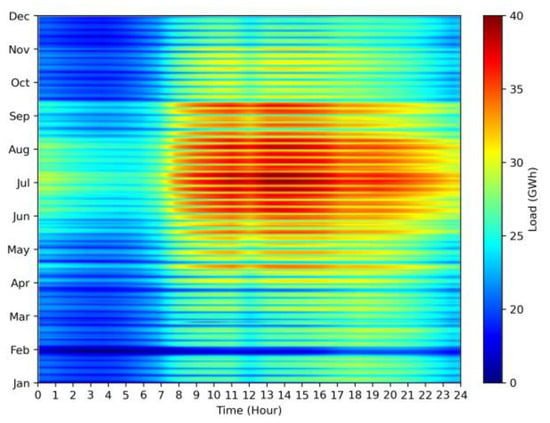
Figure 1.
Heat map of Taiwan’s electricity load in 2022 (Data Source: Taiwan Power Company, Taipei, Taiwan).
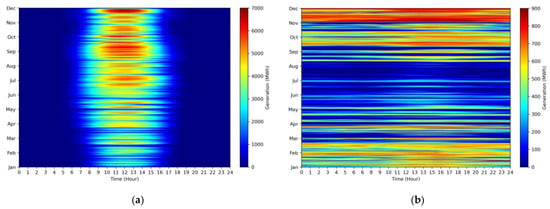
Figure 2.
(a) Taiwan’s solar photovoltaic power generation heat map in 2022; (b) Taiwan’s wind power generation heat map in 2022 (Data Source: Taiwan Power Company, Taipei, Taiwan).
Power generation of renewable energy does not change, regardless of whether it is weekday or weekend. However, the power load in Taiwan is particularly low on Sundays, as shown in the dark blue area in Figure 1. Therefore, winter Sundays are the time when energy storage is the second most needed in Taiwan.
Based on the estimation of the Ministry of Economic Affairs in Taiwan, the electricity load growth rate is predicted to be 2% from 2023 to 2030 [16]. According to the local Independent System Operator (ISO), power generation during the Spring Festival will mainly consist of gas units, wind power, and PV. The power generation schedule for the 2026 Spring Festival is simulated in Figure 3 [17]. From this figure, the net load at noon is about 3 GW. From the same figure, we saw that the local ISO calculates the minimum power generation of the power system to be about 6 GW. So, to maintain system frequency and voltage, it is not possible to entirely disconnect or shut down every traditional unit, and a certain number of them must be retained. In this case, storage pumps pump water, and batteries are charged to store excess energy and avoid curtailment. To estimate the required energy storage capacity needed from 2025 to 2030 to avoid curtailment in scenarios with a large proportion of renewable energy, this study will use the actual electricity consumption data from the 2023 Spring Festival, along with the annual electricity growth rate of about 2%, to project the electricity consumption from 2025 to 2030.
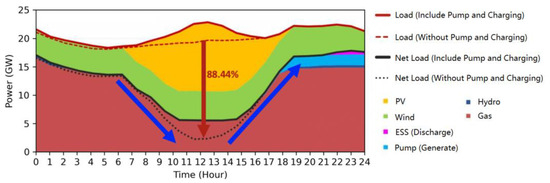
Figure 3.
The power generation schedule for the 2026 Spring Festival [17].
2.2. Renewable Energy Generation Data
In Taiwan, wind power generation is primarily composed of offshore wind farms. According to the Energy Bureau’s plan, a total of 5.6 GW of installation capacity is expected to be completed between 2021 and 2025, including 0.2 GW from demonstration projects, 3.8 GW from selected projects, and 1.6 GW from bidding projects. From 2026 to 2035, the block development plan will add 1.5 GW of installation capacity annually, as shown in Table 1 [16]. As wind power generation in Taiwan is highest in winter, this study will directly use the installed capacity of wind power as the basis for estimating the power generation.

Table 1.
Installation capacity of offshore wind farms in the future [16].
Regarding solar PV, as of 2023, Taiwan’s solar PV installation capacity is approximately 14 GW. By 2025, the completion of 20 GW of installation capacity is anticipated, with an additional 11 GW planned between 2026 and 2030, as shown in Table 2 [16]. This study uses the full-load generation data of solar PV on a specific day in 2023, along with the installation capacity data, to calculate the ratio of each GW of solar PV installation capacity to the actual power generation (maximum power generation is approximately 0.625 times the installation capacity). By combining the annual installation capacity data provided by the Energy Bureau, the AC power generation of solar PV for each year can be estimated.
Table 2.
Installation capacity of solar photovoltaic farms in the future [16].
3. Mathematical Formulation
This paper uses Mixed Integer Linear Programming (MILP) to propose a method based on traditional power system economic dispatch. It is essential to establish a mathematical relationship that aligns the final outcomes with an effective dispatch strategy. Such a strategy is characterized by certain features:
- Due to the necessity of maintaining system rotational inertia and adhering to the minimum output limits of generators, traditional power systems possess a baseline generation capacity. Furthermore, the marginal cost of power generation escalates in tandem with power output increments due to economic dispatch principles [18];
- As renewable energy sources are not reliant on fuel, their generation costs are negligible. Consequently, it is economically advantageous to maximize their electricity production, as this study assumes no curtailment;
- Energy storage systems engage in charging during periods of surplus power generation and discharge at times when generation costs peak. Therefore, it discharges during periods of high power output in traditional power systems.
The objective is to synchronize the operational profiles of both the battery and traditional power systems with an efficient dispatch strategy, focusing on determining the requisite energy storage power and capacity. In this context, the precise cost calculations are not pivotal and thus are not employed. Our model specifically calculates the costs for traditional generation units in Equation (1), treating all such units as a single entity with their minimum generation capacity set to the system’s baseline. The model does not impose a maximum generation limit. Additionally, Equation (2) posits that generation costs are proportionate to the square of the power output, implying higher costs for increased power output. The goal, as per the objective function, is cost minimization, which encourages energy storage to discharge during high power output periods. Furthermore, Equation (9) enforces energy balance at each interval, leading to energy storage charging during periods of excessive renewable energy generation.
3.1. Objective Function
The objective function, as shown in Equation (1), aims to minimize the total cost . In the equation, represents the total cost, represents the cost of all gas-fired units at time , and represents the total scheduling period.
3.2. Gas-Fired Generation Units
Equation (2) represents the fuel cost of the gas-fired units. The fuel cost is expressed as a quadratic function, representing the fuel cost of the gas-fired units; the power output of the gas-fired units at time is represented by .
Moreover, this study assumes the minimum power output of the gas units to be 30% of the maximum net load of the day. This assumption is based on the 2023 simulation data by the Independent System Operator (ISO) for the Spring Festival of 2026, as shown in Figure 3. This assumption helps simulate and understand the operational constraints and cost implications of gas-fired units in the power system.
3.3. Battery Energy Storage Systems
In this section, we define a series of equations describing the real power output of the battery energy storage system at time , adapted from [19]. Equation (3) expresses the real power output of the battery storage system at time , including the discharging and charging quantities.
To limit the charging and discharging power of the battery storage system within its maximum limits, Equations (4) and (5) are introduced. and , respectively, indicate whether the battery storage system is in a discharging or charging state at time ; and , respectively, represent the maximum discharging and charging power of the battery storage system.
To ensure that the battery storage system performs only one of the charging or discharging actions at each time point, constraint (6) is added.
The calculation of the SOC (State of Charge) of the battery storage system, the final SOC value, and its range are expressed by Equations (7) and (8). Equation (7) calculates the battery storage system’s charge level at time , . Here, represents the time interval; and represent the discharging and charging efficiency of the battery storage system; the storage capacity is denoted by in MWh. Equation (8) defines the minimum and maximum values of the battery storage system.
These equations collectively define the operational mode of the battery storage system in a time sequence, including charging/discharging behaviors, efficiency, and capacity limits, thus integrating the storage system effectively into the overall power system operation.
3.4. Power System Supply–Demand Balance Constraint
To maintain the stable operation of the power system, it is necessary to maintain supply–demand balance. For this purpose, we introduce the power system’s supply–demand balance constraint (9) to ensure the balance between supply and demand at each time point. The supply–demand balance constraint can be expressed as the following equation:
Here, represents the total generation of renewable energy at time t. represents the electricity from the energy storage system at time t. represents the power generation from traditional units. represents the total load at time t—the total electricity demand of the system at that moment. To apply this model practically, this study scales up historical data proportionally as the total load. This method allows us to estimate future electricity demand based on past data and predicted growth trends.
Additionally, represents the permissible error margin in the solution. This means that a certain level of deviation is acceptable in the calculations to maintain the system’s flexibility and operability in actual operation. With such a setup, we can ensure that the power system maintains a supply–demand balance under various circumstances, thereby ensuring the system’s stable operation.
4. Energy Storage Demand Simulation
This section conducts a series of simulations to assess the energy storage demand during the Spring Festival period in Taiwan over the coming years. The simulation uses actual load data from the Spring Festival of 2023, assuming an annual electricity consumption growth of 2%, to estimate the load for each Spring Festival in the future. To accommodate the most extreme scenarios, solar PV generation is assumed to be at full capacity. The solar power generation is based on the solar energy generation and installation capacity during the summer of 2022, combined with the future installation capacity increases projected by the Energy Bureau, to estimate the annual solar power generation. The wind power generation part directly uses the installed capacity as the basis for estimating the power generation.
4.1. Energy Storage Demand Simulation
After performing the above estimations, the future annual renewable energy power generation can be determined, thus establishing the required energy storage power and capacity under a no-curtailment scenario. Figure 4 shows the power generation simulation during the Spring Festival of 2027 in Taiwan. The yellow curve represents the total load curve, approximately 23,065 MW. The green curve represents the total load minus wind power generation. The blue curve is the net load, approximately 16,565 MW. The red line represents the system’s minimum generation limit, about 5000 MW. When solar power is at full capacity at noon, the net load will fall below the minimum disconnection limit of the traditional generators in the power system. Since traditional generators cannot be shut down or disconnected at this time, the excess electricity represented by the blue area can be considered the required capacity for energy storage. At night, when solar PV does not generate electricity, the electricity stored during the day can be used to meet the load demand during night time.
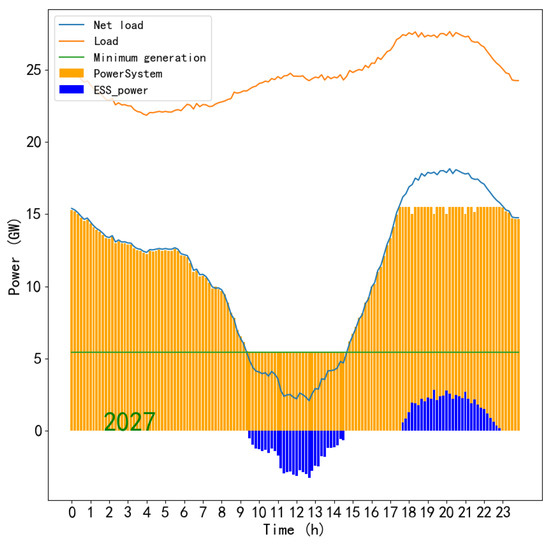
Figure 4.
Power generation simulation during the Spring Festival of 2027 in Taiwan.
Simulations from 2026 to 2030 show that assuming the power system’s minimum generation to be 30% of the maximum net load provides the required annual energy storage capacity. As shown in Figure 5, with the development of renewable energy and the growth of load, the gap between the total load and the net load increases, and thus, the required capacity for energy storage also increases. Using extreme generation data for solar PV and wind power, along with the lowest load data of the Spring Festival within a year, the energy storage capacity shown in Figure 5 represents the maximum required for that year under a no-curtailment scenario.
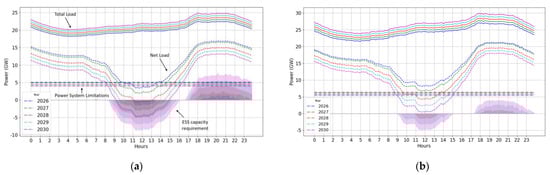
Figure 5.
(a) Net electricity load and energy storage requirements in Taiwan during the Spring Festival from 2026 to 2030. (b) Net electricity load and energy storage requirements on winter Sundays in Taiwan from 2026 to 2030.
The above power generation scheduling yields the annual energy storage capacity requirement. As shown in Figure 6, the required storage capacity increases from 3 GWh in 2026 to 43 GWh in 2030, indicating a 40 GWh increase over this five-year period.
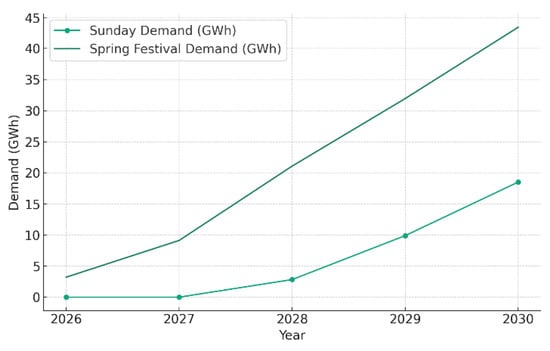
Figure 6.
Annual energy storage capacity requirements from 2026 to 2030.
4.2. Variability of Renewable Energy Faced by Each Unit of Gas-Fired Generation
This section discusses the challenges faced by gas-fired generators in responding to the variability of renewable energy. Due to the limited ramping rate of gas-fired units, the increase in renewable energy variability that each GW of gas-fired generation needs to handle implies a theoretical need for more additional reserve capacity. Although these calculations do not directly represent the final procurement quantity, they provide a reference. Based on data from reference [20], providing additional frequency adjustment needs of renewable energy per hour in January, divided by the hourly generation of gas-fired units on winter Sundays, we can determine the additional renewable variability each GW of gas-fired generation will face annually.
According to reference [20], the hourly variability frequency adjustment needs throughout the year can be assessed by taking the larger value of average generation changes every five minutes and every minute. These data are shown in Figure 7 and Figure 8.
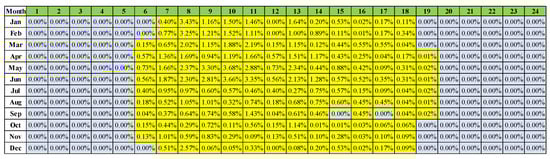
Figure 7.
Additional demand for the downward frequency regulation of solar energy.
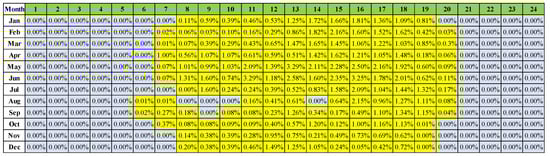
Figure 8.
Additional demand for the upward frequency regulation of solar energy.
Figure 9 shows the total variability obtained by adding the solar and wind variabilities for January from 2025 to 2030.
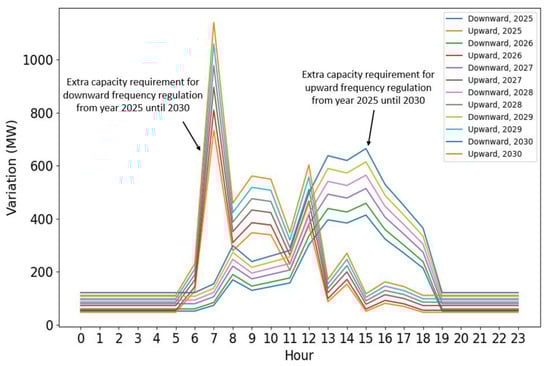
Figure 9.
Total variability of January from 2025 to 2030.
Figure 10 shows the hourly gas-fired generation on winter Sundays from 2025 to 2030.
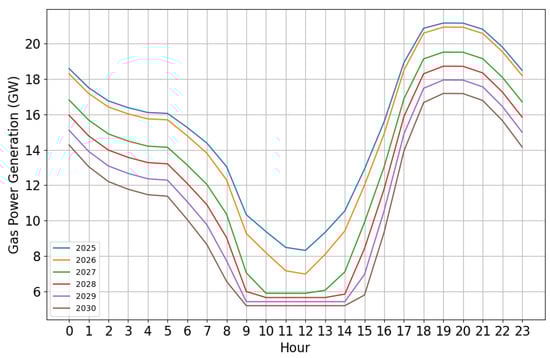
Figure 10.
Hourly gas-fired generation on winter Sundays from 2025 to 2030.
Dividing the total variability by the hourly gas-fired generation provides the additional renewable variability or frequency adjustment needs faced by each GW of gas-fired generation. As shown in Figure 11, this analysis reveals the variability demands at different times of the day. For example, a significant increase in solar generation in the early morning might lead to substantial downward frequency adjustment needs. However, due to the higher load during this period, this need is not as pronounced when these figures are divided by the generators’ output. In contrast, the variability is relatively higher around noon when generation decreases.
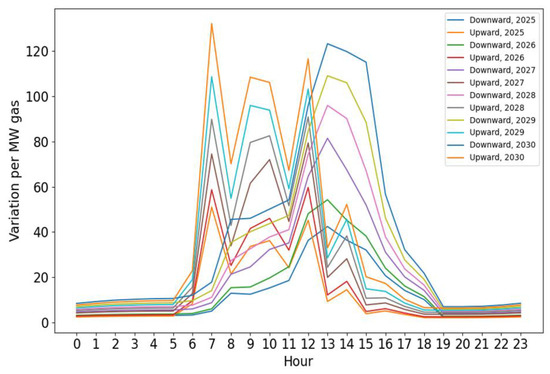
Figure 11.
Per GW gas-fired variability of January from 2025 to 2030.
4.3. Discussion of Simulation Results
The scenario in this study represents a theoretical maximum, as during the year’s lowest electricity usage period, renewable energy sources might not always be operating at full capacity. Evaluation based solely on this day might lead to an overestimation of energy storage needs, as only a few days throughout the year may require such high levels of energy storage. Future assessments should use more comprehensive data, such as data spanning an entire year, to determine the appropriate proportion of reduced generation and the required capacity of energy storage for a region. Utilizing energy storage power conversion systems (PCS) that can provide synthetic inertia may help reduce the minimum generation amount of traditional power systems, thereby decreasing energy storage requirements and offering potential economic benefits. This approach will be one of the future research directions.
5. Conclusions
This paper uses Mixed Integer Linear Programming (MILP) to propose a method that can calculate the theoretical maximum energy storage demand of the future independent power system and uses Taiwan as an example to evaluate the annual energy storage demand according to the government plan before 2030 without curtailment. The results show that the total energy storage demand will increase from 3 GWH in 2026 to 40 GWH in 2030. The method proposed in this article is open source. As long as users input data from other regions or new plans, users can obtain new results to adapt to the constantly adjusted government plans and increase the versatility of other independent systems.
Author Contributions
Conceptualization, C.-C.K. and P.-C.T.; methodology, J.-Z.J.; validation, P.-C.T., J.-Z.J. and S.S.-S.T.; formal analysis, P.-C.T. and J.-Z.J.; investigation, S.S.-S.T.; resources, S.S.-S.T.; data curation, P.-C.T.; writing—original draft preparation, J.-Z.J.; writing—review and editing, C.-C.K. and S.S.-S.T.; supervision, C.-C.K.; project administration, J.-Z.J. All authors have read and agreed to the published version of the manuscript.
Funding
This research received no external funding.
Institutional Review Board Statement
Not applicable.
Informed Consent Statement
Not applicable.
Data Availability Statement
The estimation result is openly available in Google Colab at https://colab.research.google.com/drive/1h9wSgbMYc2i1hfGuC9Q8BQofVW37U_Pl?usp=sharing, (accessed on 1 September 2023).
Conflicts of Interest
The authors declare no conflicts of interest.
References
- Picioroaga, I.; Luca, M.; Tudose, A.; Sidea, D.; Eremia, M.; Bulac, C. Resilience-Driven Optimal Sizing of Energy Storage Systems in Remote Microgrids. Sustainability 2023, 15, 16002. [Google Scholar] [CrossRef]
- Vaghela, P.; Pandey, V.; Sircar, A.; Yadav, K.; Bist, N.; Kumari, R. Energy storage techniques, applications, and recent trends: A sustainable solution for power storage. MRS Energy Sustain. 2023, 10, 261–276. [Google Scholar] [CrossRef]
- Demir, B.E. A New Low-Cost Internet of Things-Based Monitoring System Design for Stand-Alone Solar Photovoltaic Plant and Power Estimation. Appl. Sci. 2023, 13, 13072. [Google Scholar]
- Nahid, H.; Nahid, A.; Atik, J. Frequency control challenges and potential countermeasures in future low-inertia power systems: A review. Energy Rep. 2022, 8, 6191–6219. [Google Scholar]
- Paul, D.; Trieu, M. Timescales of energy storage needed for reducing renewable energy curtailment. Renew. Energy 2019, 130, 388–399. [Google Scholar]
- Zhongjie, G.; Wei, W.; Laijun, C.; Rui, X.; Shengwei, M. Sizing energy storage to reduce renewable power curtailment considering network power flows: A distributionally robust optimisation approach. IET Renew. Power Gener. 2020, 14, 3273–3280. [Google Scholar]
- Vargas, L.S.; Bustos-Turu, G.; Larraín, F. Wind Power Curtailment and Energy Storage in Transmission Congestion Management Considering Power Plants Ramp Rates. IEEE Trans. Power Syst. 2015, 30, 2498–2506. [Google Scholar] [CrossRef]
- Saldarini, A.; Longo, M.; Brenna, M.; Zaninelli, D. Battery Electric Storage Systems: Advances, Challenges, and Market Trends. Energies 2023, 16, 7566. [Google Scholar] [CrossRef]
- Maryam, A.; Ramteen, S.; Jeremiah, X.; Gregory, A. The role of energy storage in deep decarbonization of electricity production. Nat. Commun. 2019, 10, 3413. [Google Scholar]
- Kumar, K.; Jaipal, B. The role of energy storage with renewable electricity generation. In Electric Grid Modernization; IntechOpen: London, UK, 2022. [Google Scholar]
- Molière, M. The Fuel Flexibility of Gas Turbines: A Review and Retrospective Outlook. Energies 2023, 16, 3962. [Google Scholar] [CrossRef]
- Miguel, A.G.; Trevor, K.; Lubos, P. Review of the operational flexibility and emissions of gas- and coal-fired power plants in a future with growing renewables. Renew. Sustain. Energy Rev. 2018, 82, 1497–1513. [Google Scholar]
- Leonard, M.D.; Michaelides, E.E.; Michaelides, D.N. Energy storage needs for the substitution of fossil fuel power plants with renewables. Renew. Energy 2020, 145, 951–962. [Google Scholar]
- Bennett, J.A.; Trevisan, C.N.; DeCarolis, J.F.; Ortiz-García, C.; Pérez-Lugo, M.; Etienne, B.T.; Clarens, A.F. Extending energy system modelling to include extreme weather risks and application to hurricane events in Puerto Rico. Nat. Energy 2021, 6, 240–249. [Google Scholar] [CrossRef]
- Cárdenas, B.; Swinfen-Styles, L.; Rouse, J.; Hoskin, A.; Xu, W.; Garvey, S.D. Energy storage capacity vs. renewable penetration: A study for the UK. Renew. Energy 2021, 171, 849–867. [Google Scholar] [CrossRef]
- National Electricity Resources Supply and Demand Report. Energy Administration, Ministry of Economic Affairs. Available online: https://www.moeaea.gov.tw/ecw/populace/content/wHandMenuFile.ashx?file_id=15274 (accessed on 31 December 2023).
- Renewable Energy Aids for Peak Power Supply! A One-Stop Look at Taiwan Power Company’s Renewable Energy Grid Integration Strategy. BusinessToday 2023. Available online: https://www.businesstoday.com.tw/article/category/183027/post/202305140004/ (accessed on 14 May 2023).
- Are Solar and Wind Really Killing Coal, Nuclear and Grid Reliability? The Electrochemical Society. Available online: https://www.electrochem.org/ecsnews/solar-wind-really-killing-coal-nuclear-grid-reliability/ (accessed on 4 January 2024).
- Jhan, J.-Z.; Tai, T.-C.; Chen, P.-Y.; Kuo, C.-C. Research on Dynamic Reserve and Energy Arbitrage of Energy Storage System. Appl. Sci. 2022, 12, 11953. [Google Scholar] [CrossRef]
- Li, J.; Zhang, J.; Cai, J.; Ye, H.; Xu, W.; Liu, Y.; Liao, Q.; Zeng, B. Estimation of Auxiliary Service Demand for Taipower System Using Statistical Analysis Method. In Proceedings of the 43rd ROC Power Engineering Conference and 19th Taiwan Power Electronics Conference, Taichung City, Taiwan, 1 December 2022. [Google Scholar]
Disclaimer/Publisher’s Note: The statements, opinions and data contained in all publications are solely those of the individual author(s) and contributor(s) and not of MDPI and/or the editor(s). MDPI and/or the editor(s) disclaim responsibility for any injury to people or property resulting from any ideas, methods, instructions or products referred to in the content. |
© 2024 by the authors. Licensee MDPI, Basel, Switzerland. This article is an open access article distributed under the terms and conditions of the Creative Commons Attribution (CC BY) license (https://creativecommons.org/licenses/by/4.0/).