Abstract
Axial-flow fans are widely used as cooling fans in the outdoor units of split-type air conditioners. The design of an axial-flow fan blade involves stacking several airfoils that can be differently designed for each spanwise section. However, the complex flow field around the fan blade, including circumferential and axial flows, presents challenges when applying the single airfoil theory. This study proposed a systematic performance-based design method for axial-flow fans using a cascade of airfoils based on the blade strip theory. The theory characterized the complex three-dimensional flow field driven by an axial-flow fan in terms of a two-dimensional cascade of airfoil flows. Computational fluid dynamics based on finite volume methods were used to predict the flow field and aerodynamic sound sources of an existing low-pressure axial-flow fan partially covered by a fan shroud, and the results were validated against experimental measurements. Three radial locations in the spanwise region from the hub to the blade tip that have a significant impact on aerodynamic performance were selected, and the two-dimensional flow field on a cylindrical surface with a constant radius was extracted from the three-dimensional flow field to characterize the performance of an axial fan. Then, the airfoils at the targeted span locations were optimized for a higher flow rate and greater efficiency via two-dimensional simulations using the cascades of the airfoil, and the selected optimized airfoils were applied to existing fan blades. The effectiveness of the proposed performance-based design method for low-pressure axial-flow fans was validated by the results, which showed that the redesigned fan blades with cascades of airfoils performed as predicted, increasing the intended higher flow rate by about 1%, improving power consumption by 8%, and lowering the overall sound pressure level by 1.5 dBA.
1. Introduction
The performance of an axial-flow fan can be evaluated using the flow rate, efficiency, and noise. Axial-flow fans are widely used in various industries, such as ventilation, air conditioning, and cooling systems, due to their high flow rate, high efficiency, and low noise level. However, the axial-flow fan blades experience a more complex flow feature than the other types of fans, so designing an axial-flow fan is challenging because it involves many design parameters that can significantly affect its performance. Therefore, a thorough understanding of the basic design principles of axial-flow fans is necessary for developing efficient and optimized fans. One of the most common design methods is based on the single airfoil theory, which originates from the wing theory of aircraft [1].
The basic design procedure based on the airfoil theory can be summarized as follows. First, the overall dimensions of the fan, such as the diameter of the fan and hub, are determined. The number of blades and solidity are subsequently determined. Then, the sectional airfoil shapes are designed using design parameters, such as the pitch angle, camber angles, thickness, etc., in two dimensions. Next, the designed airfoils are stacked along a spanwise baseline called a stacking line. In this step, three-dimensional design parameters are considered, like the sweep and lean angles [2]. At last, a fully three-dimensional design is adopted for a particular intention, such as a winglet shape [3,4] at the tip or bionic curvature on the blade surface [5]. However, the complex flow features of axial-flow fans make it challenging to apply the single airfoil theory as a reliable design tool.
An alternative approach is based on the cascade of airfoils [6,7,8,9,10], which is based on the strip theory. The blade strip theory is a theoretical model used to analyze the aerodynamic behavior of an axial-flow fan blade by dividing it into a series of blade strips along the spanwise direction. Each blade strip is assumed to be independent of the others, and the flow through each strip is treated as two dimensional.
Zhang et al. [6] studied the impact of airfoil probes on a compressor cascade’s aerodynamics using RANS and DDES simulations. The probes influence the load capacity and shock waves, reducing the separation bubbles but also causing extra flow losses. The DDES revealed detailed vortex structures, including shedding streamwise vortices, impacting wake behavior. Liu et al. [7] introduced a deep reinforcement learning (DRL) framework for rotor airfoil optimization to address issues with conventional methods lacking interpretability and generalizability. Using neural networks and reinforcement learning, it enhances the rotor airfoil dynamic stall characteristics. The results of optimizing the OA212 rotor and 20 additional airfoils demonstrate significant improvements in the lift coefficients, up to 46.3% drag reduction. Numerical simulations confirm the superior aerodynamic performance of the optimized rotor compared to the baseline, showcasing the effectiveness of this DRL-based optimization approach. Zhu et al. [8] investigated a proper orthogonal decomposition (POD)-assisted inverse design optimization method for cascade airfoils, addressing a key limitation of existing inverse design techniques. By leveraging POD, this method automatically obtains an optimal pressure distribution via direct design optimization, showcasing its effectiveness in enhancing the aerodynamic performance of compressor cascade airfoils. Guo et al. [9] studied the impact of periodic turbulence and pressure fluctuations on the heat transfer over the suction surfaces of a specific row of rotor blades. The study compared numerical results with experimental data, revealing significant impacts on the heat transfer performance, particularly near shock waves on the fore suction surface and due to turbulence on the rear suction surface. Phase shifts in the pressure and heat transfer parameters suggest influences from turbulence migration and wake passage across the airfoil. El-Gendi et al. [10] used DDES to simulate a turbine cascade flow, validating the results against experimental data, and proposed a novel trailing edge (TE) shape with equidistant microtubes connecting the pressure and suction surfaces. This hybrid TE design, combining passive and active control, altered the pressure traces, maintained the load, increased the base pressure by 0.7%, and reduced the overall loss by 3%.
The blade strip theory is a useful tool for predicting the performance of axial-flow fans because it allows engineers to estimate the performance of a fan blade accurately without the need for expensive and time-consuming fully three-dimensional simulation and experimental testing. However, it has some limitations, as it assumes that the flow through each blade strip is two dimensional, which may not be accurate in some situations. In this respect, despite the effectiveness of this approach, its applicability to partially covered low-pressure axial-flow fans, where the three-dimensional flow structure affects their performance significantly, remains questionable. Especially, the tip-leakage vortex generated in the gap region between the tip of the blade and fan housing has the most significant influence on the performance. Several studies [2,11,12] have been conducted to reduce the tip-leakage vortex and improve the entire performance of axial-flow fans. Therefore, this study investigated the design methods for axial-flow fans, with a particular focus on the cascade of airfoils approach, and assessed their applicability and limitations to axial-flow fan configurations partially covered by a shroud. Additionally, this paper proposed novel design parameterization and optimization methods based on the cascade of airfoils approach to develop efficient and optimized axial-flow fans.
2. Target Axial-Flow Fan Systems
The target of this study is the axial-flow fan unit, which forms a component of the outdoor unit of air conditioners. A previous study [2] showed that the axial-flow fan unit, consisting of an axial-flow fan and a shroud, has a significant effect on the overall performance of an outdoor unit. The target fan unit is depicted in Figure 1a, consisting of a shroud and a three-blade fan with a diameter of 380 mm. The hub-to-tip ratio of the target axial-flow fan is 0.1, a relatively low value for a typical axial-flow fan. Figure 1b shows the variation in the airfoil shapes according to a radial location in a spanwise direction, which is associated with this classification. Compared to common axial-flow fans, this fan is designed with several three-dimensional characteristics, leading to its division into three main sections represented by distinct colors in Figure 1c: the hub part (blue), mid-span part (green), and tip part (orange), which demonstrates the distribution of the pitch angles from the hub to the tip. The first section, known as the hubless part, minimizes the hub size compared to other typical axial-flow fans; thus, the target fan is referred to as a hubless fan. Due to the unusual pitch angle change and low volume, this section is difficult to categorize as a fan shape that affects aerodynamic performance. The mid-span part occupies the most volume of an axial-flow fan, with a steady pitch angle decrease. Lastly, the tip-rake part features a winglet shape similar to that of an airplane winglet, called a tip-rake, designed to reduce the aerodynamic noise and tip leakage vortex. This winglet shape can control the tip vortex and tip leakage vortex at the gap region between the blade tip and shroud [2,3]. The designed operational rotation speed of the fan is 800 RPM.
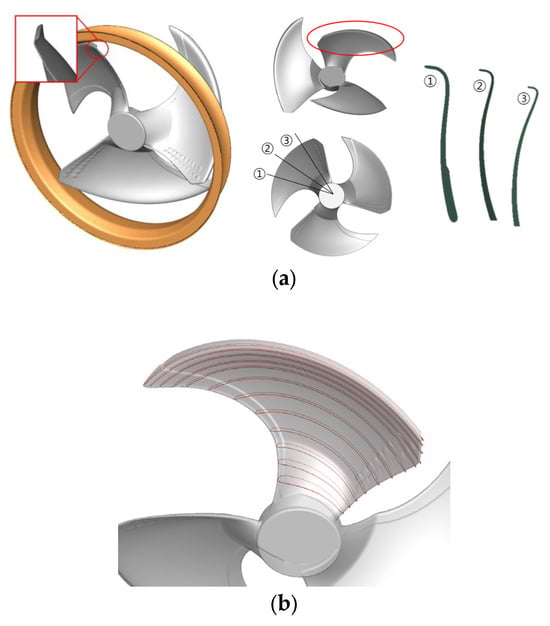
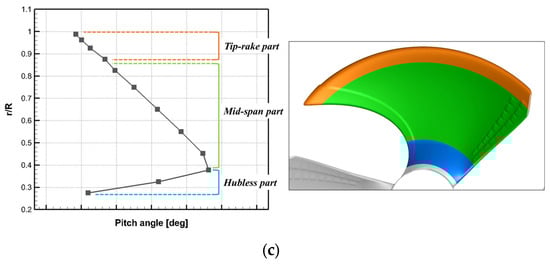
Figure 1.
(a) Geometry of the target axial-flow fan unit consisting of an axial-flow fan and shroud. (b) Configuration of the airfoils according to a radial location in a spanwise direction. (c) Detailed representation of the three-dimensional features of the target axial-flow fan with a distribution of pitch angles along a radial sectional position with three distinctive blade sections denoted by different colors.
3. Performance-Based Analysis of the Target Axial-Flow Fan Unit
3.1. Experimental Methods for Flow and Noise Performance
3.1.1. Flow Experiments
The flow performance of the target axial-flow fan system is evaluated using a fan performance tester that complies with the regulations of the Air Movement and Control Association (AMCA) 210-07 [13], as depicted in Figure 2a. The tester comprises two spacious chambers measuring 500 mm (L) × 600 mm (W) × 600 mm (H), along with five nozzles of varying sizes and two screens. The pressure differential is gauged, and the flow rate is determined using the measured pressure difference and nozzle coefficients. To ensure the uncertainty of the results, each measurement is conducted three times and averaged. The results are presented in the form of a P–Q curve, which is a characteristic curve for a fan system.
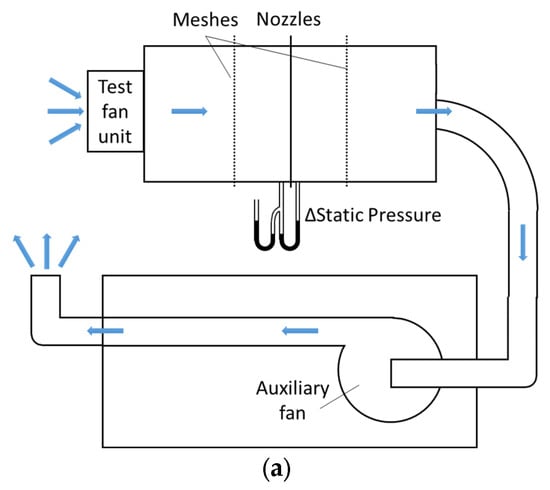
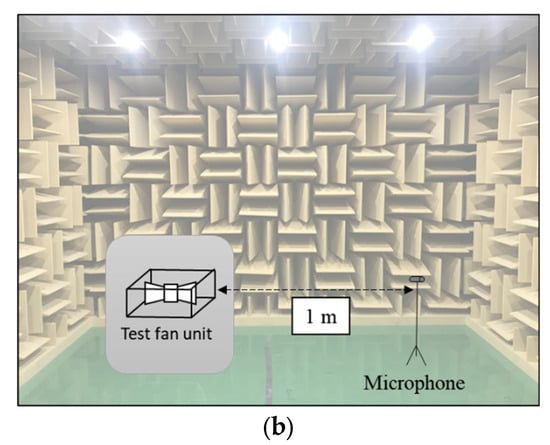
Figure 2.
Experimental setup: (a) schematic diagram of the fan performance tester and (b) noise experimental setup in an anechoic chamber.
3.1.2. Noise Experiments
To assess the noise generated by the target axial-flow fan system, a noise experiment is conducted in a semi-anechoic chamber where the sound pressure levels are measured. The experiments are conducted according to KS C 9306 [14], the national test standard for air conditioners. The acoustic pressure is measured by installing a microphone at a point 1 m away from the fan system, which is positioned in the center of the semi-anechoic chamber, as illustrated in Figure 2b. The acoustic pressure is measured at a sampling frequency of 12,800 Hz with a frequency resolution of 1 Hz. Also, the energy averaging is performed 100 times with the Hanning window function. The experimental results are used to validate the numerical method for predicting the flow field and aeroacoustic noise of the target fan system, as described in the next section.
3.2. Numerical Analysis of the Target Axial-Flow Fan System
3.2.1. Numerical Methodology
To simulate the flow performance of the target axial-flow fan system, three-dimensional incompressible unsteady Reynolds-averaged Navier–Stokes (URANS) equations are used as the governing equations:
These equations are numerically solved using the finite volume method based on unstructured meshes. The Re-Normalization Group (RNG) k-ε model is employed as a turbulence model that has been shown to be well adapted to flows with complex swirling and secondary separation, such as vortex flows and flows driven by axial-flow fans [15]. The standard wall function is used as a wall treatment method, and the first-order upwind scheme is used to discretize the turbulent kinetic energy and dissipation rate equations. The second-order upwind discretization scheme is used to discretize the momentum term, and the SIMPLE scheme is used to solve the pressure–velocity coupling equations. The first-order implicit method is selected for the transient discretization. To simulate the unsteady flows due to the rotating fan blades, the sliding mesh technique is used. All these numerical methods are implemented using the commercial CFD solver of ANSYS Fluent, version 19.1. The Ffowcs Williams and Hawkings (FW–H) equation is used as an acoustic solver in the following form:
The surface and volume integral terms in Equation (3) can be used to predict the density fluctuation. The surface integrals, which are the first and second terms on the right-hand side of Equation (3), correspond to the monopole and dipole acoustic sources, respectively. The volume integral is the third term on the right-hand side of Equation (3), and it represents the contributions from quadrupole sources that are typically negligible for low Mach number flows. For this study, as depicted in Figure 3, the fan blade and housing shroud surfaces are selected as the source integral surfaces for the FW–H equation. These impermeable integral surfaces evaluate the monopole and dipole terms, while the quadrupole terms are disregarded.
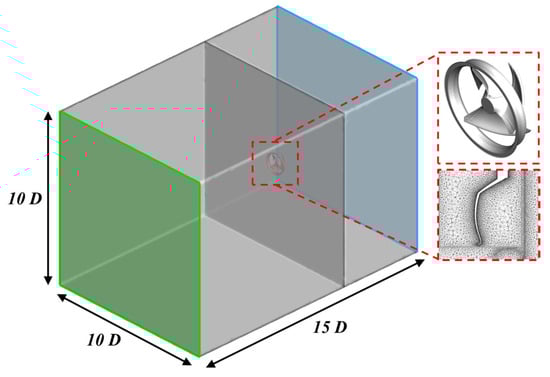
Figure 3.
Dimensions of the virtual fan tester with details of the fan blades and shroud used as the integral impermeable surface for the FW–H equations.
3.2.2. Validation of Numerical Methods
In this study, a virtual fan performance tester is conceptualized as the computational region, aiming to enhance the precision of the numerical simulations. The geometry of this computational region mimics that of a rectangular duct, proportionally scaled according to the diameter of the fan, as depicted in Figure 3. The dimensions of the computational domain are judiciously chosen to ensure ample space. The boundary conditions are strategically defined to emulate the actual experimental setup of the fan performance test. At the inlet and outlets of the domain, pressure boundary conditions are imposed, replicating the conditions encountered during experiments. This involves manipulating the pressure levels to establish a pressure differential between the inlet and outlet across the entire domain. Additionally, the remaining surfaces within the field are designed as non-slip walls to encompass a comprehensive simulation environment. Prior to the validation of the numerical methods used in the current study, a grid refinement study is carried out at the operational pressure condition of the target fan system, specifically at a rotational speed of 800 RPM. The outcomes of this grid refinement analysis are presented in Figure 4, showing the variation in the relative error of the predicted volume flow rate with respect to the actual measured value, versus the total count of grids employed. It is observed that as the grid number is augmented, the relative error progressively diminishes and ultimately converges, particularly in cases characterized by more than 16 million grids. Guided by these results, the subsequent numerical simulations are executed by employing approximately 16 million grids. This selection of the grid count is motivated by the intention to strike a balance between simulation accuracy and computational expenditure, thus circumventing the need for excessively high computational costs.
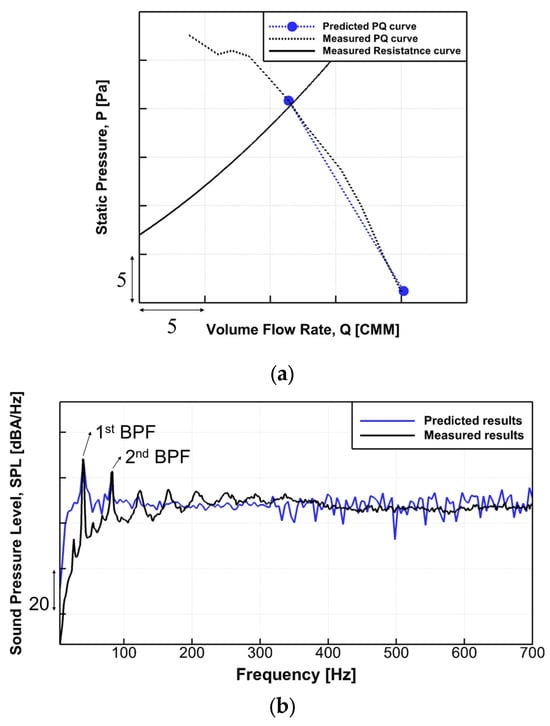
Figure 4.
Comparison to confirm the validity of the numerical methods: (a) comparison of the predicted volume flow rate (blue line) under two given pressure conditions with the measured P–Q curve (dotted-black line) and (b) comparison of the predicted sound pressure spectral density (blue line) with the measured sound pressure spectral density (black line) at a location 1 m away from the rotating center of the fan.
To validate the accuracy of the numerical techniques and the appropriateness of the computational setup, a comparative analysis is conducted against the experimental outcomes. The comparison of the predicted and experimental P–Q curves, illustrated in Figure 4a, demonstrates a notable concordance between the numerical predictions and experimental observations. This alignment is substantiated by relative errors spanning from 0.6% to 6.6%, implying a robust agreement between the two sets of results.
The prediction of the aeroacoustics noise emitted from the target fan system is conducted in this study using the FW–H integral equation, and the results are presented in the form of a time history of the acoustic pressure. The predicted acoustic pressure is then transformed into the frequency domain using the Fast Fourier Transform (FFT). The time step size is determined in accordance with a sampling frequency of 4800 Hz and a frequency resolution of 3.3 Hz. After the data set has sufficiently converged, a total of four full revolution of data are processed, with a frequency resolution of 3.3 Hz. Figure 4b displays the predicted spectral density spectrum of the sound pressure level alongside the experimental results, with a relatively low target frequency range due to the Blade Passage Frequency (BPF) of 41.67 Hz. However, for the noise experiment, the outer casing and an axial-flow fan of the outdoor unit are used, as it is difficult to extract and fix only the fan and shroud in the same area as the numerical analysis. Despite this difference, there is good agreement between the two results, especially at the BPF components. The broadband components exhibit relatively poor agreement between the two results, which can be attributed to the limitation of the Reynolds-averaged Navier–Stokes (RANS) model used for the flow simulation in resolving the turbulence that causes broadband noise. The use of a more resolved model, such as Large Eddy Simulation (LES), improves the accuracy of the numerical simulation in the high-frequency range. However, the goal of this study is to develop a systematic design method for axial-flow fans, and we do not pursue further study to improve the accuracy of the numerical simulation in the high-frequency range. Additionally, the difference between the predicted overall sound pressure level and the experimental results is observed at approximately 1.9 dBA.
3.2.3. Aerodynamic Performances along the Spanwise Direction of the Blade
To conduct a more quantitative analysis of the aerodynamic performance of the axial fan unit, the aerodynamic loading and efficiency are evaluated. Firstly, the blade is divided into 12 strips in the spanwise direction, as depicted in Figure 1b. The efficiency is computed using the following equation:
where is the thrust force, is the axial velocity, is the torque, is the angular velocity, and is the area of the blade for each strip. The efficiency of a fan blade is calculated by integrating the ratio of the input power and output power from each strip over the blade and throughout one revolution of the fan.
The thrust and torque are fundamental indicators for understanding the aerodynamic behavior of a fan. The thrust represents the force with which the aerodynamic loading of the fan expels the airflow. Essentially, it quantifies the fan’s ability to move air efficiently. This thrust is closely tied to the flow rate of the air being moved; as the flow rate increases, so does the thrust. On the contrary, the torque serves as a counteracting force that hampers the performance of the fan. It acts as a resistance, impeding the ability of the fan to operate optimally. This torque is inversely proportional to the static efficiency of the fan. Static efficiency refers to how effectively the fan converts the mechanical power input into the desired aerodynamic output. The findings depicted in Figure 5 provide a detailed analysis based on these crucial parameters. Notably, the blade’s three-dimensional shape contributes to a significant variation in the thrust and torque, particularly near the blade tip. This variation results from the complex interactions between the airflow and the intricate geometry of the blade tip. At the midpoint of the blade, an interesting phenomenon is observed. Both the thrust and torque experience a distinct and consistent rise. This part of the blade appears to hold a more significant influence over the overall fan performance compared to other sections. It is also seen that an abrupt change in the efficiency occurs around the location of r/R = 0.37, which is related to the specific shape attributes in the hubless portion of the blade. However, despite these changes, the hubless region’s contribution to the overall performance and efficiency remains negligible due to its relatively small surface area. These results confirm the pivotal role of the mid-span part of the blade in imparting the flow loadings of both the thrust and torque. Given the importance of the influence of the mid-span section on the performance of the fan, it is determined to be the optimal design area. This choice is pivotal in subsequent steps, particularly the two-dimensional cascade analysis detailed in the following section. It highlights the intricate interplay of the thrust, torque, and fan performance along the blade spanwise direction, identifying key regions of influence and ultimately guiding the design process for improved efficiency and performance.
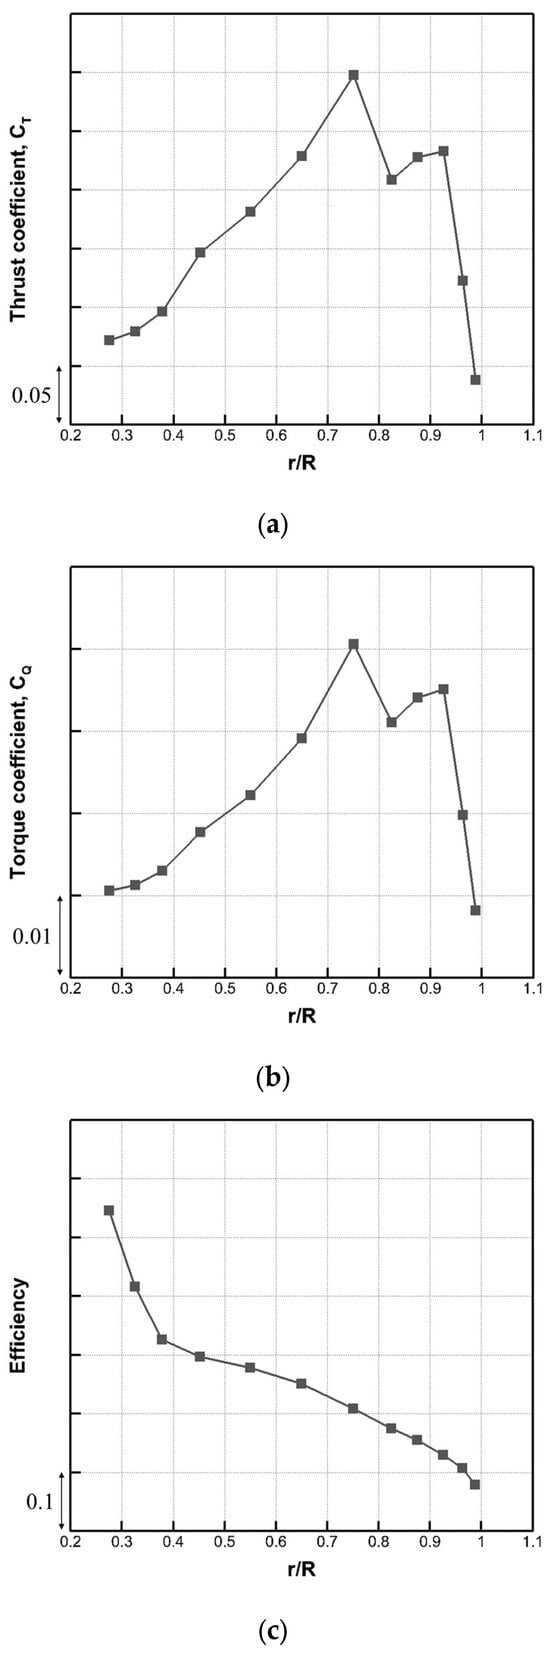
Figure 5.
Area-weighted averaged distribution of the (a) thrust coefficient, (b) torque coefficient, and (c) efficiency along the spanwise direction of the blade.
4. Development of a Performance-Based Design Method Using Airfoil Cascades
4.1. Design Parameters for the Optimum Design of Airfoils
To enhance the operational efficiency of the current fan configuration, a systematic approach is employed to optimize the geometry of the airfoil blades. This optimization is conducted through a rigorous two-dimensional airfoil cascade analysis. Specifically, the focal region for the optimization lies in the mid-span segment of the blade, as depicted in Figure 6. The selection is made based on the predicted streamline analysis, resulting in the identification of three crucial strips located at the radial positions of r/R: 0.45, 0.65, and 0.8. The inlet and outlet camber angles establish the primary design parameters that govern the airfoil shape. These angles play a critical role in regulating the inflow conditions, mitigating adverse pressure gradients along the suction surface of airfoil and managing the formation of trailing edge vortices. The optimization procedure utilizes the central composite design response surface methodology to determine the optimal combination of design parameters that results in enhanced performance.
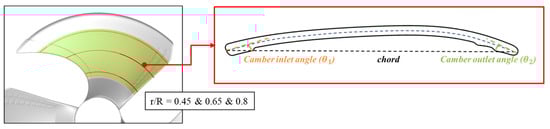
Figure 6.
Three radial strips of the blade and the design parameters of the sectional airfoil for optimization.
The response surface methodology (RSM) has been developed based on the research conducted by Box and Wilson [16]. A wide range of research publications and academic textbooks explore the foundational principles of the RSM [17,18,19,20,21]. Operating as a collection of mathematical and statistical techniques, the RSM operates with the purpose of analyzing lies in optimizing the relationships between the response variables and a set of quantitative experimental variables or factors. Under the assumption of being differentiable times, the Taylor polynomial of degree is employed to approximate the function within a local vicinity of a point. Practical considerations limit the use of polynomials exceeding the second degree. This second-order model effectively approximates the response surface in a localized domain centered around a point of interest. The mathematical relationship between the expected response value and the experimental variables is of great importance when determining the optimal operating conditions to achieve a maximum yield. The toolkit of the RSM serves multiple purposes, encompassing the identification of factor settings that yield the desired responses, alignment of factors with management specifications, and the construction of models illustrating the nexus between the quantitative aspects and responses. Central composite designs (CCDs) emerge as the most prevalent response surface designs [22,23,24,25]. In two dimensions, CCDs incorporate factorial points (, where denotes the number of factors, each featuring two levels), axial points (positioned at a specific alpha from the design centre along each axis, designed to capture curvature, ), and the center point (typically 5 in a number of = 2). The aggregate of the factorial, axial, and center points determines the total number of experimental runs, amounting to 13 (4 + 4 + 5) for designs involving . In the context of response surface designs, distinct low and high levels (− and +) are defined for each factor. The experimental setup is outlined in Table 1, where the independent variables are specified alongside their respective levels—these levels, spanning approximately 7 degrees from the prevailing design value, factor in the geometrical constraints. The objective function adopted to gauge the performance for optimization is the lift-to-drag (L/D) ratio. The relationship between the lift force produced by the airfoil and the drag force opposing the forward motion of the airfoil through the flow is denoted by the L/D. Prior to reaching the stall condition, a higher L/D typically denotes better efficiency in producing lift with less resistance or drag. To facilitate experimentation, a total of 13 cases are simulated for each radial strip as part of the design of experiments (DOE). Upon employing the RSM, the outcomes are often expressed through a fully quadratic regression equation, as demonstrated in the subsequent equation:
where is the dependent variable, is the regression constant, k is the number of independent variables, and x is the independent variable.

Table 1.
Range of design parameters and their representative levels used in the RSM.
4.2. Numerical Method for a Two-Dimensional Airfoil Cascade Analysis
Figure 7a depicts the procedure for extracting a cascade of airfoils from the blades at a constant radius. To simulate the circumferential and axial flows generated as the fan rotates, the extracted cylindrical area at the constant radius is used as the computational domain for the two-dimensional simulation using the cascade of airfoils, as shown in Figure 7b. Using the extracted computational domain, a two-dimensional simulation is conducted based on the same numerical method as the three-dimensional analysis of the governing equation and turbulence model. To simulate the three-dimensional rotating flow as a two-dimensional virtual finite cylindrical space, a periodic boundary condition is imposed on the vertical lines at both ends of the computational domain. Furthermore, the discharged flow is simulated via the pressure boundary conditions at the lowest horizontal line as an outlet. The inlet boundary condition is given in the form of a velocity vector to simulate the inflow with an angle of attack, as shown in Figure 7c. The value of the inlet velocity condition is determined from the three-dimensional numerical results described in the previous section.
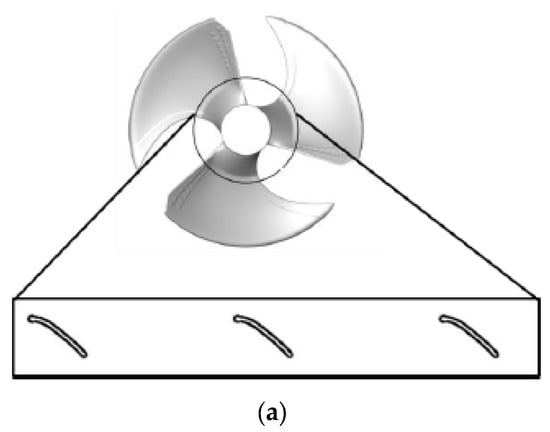
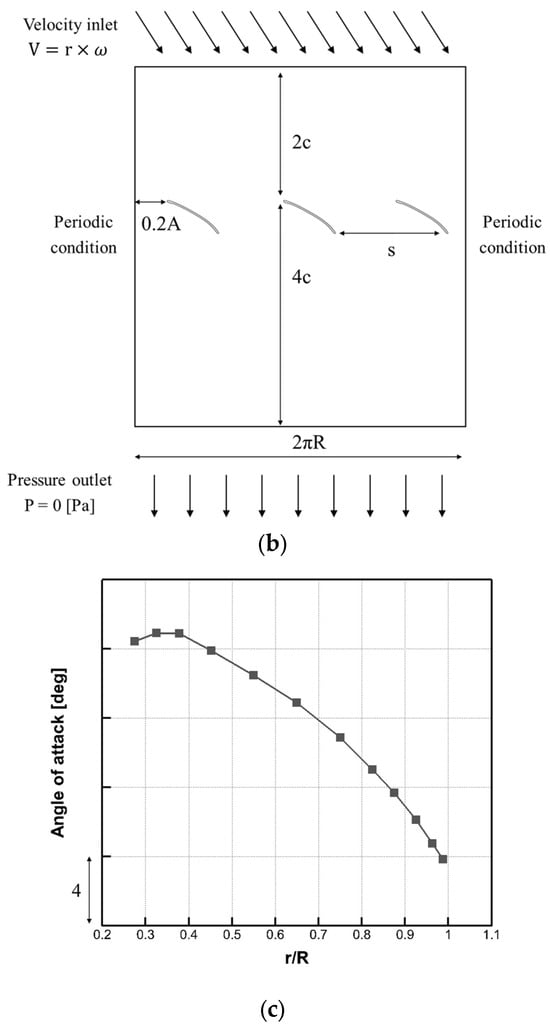
Figure 7.
(a) Schematic view of a geometrical process for extracting the cascade of airfoils using the cylindrical section, (b) computational domain of the cascaded airfoils designed for the two-dimensional simulation, and (c) distribution of the angle of attack along the spanwise direction obtained from the three-dimensional analysis and used as an inlet boundary condition in the two-dimensional analysis.
4.3. Numerical Results
As a result of the optimization, a quadratic equation that gives the relationship between the design parameters and the objective function is obtained in the following form:
The response equation for the radial strip for r/R = 0.45, 0.65, and 0.8, respectively, is shown in matrix form by row in Equation (6). In all the selected radial strips, the results indicate that the camber inlet angle significantly affects the L/D more than the camber outlet angle. The regression equations of Equation (6) are shown visually in Figure 8 as two- and three-dimensional contour plots and three-dimensional graphs, respectively, showing the response surfaces. The contour plots indicate all the relationships between the camber inlet angle, camber outlet angle, and L/D. Plotting the response surface to the design variable and L/D in three dimensions reveals a gradient trend comparable at all the current design points and a propensity to decline in a particular direction. Additionally, the surface has a significant curvature, particularly at the design point when r/R = 0.65 occurs. The optimal point of the design parameter can be represented in two-dimensional contour plots, where the dark area indicates the significant value of the objective function within the range of the design parameter. The lower right corner of each target’s contour plot displays the darkest area. This indicates that a higher camber inlet angle corresponds to a lower camber exit angle, which raises the L/D value. Furthermore, Figure 9 illustrates the association between each design parameter and the objective function through XY graphs. When the camber inlet angle grows and the camber outlet angle drops compared to those of the existing airfoils, the XY plots verify that the value of the design variable attains the maximum value of the L/D.
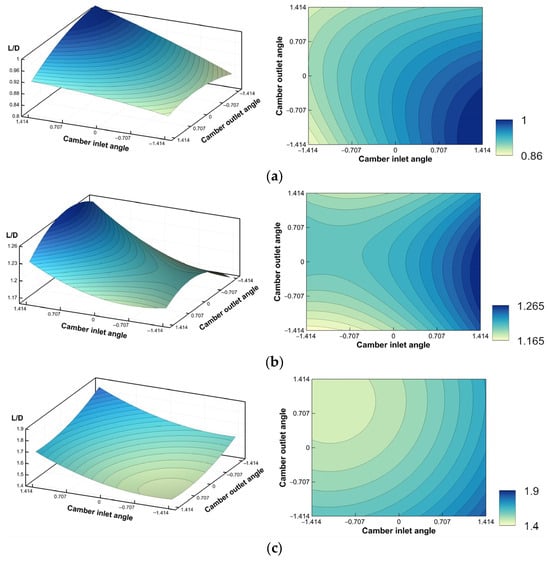
Figure 8.
Iso-contour plots of the response surface at the target radial strip with a three-dimensional (left) and two-dimensional view (right): (a) r/R = 0.45, (b) r/R = 0.65, and (c) r/R = 0.8.
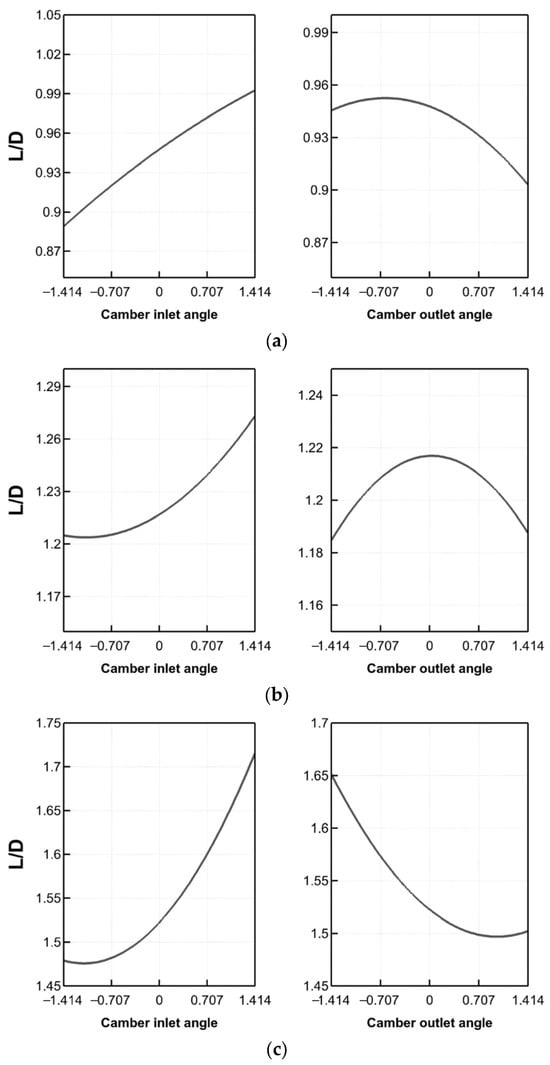
Figure 9.
XY plots of the response surface at the target radial strip: (a) r/R = 0.45, (b) r/R = 0.65, and (c) r/R = 0.8.
Figure 10a shows the airfoil shapes obtained by optimizing the camber inlet and outlet angles. The figure illustrates the optimized airfoil form with a red line, contrasting it with the original airfoil design represented by a black line. Remarkably, a tendency is found in all three design radial positions; the maximum camber positions rise in the direction of the leading edge. The constraint of the design process is to maintain a fixed airfoil thickness throughout. The camber angles are adjusted to ensure that the thickness remains constant. This approach allows us to preserve the critical aerodynamic characteristics while optimizing other aspects of the airfoil geometry. A comprehensive two-dimensional numerical analysis is conducted to validate the efficacy of these optimized airfoils. Figure 10b displays the numerically predicted L/D values obtained by comparing the optimized and original airfoils. Figure 10b demonstrates a significant enhancement in the L/D ratio for the improved cascaded airfoils compared to the original ones across all the design radial strips. The important performance metric grew by about 20% on average. This highlights the effectiveness of the proposed design technique in improving the aerodynamic efficiency of airfoil profiles while maintaining their fixed thickness.
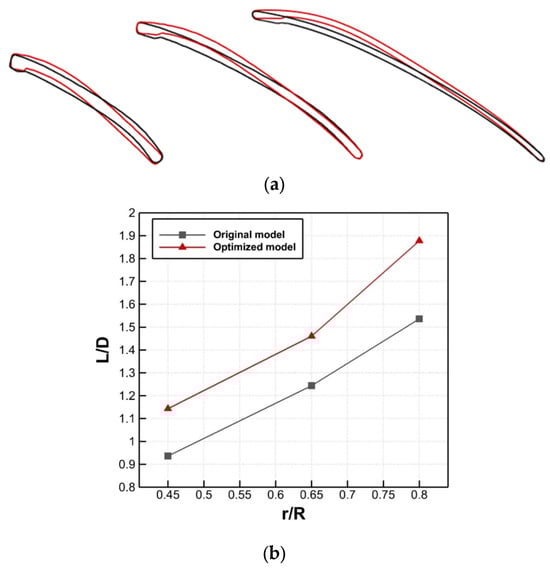
Figure 10.
(a) comparison of the geometry between the original (black line) and optimized (red line) airfoils and (b) comparison of the lift-to-drag ratio between the original and optimized airfoils.
Figure 11 compares the static pressure distribution of the original and optimized configurations of the cascade airfoils. Compared to the original airfoils, it can be seen that the optimized airfoils generate a significant pressure difference between the pressure side and suction side of the airfoils over the entire target radius area. The increase in the pressure difference implies an increase in the flow momentum due to the increase in the camber inlet angle and, consequently, an increase in thrust. It can also be seen that the distribution of pressure occurring close to the leading edge of the airfoils results in short low-pressure sections for the original airfoils, which in turn results in a decrease in flow, causing flow separation.
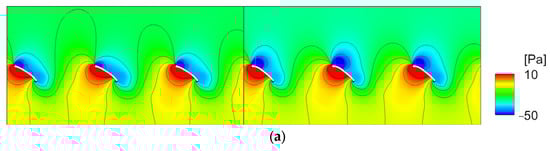
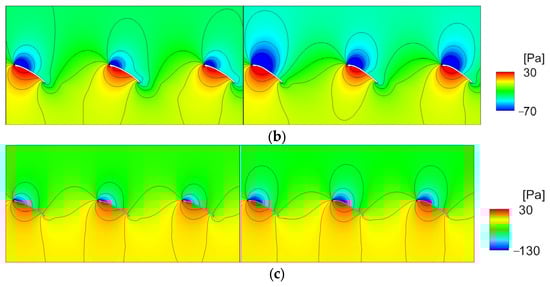
Figure 11.
Comparison of the iso-contours of the static pressure at a radial strip of the original model (left) and optimized model (right): (a) r/R = 0.45, (b) r/R = 0.65, and (c) r/R = 0.8.
Figure 12a presents a comprehensive depiction of the contours showing the velocity magnitude around the single airfoil in the cascade. Flow acceleration is detected beyond the leading edge of the original airfoil, which is followed by separation shortly afterwards. An adverse pressure gradient is created over the airfoil surface as a result of this separation, which can, in severe circumstances, cause aerodynamic stalls. Other effects include decreased lift and increased drag forces. By effectively delaying the separation of the boundary layer, the increased camber inlet angle of the optimized airfoils reduces the drag and turbulence. Moreover, the results of the vorticity magnitude contours shown in Figure 12b demonstrate the existence of coherent vortex shedding in the vicinity of the trailing edge of the original airfoil. The increased intensity of the vortex is recognized for its capacity to generate greater aerodynamic noise.
Figure 12.
Comparison of the contours around one airfoil of the cascaded airfoils between the original (left) and optimized (right) of r/R = 0.45: (a) velocity magnitude and (b) vorticity magnitude.
It is necessary to perform precise adjustments to the camber inlet and outlet angles to address flow issues such as vortex shedding, turbulence in the boundary layer, and adverse pressure gradients. Also, the augmented camber inlet angle, in conjunction with the elevated static pressure differential, lowers the drag and enhances the lift forces.
5. Validation of the Redesigned Axial-Flow Fan
In order to enhance the overall performance of the three-dimensional fan, the optimized airfoil shapes obtained from the cascade of airfoil simulation are stacked onto each target strip. This stacking process generates intermediate fan shapes through interpolation between the three airfoil shapes. To evaluate the improved performance of the modified axial-flow fan and verify the two-dimensional cascade method described in the previous sections, a comprehensive analysis is carried out. Utilizing the same methods as previously outlined, this examination includes both numerical and experimental evaluation.
5.1. Numerical Validation
To validate the improved performance of the redesigned fan, a three-dimensional CFD analysis is conducted, with the results summarized in Table 2 and Table 3. The analysis reveals several noteworthy findings. First, the redesigned fan exhibits a notable increase in the volume flow rate, with a gain of approximately 2.3% compared to the original design. Second, the aerodynamic performance of the redesigned fan demonstrates a substantial enhancement, focusing on calculating the averaged force distribution along the spanwise direction of the blade. As illustrated in Figure 13a, it is observed that there is a slight increase in the thrust of the optimized fan, which leads to an increase in the output power of 7%. Also, a substantial reduction in the torque is evident within the designated target radial range for the optimized fan. This reduction in the torque is instrumental in decreasing the input power by 9% and subsequently elevating the overall efficiency of the optimized fan, which outperforms the original fan by a significant margin. Notably, the efficiency of the optimized fan is increased by 17%, particularly prominent in the regions corresponding to 0.4 < r/R < 0.9, which aligns with the target radial regions identified in the two-dimensional cascade analysis. These findings underscore the successful optimization of the fan’s performance, with the most substantial gains realized in the specified radial regions of interest. Third, in addition to its improved performance metrics, the redesigned fan also yields a reduction in the overall sound pressure level, registering a decrease of approximately 10.8 dBA compared to the original fan. These findings collectively underscore the successful application of the present design procedure in optimizing the fan’s flow performance, efficiency, and acoustic characteristics.
Table 2.
Comparison of the volume flow fan, and the overall sound pressure level computed for the two fan models.
Table 3.
Comparison of the input power, output power, and efficiency computed for the two fan models.
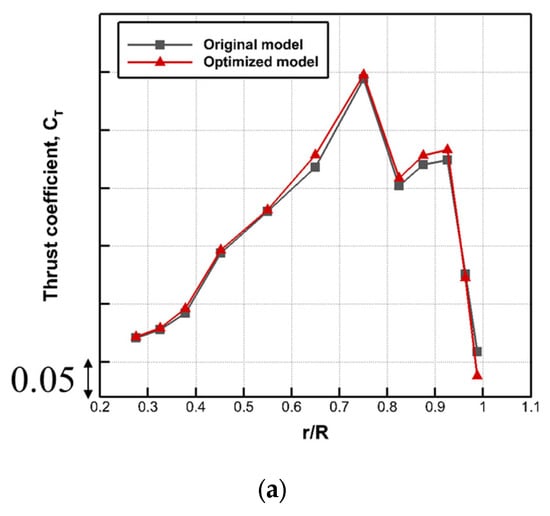
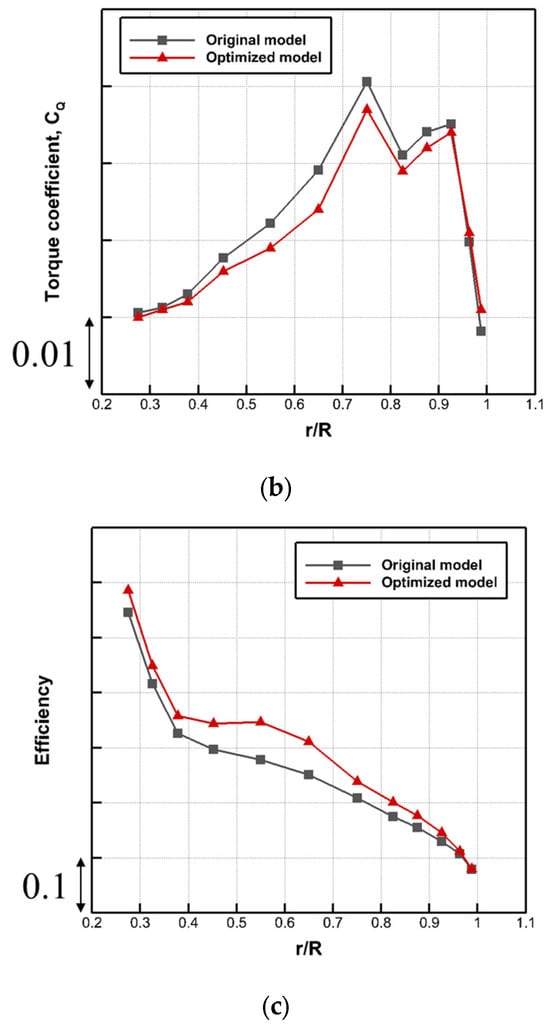
Figure 13.
Area-weighted averaged force distribution along the spanwise direction of the blade: (a) thrust coefficient, (b) torque coefficient, and (c) efficiency.
Further analysis is performed to study the detailed flow structure, resulting in the improved flow and noise performance of the optimized fan. To verify if the angle of attack considered for the airfoil cascade simulations matches the application in the redesigned three-dimensional fan, Figure 14a compares the angle of attack distribution between the two models. An apparent discrepancy between the two outcomes is noted; however, the overall trajectory of the angle of attack for the optimized fan closely resembles that of the original fan. The complex three-dimensional flow features that were overlooked in the two-dimensional cascade study are the cause of this difference.
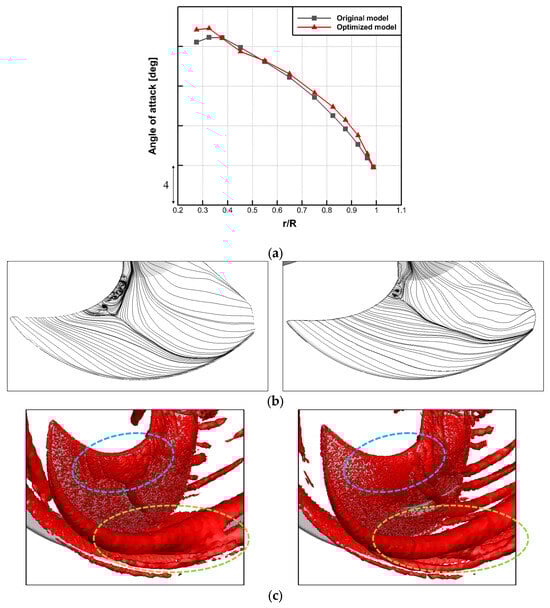
Figure 14.
(a) Distribution of the angle of attack along the spanwise direction of the blade for the two fan models, (b) time-averaged streamline of the wall shear stress on the suction surface of the blade of the original model (left) and optimized model (right), and (c) iso-contours of the Q-criterion with the tip vortex (green-dotted circle) and the tip leakage vortex (blue-dotted circle) around the suction surface of the blade of the original model (left) and optimized model (right).
Figure 14b displays the time-averaged streamline, which accurately illustrates the distribution of the wall shear stress. It precisely identifies the location of separation and transition in the laminar-turbulence boundary layer [26,27]. It is confirmed by comparing the two fan designs that the original fan had many eddy currents close to the leading edge and that a separation point could be seen rather far from the leading edge. Moreover, the flow through the leading edge and along the camber line directed itself toward the tip of the blade, intensifying the tip vortex. On the other hand, the optimized fan arrangement shows a decrease in the occurrence of small swirling flows near the leading edge and a movement of the point where the airflow separates closer to the leading edge. Furthermore, the flow distribution in the direction of the trailing edge, as opposed to the previous convergence toward the point, promotes a more uniform circumferential flow. Figure 14c presents the Q-criterion [28] as a three-dimensional iso-contour, providing a more accurate representation of the flow field. As shown in the cascade simulations, the densely concentrated vortex structure on the leading edge of the original fan decreases, and the total extent of the structure is slightly reduced. This observation implies that although the tip vortex is predominantly influenced by the three-dimensional tip shape, the aerodynamic loading in the vicinity of the tip is also impacted by the aerodynamic loading in the mid-span region.
In the final step, the aeroacoustics performance is evaluated by calculating the FW–H equations, as explained in the previous section. Notably, the data in Figure 15 highlight a reduction in the sound pressure levels across the entire frequency range for the optimized fan compared to the original fan. This reduction is particularly pronounced at the BPFs, where the rotating flow induced by the axial-flow fan generated a tonal noise component, with a reduction of approximately 10.8 dBA. Importantly, these findings from our three-dimensional simulations align with the trends predicted by our earlier two-dimensional cascade analysis. This numerical confirmation underscores the viability of employing two-dimensional cascade analysis as a robust technique for designing three-dimensional axial-flow fans, validating its effectiveness in predicting and improving the aeroacoustics performance.
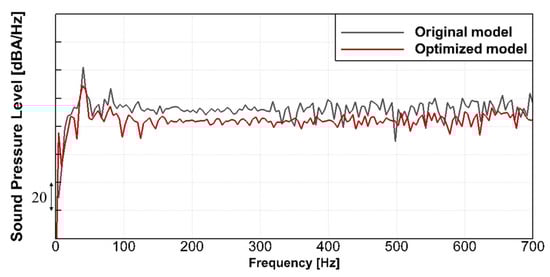
Figure 15.
Comparison of the acoustic performance between the original fan model and optimized fan model: power spectral density spectrum of the predicted sound pressure level.
5.2. Experimental Validation
To validate the performance of the optimized axial-flow fan, the flow and noise experiments are conducted using the manufactured prototype of the fan. Table 4 shows the experimental results, which include critical performance factors such as the volume flow rate, power consumption, and overall sound pressure level. The optimized fan shows an increase in the volume flow rate of 1%, demonstrating greater air transport capabilities. Notably, the power consumption is lowered by approximately 8%, which is significant. Power consumption is inversely proportional to fan efficiency. Therefore, a considerable reduction in power consumption indicates a significant gain in efficiency. Finally, it is discovered that the overall sound pressure level of the optimized fan dropped by 1.5 dBA, indicating that the noise propagated from the optimized fan was reduced. These experimental results confirm and validate the anticipated improvements from the prior three-dimensional numerical study. The consistency between the numerical and experimental results underlines the applicability of the currently proposed design strategy in improving fan performance aspects such as the aerodynamic and aeroacoustic performance.
Table 4.
Comparison of the volume flow fan, overall sound pressure level, and power consumption measured for the two fan models.
6. Conclusions
This study developed a performance-based design technique for an axial-flow fan unit using the cascade of airfoils. The existing target fan system was experimentally analyzed to establish a performance prediction baseline. Three-dimensional CFD techniques were used to conduct numerical studies, and the results were compared with the experimental results to validate the numerical analysis. The present study both quantitatively and qualitatively established that the mid-span section plays a pivotal role in influencing the overall aerodynamic performance, spanning from the hub to the tip of the fan blade. It underscored the critical importance of optimizing the cross-sectional airfoil shape in this mid-span region. Subsequently, additional numerical analysis was conducted, utilizing a two-dimensional cascade cross-section to optimize the airfoil shape within the cross-section of the blade. Through rigorous investigation, optimal values for each design parameter were derived, ultimately leading to the realization of an optimized three-dimensional axial-flow fan by applying these refined airfoil shapes. Three-dimensional numerical analysis yielded compelling results, showing a notable enhancement in the flow rate performance of approximately 2%, a significance increase in the efficiency of 17%, and a remarkable reduction in the noise levels of 10.8 dBA. A redesigned three-dimensional axial-flow fan was manufactured, and comprehensive experiments were carried out to provide experimental validation. These experiments consistently affirmed the improvements in the flow performance, demonstrating an increase of approximately 1%, and a reduction in power consumption of 8%, along with a reduction in the noise levels of 1.5 dBA. These experimental findings confirmed the outcomes of the three-dimensional numerical results. Collectively, these findings unequivocally underscore the feasibility and applicability of our axial-flow fan design methodology, employing the two-dimensional cascade approach to enhance the performance of three-dimensional axial fans. This study opens up new avenues for optimizing the performance of axial-flow fans and contributes significantly to the field of fan design and aerodynamics.
Author Contributions
Conceptualization, methodology, supervision, writing—review and editing, C.C.; software, validation, investigation, writing—original draft preparation, S.-Y.R.; resources, data curation, visualization, J.W.K.; resources, data curation, visualization, B.I.P. All authors have read and agreed to the published version of the manuscript.
Funding
Following are results of a study on the “Leaders in INdustry-university Cooperation 3.0” Project, supported by the Ministry of Education and National Research Foundation of Korea.
Institutional Review Board Statement
Not applicable.
Informed Consent Statement
Not applicable.
Data Availability Statement
The data presented in this study are available in the article.
Conflicts of Interest
Authors Jong Wook Kim and Byung Il Park were employed by the company LG Electronics. The remaining authors declare that the research was conducted in the absence of any commercial or financial relationships that could be construed as a potential conflict of interest.
References
- Smith, M.; Komerath, N.; Ames, R.; Wong, O.; Pearson, J. Performance analysis of a wing with multiple winglets. In Proceedings of the 19th AIAA Applied Aerodynamics Conference, Anaheim, CA, USA, 11–14 June 2001; p. 2407. [Google Scholar] [CrossRef]
- Ghodake, D.; Sanjosé, M.; Moreau, S.; Henner, M. Effect of sweep on axial fan noise sources using the Lattice Boltzmann Method. Int. J. Turbomach. Propuls. Power 2022, 7, 34. [Google Scholar] [CrossRef]
- Park, S.M.; Ryu, S.-Y.; Cheong, C.; Kim, J.W.; Park, B.I.; Ahn, Y.-C.; Oh, S.K. Optimization of the Orifice Shape of Cooling Fan Units for High Flow Rate and Low-Level Noise in Outdoor Air Conditioning Units. Appl. Sci. 2019, 9, 5207. [Google Scholar] [CrossRef]
- Ryu, S.-Y.; Cheong, C.; Kim, J.W.; Park, B.I.; Park, S.M. Numerical and experimental investigation into effects of winglet shape on flow and noise performances of axial-flow fans for outdoor unit of air conditioner. Int. J. Refrig. 2023, 150, 225–238. [Google Scholar] [CrossRef]
- Tian, C.; Liu, X.; Wang, J.; Xi, G. Effects of bionic blades inspired by the butterfly wing on the aerodynamic performance and noise of the axial flow fan used in air conditioner. Int. J. Refrig. 2022, 140, 17–28. [Google Scholar] [CrossRef]
- Zhang, Q.; Ma, H.; Zhong, Y.; Guo, J.; Xie, Z. Effects of the airfoil probes on the aerodynamic performance of a transonic compressor cascade. Aerosp. Sci. Technol. 2023, 136, 108227. [Google Scholar] [CrossRef]
- Liu, J.; Chen, R.; Lou, J.; Wu, H.; You, Y.; Chen, Z. Airfoils optimization based on deep reinforcement learning to improve the aerodynamic performance of rotors. Aerosp. Sci. Technol. 2023, 143, 108737. [Google Scholar] [CrossRef]
- Zhu, Y.; Ju, Y.; Zhang, C. Proper orthogonal decomposition assisted inverse design optimisation method for the compressor cascade airfoil. Aerosp. Sci. Technol. 2020, 105, 105955. [Google Scholar] [CrossRef]
- Guo, L.; Yan, Y.; Sun, W.; Zhu, J. Numerical investigation of flow unsteadiness and heat transfer on suction surface of rotating airfoils within a gas turbine cascade. Propuls. Power Res. 2017, 6, 91–100. [Google Scholar] [CrossRef]
- El-Gendi, M.M.; Ibrahim, M.K.; Mori, K.; Nakamura, Y. Novel flow control method for vortex shedding of turbine blade. Trans. Jpn. Soc. Aeronaut. Space Sci. 2010, 53, 122–129. [Google Scholar] [CrossRef]
- Lee, H.; Park, K.; Choi, H. Experimental investigation of tip-leakage flow in an axial flow fan at various flow rates. J. Mech. Sci. Technol. 2019, 33, 1271–1278. [Google Scholar] [CrossRef]
- Heo, S.; Ha, M.; Kim, T.-H.; Cheong, C. Development of high-performance and low-noise axial-flow fan units in their local operating region. J. Mech. Sci. Technol. 2015, 29, 3653–3662. [Google Scholar] [CrossRef]
- ANSI/AMCA 210-07; Laboratory Methods of Testing Fans for Certified Aerodynamic Performance Rating. ANSI: Washington, DC, USA, 2008.
- KS C 9306; Room Air-Conditioners. Korean Standards Association: Seoul, Republic of Korea, 2002.
- Yakhot, V.; Orszag, S.A. Renormalization group analysis of turbulence. I. Basic theory. J. Sci. Comput. 1986, 1, 3–51. [Google Scholar] [CrossRef]
- Box GE, P.; Wilson, K.B. On the Experimental Attainment of Optimum Conditions. J. R. Stat. Soc. Ser. B Methodol. 1951, 13, 1–38. [Google Scholar] [CrossRef]
- Khuri, A.I.; Mukhopadhyay, S. Response surface methodology. Wiley Interdiscip. Rev. Comput. Stat. 2010, 2, 128–149. [Google Scholar] [CrossRef]
- Wang, W.; Li, B.; Tan, Y.; Li, B.; Shuai, Y. Multi-objective optimal design of NACA airfoil fin PCHE recuperator for micro-gas turbine systems. Appl. Therm. Eng. 2022, 204, 117864. [Google Scholar] [CrossRef]
- Au, S.K.; Beck, J.L. Important sampling in high dimensions. Struct. Saf. 2003, 25, 139–163. [Google Scholar] [CrossRef]
- Faravelli, L. Response-surface approach for reliability analysis. J. Eng. Mech. 1989, 115, 2763–2781. [Google Scholar] [CrossRef]
- Bucher, C.G.; Bourgund, U. A fast and efficient response surface approach for structural reliability problems. Struct. Saf. 1990, 7, 57–66. [Google Scholar] [CrossRef]
- Soltani-Shahrivar, M.; Afkhami, A.; Madrakian, T.; Jalal, N.R. Sensitive and selective impedimetric determination of TNT using RSM-CCD optimization. Talanta 2023, 257, 124381. [Google Scholar] [CrossRef]
- Veza, I.; Spraggon, M.; Fattah, I.R.; Idris, M. Response surface methodology (RSM) for optimizing engine performance and emissions fueled with biofuel: Review of RSM for sustainability energy transition. Results Eng. 2023, 18, 101213. [Google Scholar] [CrossRef]
- Jafaryar, M.; Kamrani, R.; Gorji-Bandpy, M.; Hatami, M.; Ganji, D.D. Numerical optimization of the asymmetric blades mounted on a vertical axis cross-flow wind turbine. Int. Commun. Heat Mass Transf. 2016, 70, 93–104. [Google Scholar] [CrossRef]
- Kim, T.; Lim, J.; Shin, S.; Kim, D.H. Structural design optimization of a tiltrotor aircraft composite wing to enhance whirl flutter stability. Compos. Struct. 2013, 95, 283–294. [Google Scholar] [CrossRef]
- Tobak, M.; Peake, D.J. Topology of Three-Dimensional Separated Flows. Annu. Rev. Fluid Mech. 1982, 14, 61–85. [Google Scholar] [CrossRef]
- Yin, J.L.; Wang, D.Z.; Cheng, H.; Gu, W.G. Assessment of RANS to predict flows with large streamline curvature. IOP Conf. Ser. Mater. Sci. Eng. 2013, 52, 022002. [Google Scholar] [CrossRef]
- Haller, G. An objective definition of a vortex. J. Fluid Mech. 2005, 525, 1–26. [Google Scholar] [CrossRef]
Disclaimer/Publisher’s Note: The statements, opinions and data contained in all publications are solely those of the individual author(s) and contributor(s) and not of MDPI and/or the editor(s). MDPI and/or the editor(s) disclaim responsibility for any injury to people or property resulting from any ideas, methods, instructions or products referred to in the content. |
© 2024 by the authors. Licensee MDPI, Basel, Switzerland. This article is an open access article distributed under the terms and conditions of the Creative Commons Attribution (CC BY) license (https://creativecommons.org/licenses/by/4.0/).