
Classification of Motor Competence in Schoolchildren Using Wearable Technology and Machine Learning with Hyperparameter Optimization

 , and
, and
Abstract
1. Introduction
1.1. Background
1.2. Related Work
2. Materials and Methods
2.1. Methodology
2.1.1. Business Understanding
- Determination of objectives: The main goal focuses on exploring the use of smart bands and the application of machine learning optimized to promote physical activity and motor competence in schoolchildren and analyzing the potential benefits of this approach.
- Evaluation of the situation: A descriptive cross-sectional study was conducted on 764 schoolchildren (451 males and 313 females) aged 6 to 17. The sample selection was non-probabilistic by convenience. Five state schools in the city of Arequipa, Peru, were evaluated. The schoolchildren attended physical education classes twice a week. Permission was requested from each school’s administration to conduct the study in both schools. Then, parents were informed about the objective of the project. Parents who agreed to participate in the study signed the informed consent form to authorize their children’s participation.
- Determination of the goal of machine learning: At this stage, the determination will be made to apply a correct supervised machine-learning technique to determine the best algorithm that finds the best accuracy, precision, f1-score, and recall in students’ motor competence classification. A classifier is a function f that takes as input a set of features x ∈ X, where X is the feature space, and outputs a class label y ∈ {1, …, C}, where C is the class space.
2.1.2. Data Understanding
- Collection of initial data: Anthropometric measurements were conducted on-site at each school. The evaluation team comprised professional physical education teachers and research assistants. Weight and height were measured using Ross and Marfell Jones’s standardized method. To determine body weight (kg), a BC 730 (Tanita Corporation) electronic scale was used, with a scale from 0 to 150 kg. Standing height was measured using a portable stadiometer (Seca 216, Seca Gmbh and Co., Hamburg, Germany), accurate within 0.1 mm. Waist circumference (WC) was measured using a tape measure (Seca) to the nearest 1 mm. The body mass index (BMI) was calculated by dividing the kilograms of weight by the square of the height in meters: BMI = weight (kg)/height2 (m).According to the BMI Z-score, patients were classified as underweight/normal weight with Z-scores between −2 and +0.99, overweight from 1 to 1.99, obese from 2 to 2.99, and very obese ≥3 [20]. To categorize abdominal adiposity (WC) by age and sex, the suggestions described by Fernández et al. [21] were used. It was categorized into two groups (without risk < p75 and with risk > p75).The motor competence tests that were evaluated were the quantification of the number of steps during school recess, and the 6-minute walk test was performed using a smart band (Huawei band 7) with an AMOLED screen of 194 × 368 and with 1.47 inches. This smart band has been used in other similar research [22]. The smart band was placed on the wrist of each student’s hand, and its use was explained.
- Describe and explore the data: The Kolmogorov–Smirnov test verified the dataset’s normality. Descriptive statistics (mean, standard deviation, min, and max) were calculated. Table 1 shows the description of the data of the schoolchildren.
2.1.3. Data Preparation
- Data selection: Through data selection, it became feasible to identify and emphasize those fields that would provide valuable contributions to the analysis of physical activity for motor skill tests. Each data record has the following attributes within the database:
- Anthropometric data: age (years), weight (kg), height (m), sitting height (cm), and waist circumference (cm).
- Average pace: the time the person can walk a kilometer; they are a number in minutes and seconds format.
- Average cadence: these are the steps per minute you can do; they are raw numbers.
- Steps: these are all the steps the person has taken during the activity; they are raw numbers.
- Calories: the calories the person has burned during the activity; they are numbers without formats.
- Average speed: the average speed at which the person has moved during the activity in kilometers/hour; it is in number format with decimals without arrangements.
- Average stride: it is the average distance taken by each step; they are numbers without formats.
- Heart rate: these are the beats per minute the heart has given during the activity; they are numbers without formats.
- Maximum heart rate: this is the maximum number of beats per minute the individual has given in the activity; they are numbers without formats.
- Data cleaning: Data cleaning tasks allowed us to discover correct and sometimes eliminate erroneous data records or outliers and convert and standardize the data types necessary for processing in machine-learning algorithms. The Jupyter dashboard [23] was used with the Python 3 programming language, with its Pandas library; it is a rapid, robust, adaptable, and user-friendly open-source tool for data analysis and manipulation. The Seaborn library was used with its boxplot function to visualize the classes, as shown in Figure 1, where the high class has the highest proportion for both sexes. Points outside a boxplot are visual indicators of values that may be unusual or outliers compared to the rest of the data in the set.
2.1.4. Modeling
- Decision tree: A non-parametric supervised technique that constructs a classification model as a tree structure, applicable for classification and regression tasks [24].
- Random forest: It generates a set of decision trees by employing random resampling on the training set [25].
- Support vector machine: Creates effective boundaries to separate datasets by solving a constrained quadratic optimization problem [26].
- Naive Bayes: It is a probabilistic classifier based on Bayes’ theorem, assuming strong independence within attributes of an instance [27].
- Logistic regression: This type of regression analysis is used to predict the outcome of a categorical variable based on the independent or predictor variables [28]. While commonly recognized as a classifier, logistic regression can also be employed as a regressor to predict numeric values. Its adaptability allows it to address classification and regression problems, depending on the nature of the data and the analysis objectives [28].
- Neuronal network: Most current neural network applications are concerned with pattern recognition problems. Artificial neural networks consist of assemblies of perceptrons designed for multi-layer feedforward networks [29].
- K-nearest neighbors: It seeks to predict outputs by computing the distance between the test data and training points, subsequently selecting the K number of points closest to the test data [30].
- Gradient boosted: This ensemble learning technique builds and combines several weak learning models to form a more robust model. The main idea is to correct the errors of the previous model by iteratively adding soft models. It focuses on fitting the residuals of the previous model using a gradient-based approach [31].
- XGBoost: short for “eXtreme Gradient Boosting”, is a specific implementation of gradient boosting. It was developed to be fast and efficient in terms of resource usage. It includes regularization, missing value handling, and a custom cost function [32].
- LightGBM: Gradient boosting machines build sequential decision trees, with each tree constructed based on the errors of the preceding tree. In the end, predictions are made by summing the contributions of all these trees.
- CatBoost: CatBoost stands for “Category” and “Boost”; it handles categorical, numeric, and text features. The CatBoost algorithm employs a symmetric tree or an oblivious tree structure [33].
3. Evaluation and Results
Deployment
4. Discussion
5. Conclusions
Author Contributions
Funding
Institutional Review Board Statement
Informed Consent Statement
Data Availability Statement
Conflicts of Interest
References
- Dini Kounoudes, A.; Kapitsaki, G.M.; Katakis, I. Enhancing user awareness on inferences obtained from fitness trackers data. User Model. User Adapt. Interact. 2023, 33, 967–1014. [Google Scholar] [CrossRef] [PubMed]
- Amor, J.D.; James, C.J. Validation of a Commercial Android Smartwatch as an Activity Monitoring Platform. IEEE J. Biomed. Health Inform. 2018, 22, 968–978. [Google Scholar] [CrossRef] [PubMed]
- Al-Janabi, S.; Salman, A.H. Sensitive integration of multilevel optimization model in human activity recognition for smartphone and smartwatch applications. Big Data Min. Anal. 2021, 4, 124–138. [Google Scholar] [CrossRef]
- Sulla-Torres, J.; Vidal-Espinoza, R.; Avendaño Llanque, C.; Calla Gamboa, A.; Zúñiga Carnero, M.; Cossio-Bolaños, M.; Gomez-Campos, R. Quantification of the Number of Steps in a School Recess by Means of Smart Bands: Proposal of Referential Values for Children and Adolescents. Children 2023, 10, 915. [Google Scholar] [CrossRef] [PubMed]
- Weiss, G.M.; Yoneda, K.; Hayajneh, T. Smartphone and Smartwatch-Based Biometrics Using Activities of Daily Living. IEEE Access 2019, 7, 133190–133202. [Google Scholar] [CrossRef]
- Cosoli, G.; Antognoli, L.; Scalise, L. Wearable Electrocardiography for Physical Activity Monitoring: Definition of Validation Protocol and Automatic Classification. Biosensors 2023, 13, 154. [Google Scholar] [CrossRef] [PubMed]
- Alsareii, S.A.; Awais, M.; Alamri, A.M.; AlAsmari, M.Y.; Irfan, M.; Aslam, N.; Raza, M. Physical Activity Monitoring and Classification Using Machine Learning Techniques. Life 2022, 12, 1103. [Google Scholar] [CrossRef]
- Ali, Y.A.; Awwad, E.M.; Al-Razgan, M.; Maarouf, A. Hyperparameter Search for Machine Learning Algorithms for Optimizing the Computational Complexity. Processes 2023, 11, 349. [Google Scholar] [CrossRef]
- Wang, C.; Lizardo, O.; Hachen, D.S. Using Fitbit data to examine factors that affect daily activity levels of college students. PLoS ONE 2021, 16, e0244747. [Google Scholar] [CrossRef]
- Sabry, F.; Eltaras, T.; Labda, W.; Alzoubi, K.; Malluhi, Q. Machine Learning for Healthcare Wearable Devices: The Big Picture. J. Healthc. Eng. 2022, 2022, 4653923. [Google Scholar] [CrossRef]
- Zhou, M.; Fukuoka, Y.; Goldberg, K.; Vittinghoff, E.; Aswani, A. Applying machine learning to predict future adherence to physical activity programs. BMC Med. Inform. Decis. Mak. 2019, 19, 169. [Google Scholar] [CrossRef] [PubMed]
- Creaser, A.V.; Frazer, M.T.; Costa, S.; Bingham, D.D.; Clemes, S.A. The Use of Wearable Activity Trackers in Schools to Promote Child and Adolescent Physical Activity: A Descriptive Content Analysis of School Staff’s Perspectives. Int. J. Environ. Res. Public Health 2022, 19, 14067. [Google Scholar] [CrossRef] [PubMed]
- Site, A.; Nurmi, J.; Lohan, E.S. Systematic Review on Machine-Learning Algorithms Used in Wearable-Based eHealth Data Analysis. IEEE Access 2021, 9, 112221–112235. [Google Scholar] [CrossRef]
- Himi, S.T.; Monalisa, N.T.; Whaiduzzaman, M.; Barros, A.; Uddin, M.S. MedAi: A Smartwatch-Based Application Framework for the Prediction of Common Diseases Using Machine Learning. IEEE Access 2023, 11, 12342–12359. [Google Scholar] [CrossRef]
- Bischl, B.; Binder, M.; Lang, M.; Pielok, T.; Richter, J.; Coors, S.; Thomas, J.; Ullmann, T.; Becker, M.; Boulesteix, A.; et al. Hyperparameter optimization: Foundations, algorithms, best practices, and open challenges. WIREs Data Min. Knowl. Discov. 2023, 13, e1484. [Google Scholar] [CrossRef]
- Yagin, F.H.; Gülü, M.; Gormez, Y.; Castañeda-Babarro, A.; Colak, C.; Greco, G.; Fischetti, F.; Cataldi, S. Estimation of Obesity Levels with a Trained Neural Network Approach optimized by the Bayesian Technique. Appl. Sci. 2023, 13, 3875. [Google Scholar] [CrossRef]
- Rivera, O.; Avilés, O.F.; Castillo-Castaneda, E. Classifying the physical activity indicator using machine learning and direct measurements: A feasibility study. Acta Sci. Technol. 2023, 45, e61317. [Google Scholar] [CrossRef]
- Triwiyanto, T.; Pawana, I.P.A.; Purnomo, M.H. An Improved Performance of Deep Learning Based on Convolution Neural Network to Classify the Hand Motion by Evaluating Hyper Parameter. IEEE Trans. Neural Syst. Rehabil. Eng. 2020, 28, 1678–1688. [Google Scholar] [CrossRef]
- Chapman, P.; Clinton, J.; Kerber, R.; Khabaza, T.; Reinartz, T.P.; Shearer, C.; Wirth, R. CRISP-DM 1.0: Step-by-step data mining guide. PSS Inc. 2000, 9, 1–73. [Google Scholar]
- Freedman, D.S.; Berenson, G.S. Tracking of BMI z Scores for Severe Obesity. Pediatrics 2017, 140, e20171072. [Google Scholar] [CrossRef]
- Fernández, J.R.; Redden, D.T.; Pietrobelli, A.; Allison, D.B. Waist circumference percentiles in nationally representative samples of African-American, European-American, and Mexican-American children and adolescents. J. Pediatr. 2004, 145, 439–444. [Google Scholar] [CrossRef] [PubMed]
- Bayoumy, K.; Gaber, M.; Elshafeey, A.; Mhaimeed, O.; Dineen, E.H.; Marvel, F.A.; Martin, S.S.; Muse, E.D.; Turakhia, M.P.; Tarakji, K.G.; et al. Smart wearable devices in cardiovascular care: Where we are and how to move forward. Nat. Rev. Cardiol. 2021, 18, 581–599. [Google Scholar] [CrossRef] [PubMed]
- Piazentin Ono, J.; Freire, J.; Silva, C.T. Interactive data visualization in Jupyter notebooks. Comput. Sci. Eng. 2021, 23, 99–106. [Google Scholar] [CrossRef]
- Safavian, S.R.; Landgrebe, D. A Survey of Decision Tree Classifier Methodology. Electr. Eng. 1991, 21, 660–674. [Google Scholar] [CrossRef]
- Qi, Y. Random Forest for Bioinformatics. In Ensemble Machine Learning: Methods and Applications; Springer: Berlin/Heidelberg, Germany, 2012. [Google Scholar]
- Cristianini, N.; Shawe-Taylor, J. An Introduction to Support Vector Machines and Other Kernel-Based Learning Methods; Cambridge University Press: Cambridge, UK, 2000. [Google Scholar] [CrossRef]
- Zhang, H.; Su, J. Naive Bayes for optimal ranking. J. Exp. Theor. Artif. Intell. 2008, 20, 79–93. [Google Scholar] [CrossRef]
- Cheng, X.; Lin, S.Y.; Liu, J.; Liu, S.; Zhang, J.; Nie, P.; Fuemmeler, B.F.; Wang, Y.; Xue, H. Does physical activity predict obesity—A machine learning and statistical method-based analysis. Int. J. Environ. Res. Public Health 2021, 18, 3966. [Google Scholar] [CrossRef] [PubMed]
- Bishop, C.M. Neural Networks: A Pattern Recognition Perspective. Neural Networks; Oxford University Press: Oxford, UK, 1996. [Google Scholar]
- Cunningham, P.; Delany, S.J. k-Nearest Neighbour Classifiers—A Tutorial. ACM Comput. Surv. 2022, 54, 1–25. [Google Scholar] [CrossRef]
- Friedman, J.H. Greedy function approximation: A gradient boosting machine. Ann. Stat. 2001, 29, 1189–1232. [Google Scholar] [CrossRef]
- Liu, M.; Guo, C.; Guo, S. An explainable knowledge distillation method with XGBoost for ICU mortality prediction. Comput. Biol. Med. 2023, 152, 106466. [Google Scholar] [CrossRef]
- Prokhorenkova, L.; Gusev, G.; Vorobev, A.; Dorogush, A.V.; Gulin, A. Catboost: Unbiased boosting with categorical features. In Proceedings of the 32nd Conference on Neural Information Processing Systems (NeurIPS 2018), Montréal, QC, Canada, 3–8 December 2018. [Google Scholar]
- Cole, T.J. Establishing a standard definition for child overweight and obesity worldwide: International survey. BMJ 2000, 320, 1240–1243. [Google Scholar] [CrossRef]
- Dai, R.; Lu, C.; Yun, L.; Lenze, E.; Avidan, M.; Kannampallil, T. Comparing stress prediction models using smartwatch physiological signals and participant self-reports. Comput. Methods Programs Biomed. 2021, 208, 106207. [Google Scholar] [CrossRef] [PubMed]
- Sokolova, M.; Lapalme, G. A systematic analysis of performance measures for classification tasks. Inf. Process. Manag. 2009, 45, 427–437. [Google Scholar] [CrossRef]
- Lammers, A.E.; Romanowski, A.L.; Baumgartner, H.; Diller, G.P.; Uebing, A. Reference Values for Wristband Accelerometry Data in Children Aged 6–11 Years of Age. Front. Pediatr. 2022, 10, 808372. [Google Scholar] [CrossRef] [PubMed]
- Yadav, P.; Sharma, S.C.; Mahadeva, R.; Patole, S.P. Exploring Hyper-Parameters and Feature Selection for Predicting Non-Communicable Chronic Disease Using Stacking Classifier. IEEE Access 2023, 11, 80030–80055. [Google Scholar] [CrossRef]
- Wang, J.; Xie, Z.; Li, Y.; Song, Y.; Yan, J.; Bai, W.; Zhou, T.; Qin, J. Relationship between Health Status and Physical Fitness of College Students from South China: An Empirical Study by Data Mining Approach. IEEE Access 2020, 8, 67466–67473. [Google Scholar] [CrossRef]
- Yang, H.; Chen, Z.; Yang, H.; Tian, M. Predicting Coronary Heart Disease Using an Improved LightGBM Model: Performance Analysis and Comparison. IEEE Access 2023, 11, 23366–23380. [Google Scholar] [CrossRef]
- Mannini, A.; Sabatini, A.M. Machine Learning Methods for Classifying Human Physical Activity from On-Body Accelerometers. Sensors 2010, 10, 1154–1175. [Google Scholar] [CrossRef]
- Saez, Y.; Baldominos, A.; Isasi, P. A Comparison Study of Classifier Algorithms for Cross-Person Physical Activity Recognition. Sensors 2016, 17, 66. [Google Scholar] [CrossRef]
- Zhang, B.; Ren, J.; Cheng, Y.; Wang, B.; Wei, Z. Health data driven on continuous blood pressure prediction based on gradient boosting decision tree algorithm. IEEE Access 2019, 7, 32423. [Google Scholar] [CrossRef]
- Zhao, L.; Zhang, F.; Zhang, H.; Liang, Y.; Zhou, A.; Ma, H. Robust Respiratory Rate Monitoring Using Smartwatch Photoplethysmography. IEEE Internet Things J. 2023, 10, 4830–4844. [Google Scholar] [CrossRef]


| Age | Weight | Height | Waist | BMI | Cadence | Steps | Speed | Stride | |
|---|---|---|---|---|---|---|---|---|---|
| mean | 12.48 | 47.57 | 1.49 | 71.93 | 20.74 | 59.58 | 910.64 | 2.99 | 79.73 |
| std | 2.75 | 16.18 | 0.16 | 11.37 | 4.27 | 34.46 | 504.13 | 1.93 | 10.35 |
| min | 6 | 18.00 | 1.140 | 50.00 | 11.71 | 10.00 | 126.00 | 0.310 | 53.00 |
| 25% | 10 | 34.00 | 1.370 | 63.00 | 17.66 | 30.00 | 499.00 | 1.315 | 72.50 |
| 50% | 13 | 48.00 | 1.520 | 70.50 | 20.30 | 53.00 | 833.00 | 2.570 | 78.00 |
| 75% | 15 | 58.10 | 1.630 | 78.50 | 23.35 | 82.50 | 1241.50 | 4.365 | 86.00 |
| max | 17 | 107.70 | 1.810 | 114.60 | 39.95 | 163.00 | 2189.00 | 9.760 | 111.00 |
| Metrics | Age | |||||
|---|---|---|---|---|---|---|
| Cadence | 6–7 | 8–9 | 10–11 | 12–13 | 14–15 | 16–17 |
| L | 0.94 | −0.22 | 0.22 | 0.33 | 0.85 | 1.52 |
| M | 28 | 96 | 60 | 63 | 49 | 29 |
| S | 0.72 | 0.42 | 0.46 | 0.50 | 0.55 | 0.53 |
| P25 | 20 | 55 | 44 | 38.5 | 29 | 21 |
| P50 | 28 | 96 | 60 | 63 | 49 | 29 |
| P75 | 65.5 | 120 | 88 | 86.8 | 68 | 44 |
| Steps | ||||||
| L | 1.33 | −0.16 | 0.42 | 0.30 | 0.67 | 1.09 |
| M | 455 | 1437 | 884 | 1000 | 732 | 496 |
| S | 0.70 | 0.42 | 0.48 | 0.45 | 0.54 | 0.55 |
| P25 | 299 | 772 | 628 | 690 | 470 | 309 |
| P50 | 455 | 1437 | 884 | 1000 | 732 | 496 |
| P75 | 796 | 1747 | 1179 | 1299 | 1097 | 726 |
| Velocity | ||||||
| L | 0.85 | 0.19 | 0.80 | 0.33 | 0.93 | 1.85 |
| M | 1.62 | 4.69 | 3.08 | 3.15 | 2.28 | 1.16 |
| S | 0.70 | 0.47 | 0.53 | 0.52 | 0.63 | 0.61 |
| P25 | 1.11 | 2.73 | 2.10 | 1.84 | 1.17 | 0.90 |
| P50 | 1.62 | 4.69 | 3.08 | 3.15 | 2.28 | 1.16 |
| P75 | 3.48 | 6.00 | 4.30 | 4.51 | 3.69 | 1.92 |
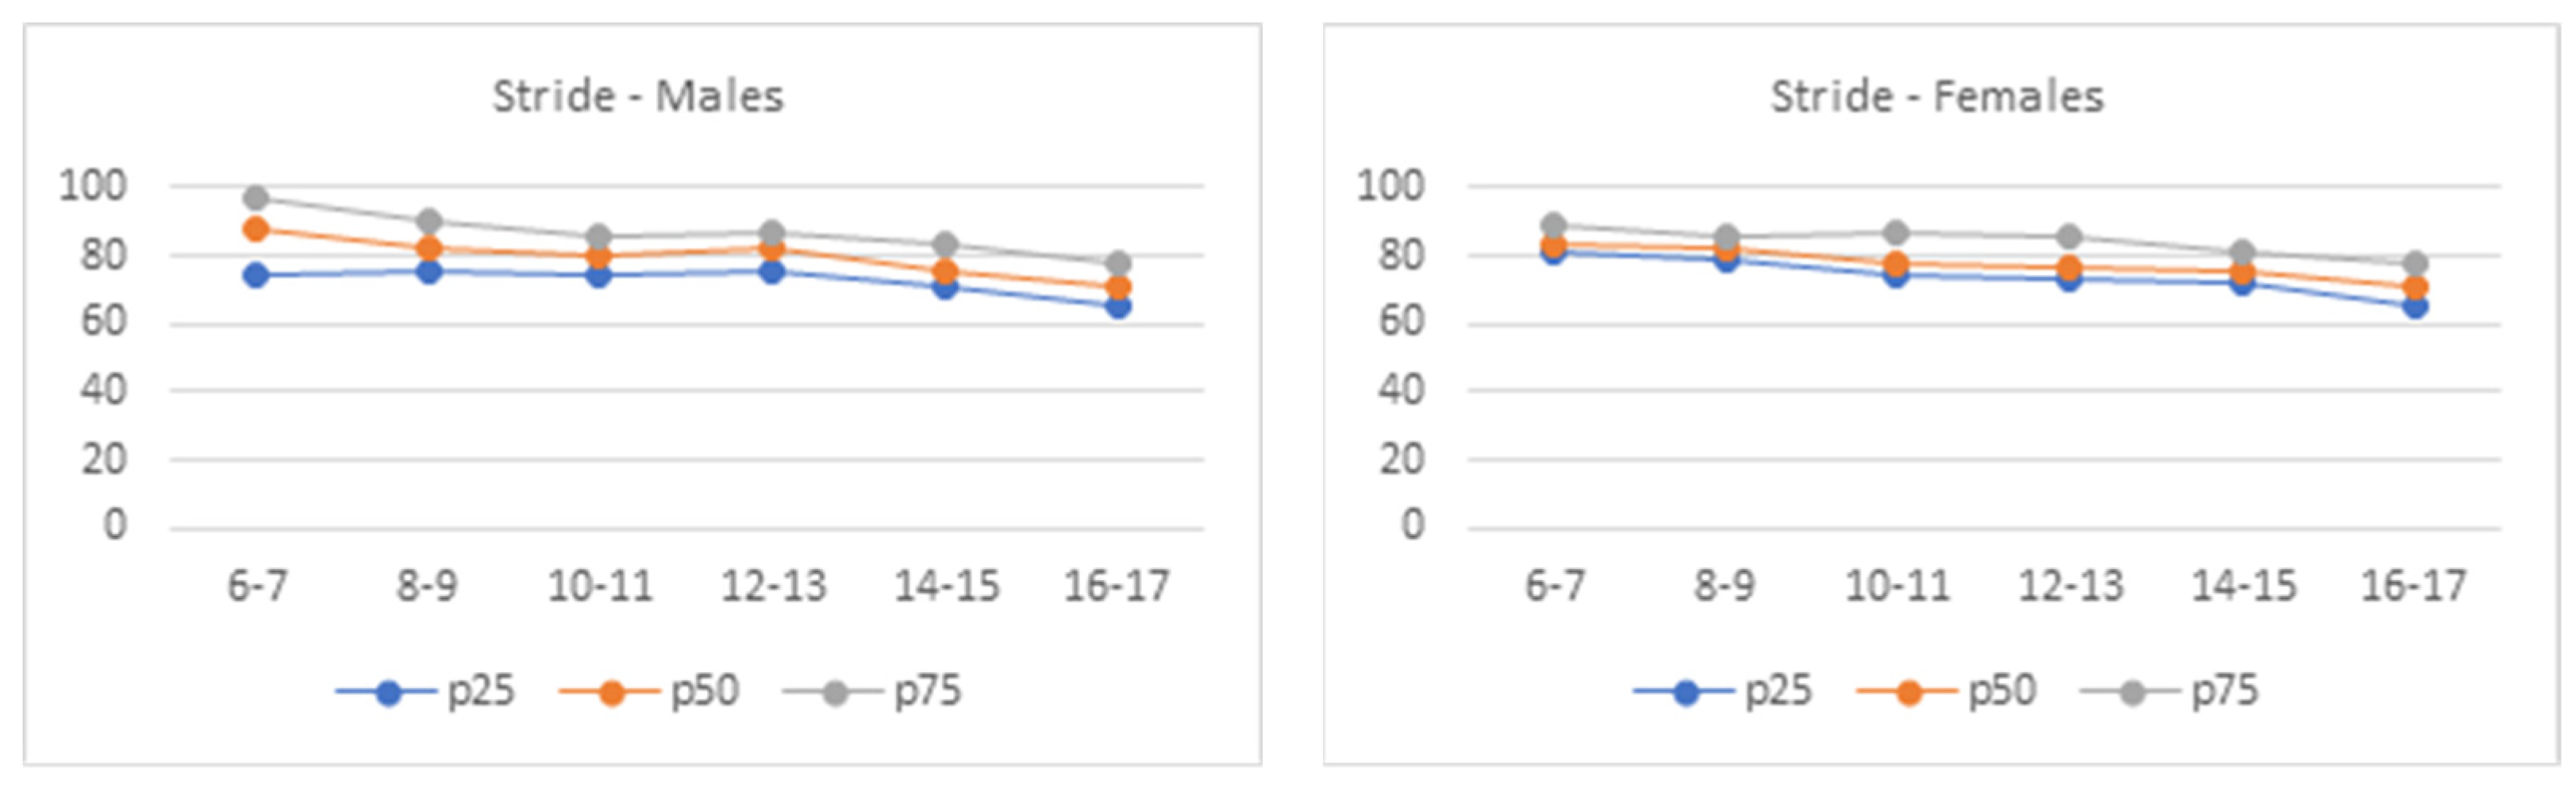
| Stride | ||||||
| L | −0.02 | 0.65 | 0.91 | 0.41 | 0.27 | 0.66 |
| M | 88 | 82 | 80 | 82 | 76 | 71 |
| S | 0.14 | 0.12 | 0.12 | 0.12 | 0.106 | 0.12 |
| P25 | 74.5 | 76 | 74 | 76 | 71 | 66 |
| P50 | 88 | 82 | 80 | 82 | 76 | 71 |
| P75 | 97.5 | 90 | 86 | 87 | 83 | 78 |
| Metrics | Age | |||||
|---|---|---|---|---|---|---|
| Cadence | 6–7 | 8–9 | 10–11 | 12–13 | 14–15 | 16–17 |
| L | −0.06 | −0.41 | 0.25 | 0.41 | 1.04 | 1.48 |
| M | 75 | 94 | 69 | 60 | 36 | 29 |
| S | 0.52 | 0.34 | 0.47 | 0.49 | 0.67 | 0.53 |
| P25 | 40 | 68.75 | 33 | 35 | 20 | 20 |
| P50 | 75 | 94 | 69 | 60 | 36 | 29 |
| P75 | 108 | 111.3 | 89 | 84 | 60.5 | 44 |
| Steps | ||||||
| L | 0.21 | −0.24 | 0.58 | 0.54 | 0.99 | 1.29 |
| M | 941 | 1391 | 802 | 784 | 613 | 529 |
| S | 0.52 | 0.37 | 0.57 | 0.49 | 0.61 | 0.52 |
| P25 | 615 | 989 | 462 | 578 | 426 | 359 |
| P50 | 941 | 1391 | 802 | 784 | 613 | 529 |
| P75 | 1584 | 1608 | 1233 | 1226 | 937 | 762 |
| Velocity | ||||||
| L | −0.06 | −0.29 | 0.79 | 7.97 | 1.11 | 1.84 |
| M | 3.91 | 4.75 | 2.91 | 3.04 | 1.58 | 1.27 |
| S | 0.52 | 0.36 | 0.62 | 5.50 | 0.74 | 0.62 |
| P25 | 2.15 | 3.33 | 1.52 | 1.77 | 0.94 | 0.92 |
| P50 | 3.91 | 4.75 | 2.91 | 3.04 | 1.58 | 1.27 |
| P75 | 5.41 | 5.69 | 4.16 | 4.26 | 3.09 | 1.78 |
| Stride | ||||||
| L | −2.97 | 1.47 | 1.11 | 0.79 | 0.27 | 0.57 |
| M | 84 | 82 | 78 | 77 | 76 | 71 |
| S | 0.24 | 0.10 | 0.11 | 0.11 | 0.09 | 0.12 |
| P25 | 81 | 79 | 75 | 73 | 72 | 65.5 |
| P50 | 84 | 82 | 78 | 77 | 76 | 71 |
| P75 | 89.5 | 86.3 | 86.5 | 86 | 81.5 | 77.5 |
| Algorithm | DT | SVM | RF | NB | LR | KNN | MLP | GB | XGB | LGBM | CB |
|---|---|---|---|---|---|---|---|---|---|---|---|
| Accuracy | 0.88 | 0.69 | 0.92 | 0.74 | 0.78 | 0.81 | 0.68 | 0.93 | 0.92 | 0.94 | 0.93 |
| Accuracy optimized hyperparameter | 0.87 | 0.82 | 0.92 | 0.75 | 0.79 | 0.85 | 0.70 | 0.95 | 0.91 | 0.94 | 0.93 |
| f1-score | 0.87 | 0.74 | 0.93 | 0.77 | 0.82 | 0.88 | 0.72 | 0.92 | 0.91 | 0.93 | 0.92 |
| Recall | 0.86 | 0.67 | 0.94 | 0.73 | 0.84 | 0.88 | 0.67 | 0.92 | 0.90 | 0.94 | 0.92 |
| Precision | 0.88 | 0.82 | 0.92 | 0.82 | 0.80 | 0.88 | 0.77 | 0.92 | 0.92 | 0.92 | 0.92 |
| Algorithm | DT | SVM | RF | NB | LR | KNN | MLP | GB | XGB | LGBM | CB |
|---|---|---|---|---|---|---|---|---|---|---|---|
| Accuracy | 0.86 | 0.68 | 0.88 | 0.71 | 0.78 | 0.72 | 0.72 | 0.84 | 0.87 | 0.88 | 0.90 |
| Accuracy optimized hyperparameter | 0.86 | 0.80 | 0.87 | 0.72 | 0.83 | 0.81 | 0.74 | 0.89 | 0.84 | 0.88 | 0.88 |
| f1-score | 0.91 | 0.68 | 0.92 | 0.76 | 0.89 | 0.88 | 0.82 | 0.93 | 0.92 | 0.90 | 0.93 |
| Recall | 0.97 | 0.61 | 0.94 | 0.69 | 0.94 | 0.92 | 0.86 | 0.92 | 0.86 | 0.91 | 0.94 |
| Precision | 0.86 | 0.76 | 0.89 | 0.83 | 0.85 | 0.82 | 0.78 | 0.94 | 0.94 | 0.89 | 0.92 |
| Characteristics | Subcharacteristics | Metrics | Percentage of Compliance | Quality Level |
|---|---|---|---|---|
| Functionality (FUN) | FUN. 1 Fit for purpose | 20 | 84.00% | Satisfied |
| FUN. 2 Accuracy | 6 | 86.67% | Satisfied | |
| FUN. 3 Interoperability | 4 | 86.67% | Satisfied | |
| FUN. 4 Security | 3 | 53.33% | Does not satisfy | |
| Subtotal | 33 | 81.88% | Satisfied | |
| Usability (USA) | USA.1 Ease of Compression | 5 | 90.00% | Satisfied |
| USA. 2 Learning Capacity | 8 | 92.00% | Satisfied | |
| USA. 3 Graphical Interface | 4 | 95.00% | Satisfied | |
| USA. 4 Operability | 3 | 52.00% | Does not satisfy | |
| Subtotal | 20 | 82.73% | Satisfied | |
| Reliability (RIA) | RIA. 1 Maturity | 5 | 60.00% | Does not satisfy |
| RIA. 2 Fault tolerance | 4 | 90.00% | Satisfied | |
| RIA. 3 Recovery | 2 | 50.00% | Does not satisfy | |
| Subtotal | 11 | 69.09% | Does not satisfy | |
| Total | 64 | 77.09% | Satisfied |
Disclaimer/Publisher’s Note: The statements, opinions and data contained in all publications are solely those of the individual author(s) and contributor(s) and not of MDPI and/or the editor(s). MDPI and/or the editor(s) disclaim responsibility for any injury to people or property resulting from any ideas, methods, instructions or products referred to in the content. |
© 2024 by the authors. Licensee MDPI, Basel, Switzerland. This article is an open access article distributed under the terms and conditions of the Creative Commons Attribution (CC BY) license (https://creativecommons.org/licenses/by/4.0/).
Share and Cite
Sulla-Torres, J.; Calla Gamboa, A.; Avendaño Llanque, C.; Angulo Osorio, J.; Zúñiga Carnero, M. Classification of Motor Competence in Schoolchildren Using Wearable Technology and Machine Learning with Hyperparameter Optimization. Appl. Sci. 2024, 14, 707. https://doi.org/10.3390/app14020707
Sulla-Torres J, Calla Gamboa A, Avendaño Llanque C, Angulo Osorio J, Zúñiga Carnero M. Classification of Motor Competence in Schoolchildren Using Wearable Technology and Machine Learning with Hyperparameter Optimization. Applied Sciences. 2024; 14(2):707. https://doi.org/10.3390/app14020707
Chicago/Turabian StyleSulla-Torres, José, Alexander Calla Gamboa, Christopher Avendaño Llanque, Javier Angulo Osorio, and Manuel Zúñiga Carnero. 2024. "Classification of Motor Competence in Schoolchildren Using Wearable Technology and Machine Learning with Hyperparameter Optimization" Applied Sciences 14, no. 2: 707. https://doi.org/10.3390/app14020707
APA StyleSulla-Torres, J., Calla Gamboa, A., Avendaño Llanque, C., Angulo Osorio, J., & Zúñiga Carnero, M. (2024). Classification of Motor Competence in Schoolchildren Using Wearable Technology and Machine Learning with Hyperparameter Optimization. Applied Sciences, 14(2), 707. https://doi.org/10.3390/app14020707