Article

High-Noise Grayscale Image Denoising Using an Improved Median Filter for the Adaptive Selection of a Threshold

College of Mechanical and Electrical Engineering, Zhengzhou University of Light Industry, Zhengzhou 450002, China
*
Author to whom correspondence should be addressed.
Appl. Sci. 2024, 14(2), 635; https://doi.org/10.3390/app14020635
Submission received: 10 December 2023 / Revised: 30 December 2023 / Accepted: 4 January 2024 / Published: 11 January 2024
(This article belongs to the Special Issue Digital Image Processing: Technologies and Applications)

Abstract

:
Grayscale image processing is a key research area in the field of computer vision and image analysis, where image quality and visualization effects may be seriously damaged by high-density salt and pepper noise. A traditional median filter for noise removal may result in poor detail reservation performance under strong noise and the judgment performance of different noise characteristics has strong dependence and rather weak robustness. In order to reduce the effects of high-density salt and pepper noise on image quality when processing high-noise grayscale images, an improved two-dimensional maximum Shannon entropy median filter (TSETMF) is proposed for the adaptive selection of a threshold to enhance the filter performance while stably and effectively retaining the details of the images. The framework of the proposed improved TSETMF algorithm is designed in detail. The noise in images is filtered by means of automatically partitioning a window size, the threshold value of which is adaptively calculated using two-dimensional maximum Shannon entropy. The theoretical model is verified and analyzed through comparative experiments using three kinds of classical grayscale images. The experimental results demonstrate that the proposed improved TSETMF algorithm exhibits better processing performance than that of the traditional filter, with a higher suppression of high-density noise and denoising stability. This stronger ability while processing high-density noise is demonstrated by a higher peak signal-to-noise ratio (PSNR) of 24.97 dB with a 95% noise density located in the classical Lena grayscale image. The better denoising stability, with a noise density from 5% to 95%, is demonstrated by the minor decline in the PSNR of approximately 10.78% relative to a PSNR of 23.10 dB located in the classical Cameraman grayscale image. Furthermore, it can be advanced to promote higher noise filtering and stability for processing high-density salt and pepper noise in grayscale images.

1. Introduction

A grayscale image is a significant representation of image information, containing black, white, and different shades of gray, which can be extensively applied in typical fields, such as medical imaging [1], computer vision [2], and image processing [3]. However, because of changes in environmental parameters and equipment accuracy, the actual image obtained always contains noise [4,5] when processed from a grayscale image, including Gaussian noise [6,7], salt and pepper noise [8], and other noise. Salt and pepper noise, as a common type of image impulse noise, can be utilized to simulate imaging sensor or signal transmission errors, resulting in isolated bright spots or dark spots in images [9]. Thus, salt and pepper noise may reduce imaging definition and visualization effects and affect the accuracy of image segmentation, edge detection, and object identification [10]. Therefore, for the sake of guaranteeing the restoration of the original details of an image and eliminating discontinuities, it is crucial to reduce the effects of noise associated with grayscale images.
At present, some methods are being used to denoise grayscale images. For instance, median filtering [11,12], deep learning [13,14], wavelet filtering [15,16], and mean filtering [17,18] are used. These methods can lower the noise effects to improve the grayscale image quality. Median filtering is commonly utilized to effectively remove salt and pepper noise. This can be accomplished by choosing an intermediate value to replace the gray pixel’s value ranked inside a window [19]. For instance, Sree et al. employed a modified self-adaptive median filter to improve image quality, exhibiting superiority in terms of time complexity [20]. Toh et al. adopted a self-adaptive fuzzy switch median filter to restrain the salt and pepper noise, with a relatively fair filtering result [21]. However, assuming that high-density noise exists in a grayscale image, it is difficult to judge whether a pixel is noise by ranking median values. This may generate a poor denoising effect in the case of processing high-noise grayscale images [22].
For the sake of more effectively denoising high-density-noise images, a recursion method can be used to improve the median filter, which increases the number of non-noise pixel values in non-marginal areas to reduce the effects of noise on images [23]. However, the recursion median filter may result in replacing some normal pixel values, regardless of the damaged pixels. As a result, a threshold value can be introduced to judge the noise whose traditional selection and comparison may cause an erroneous judgment. Differences in neighboring pixels mean that calculations that are compared with the threshold value can enhance the denoising effects to some degree. In order to more precisely judge whether a pixel has been damaged in a high-density-noise grayscale image, the threshold value of the median filter can be optimized to improve the denoising effects. For example, Gupta et al. adopted a double-threshold method based on averages to detect noise, which had a higher noise detection ability and greater denoising efficiency [24]. Kuma et al., employed a dual-threshold median filter to detect and remove highly damaged images by individually calculating the median and threshold values [25]. Goyal et al., used rank mean values to calculate dual-threshold values and enhance the image denoising accuracy [26]. These filter algorithms can realize a relatively reasonable improvement for median filter threshold values; whereas, the threshold values can be mainly selected according to experience, which has a strong impact on noise detection performance. In a noise probability density function, it may result in a non-smooth approximation decreasing the image noise. Furthermore, it is insufficient and unreliable for the removal of stochastic noises.
With regard to denoising for noise distribution, it is effective to utilize maximum entropy theory to better realize denoising in high-density-noise grayscale images. Maximum entropy theory, maximizing entropy under preset constraint conditions, can acquire the most probable observed value distribution function from a statistical system [27]. Thus, it can be utilized to assess the smooth approximation degree of a probability density function with minimal deviation and maximize the Shannon entropy to estimate the data probability distributions between noise and non-noise [28]. Correspondingly, two-dimensional maximum Shannon entropy, representative of the randomness of the variable, can be adopted to explore the information of an image from the relationships between pixels. Thus, an optimal threshold can be automatically calculated using a coupled two-dimensional gray histogram with maximum entropy [29]. Two-dimensional maximum Shannon entropy can be applied in image segmentation [30,31], signal processing [32], and other areas that still lack applications in image denoising, especially in high-density-noise grayscale images.
Consequently, to achieve effective denoising for high-density grayscale images, a unique denoising approach to improve the median filter is proposed using two-dimensional maximum Shannon entropy for the adaptive selection of a threshold, taking advantage of image spatial characteristics to enhance the noise detection efficiency and denoising accuracy. Based on the two-dimensional maximum Shannon entropy of an input grayscale image, a threshold value can be calculated and a window size can be selected to replace a median value. By suppressing the effects of noise in a larger area, a detailed image can be reserved to accomplish the denoising of salt and pepper noise more efficiently and stably. In the future, by advancing a two-dimensional maximum Shannon entropy partitioning algorithm for denoising, the issue of high-density salt and pepper noise in grayscale images can be addressed.

2. Two-Dimensional Maximum Shannon Entropy

In order to conduct the digital processing of an image, it is conventional to adopt a two-dimensional matrix to represent the grayscale image [33,34]. This can effectively reflect the gray-level distributions of images [35,36], resulting in successful denoising. The location of noise should be determined before denoising occurs as the resulting threshold selection can directly influence the discriminating effects of noise [37,38]. In a single threshold system, a pixel value less or greater than the preset one can be regarded as noise [39]. The ranges of the pixel values used to identify a noise point can often be large, resulting in an increase in error detection. However, a self-adaptive dual-threshold system, with a relatively minor noise recognition range, may decrease the probability of error detection [24]. However, during the processing of high-density noise in a grayscale image, it is also unstable and difficult to handle. Hence, in order to address the poor denoising issue, it is necessary to select a better threshold value to fit with the automatic window changes.
To improve the noise detection effects during selections, a threshold value can be obtained using the gray levels of an image [40,41], which can be expressed by a gray-level histogram formed using a two-dimensional matrix [42,43]. The selection of a gray threshold may be achieved by using the valley value between two peaks in the two-dimensional histogram [44,45]. Because a common gray-level histogram cannot accurately represent the randomness of noise, the processing effects of the complex images may be limited. By contrast, two-dimensional maximum Shannon entropy can more accurately represent the randomness of noise by employing more image information. In addition, the gray level and noise distributions of image pixels also present randomness; thus, a Shannon threshold can be selected using a two-dimensional gray histogram.
In view of the Shannon threshold value method being widely used in signal processing [46,47], two-dimensional maximum Shannon entropy can be utilized to select an optimal threshold value by calculating the two-dimensional gray-level histogram of the image coupled with maximum entropy theory [48]. As a result, it can be used to obtain better image processing effects, especially for noise images. Also, a multi-dimensional histogram constructed using a grayscale image and other characteristics can be optimized, including neighborhood gradient and neighborhood variance.
For a grayscale image, the information entropy H using Shannon can be defined as follows [49]:
H = i = 1 L p i ln p i
where L is the gray-level number for inputting an image and p is the discrete distribution probability.
In a two-dimensional gray-level histogram, the threshold point (s, t) is a division point for segmenting the image foreground and background, where s represents a threshold value using the image’s gray values to segment the image and t represents a threshold value using the average gray values in the neighborhood to segment the image. Therefore, for a threshold point (s, t), two posterior probabilities, P0(s, t) and P1(s, t), of the target foreground and background can be expressed as:
P 0 s , t = i = 0 s j = 0 t p i j P 1 s , t = i = s + 1 L 1 j = t + 1 L 1 p i j
where P0(s, t) represents the posterior probabilities of the image pixel gray values and the neighborhood average gray values are less than or equal to the threshold values s and t, respectively. Also, P1(s, t) represents the posterior probabilities of the image pixel gray values and the neighborhood average gray values are greater than the threshold values s and t, respectively.
For a threshold point (s, t) in a two-dimensional image, the Shannon entropy H of the target foreground and background on a two-dimensional gray-level histogram can be represented as:
H 0 s , t = i = 0 s j = 0 t p i j P 0 s , t ln p i j P 0 s , t H 1 s , t = i = s + 1 L 1 j = t + 1 L 1 p i j P 1 s , t ln p i j P 1 s , t .
Hence, the criterion function threshold value T of two-dimensional maximum Shannon entropy can be defined as:
T = arg max 0 < t < L 1 H 0 s , t + H 1 s , t 2 .
Here, a threshold value T can be acquired using two-dimensional maximum Shannon entropy to address the poor denoising of high-density salt and pepper noise. Compared with the entropy threshold method and the gray-level histogram threshold method, two-dimensional maximum Shannon entropy can express the image randomness and noise distribution more strongly to process complex high-density-noise images. Thus, it can automatically calculate the best threshold value and combine the median filter to realize self-adaptive denoising. Correspondingly, it may be more effective to enhance noise detection, denoising efficiency, and precision.

3. Improved TSETMF Algorithm

In order to address the balance between protecting the image detail and eliminating noise, a median filter can be improved using two-dimensional maximum Shannon entropy to realize the adaptive threshold. Under the calculated threshold, noise judgments can be achieved by using different-sized windows. A median can be replaced in a 5 × 5 window to fit the noise level for increasing the filtering effects. Hence, the proposed improved TSETMF algorithm may achieve denoising while protecting the image detail as well.

3.1. Improved Self-Adaptive Median Filter

A median filter is a common image denoising method [50] used to eliminate isolated noise by utilizing the median of each pixel value in the neighborhood area to replace the targeted pixel point. This may allow the neighborhood pixel values to be more appropriate and also enable the image detail and marginal information to be retained. Salt and pepper noise can be denoised using the median filter to acquire a satisfactory filtering effect and image edge feature [51,52].
After median filtering occurs, the image pixel value f(x, y) at the coordinates (x, y) can be expressed as:
f ( x , y ) = m e d i a n ( l ( x + i , y + j ) )
where l(x + i, y + j) is the neighborhood pixel values relative to the centered pixel point (x, y) and median() represents the median selection of the neighborhood pixel values.
During the denoising process, a two-dimensional 3 × 3 window can be employed to filter the image. Compared with the sizes of the pixel values within a certain range, a median can be selected as the new center pixel. However, the same local window size can result in conflicts between the protection of the image detail and noise elimination [53]; thus, a modified filtering method can be applied, such as the weighted median filter [54,55] or self-adaptive median filter [56]. As the weighted median filter can conduct fuzzy processing of an image, it may lose some of the image detail during the filtering of high-density noise. However, the self-adaptive median filter can select a window size that fits different noise levels, thus achieving denoising coupled with image detail protection. Moreover, the major density of salt and pepper noise can be filtered by the self-adaptive median filter to acquire clearer images [57]. Thus, the self-adaptive median filter can be utilized to change the window size according to the pixel values for different areas.
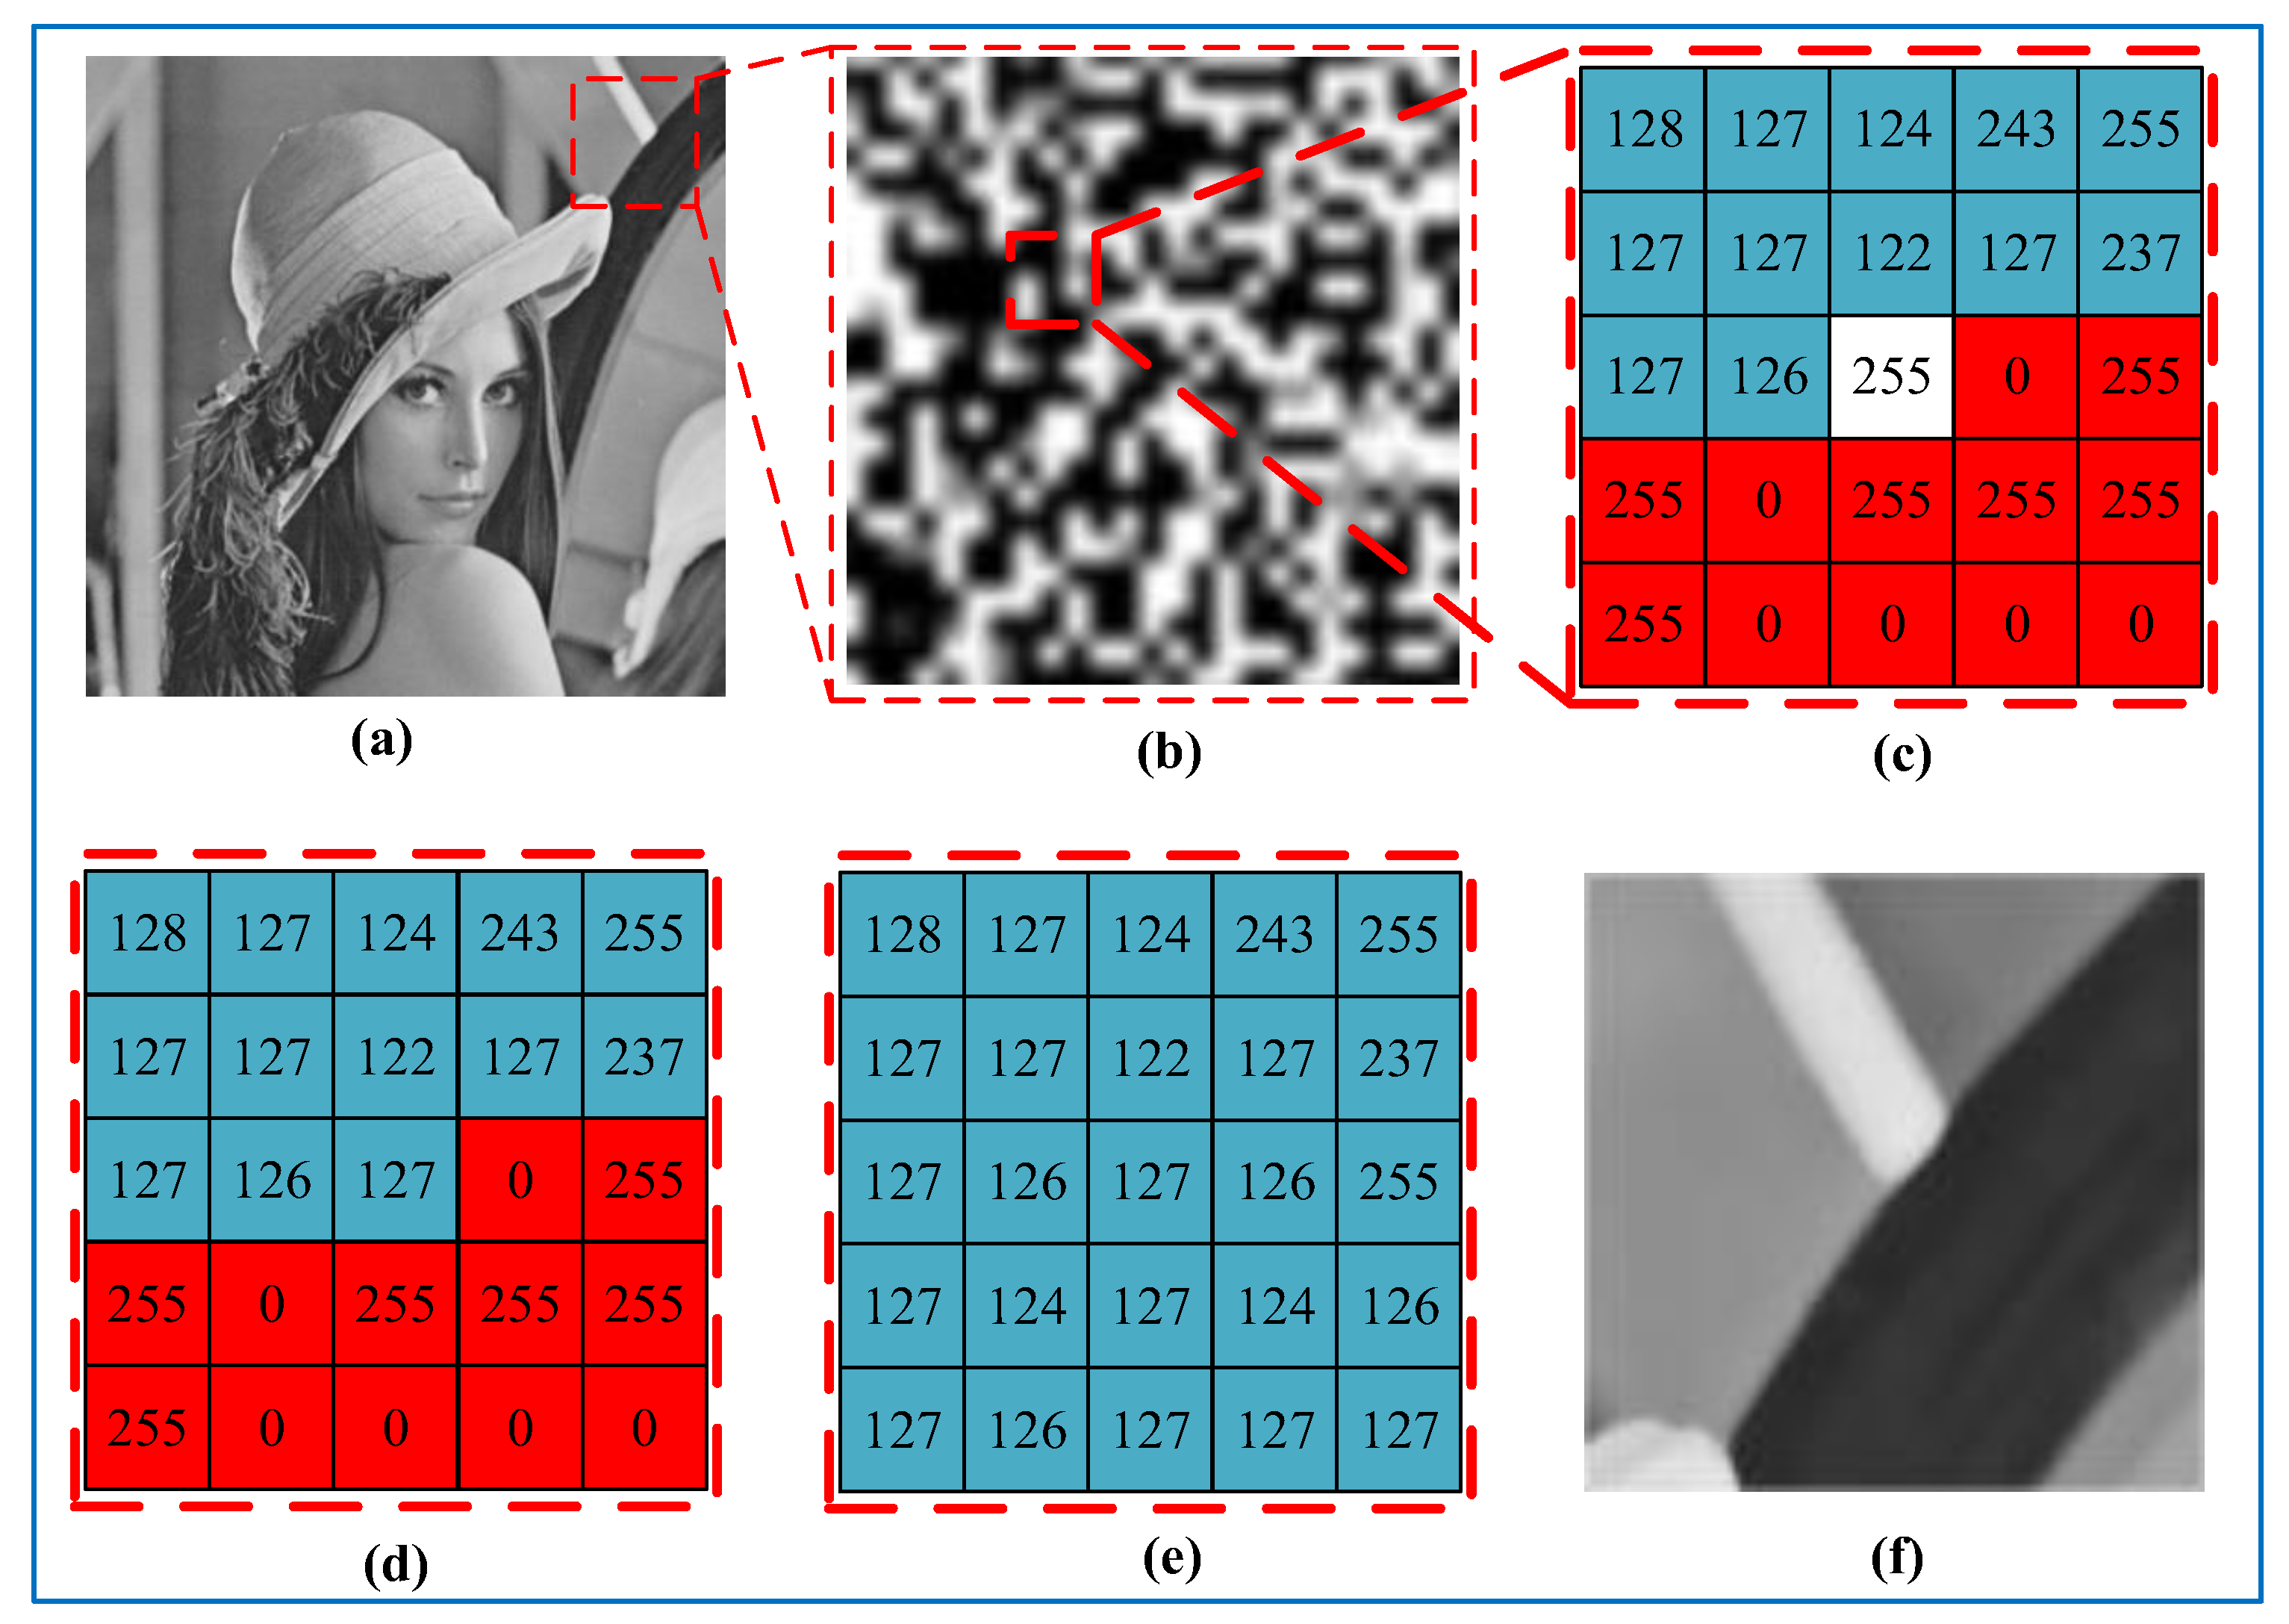
In Figure 1, denoising principle comparisons for the improved self-adaptive median filter are presented to demonstrate the effects of this more effective filtering method. Figure 1c,d represent the processing step of central pixel value ranking and replacement by adopting the self-adaptive median filter and the improved self-adaptive median filter, respectively. The improved self-adaptive median filter can be compared to the original filter to demonstrate the denoising advantage. In the self-adaptive median filtering algorithm, the processed pixel will be not employed in the following ranking, guaranteeing the independence and stability of the filtering process; however, when the noise density becomes higher, the ranked median value may be turned into a noise value. This may result in poor denoising effects, as seen in Figure 1a,b. During the partial area processing shown in Figure 1b, pixels 0 and 255 may be regarded as noise. In a 5 × 5 window, the pending pixel value in a random area is 255 and, then, the ranked pixel values are 0, 0, 0, 0, 0, 0, 0, 0, 0, 0, 0, 127, 255, 255, 255, 255, 255, 255, 255, 255, 255, 255, 255, 255, and 255. Thus, the replaced central pixel value is still 255 when adopting the middle value, as seen in Figure 1c. The replaced pixel is still the noise, which may also lead to poor denoising effects. This may be interpreted by the effects of the larger-density salt and pepper noise that turn the ranked pixel values into noise values. Moreover, each ranked and replaced central pixel value can be realized based on the original noise image and will be not applied in the next processing step.
For the sake of addressing this problem, the self-adaptive median filter can be improved by utilizing the recursion method combined with a self-adaptive window. The basic principle adopts the recursion concept to filter an image. After selecting an appropriate filtering window, the median value can be regarded as the new current pixel value by comparing the current pixel value with the neighboring pixel values. At this stage, this new current pixel value, as the input of the next pixel, can proceed with the recursion operations until the filtering process has finished. Thus, this improved self-adaptive median filter may retain and deliver non-noise pixel values more effectively. Median replacement can be conducted using the improved self-adaptive median filter, whose central value represents the pending pixel value 255, as seen in Figure 1d. At this stage, after ranking the pixel values in a 5 × 5 window, the ranked pixel values are 0, 0, 0, 0, 0, 0, 120, 120, 122, 122, 124, 125, 126, 127, 127, 127, 128, 129, 255, 255, 255, 255, 255, 255, and 255. By adopting the middle value, the replaced central pixel value is 126, which may then participate in the subsequent ranking and replacement. By adopting the recursion method, the improved self-adaptive median filter window can possess larger non-noise pixel values and, thus, turn the ranked middle values into mostly non-noise pixel values. This approach can also be utilized to demonstrate the effectiveness of the denoising effects by taking advantage of the improved self-adaptive median filter.
Compared with the traditional self-adaptive median filter, the improved self-adaptive median filter, adopting the recursion method and self-adaptive window, can conduct noise judgment using different filtering windows and its ranked values include the previous pixel values after performing the median replacement. This may greatly reduce the adverse effects of high-density noise. Assuming that the signal and noise values are flipped, the accuracy of noise judgment and median replacement can be ensured to output the excellent high-noise removal effects by means of the improved self-adaptive median filter.

3.2. TSETMF Concept

The concept of the improved TSETMF algorithm can be stated as follows. After a grayscale noise image with matrix M × N is input, the initial filter window size can be set as 3 × 3. Firstly, taking the center of the initial filter window to coincide with the first 3 × 3 region center, window B can be expressed as:
B = a 11 a 12 a 13 a 21 a 22 a 23 a 31 a 32 a 33
where the gray levels of nine pixels can be shown as a11, a12, a13, a21, a22, a23, a31, a32, and a33 and parameter aij represents the element at row i and column j in the 3 × 3 window.
Afterwards, a threshold value TK (K represents the threshold value numbers: K = 0, 1, 2, 3, …) can be set. At this stage, if the pixel values at aij differ from one another, the window pixel probability P11 = P12 = … Pij … = P33 = 1/9 (L = 9). Assuming that the threshold values s, t can be used to realize segmentations, foreground probability P0 and background probability P1 can be obtained. The threshold values can be expressed as:
s , t a i j , s < t .
The Shannon entropy H0 and H1 of the target and background gray-level distributions can be individually calculated as:
H 0 = i = 0 s j = 0 t p i j P 0 ln p i j P 0 H 1 = i = s + 1 L 1 j = t + 1 L 1 p i j P 1 ln p i j P 1 .
Taking the image’s gray-level distributions and the amount of information between different gray levels into account, the threshold value TK can be defined based on the entropy difference calculation in the two-dimensional maximum Shannon entropy, i.e.,
T k = arg min 0 < t < L 1 | H 0 H 1 | 2 .
Then, the sum of the pixel difference D1 between the filtering window’s central values and neighboring areas can be calculated as:
D 1 = s u m a i j a 22 .
Correspondingly, the average value D of the pixel difference can be expressed as:
D = D 1 9 .
Then, the average value D is taken and compared with the entropy threshold TK. If D > TK, it may be regarded as noise. Conversely, it may be regarded as non-noise. By updating each function value, the next pixel point can be calculated.
In addition, if a noise point has been identified in a 3 × 3 window, the filter window can be adjusted to 5 × 5. Each function value can be updated using the pixel values in the current filter window. Correspondingly, the gray values in the new window area can be regarded as bij (i, j = 1, 2, 3, 4, 5). Assuming that D < TK, this pixel value can be viewed as a normal, undamaged pixel value; otherwise, the median value is employed to replace it and the filtering process is conducted. By updating each value, the next pixel will be addressed until all pixels in the targeted image have been processed completely.
It should be noted that when making noise judgments, 3 × 3 and 5 × 5 windows may be used when processing. They also may be utilized to conduct the median replacement for a low-density-noise grayscale image. However, along with an increase in high-density noise, the probability of non-noise pixel points decreases, which may result in poor image denoising effects. Hence, in the proposed improved TSETMF algorithm, median filter pixel replacement is conducted using the 5 × 5 window.
In the proposed TSETMF algorithm, a 3 × 3 window can be used first to conduct noise judgment. If the central value of the window is judged as non-noise, it is not utilized in the subsequent filtering process with minor computational effort. On the contrary, the window size cannot be adjusted to fit the noise levels in different areas. This can result in inflexible denoising effects when processing the noise in different areas. In high-density-noise areas in particular, the smaller window is unable to adequately identify the noise; thus, the accuracy of the median replacement may be limited. However, adopting the 5 × 5 window can improve the filtering effects with relatively minor computational effort, which can also avoid the problem of misjudging details as noise. In addition, the larger window may promote the accuracy of the median replacement; however, the filtering effects present a modest improvement with the increase in the window size and, correspondingly, more computational effort is required. Consequently, in view of the filtering effects and efficiency, two filtering windows, 3 × 3 and 5 × 5, can be adopted to achieve better denoising for high-density-noise grayscale images.

3.3. TSETMF Process

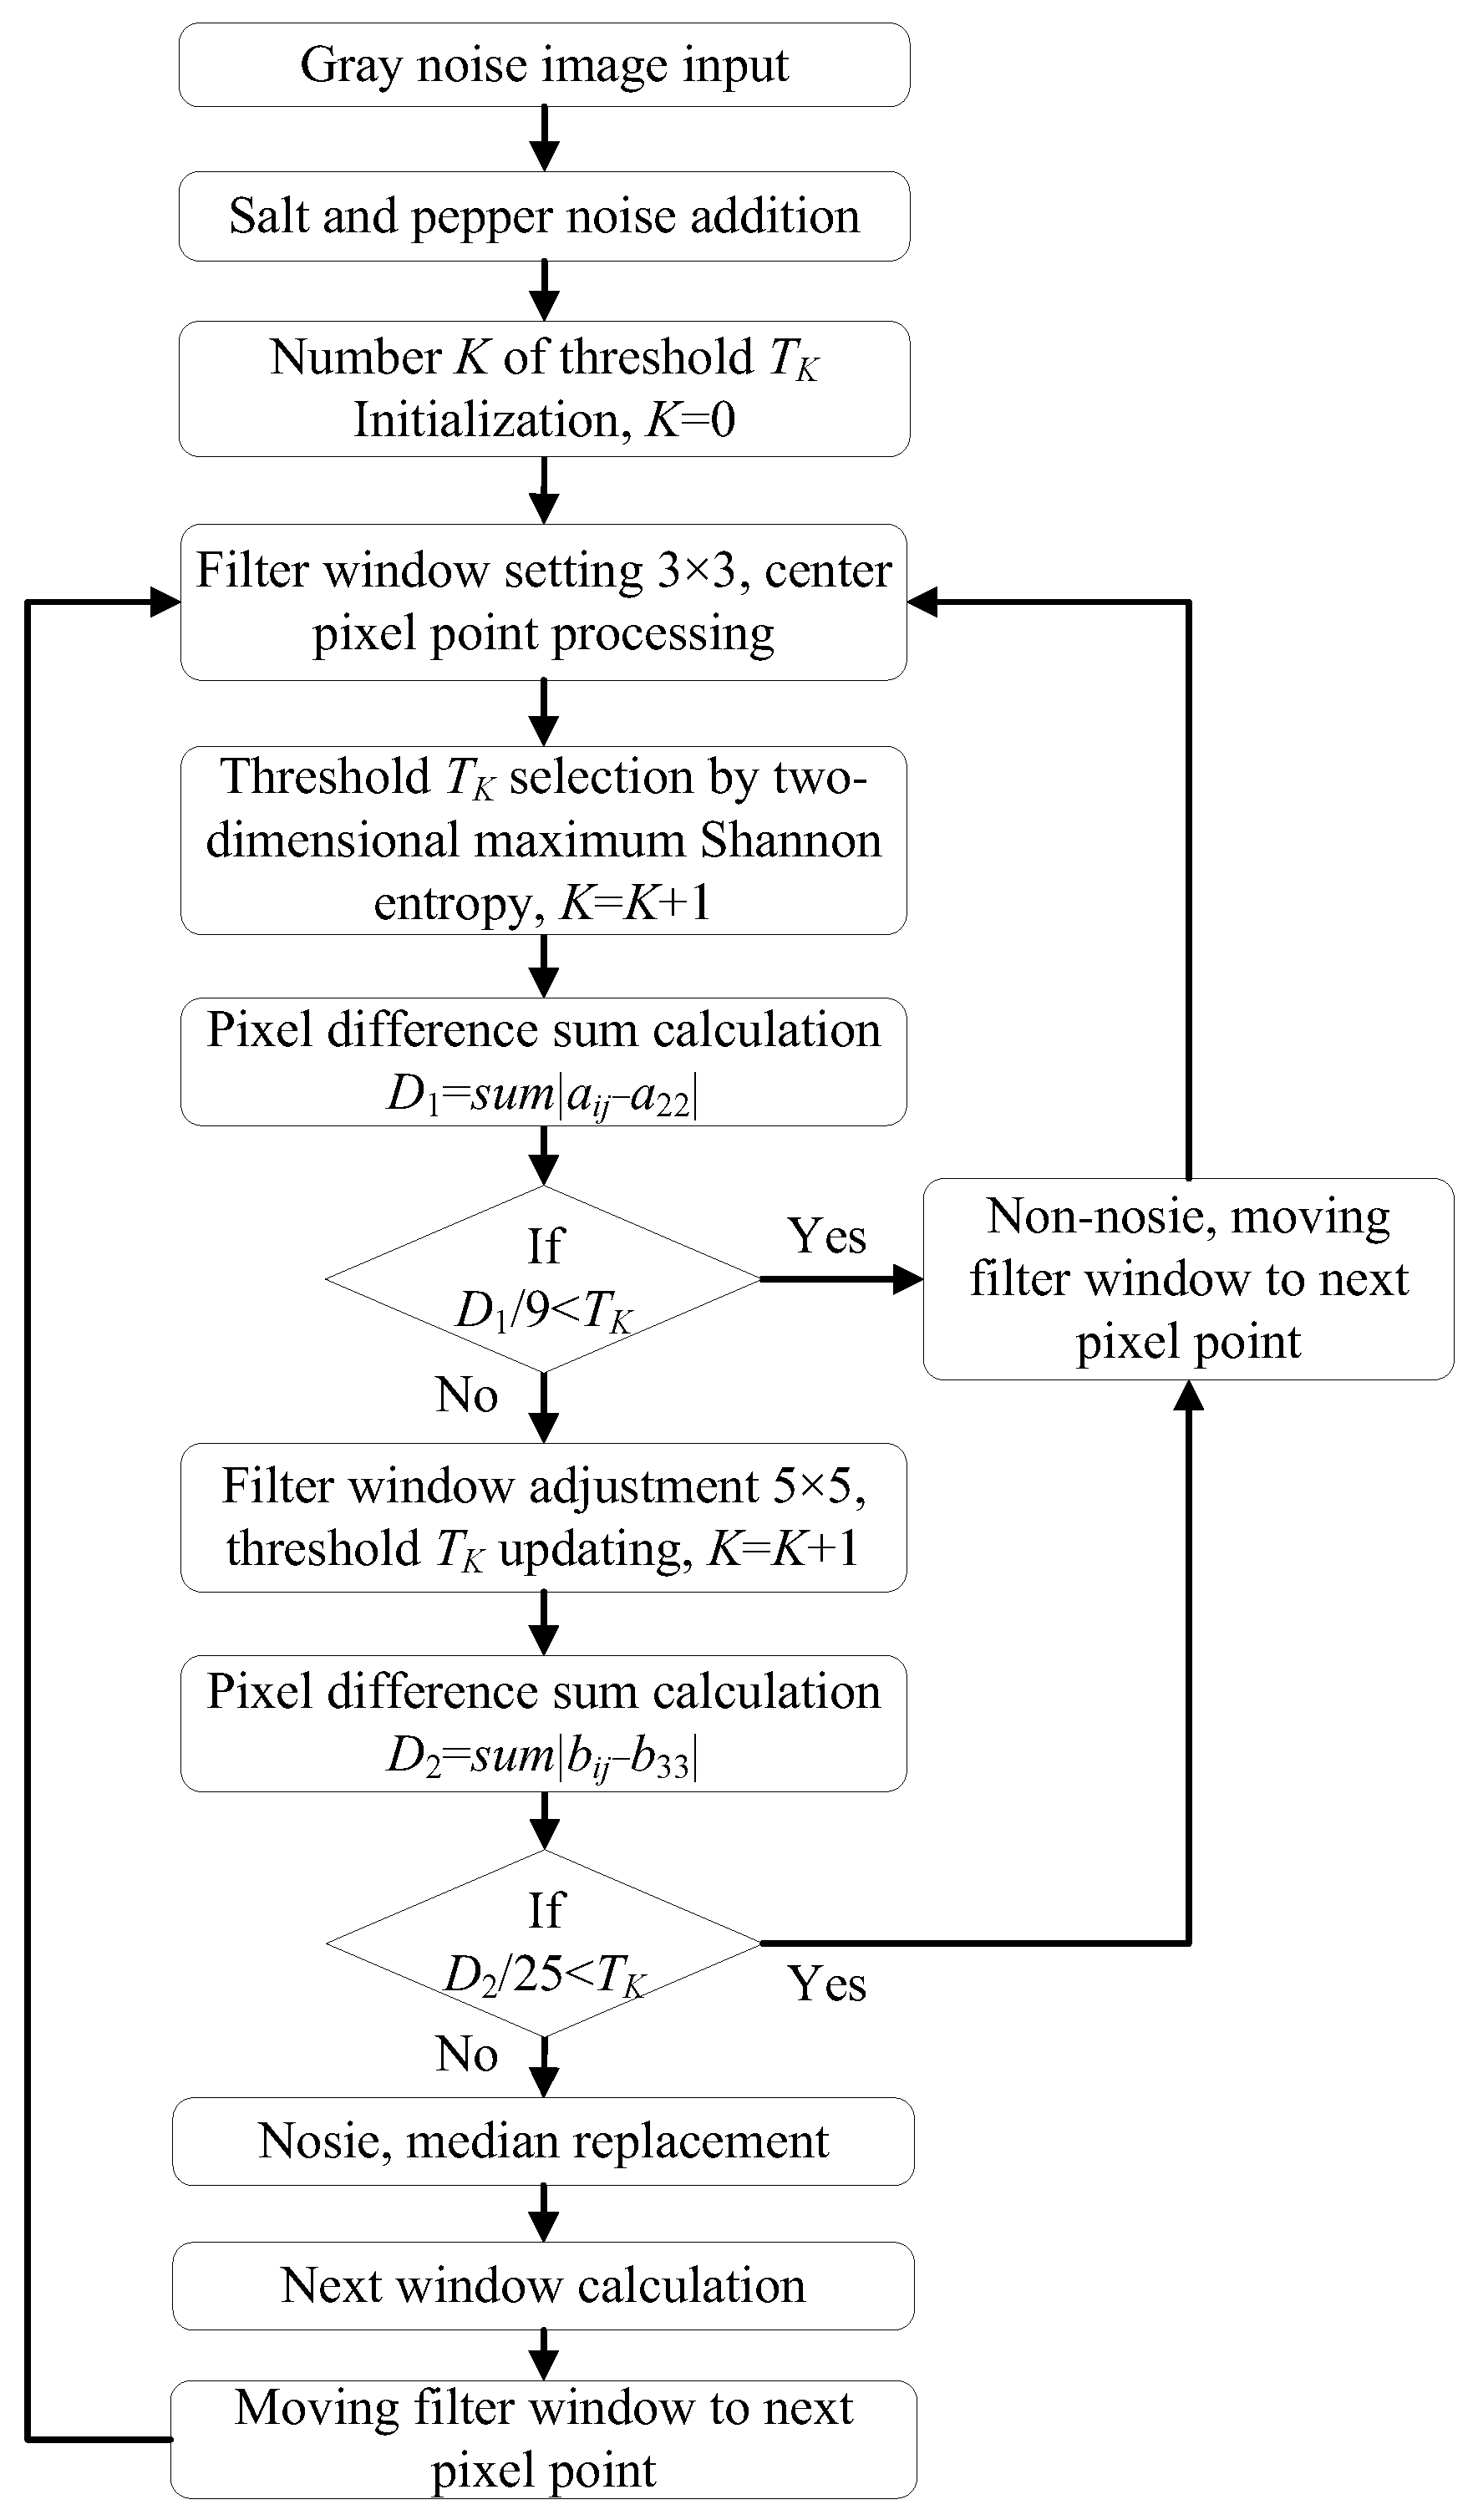
According to the above-mentioned design concept, the design process of the improved TSETMF algorithm can be described as follows. Figure 2 shows a flow chart of the proposed TSETMF algorithm.
The relevant steps of the improved median filter using two-dimensional maximum Shannon entropy for use with high-noise grayscale images are as follows:
Step 1: Input a noise image N = (N(m, n)), composed by pixel N(m, n);
Step 2: Acquire the gray-level histogram and judge the contrast ratio;
Step 3: Filter, including five substeps;
Substep 3.1: Set a filter window to 3 × 3. A threshold value T can be calculated using the two-dimensional maximum Shannon entropy threshold value method, where the entropy threshold TK = T, T = arg min 0 < t < L 1 | H 0 s , t H 1 s , t | 2 , and the initial K value is 0, K = K + 1 (K represents the number of threshold values T);
Substep 3.2: Calculate the sum of the pixel difference D1 = sum|aija22|. If D1/9 < TK, a22 is non-noise, move the filter window to the next pixel point and return to Substep 3.1;
Substep 3.3: Otherwise, carry out the next step;
Substep 3.4: Adjust the filter window to 5 × 5, update the entropy threshold TK, K = K + 1, and calculate D2 = sum|bijb33|. If D2/25 < TK, b33 is non-noise and, therefore, the filter window can be moved to the next pixel point. Return to Substep 3.1;
Substep 3.5: Otherwise, replace b33 by utilizing the median and, then, reserve and deliver the replaced value to conduct the next filtering step based on the recursion method. Move the filter window to the next pixel point and return to Substep 3.1;
Step 4: The filter window traverses the whole image and finishes filtering;
Step 5: The denoised image is outputted.
By analyzing the framework of the improved TSETMF, the two-dimensional maximum Shannon entropy of the inputted image can be calculated to reflect the abundant information degree in different zones of the image. Based on the computation results of the two-dimensional maximum Shannon entropy, it can be confirmed that the threshold values fit with the local areas of the image. Afterward, the image can be divided into different-sized windows according to the comparisons between the calculated threshold value and the pixel difference mean value. Here, 3 × 3 and 5 × 5 windows can be selected to judge the noise and, then, a median replacement can be conducted using the 5 × 5 window. The replaced value can be reserved and delivered using the recursion method for application in the next filtering process calculations. Therefore, the improved TSETMF can more effectively fit the noise level in different zones, thus enhancing the filtering effects of high-density-noise images.
Furthermore, it should be pointed out that window size selection may affect the noise judgment accuracy and median replacement effect of the algorithm. As for noise judgment, the image’s local details may be judged as noise by mistake in a 3 × 3 window; thus, a 5 × 5 window can be selected to identify noise and non-noise values more accurately when considering more image information. As for median replacement, the ranked median values are likely to remain as noise in a 3 × 3 window; thus, a 5 × 5 window can be selected to conduct ranking and median replacement to increase the non-noise probability while processing high-density salt and pepper noise. Additionally, the computational effort may increase if a larger window size is selected. As a result, better denoising effects can be realized by adopting the appropriate window size to filter high-density salt and pepper noise in the improved TSETMF algorithm.
Compared with the traditional median filter, the proposed TSETMF algorithm can process the features in different areas by adjusting the adaptive filtering window and it can reduce the features that are misjudged as noise by comparing neighborhood pixel differences. Additionally, high-density noise can be reduced by utilizing two-dimensional maximum Shannon entropy threshold values coupled with the recursion method.

4. Experimental Results and Discussion

In order to verify the reasonability of the proposed improved TSETMF algorithm, classical grayscale images in three different scenarios were used as samples in contrast experiments. Three filtering methods relevant to high-density denoising were used to compare with the proposed improved TSETMF, including the pixel-density-based trimmed median filter (PDBTMF) [58], modified decision-based median filter (MDBMF) [59], and adaptive dual-threshold median filter (ADTMF) [25]. Additionally, two assessment methods, including the peak signal-to-noise ratio and the structural similarity index measure (SSIM), were employed to carry out the experimental comparison analysis and discussion.

4.1. Assessment Methods

To assess the performance of different image denoising methods, PSNR and SSIM indexes can be utilized to effectively evaluate denoising algorithms. The indexes consider the overall quantification and perception of image quality.

4.1.1. PSNR

Peak signal-to-noise ratio can be used to assess the distortion degree of the original image after processing. In other words, a larger PSNR represents better image quality and a larger ratio of signal and noise shows that the signal can be more easily extracted. The computational formula of PSNR can be expressed as:
P S N R = 10 × log 10 N × M A X I 2 i = 1 N I o r i g ( i ) I c o m p ( i ) 2
where M A X I 2 represents the maximum pixel value, Iorig is the pixel value in the original image, Icomp is the pixel value in the handled image, and N is the pixel quantity.

4.1.2. SSIM

The structural similarity index measure is an evaluation index used to compare the structural similarity between two images. By calculating the index SSIM, a difference between the output image and the undistorted image can be quantified to evaluate the quality of image recovery. That is, a larger SSIM represents better image quality, which can illustrate the minor differences between the output image and the undistorted image. By comparing the brightness, contrast ratio, and structure of two images, SSIM can be used to quantify the levels of similarity [60]. The computational formula of SSIM can be expressed as:
S S I M x ,   y = l x ,   y α c x ,   y β s x ,   y γ
where l(x, y) represents the brightness, c(x, y) represents the contrast ratio, s(x, y) represents the structure, x is the original image, and y is the denoised image.
The structural factor accounts for the majority of the calculation. When α = β = γ = 1 and c3 = c2/2, the computational formula of SSIM can also be expressed as:
S S I M x ,   y = 2 μ x μ y + C 1 2 σ x σ y + C 2 μ x 2 + μ y 2 + C 1 σ x 2 + σ y 2 + C 2
where μ is the corresponding mean value, C is a denominator adjustment parameter and σ2 is the corresponding variance.

4.2. Results and Discussion

In order to assess the advantages of the proposed TSETMF denoising algorithm to improve the grayscale image quality, three kinds of standard images were selected as the denoising objects to conduct contrast verifications in MATLAB, including Lena (256 × 256 pixels) [61], Cameraman (504 × 505 pixels) [62], and COVID (1070 × 1200 pixels) [63]. Lena and Cameraman are the classical images for grayscale image processing and COVID is the grayscale micrograph. By adding different densities of salt and pepper noise, the ability of four filter algorithms to address different high-density-noise grayscale images was examined. The density was continuously increased from 5% to 95% in increments of 5%.

4.2.1. Contrastive Denoising with 95% High-Density Noise

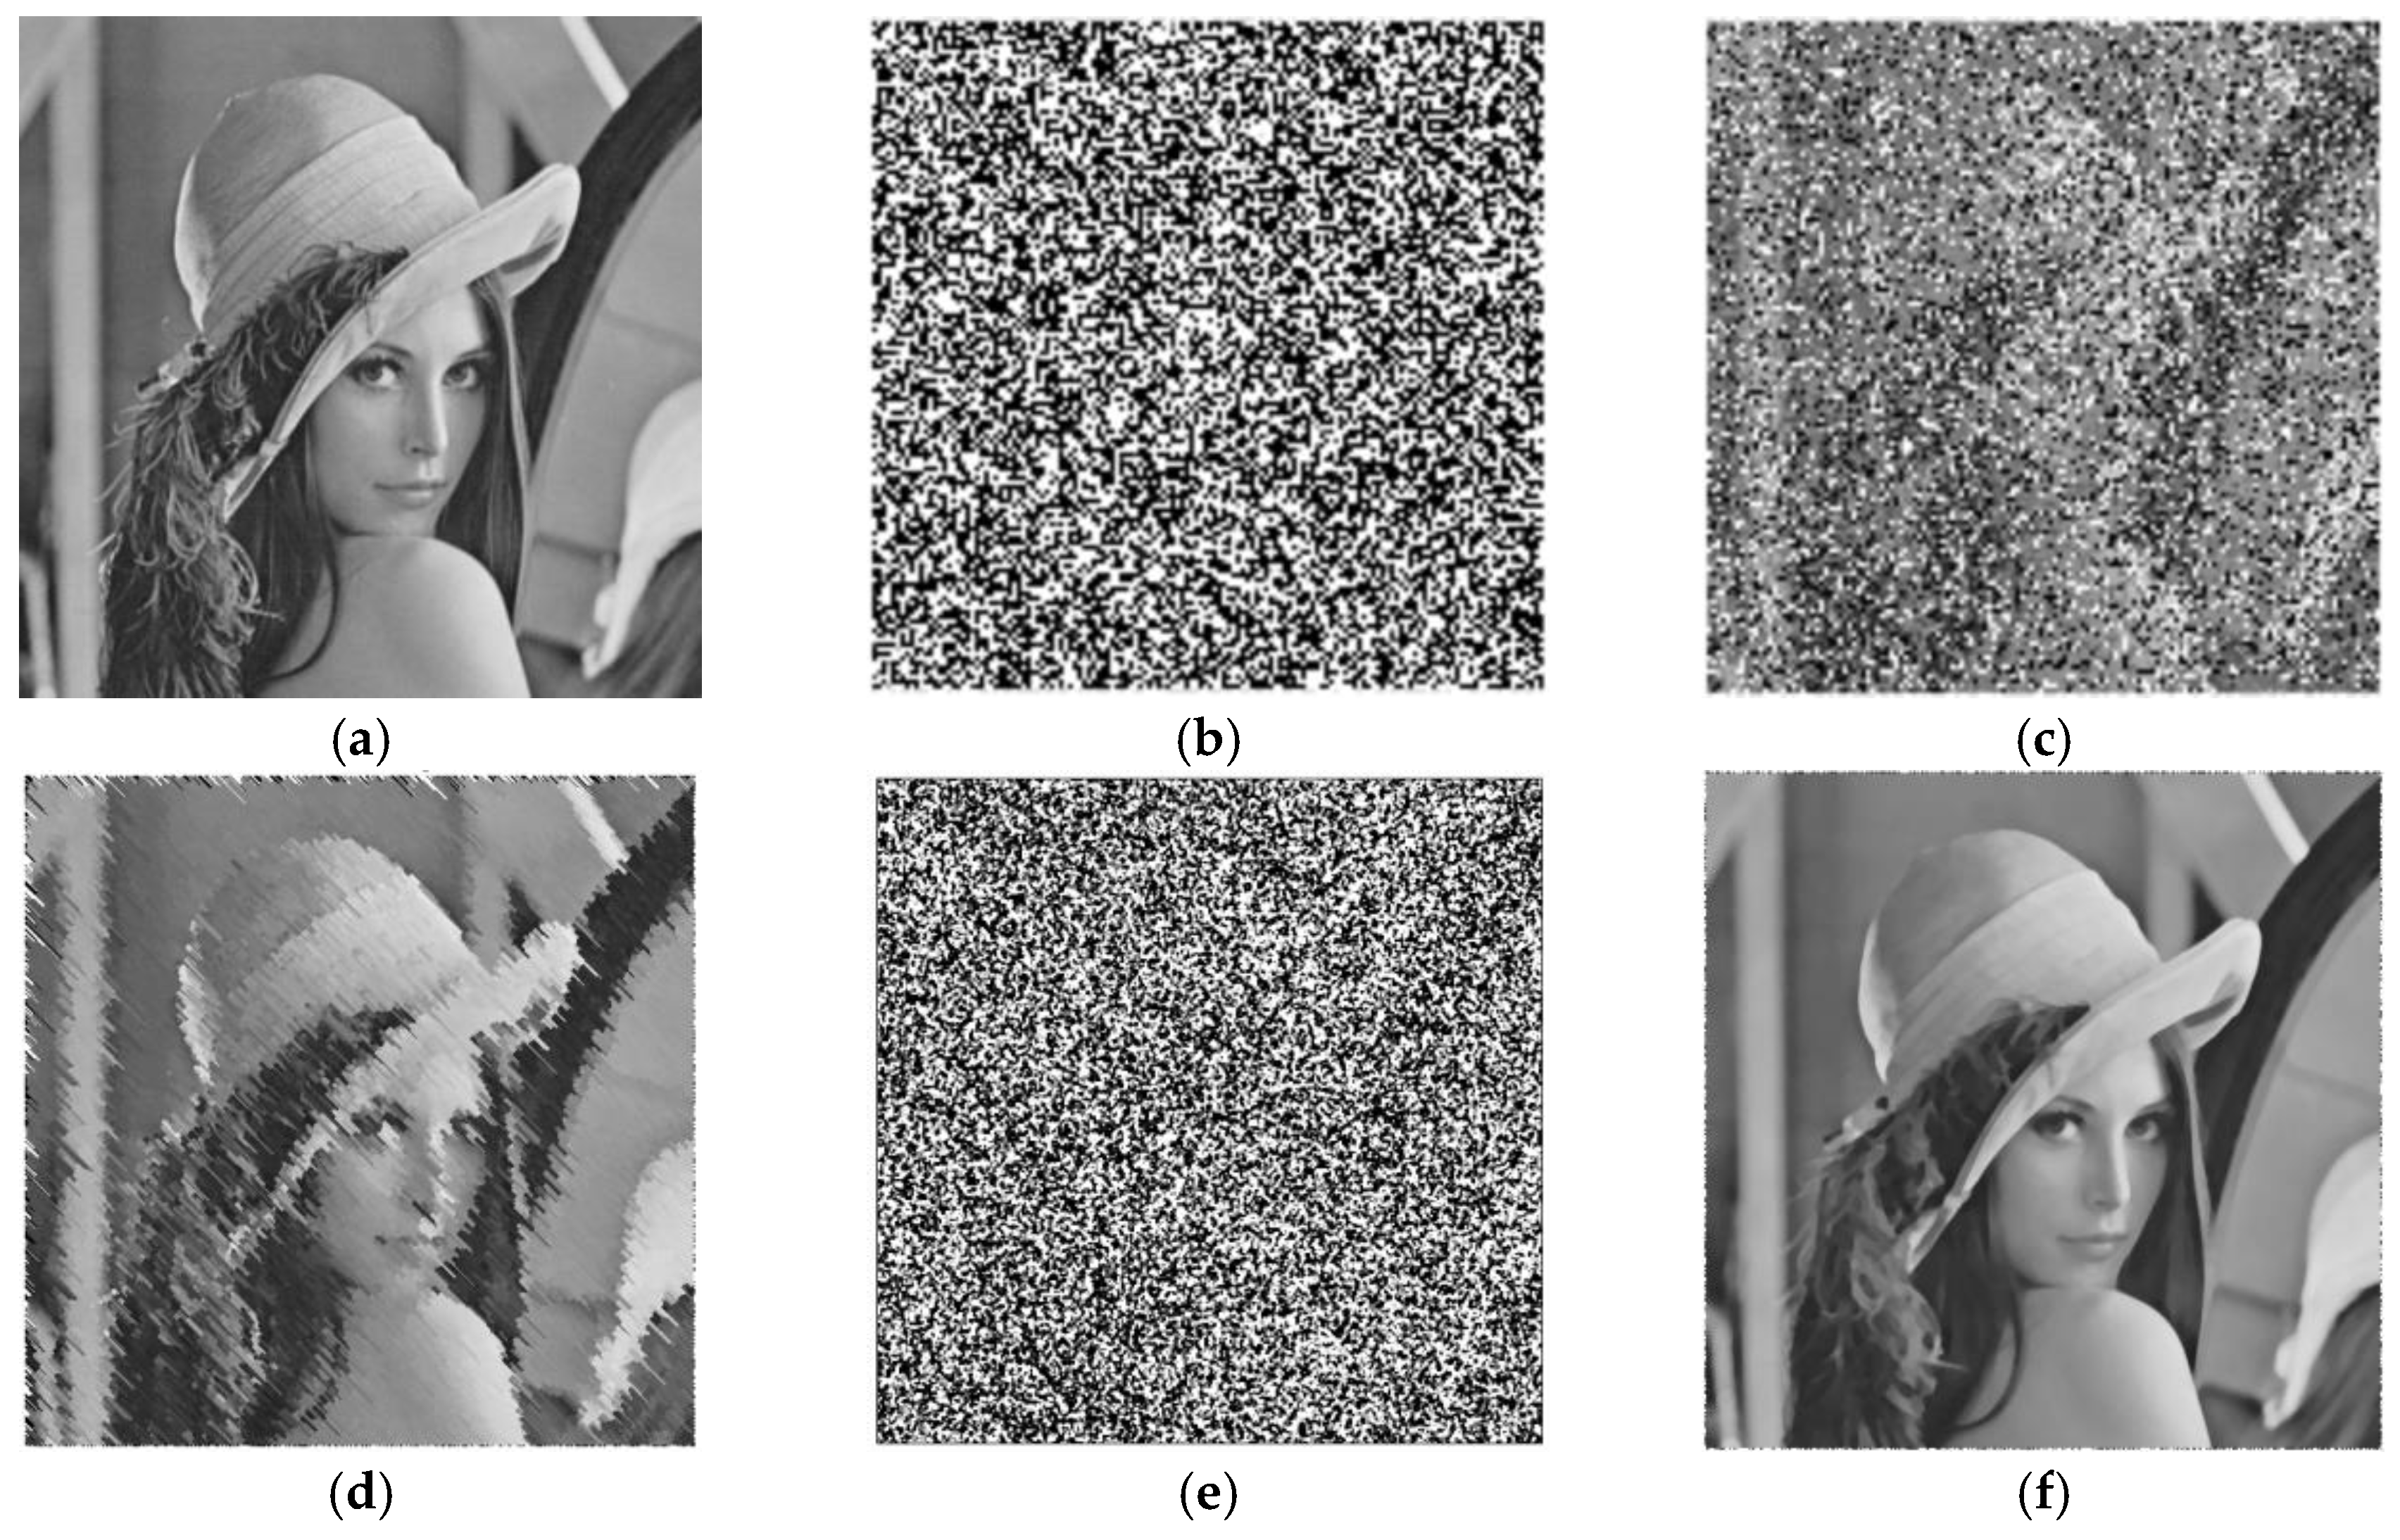
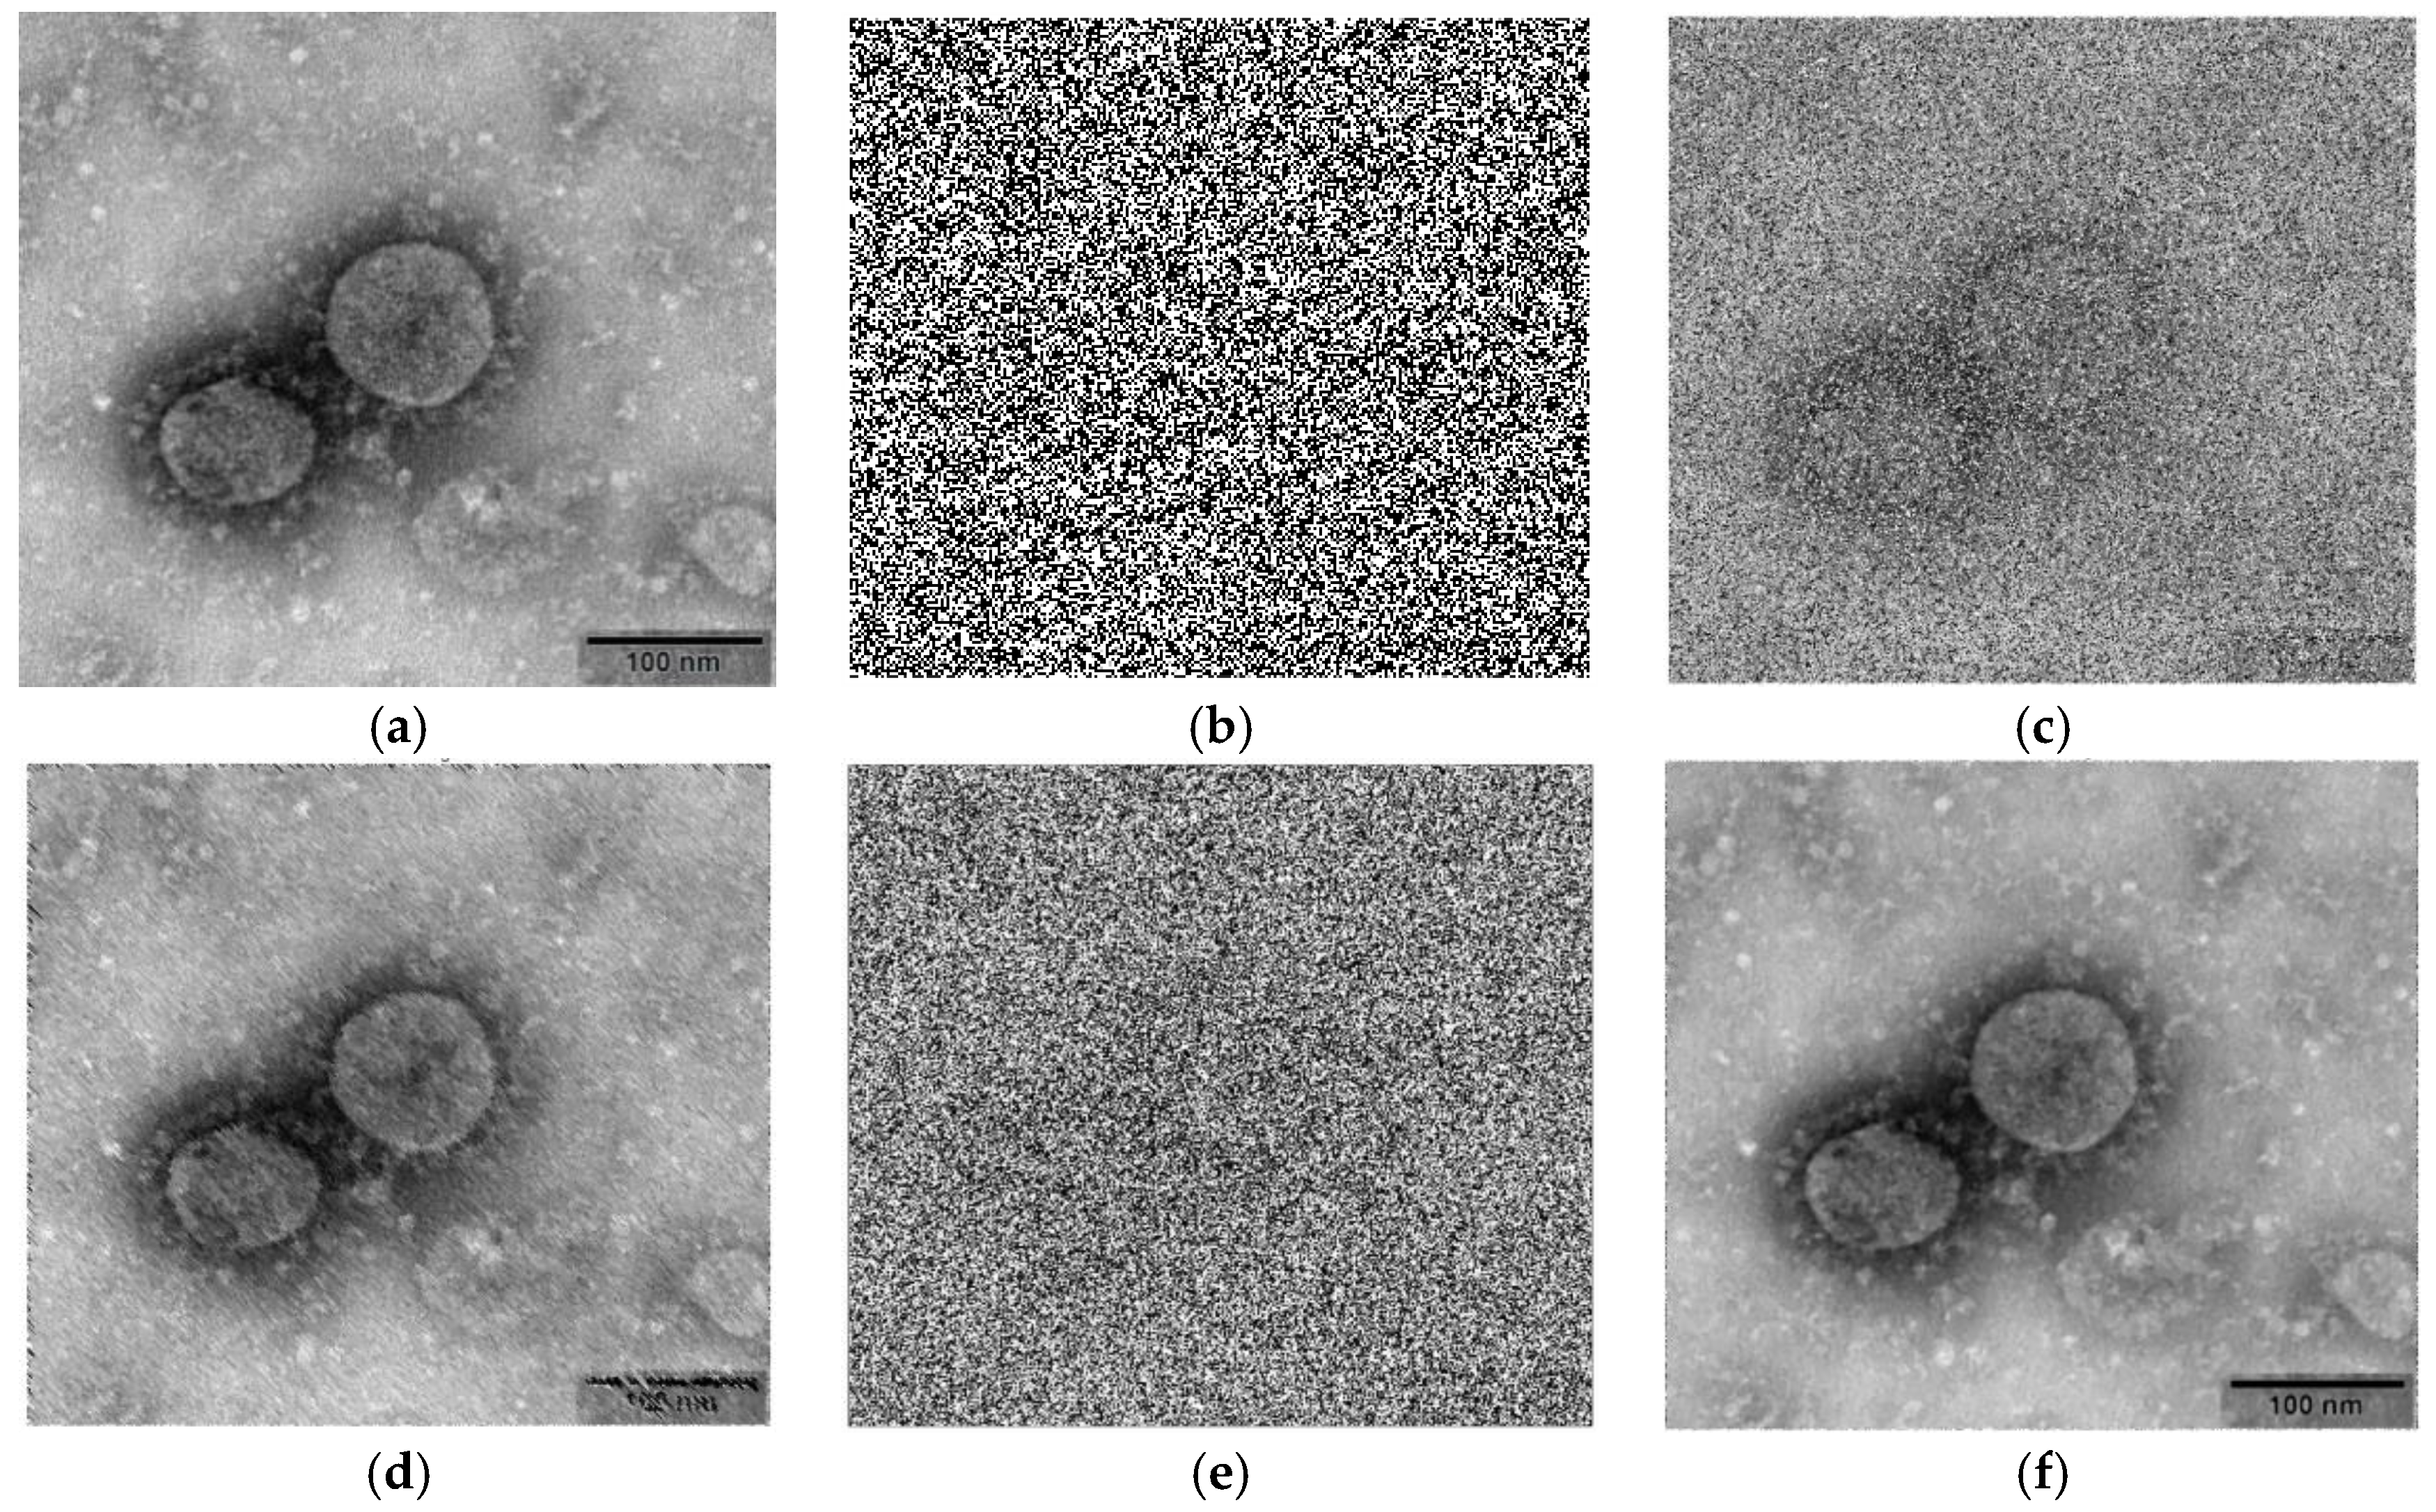
To visually illustrate the contrastive denoising effects, salt and pepper noise at a density of 95% was artificially added to exhibit the contrastive denoising effects. This was added using the code noisy_img = imnoise(img, ‘salt & pepper’, 0.95) in MATLAB R2016b. As illustrated in Figure 3, Figure 4 and Figure 5, the denoising of the Lena, Cameraman, and COVID images was conducted using the PDBTMF, MDBMF, and ADTMF algorithms and the results compared with the proposed improved TSETMF algorithm with 95% high-density noise. Figure 3a, Figure 4a and Figure 5a present the original Lena, Cameraman, and COVID images without noise, respectively. Figure 3b, Figure 4b and Figure 5b present the same images with 95% density noise, respectively. These were the input images for the denoising experiments using the various algorithms. Figure 3c–e, Figure 4c–e and Figure 5c–e present the denoising effects of the PDBTMF, MDBMF, and ADTMF algorithms on the images, respectively. Figure 3f, Figure 4f and Figure 5f present the denoising effects of the proposed improved TSETMF algorithm on the three images, respectively. It should be noted that the PDBTMF algorithm removes noise by comparing the numerical relationships between the current pixel and the neighboring pixels [64]. The MDBMF algorithm is a non-linear salt and pepper filter able to maintain the signal edges [65].
Figure 3, Figure 4 and Figure 5 demonstrate that the PDBTMF, MDBMF, and ADTMF algorithms individually present a dramatic decline in denoising effects. For instance, the processing of the Lena image with 95% high-density salt and pepper noise displayed relatively distinct differences in the effects. Figure 3e shows the poor denoising effect achieved using ADTMF; however, the filter properties of PDBTMF with a significant amount of noise shown in Figure 3c are superior to ADTMF. Although the filter properties of MDBFM provide better denoising effects, some noise still exists, as shown in Figure 3d. By comparison, the proposed improved TSETMF algorithm exhibits little observable noise and a high degree of image smoothing and the denoising effects of this algorithm are superior to the other three. In general, the proposed improved TSETMF algorithm exhibits a relatively good filtering effect under high-density salt and pepper noise.

4.2.2. Contrastive Denoising with Continuous Increase in Noise Density

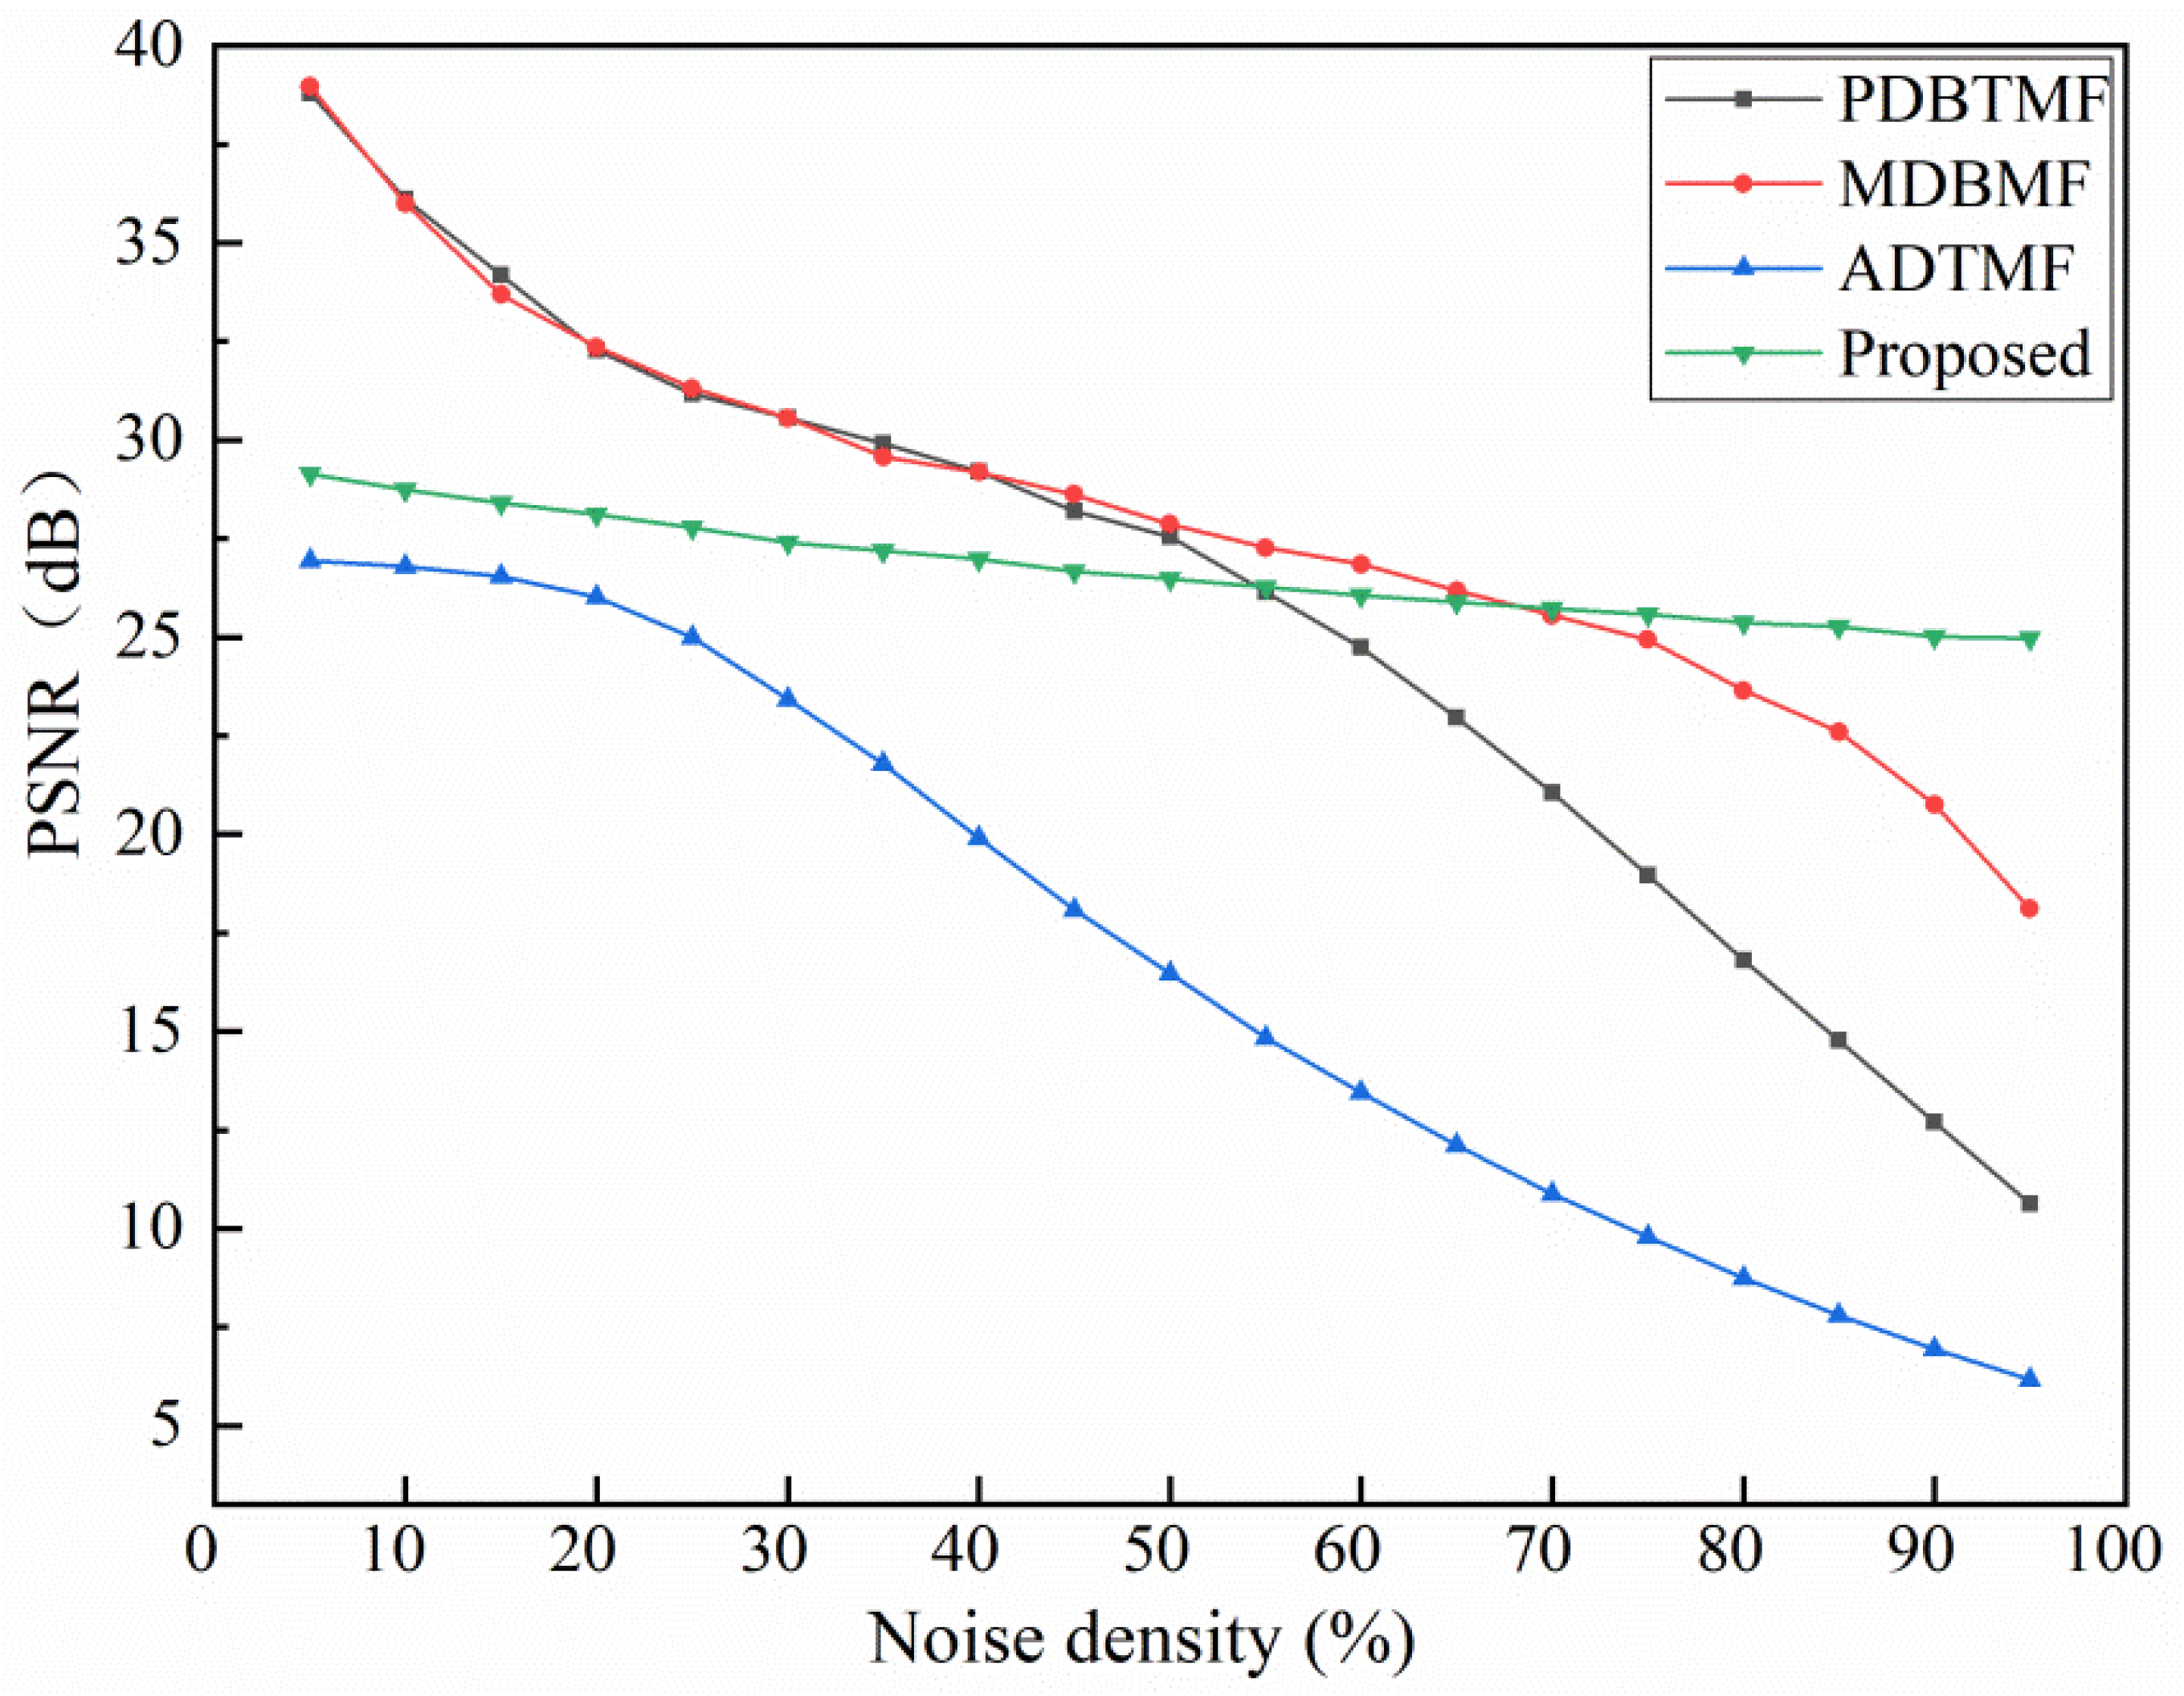
To visually illustrate the contrastive denoising effects achieved using the different algorithms, a continuous artificial increase in the noise density from 5% to 95% in increments of 5% was carried out to exhibit the denoising effects. The three classical algorithms with the parameters of PSNR and SSIM were utilized to evaluate the ability of the proposed improved TSETMF algorithm to process the first classical image, Lena. Table S1 represents PSNR comparison data from different algorithms processing Lena with increasing noise density. Figure 6 presents a change map of the PSNR with continuously increasing noise density according to the different algorithms’ processing of Lena. As can be seen from Figure 6, the PSNR values of the PDBTMF algorithm when processing the Lena image begin to slowly decline after around 20% noise density and the decline accelerates rapidly after 70% noise density. The PSNR values of the MDBMF algorithm begin to slowly decline after around 20% noise density and, then, the decline accelerates after 50% noise density. The stability of MDBMF’s processing effects is a little worse than that of PDBTMF. Although the PSNR values of the ADTMF algorithm show a relatively smooth declining tendency, the processing of the salt and pepper noise in the Lena image is poor. Compared with the other three filtering algorithms, the PSNR values of the proposed improved TSETMF algorithm at a 95% high-noise density reach 24.97 dB, which is much higher than that of PDBTMF at 10.63 dB, MDBMF at 18.11 dB, and ADTMF at 6.17 dB. In summary, the PSNR values of the proposed improved TSETMF algorithm always stabilize at around 25 dB and decline slowly with increasing noise density. This demonstrates that the proposed improved TSETMF algorithm can effectively enhance denoising stability when processing different noise densities.
In addition, Table S2 represents SSIM comparison data from different algorithms processing Lena with increasing noise density. Figure 7 presents the change map of the SSIM with continuously increasing noise density for the different algorithms processing Lena. For low-density noise, the PDBTMF algorithm exhibits relatively stable SSIM; however, it drops rapidly after around 40% noise density. The MDBMF algorithm obtains relatively higher SSIM but drops rapidly after around 60% noise density. The ADTMF algorithm possesses the highest SSIM under around 20% noise density. In summary, the SSIM values of the proposed improved TSETMF algorithm always stabilize above 0.81 with continuously increasing noise density. This demonstrates that the proposed improved TSETMF algorithm can effectively maintain the quality of the processed image at different noise densities, especially for high-density salt and pepper noise. It should be noted that the required running time of the proposed TSETMF algorithm is basically around 3.7 s, which is much faster than of the ADTMF algorithm. Differing from the other algorithms, although the proposed TSETMF algorithm has a relatively larger running time than that of the PDBTMF and MDBMF algorithms, it exhibits relatively stable states with increasing noise density, especially for high-density noise. Hence, this also demonstrates that the proposed TSETMF algorithm is insensitive to variable noise density.
To calculate the values of PSNR and SSIM, parameter variance is adopted. For the noise density calculations of the image, local variance in different areas, such as the noise index, can be utilized to analyze the grayscale image. Calculating the pixel value variance in each area can obtain the noise level in different areas. That is, a higher variance usually exhibits relatively stronger noise density. As a result, the noise levels of the whole grayscale image can be calculated to acquire the values of PSNR and SSIM for further comparison of the denoising effects of the algorithms.
In order to verify the advantages in image detail reservation ability using the proposed TSETMF algorithm, a partial Lena image with the addition of 95% salt and pepper noise was utilized to perform denoising, as illustrated in Figure 8. By employing two-dimensional maximum Shannon entropy coupled with pixel difference mean, an image detail can be judged to determine whether it is noise. The filtering processes for a local area in Figure 8b are presented in Figure 8c–e. Pixel 255 in Row 1 and Column 5 in Figure 8c is judged as the image detail; however, the central pixel in Row 3 and Column 3 is judged as the noise. The central pixel value is then changed to 127 in Figure 8d. After gradual processing of all pixel values in the red area, the replacement results are exhibited in Figure 8e. As can be seen from the filtering of the partial Lena image shown in Figure 8f, the proposed TSETMF algorithm can clearly achieve a better filtering effect by retaining the image details when denoising high-density-noise images.
In terms of visual effects, the denoising of the Lena image using the proposed TSETMF algorithm with various added salt and pepper noise densities of 30%, 50%, 70%, and 90% is shown in Figure 9. The results demonstrate that the quality of each denoised image increases remarkably and there are minor influences regardless of the changes in noise density. This may be interpreted using the high-efficiency noise judgment and recursion method, where highly efficient noise judgment can be accomplished using the two-dimensional maximum Shannon entropy threshold values. By utilizing the recursion method to achieve median replacement, filtering can be conducted by the processed adjacent pixels. This can induce the effects of the noise on an image immensely. The experiments indicated that the proposed TSETMF possesses strong robustness and is highly efficient in reducing high-density salt and pepper noise.
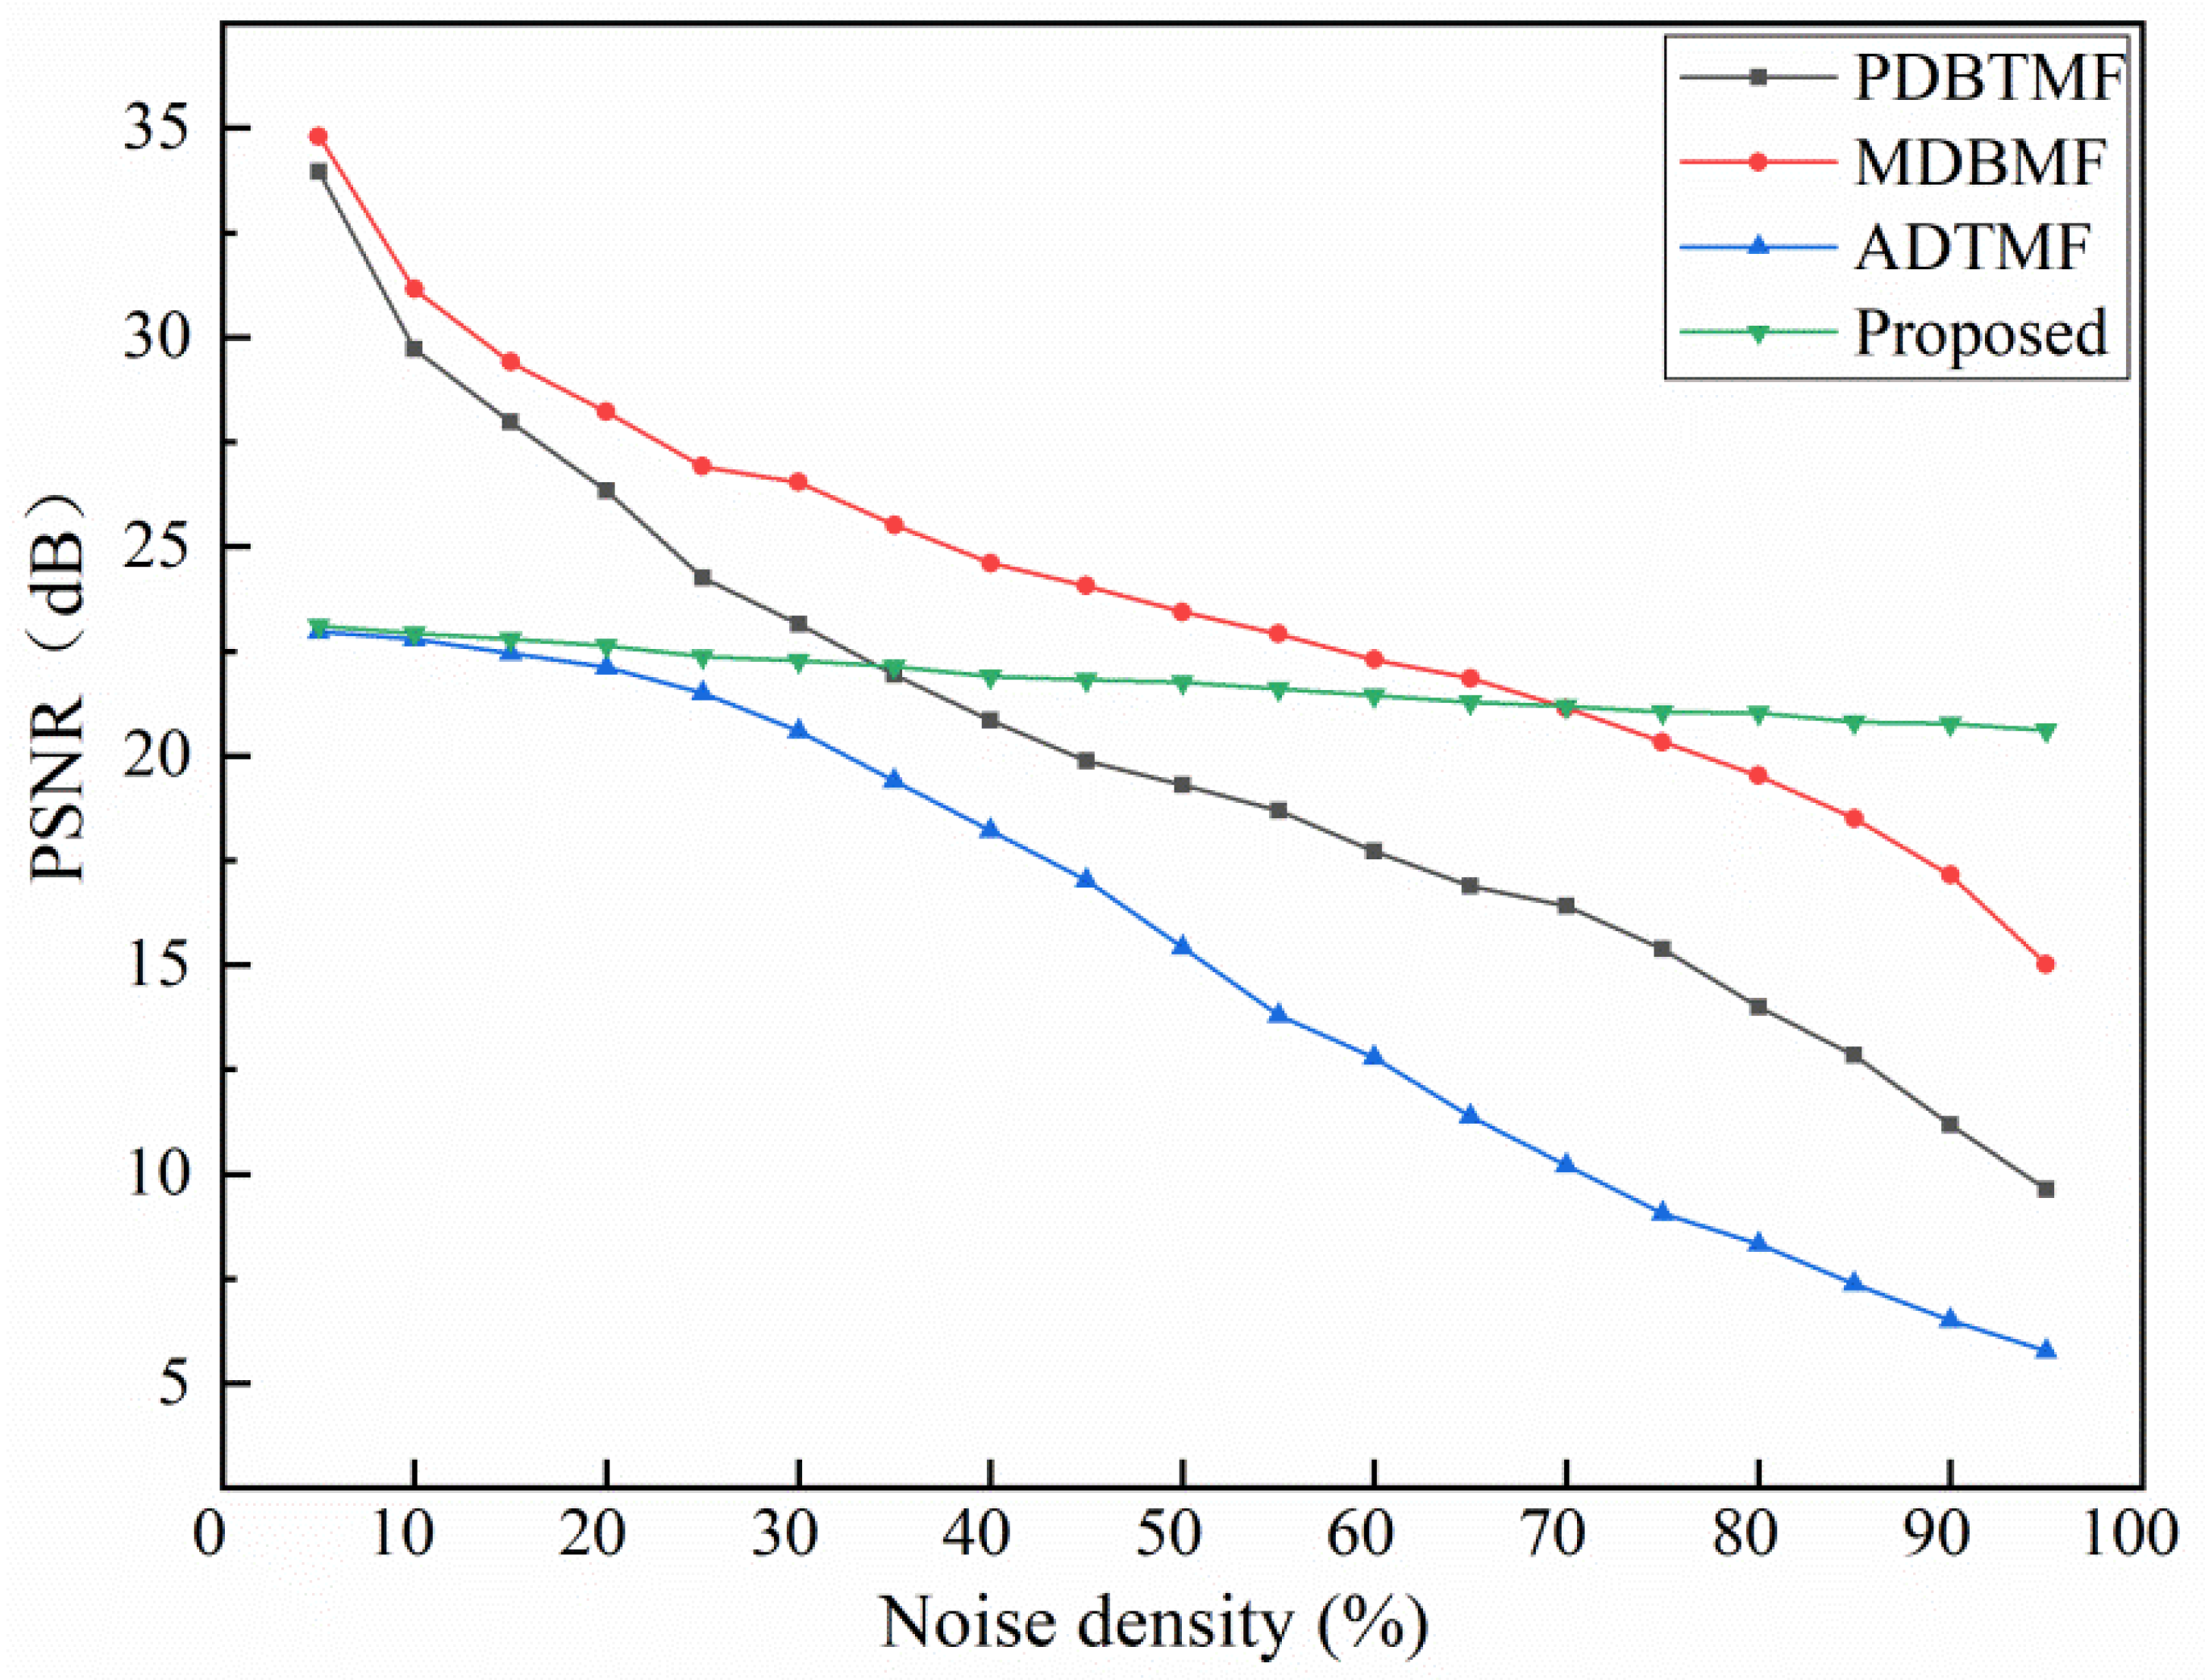
By utilizing the three classical algorithms, the PSNR and SSIM parameters were utilized to evaluate the abilities of the proposed improved TSETMF algorithm while processing the second classical image, Cameraman. Table S3 represents PSNR comparison data from different algorithms processing Cameraman with increasing noise density. Figure 10 presents the change map of PSNR with continuously increasing noise density for different algorithms processing Cameraman. Figure 10 shows that when the noise density varies from 5% to 95% in Cameraman, the PSNR values of the PDBTMF, MDBMF, and ADTMF algorithms decline steeply from 33.95 dB to 9.64 dB, from 34.81 dB to 15.02 dB, and from 22.96 dB to 5.77 dB, respectively. However, the decrease in the PSNR values of the proposed improved TSETMF algorithm is relatively minor, from 23.1 dB to 20.61 dB, with a mere 10.78% decline ratio. This can directly demonstrate that the proposed improved TSETMF algorithm has the most stable ability to process high-density noise. In other words, it works independently of noise density effects to accomplish the high-quality denoising of grayscale images.
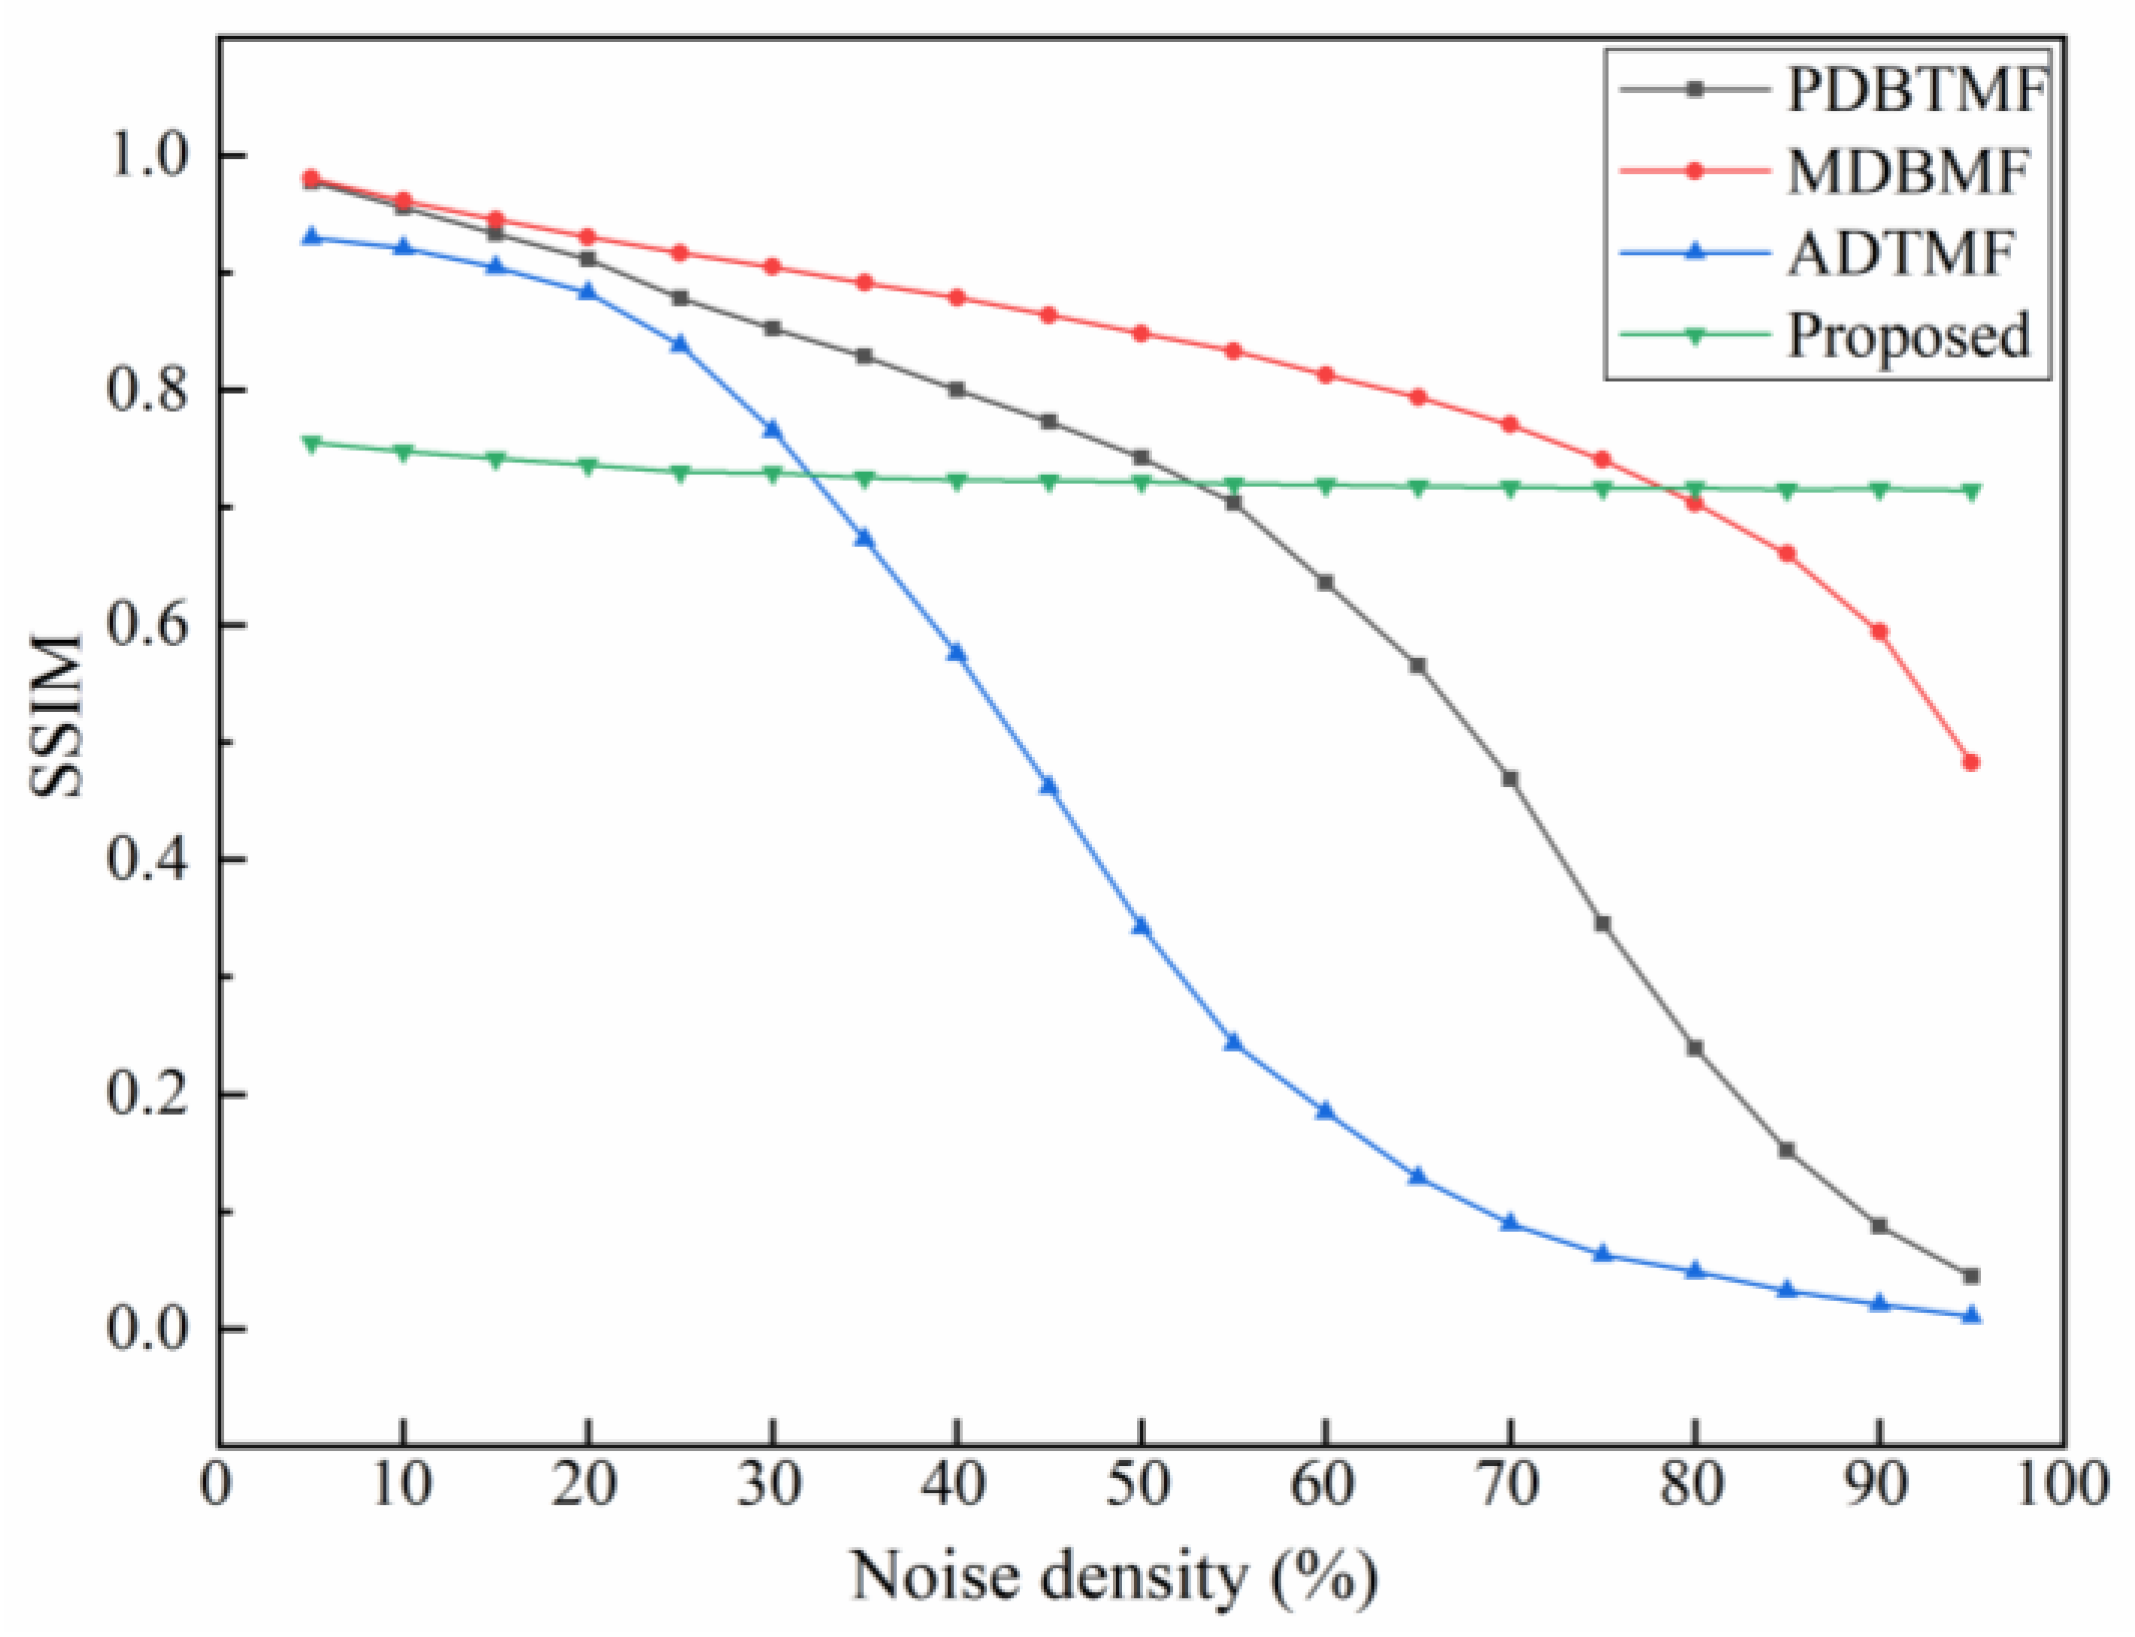
In addition, Table S4 represents SSIM comparison data from different algorithms processing Cameraman with increasing noise density. Figure 11 presents a change map of SSIM with continuously increasing noise density for different algorithms processing Cameraman. The PDBTMF algorithm exhibits relatively stable SSIM at low-density noise; however, it drops rapidly after around 50% noise density. The PDBTMF algorithm exhibits a more stable SSIM at noise densities of less than 70%. At lower noise densities not exceeding 25%, the ADTMF algorithm performs relatively well. However, the proposed improved TSETMF algorithm can achieve a higher and more stable SSIM above 0.71 at arbitrary noise densities. This finding also further demonstrates that the proposed algorithm can process the Cameraman image with good high-density-noise denoising effects and excellent stable image quality.
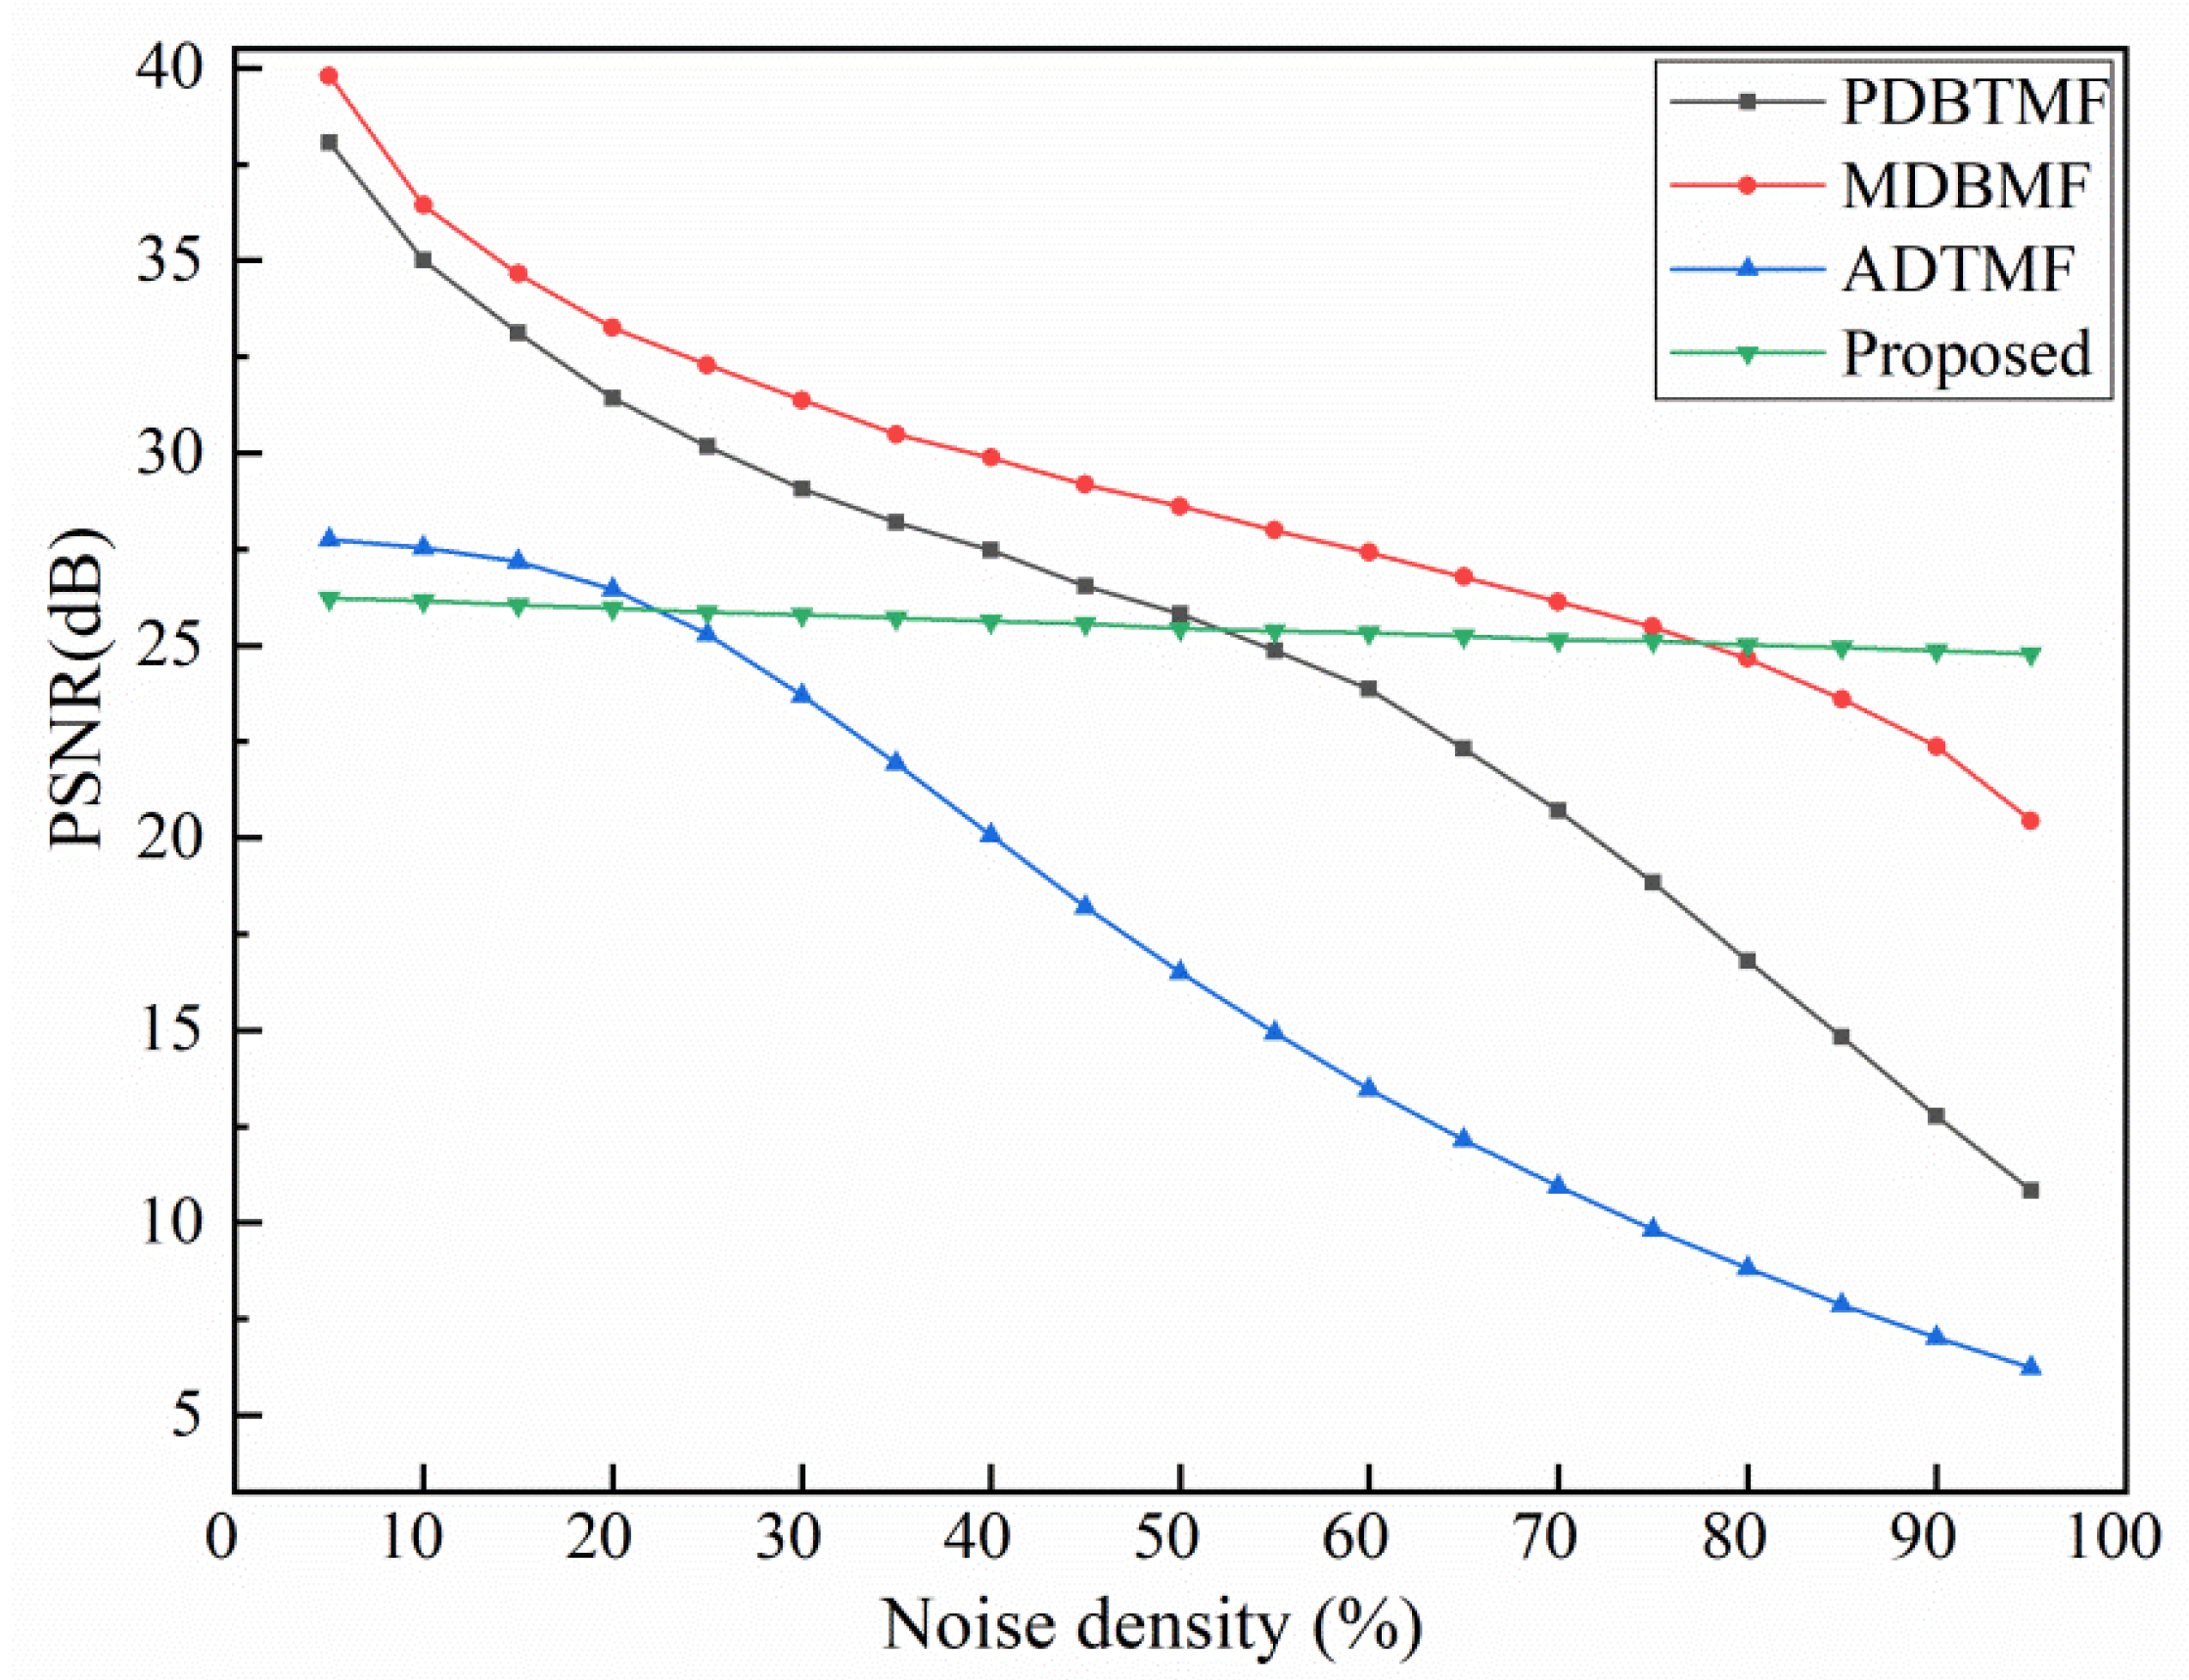
By utilizing the three classical algorithms, the PSNR and SSIM parameters were utilized to evaluate the abilities of the proposed improved TSETMF algorithm when processing the third classical image, COVID. Table S5 represents PSNR comparison data from different algorithms processing COVID with increasing noise density. Figure 12 presents a change map of PSNR with continuously increasing noise density for different algorithms processing COVID. As can be seen in Figure 12, the PSNR values of the PDBTMF, MDBMF, and ADTMF algorithms when processing the COVID image decreased by approximately 20 dB. Correspondingly, the larger negative slopes show that the three algorithms cannot handle the high-density salt and pepper noise of the COVID image. However, the decrease in the PSNR values of the proposed improved TSETMF algorithm is relatively minor, from 26.22 dB to 24.78 dB, with a mere 5.49% decline ratio. In particular, as the high-density noise varied from 5% to 95%, the proposed improved TSETMF algorithm exhibited the most stable denoising properties. In other words, this TSETMF algorithm works independently of the effects of noise density and achieves the most accurate and effective processing of the high-density salt and pepper noise in the COVID image.
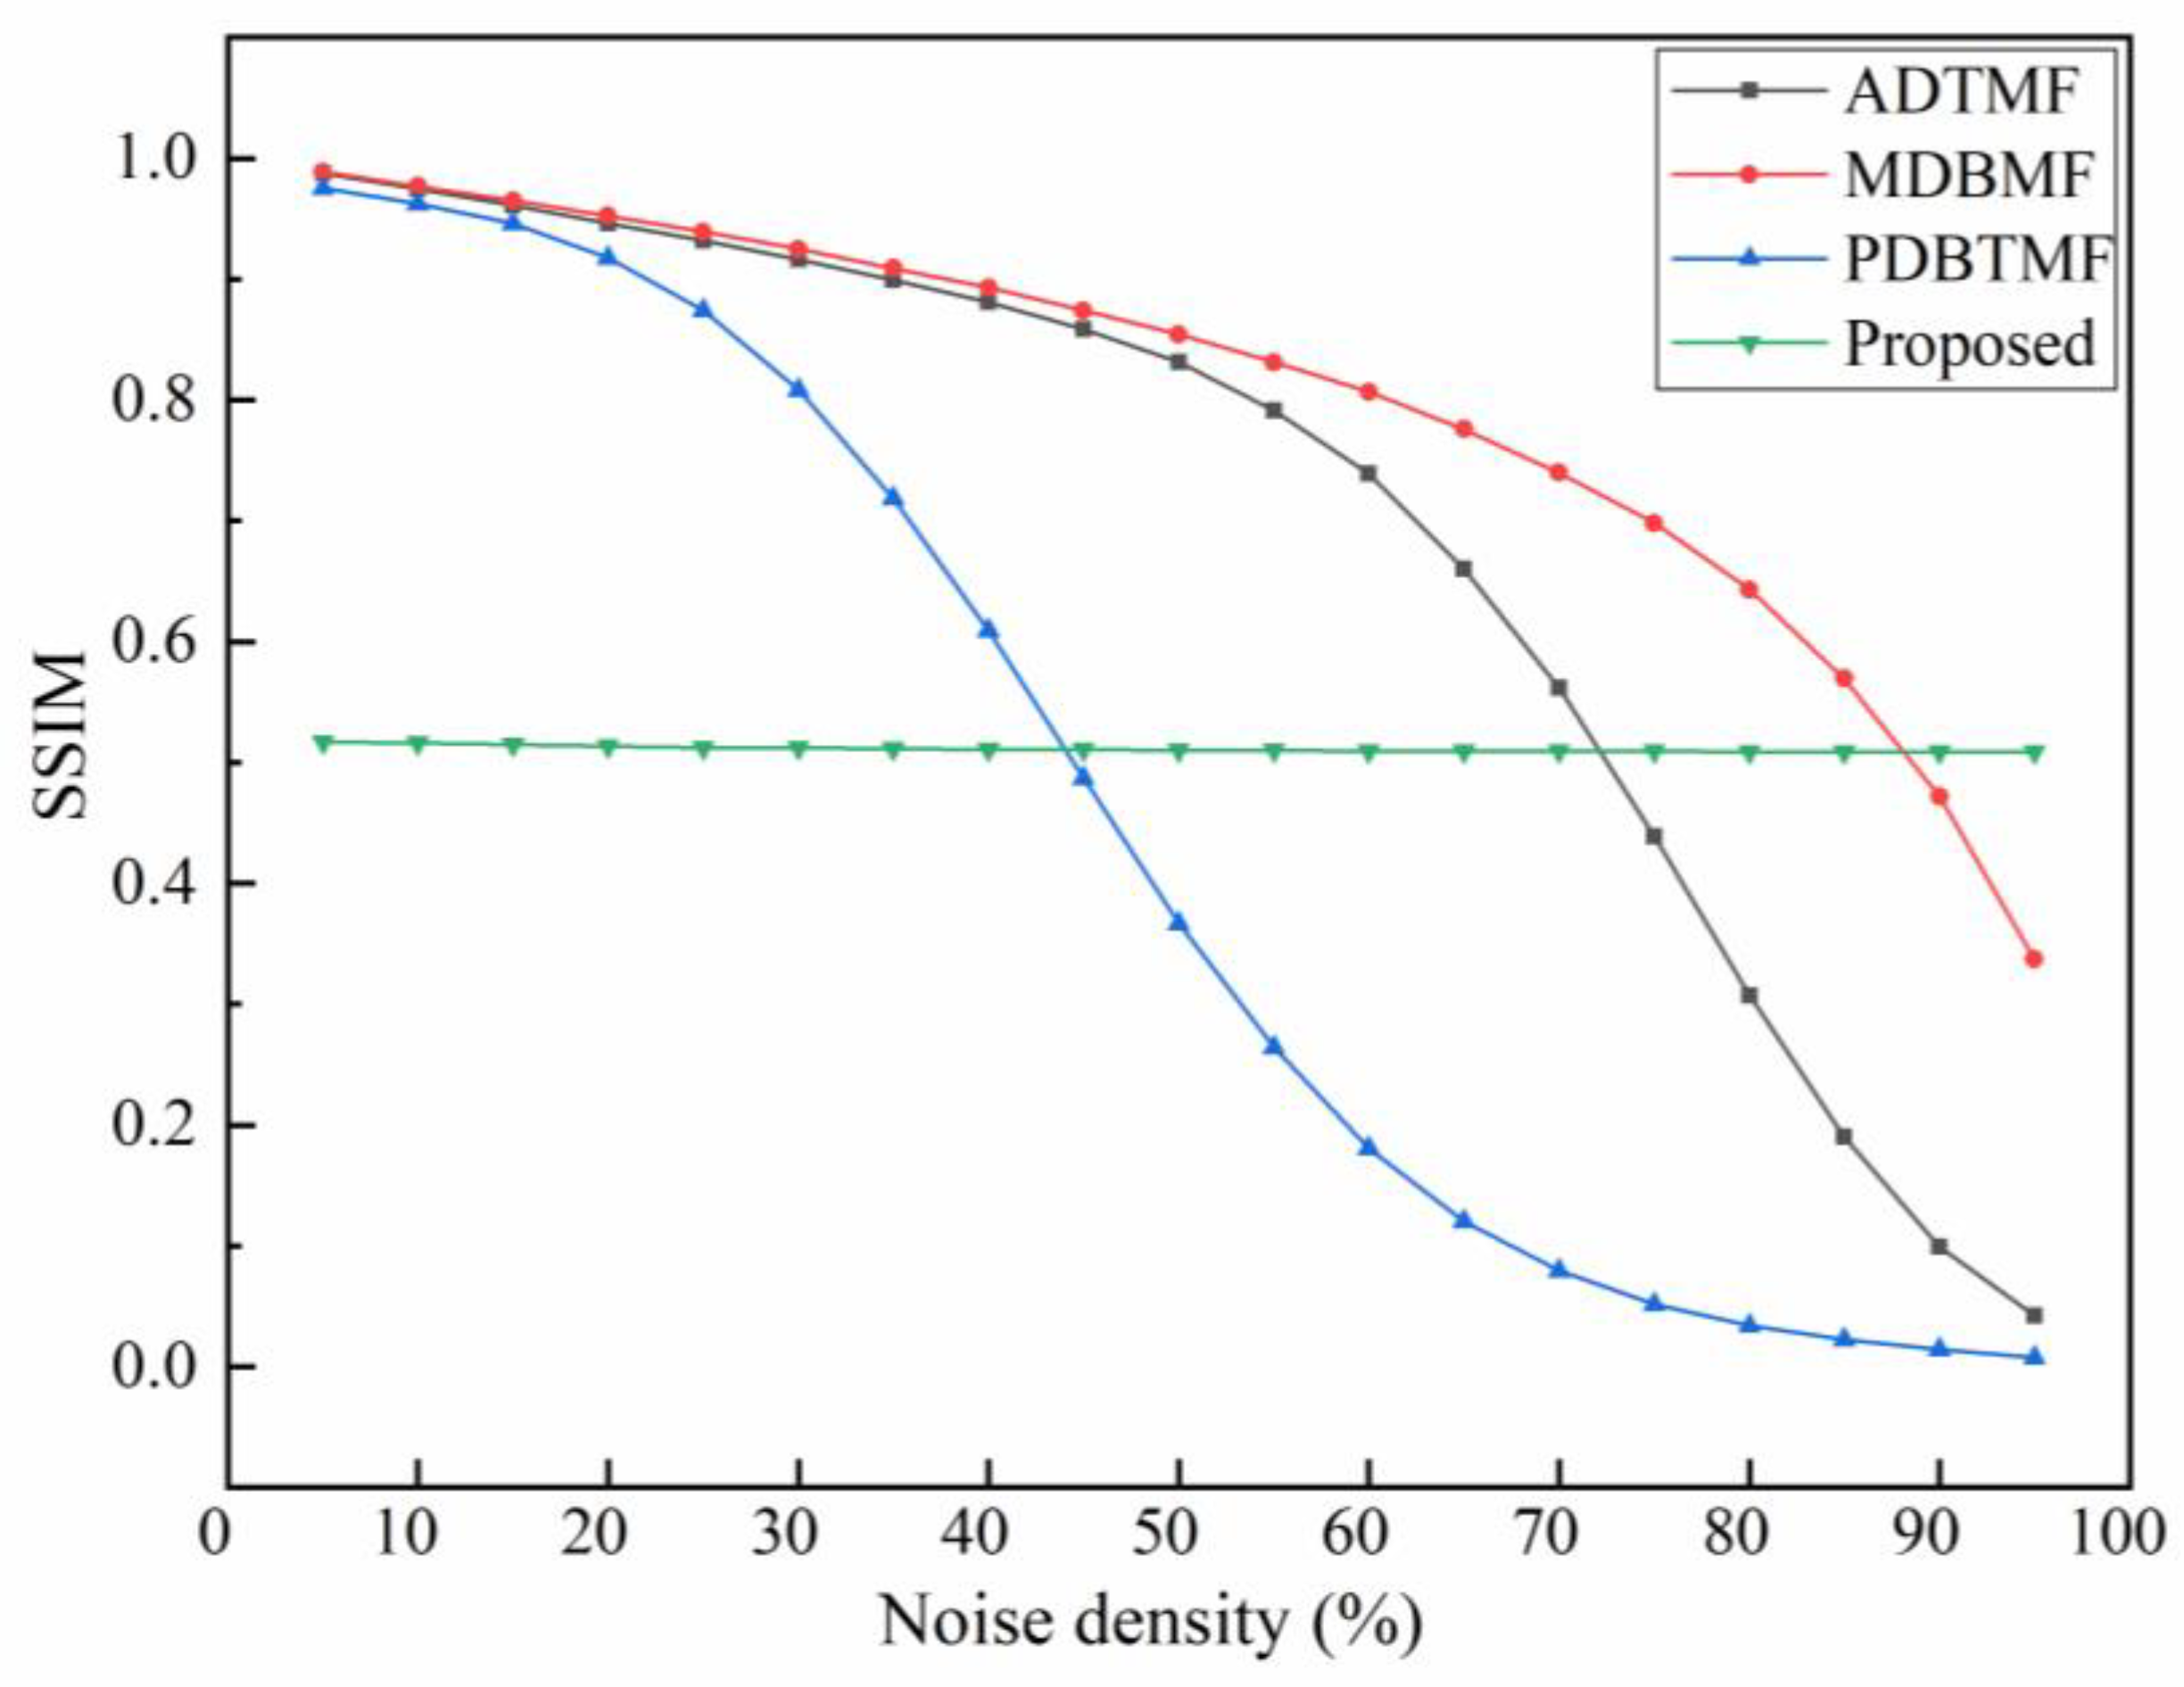
Table S6 represents SSIM comparison data from different algorithms processing COVID with increasing noise density. Figure 13 presents a change map of the SSIM with continuously increasing noise density for different algorithms processing COVID. The SSIM values of the PDBTMF algorithm express a declining tendency with increasing noise density but are inferior at higher-density noise. At the same time, the SSIM values of the PDBTMF algorithm decline sharply when the noise density is larger than 50%. However, the proposed improved TSETMF algorithm achieves a more stable SSIM above 0.51 at arbitrary noise densities. It should be illustrated that the SSIM is located at a relatively lower level; however, this TSETMF algorithm exhibits the most stable processing effects in terms of the denoising of high-density salt and pepper noise in the COVID image.
By comparing the processing effects of the three standard images of Lena, Cameraman, and COVID presented in Figure 6, Figure 10 and Figure 12, the PSNR values of the PDBTMF algorithm and the MDBMF algorithm can be used to show that they have relatively better denoising effects. This is due to the specially designed filter’s ability to process salt and pepper noise; whereas, it is not applicable to Gaussian noise or other noise. By contrast, the proposed improved TSETMF algorithm and the ADTMF algorithm can be utilized to address different types of noise. As can be observed from Figure 7, Figure 11 and Figure 13, it is obvious that the SSIM values obtained by the proposed improved TSETMF algorithm were the highest for Lena, followed by Cameraman and COVID, respectively. Additionally, with increasing pixel quantities, the level of similarity between the denoised image and the original image exhibited a minor decline; however, stability was basically maintained. Thus, the processing of more kinds of grayscale images should be conducted to explore the applicability of the proposed TSETMF algorithm and further improve the denoising performance and higher densities.
Furthermore, the minor descending PSNR values achieved by the proposed improved TSETMF algorithm demonstrate its better robustness and filtered image quality at higher-density noise levels. Also, the minor descending SSIM values achieved by TSETMF indicate that the algorithm has excellent denoising ability in the processing of higher-noise grayscale images. Moreover, this method can provide a unique approach to addressing denoising issues. Further, it can be advanced to promote high-noise filtering and stability when processing high-density salt and pepper noise in grayscale images.
Prospectively speaking, salt and pepper noise can be produced by transmission, analog-to-digital conversion, and data acquisition errors. In particular, the processing of high-density salt and pepper noise is often required for medical images, for instance, magnetic resonance images [66] and X-ray images [67]. By preliminarily analyzing the processing results for medical brain magnetic resonance images, the ability of the proposed TSETMF algorithm to produce relatively stable and excellent noise reduction effects may be demonstrated. This would also demonstrate the algorithm’s strong robustness in terms of denoising high-density-noise grayscale images.

5. Conclusions

The denoising issues associated with grayscale images have become a significant area of research in the field of digital image processing. For the processing of high-noise grayscale images in particular, the denoising effects can become worse with increasing noise density. In this paper, an improved median filter algorithm, TSETMF, is proposed that utilizes two-dimensional maximum Shannon entropy to achieve the adaptive selection of thresholds to enhance the ability to process high-density noise and achieve denoising stability. The noise in images can be filtered by automatically partitioning a window size, the threshold value of which is adaptively calculated using two-dimensional maximum Shannon entropy. Three comparative experiments were conducted to verify the rationality of the TSETMF model and show its relative superiority in denoising. The experimental results demonstrated that the proposed TSETMF algorithm exhibited better processing performance with superior high-density noise suppression and denoising stability. The proposed TSETMF exhibited a stronger ability to process high-density noise, which was demonstrated by a higher PSNR value of 24.97 dB at a 95% noise density for the classical Lena grayscale image. The proposed TSETMF also exhibited better denoising stability when the noise density increased from 5% to 95%, which was demonstrated by the minor decline in the PSNR value of approximately 10.78% relative to the PSNR of 23.10 dB for the classical Cameraman grayscale image. The TSETMF algorithm is independent of the effects of noise density and achieved more accurate and effective results when processing the high-density salt and pepper noise in the COVID image. Therefore, it is clear that the proposed TSETMF can also maintain good filtering effects with excellent denoising robustness for processing high-density noise in grayscale images. This method could provide a unique approach to addressing denoising issues. Additionally, the processing of more grayscale image types should be carried out to explore the applicability of the proposed TSETMF algorithm and further improve its denoising performance and stability.

Supplementary Materials

The following supporting information can be downloaded at: https://www.mdpi.com/article/10.3390/app14020635/s1, Table S1: PSNR comparison data from different algorithms processing Lena with increasing noise density. Table S2: SSIM comparison data from different algorithms processing Lena with increasing noise density. Table S3: PSNR comparison data from different algorithms processing Cameraman with increasing noise density. Table S4: SSIM comparison data from different algorithms processing Cameraman with increasing noise density. Table S5: PSNR comparison data from different algorithms processing COVID with increasing noise density. Table S6: SSIM comparison data from different algorithms processing COVID with increasing noise density.

Author Contributions

Conceptualization, N.C.; investigation, N.C.; methodology, N.C. and Y.L.; data curation, N.C. and Y.L.; writing—original draft, N.C. and Y.L.; writing—review and editing, N.C. All authors have read and agreed to the published version of the manuscript.

Funding

This work was supported by the Key Science and Technology Research Project of Henan Province, China (Grant No. 222102220032, 212102210359), and the Doctoral Research Fund of Zhengzhou University of Light Industry (Grant No. 2019BSJJ003).

Institutional Review Board Statement

Not applicable.

Informed Consent Statement

Not applicable.

Data Availability Statement

The data presented in this study are available in the article.

Conflicts of Interest

The authors declare no conflicts of interest.

References

  1. Chen, J.; Zhan, Y.; Cao, H. Adaptive sequentially weighted median filter for image highly corrupted by impulse noise. IEEE Access 2019, 7, 158545–158556. [Google Scholar] [CrossRef]
  2. Kumar, S.; Singh, S.; Kumar, J. Live detection of face using machine learning with multi-feature method. Wirel. Pers. Commun. 2018, 103, 2353–2375. [Google Scholar] [CrossRef]
  3. Liu, W.; Yang, S.; Ye, Z.; Huang, Q.; Huang, Y. An image segmentation method based on two-dimensional entropy and chaotic lightning attachment procedure optimization algorithm. Int. J. Pattern Recognit. Artif. Intell. 2020, 34, 2054030. [Google Scholar] [CrossRef]
  4. Mahdaoui, A.E.; Ouahabi, A.; Moulay, M.S. Image denoising using a compressive sensing approach based on regularization constraints. Sensors 2022, 22, 2199. [Google Scholar] [CrossRef] [PubMed]
  5. Frosio, I.; Borghese, N.A. Statistical based impulsive noise removal in digital radiography. IEEE Trans. Med. Imaging 2008, 28, 3–16. [Google Scholar] [CrossRef]
  6. Goceri, E. Evaluation of denoising techniques to remove speckle and Gaussian noise from dermoscopy images. Comput. Biol. Med. 2022, 152, 106474. [Google Scholar] [CrossRef]
  7. Garnett, R.; Huegerich, T.; Chui, C.; He, W. A universal noise removal algorithm with an impulse detector. IEEE Trans. Image Process. 2005, 14, 1747–1754. [Google Scholar] [CrossRef]
  8. Sulaiman, S.N.; Mat Isa, N.A.; Yusoff, I.A.; Ahmad, F. Switching-based clustering algorithms for segmentation of low-level salt-and-pepper noise–corrupted images. Signal Image Video Process. 2015, 9, 387–398. [Google Scholar] [CrossRef]
  9. Thanh, D.N.H.; Hai, N.H.; Prasath, V.B.S.; Hieu, L.M.; Tavares, J.M.R.S. A two-stage filter for high density salt and pepper denoising. Multimed. Tools Appl. 2020, 79, 21013–21035. [Google Scholar] [CrossRef]
  10. Li, T.; Wang, W.; Xu, L.; Feng, X. Image denoising using low-rank dictionary and sparse representation. In Proceedings of the 2014 Tenth International Conference on Computational Intelligence and Security, Kunming, China, 15–16 November 2014; pp. 228–232. [Google Scholar]
  11. Lin, T.C. A new adaptive center weighted median filter for suppressing impulsive noise in images. Inf. Sci. 2007, 177, 1073–1087. [Google Scholar] [CrossRef]
  12. Vijayarajan, R.; Muttan, S. Iterative relaxed median filter for impulse noise removal and validation of fcm clustering using cluster error index in median filtered MR images. In Proceedings of the 4th ObCom International Conference on Recent Trends in Computing, Communication and Information Technology, Vellore, India, 9–11 December 2011; pp. 792–801. [Google Scholar]
  13. Thilagavathi, M.; Deepa, P. An efficient dictionary learning algorithm for 3D Medical Image Denoising based on SADCT. In Proceedings of the 2013 International Conference on Information Communication and Embedded Systems (ICICES), Chennai, India, 21–22 February 2013; pp. 442–447. [Google Scholar]
  14. Shah, Z.H.; Müller, M.; Wang, T.C.; Scheidig, P.M.; Schneider, A.; Schüttpelz, M.; Huser, T.; Schenck, W. Deep-learning based denoising and reconstruction of super-resolution structured illumination microscopy images. Photonics Res. 2021, 9, B168–B181. [Google Scholar] [CrossRef]
  15. Obidin, M.V.; Serebrovski, A.P. Signal denoising with the use of the wavelet transform and the Kalman filter. J. Commun. Technol. Electron. 2014, 59, 1440–1445. [Google Scholar] [CrossRef]
  16. Yu, H.; Zhao, L.; Wang, H. Image denoising using trivariate shrinkage filter in the wavelet domain and joint bilateral filter in the spatial domain. IEEE Trans. Image Process. 2009, 18, 2364–2369. [Google Scholar] [PubMed]
  17. Uzan, A.; Rivenson, Y.; Stern, A. Speckle denoising in digital holography by nonlocal means filtering. Appl. Opt. 2013, 52, A195–A200. [Google Scholar] [CrossRef]
  18. Teng, L.; Li, H.; Yin, S. Modified pyramid dual tree direction filter-based image denoising via curvature scale and nonlocal mean multigrade remnant filter. Int. J. Commun. Syst. 2018, 31, e3486. [Google Scholar] [CrossRef]
  19. Erkan, U.; Gökrem, L.; Enginoğlu, S. Different applied median filter in salt and pepper noise. Comput. Electr. Eng. 2018, 70, 789–798. [Google Scholar] [CrossRef]
  20. Sree, P.S.J.; Kumar, P.; Siddavatam, R.; Verma, R. Salt-and-pepper noise removal by adaptive median-based lifting filter using second-generation wavelets. Signal Image Video Process. 2013, 7, 111–118. [Google Scholar] [CrossRef]
  21. Toh, K.K.V.; Isa, N.A.M. Noise adaptive fuzzy switching median filter for salt-and-pepper noise reduction. IEEE Signal Process. Lett. 2009, 17, 281–284. [Google Scholar] [CrossRef]
  22. Shukla, A.K.; Bhateja, V.; Verma, R.L.; Alam, M.S. An Improved Directional Weighted Median Filter for Restoration of Images Corrupted with High Density Impulse Noise. In Proceedings of the 2014 International Conference on Reliability Optimization and Information Technology (ICROIT), Faridabad, India, 6–8 February 2014; pp. 506–511. [Google Scholar]
  23. Peng, B.; Zhou, Y.; Li, Q.; Lin, M.; Weng, J.; Zeng, Q. FPGA Implementation of Low-Latency Recursive Median Filter. In Proceedings of the 2022 International Conference on Field-Programmable Technology (ICFPT), Hong Kong, China, 5–9 December 2022; pp. 1–7. [Google Scholar]
  24. Gupta, V.; Chaurasia, V.; Shandilya, M. Random-valued impulse noise removal using adaptive dual threshold median filter. J. Vis. Commun. Image Represent. 2015, 26, 296–304. [Google Scholar] [CrossRef]
  25. Kumar, S.; Raja, R.; Mahmood, M.R.; Choudhary, S. A Hybrid Method for the Removal of RVIN Using Self Organizing Migration with Adaptive Dual Threshold Median Filter. Sens. Imaging 2023, 24, 9. [Google Scholar] [CrossRef]
  26. Goyal, P.; Chaurasia, V.; Meena, O.P. Impulse Noise Removal with Zero’s Padding by Median Based Adaptive Filter. In Proceedings of the 2017 International Conference on Recent Innovations in Signal Processing and Embedded Systems (RISE), Bhopal, India, 27–29 October 2017; pp. 78–81. [Google Scholar]
  27. Hanel, R.; Thurner, S.; Gell-Mann, M. How multiplicity determines entropy and the derivation of the maximum entropy principle for complex systems. Proc. Natl. Acad. Sci. USA 2014, 111, 6905–6910. [Google Scholar] [CrossRef] [PubMed]
  28. Abramov, R. A practical computational framework for the multidimensional moment-constrained maximum entropy principle. J. Comput. Phys. 2006, 211, 198–209. [Google Scholar] [CrossRef]
  29. Panda, R.; Swain, M.; Naik, M.K.; Agrawal, S.; Abraham, A. A Novel Practical Decisive Row-Class Entropy-Based Technique for Multilevel Threshold Selection Using Opposition Flow Directional Algorithm. IEEE Access 2022, 10, 110473–110484. [Google Scholar] [CrossRef]
  30. Zou, Y.; Zhang, J.; Upadhyay, M.; Sun, S.; Jiang, T. Automatic image thresholding based on Shannon entropy difference and dynamic synergic entropy. IEEE Access 2020, 8, 171218–171239. [Google Scholar] [CrossRef]
  31. Chiranjeevi, K.; Jena, U.R.; Harika, A. Image Compression Using Shannon Entropy-Based Image Thresholding. In Proceedings of the 3rd International Conference on Computational Intelligence in Data Mining (ICCIDM), Bhubaneswar, India, 10–11 December 2016; pp. 101–110. [Google Scholar]
  32. Maleki, Y.K.; Safizadeh, M.S.; Khajavi, M.N.; Payganeh, G.; Shuruni, S. Over Hang Slant Cracked Rotor Vibration Signal Processing Based on Discrete Wavelet Transform. In Proceedings of the 2016 13th International Multi-Conference on Systems, Signals & Devices (SSD), Leipzig, Germany, 21–24 March 2016; pp. 672–676. [Google Scholar]
  33. Lin, T.C.; Yu, P.T. Thresholding noise-free ordered mean filter based on Dempster-Shafer theory for image restoration. IEEE Trans. Circuits Syst. I Regul. Pap. 2006, 53, 1057–1064. [Google Scholar]
  34. Duque, D.; Garzón, J.; Gharbi, T. A study of dispersion in chromatic confocal microscopy using digital image processing. Opt. Laser Technol. 2020, 131, 106414. [Google Scholar] [CrossRef]
  35. Kim, D.; Kim, C. Contrast enhancement using combined 1-D and 2-D histogram-based techniques. IEEE Signal Process. Lett. 2017, 24, 804–808. [Google Scholar] [CrossRef]
  36. Manda, M.P.; Kim, H.S. A fast image thresholding algorithm for infrared images based on histogram approximation and circuit theory. Algorithms 2020, 13, 207. [Google Scholar] [CrossRef]
  37. Zhang, H.; Liu, H.; Shang, Z.; Li, R. Robust Image Denoising with an Improved Wavelet Threshold Method. In Proceedings of the 2015 6th IEEE International Conference on Software Engineering and Service Science (ICSESS), Beijing, China, 23–25 September 2015; pp. 301–304. [Google Scholar]
  38. George, G.; Oommen, R.M.; Shelly, S.; Philipose, S.S.; Varghese, A.M. A Survey on Various Median Filtering Techniques for Removal of Impulse Noise from Digital Image. In Proceedings of the 2018 Conference on Emerging Devices and Smart Systems (ICEDSS), Tiruchengode, India, 2–3 March 2018; pp. 235–238. [Google Scholar]
  39. Zhang, D.L.; Huang, D.N.; Yu, P.; Yuan, Y. Translation-invariant wavelet denoising of full-tensor gravity–gradiometer data. Appl. Geophys. 2017, 14, 606–619. [Google Scholar] [CrossRef]
  40. Kubota, R.; Suetake, N. Distribution distance-based threshold auto-tuning method for switching median filter. IEICE Electron. Expr. 2010, 7, 1310–1316. [Google Scholar] [CrossRef]
  41. Tan, X.; Jiang, J.; Zha, D. Threshold Switch Filter Design and Its Implementation in Image Denoising. In Proceedings of the 5th International Conference on Machine Vision (ICMV)—Computer Vision, Image Analysis and Processing, Wuhan, China, 20–21 October 2012; pp. 326–332. [Google Scholar]
  42. Zhang, J.; Liao, Y.; Yan, L. An Improved Image Thresholding Method Based on Two-Dimensional Histogram. In Proceedings of the 2018 13th World Congress on Intelligent Control and Automation (WCICA), Changsha, China, 4–8 July 2018; pp. 1623–1628. [Google Scholar]
  43. Sahoo, P.K.; Arora, G. A thresholding method based on two-dimensional Renyi’s entropy. Pattern Recognit. 2004, 37, 1149–1161. [Google Scholar] [CrossRef]
  44. Yu, C.; Dian-Ren, C.; Yang, L.; Lei, C. Otsu’s Thresholding Method Based on Gray Level-Gradient Two-Dimensional Histogram. In Proceedings of the 2010 2nd International Asia Conference on Informatics in Control, Automation and Robotics (CAR 2010), Wuhan, China, 6–7 March 2010; pp. 282–285. [Google Scholar]
  45. Celik, T. Two-dimensional histogram equalization and contrast enhancement. Pattern Recognit. 2012, 45, 3810–3824. [Google Scholar] [CrossRef]
  46. Kharazmi, O.; Contreras-Reyes, J.E.; Balakrishnan, N. Jensen–Fisher information and Jensen–Shannon entropy measures based on complementary discrete distributions with an application to Conway’s game of life. Physica D 2023, 453, 133822. [Google Scholar] [CrossRef]
  47. Kumar, R.; Singh, J.; Sharma, S.; Li, C.; Królczyk, G.; Eldin, E.M.T.; Wojciechowski, S. Identification of localized defects and fault size estimation of taper roller bearing (NBC_30205) with signal processing using the Shannon entropy method in MATLAB for automobile industries applications. Heliyon 2022, 8, e12053. [Google Scholar] [CrossRef] [PubMed]
  48. Yang, W.; Cai, L.; Wu, F. Image segmentation based on gray level and local relative entropy two-dimensional histogram. PLoS ONE 2020, 15, e0229651. [Google Scholar] [CrossRef]
  49. Saraiva, P. On Shannon entropy and its applications. Kuwait J. Sci. 2023, 50, 194–199. [Google Scholar] [CrossRef]
  50. Tsai, H.H.; Chang, B.M.; Lin, X.P. Using decision tree, particle swarm optimization, and support vector regression to design a median-type filter with a 2-level impulse detector for image enhancement. Inf. Sci. 2012, 195, 103–123. [Google Scholar] [CrossRef]
  51. Chen, B.; Cui, J.; Xu, Q.; Shu, T.; Liu, H. Coupling denoising algorithm based on discrete wavelet transform and modified median filter for medical image. J. Central South Univ. 2019, 26, 120–131. [Google Scholar] [CrossRef]
  52. Sinha, P.K.; Hong, Q.H. An improved median filter. IEEE Trans. Med. Imaging 1990, 9, 345–346. [Google Scholar] [CrossRef]
  53. Erkan, U.; Enginoğlu, S.; Thanh, D.N.H.; Hieu, L.M. Adaptive frequency median filter for the salt and pepper denoising problem. IET Image Process. 2020, 14, 1291–1302. [Google Scholar] [CrossRef]
  54. Ganesh, M.S.R.; Kadali, K.S.; Bhukya, R.; Palleswari, Y.T.R.; Siva, A.; Pragaspathy, S. Design of Decision Based Recursive Weighted Median Filter with Exponential Weights. In Proceedings of the 1st International Conference on Applied Mathematics, Modeling and Simulation in Engineering (AMSE), Virtual, 15–16 September 2021; p. 12016. [Google Scholar]
  55. Guo, S.; Wang, G.; Han, L.; Song, X.; Yang, W. COVID-19 CT image denoising algorithm based on adaptive threshold and optimized weighted median filter. Biomed. Signal Process. Control 2022, 75, 103552. [Google Scholar] [CrossRef] [PubMed]
  56. Xie, Y.; Zhu, Z.; Zhang, X.; Wang, Q. An Adaptive Median Filter Using Local Texture Information in Images. In Proceedings of the 2014 IEEE/ACIS 13th International Conference on Computer and Information Science (ICIS), Taiyuan, China, 4–6 June 2014; pp. 177–180. [Google Scholar]
  57. Nalli, P.K.; Kadali, K.S.; Bhukya, R.; Palleswari, Y.T.R.; Siva, A.; Pragaspathy, S. Design of Exponentially Weighted Median Filter Cascaded with Adaptive Median Filter. In Proceedings of the 1st International Conference on Applied Mathematics, Modeling and Simulation in Engineering (AMSE), Virtual, 15–16 September 2021; p. 12020. [Google Scholar]
  58. Jana, B.R.; Thotakura, H.; Baliyan, A.; Sankararao, M.; Deshmukh, R.G.; Karanam, S.R. Pixel density based trimmed median filter for removal of noise from surface image. Appl. Nanosci. 2023, 13, 1017–1028. [Google Scholar] [CrossRef]
  59. Kunsoth, R.; Biswas, M. Modified Decision Based Median Filter for Impulse Noise Removal. In Proceedings of the 2016 International Conference on Wireless Communications, Signal Processing and Networking (WiSPNET), Chennai, India, 23–25 March 2016; pp. 1316–1319. [Google Scholar]
  60. Meng, Y.; Zhang, J. A Novel Gray Image Denoising Method Using Convolutional Neural Network. IEEE Access 2022, 10, 49657–49676. [Google Scholar] [CrossRef]
  61. Kodak Lossless True Color Image Suite. Available online: http://r0k.us/graphics/kodak/ (accessed on 1 July 2023).
  62. TEST IMAGES. Available online: https://ccia.ugr.es/cvg/dbimagenes/ (accessed on 1 July 2023).
  63. National Microbiology Data Center. Available online: http://nmdc.cn/nCov/en/ (accessed on 1 July 2023).
  64. Qi, H.; Tan, S.; Li, Z. Anisotropic Weighted Total Variation Feature Fusion Network for Remote Sensing Image Denoising. Remote Sens. 2022, 14, 6300. [Google Scholar] [CrossRef]
  65. Wang, L.; Shi, Y.; Li, H. Anti-EMI noise digital filter design for a 60-kW five-level SiC inverter without fiber isolation. IEEE Trans. Power Electron. 2017, 33, 13–17. [Google Scholar] [CrossRef]
  66. Alanazi, T.M.; Berriri, K.; Albekairi, M.; Ben Atitallah, A.; Sahbani, A.; Kaaniche, K. New Real-Time High-Density Impulsive Noise Removal Method Applied to Medical Images. Diagnostics 2023, 13, 1709. [Google Scholar] [CrossRef]
  67. Garg, B. An adaptive minimum-maximum value-based weighted median filter for removing high density salt and pepper noise in medical images. Int. J. Ad Hoc Ubiquitous Comput. 2020, 35, 84–95. [Google Scholar] [CrossRef]
Figure 1. Denoising principle comparisons for the improved self-adaptive median filter. (a) A self-adaptive median filtering image after processing 95% salt and pepper noise. (b) Partially enlarged details. (c) Gray values of self-adaptive median filtering image. (d) Gray values of improved median filtering image using recursion method and self-adaptive window. The white central value, 255, as the original value, represents the pending processing pixel point. The blue section represents the processed pixel points. The red section represents unprocessed pixel points.
Applsci 14 00635 g001
Figure 2. Flow chart of the proposed TSETMF algorithm process.
Applsci 14 00635 g002
Figure 3. Contrastive denoising effects of the different algorithms for the Lena image. (a) Original image. (b) Salt and pepper noise with 95% density. (c) PDBTMF. (d) MDBMF. (e) ADTMF. (f) Proposed TSETMF algorithm.
Applsci 14 00635 g003
Figure 4. Contrastive denoising effects of different algorithms for the Cameraman image. (a) Original image. (b) Salt and pepper noise with 95% density. (c) PDBTMF. (d) MDBMF. (e) ADTMF. (f) Proposed TSETMF algorithm.
Applsci 14 00635 g004aApplsci 14 00635 g004b
Figure 5. Contrastive denoising effects of different algorithms for the COVID image. (a) Original image. (b) Salt and pepper noise with 95% density. (c) PDBTMF. (d) MDBMF. (e) ADTMF. (f) Proposed TSETMF algorithm.
Applsci 14 00635 g005
Figure 6. Change map of PSNR with continuously increasing noise density for different algorithms processing Lena.
Applsci 14 00635 g006
Figure 7. Change map of SSIM with continuously increasing noise density for different algorithms processing Lena.
Applsci 14 00635 g007
Figure 8. Experimental verification of image detail reservation ability using the proposed TSETMF algorithm. (a) Original Lena image. (b) Partial Lena image with the addition of 95% salt and pepper noise. (c) Pixel point inside (b), processed using the proposed TSETMF. (d) Replacement result of central pixel value inside (c). (e) Replacement results of pixel values in the red area after gradual processing. (f) The filtering effect of partial Lena image using the proposed TSETMF.
Applsci 14 00635 g008
Figure 9. Denoising effects of the TSETMF algorithm on the Lena image with the addition of different salt and pepper noise densities: (a) 30%, (b) 50%, (c) 70%, and (d) 90%.
Applsci 14 00635 g009
Figure 10. Change map of PSNR with continuously increasing noise density for different algorithms processing Cameraman.
Applsci 14 00635 g010
Figure 11. Change map of SSIM with continuously increasing noise density for different algorithms processing Cameraman.
Applsci 14 00635 g011
Figure 12. Change map of PSNR with continuously increasing noise density for different algorithms processing COVID.
Applsci 14 00635 g012
Figure 13. Change map of SSIM with continuously increasing noise density for different algorithms processing COVID.
Applsci 14 00635 g013
Disclaimer/Publisher’s Note: The statements, opinions and data contained in all publications are solely those of the individual author(s) and contributor(s) and not of MDPI and/or the editor(s). MDPI and/or the editor(s) disclaim responsibility for any injury to people or property resulting from any ideas, methods, instructions or products referred to in the content.