Article

Enhancing Imbalanced Sentiment Analysis: A GPT-3-Based Sentence-by-Sentence Generation Approach

Department of Computer Science and Engineering, Ewha Womans University, Seoul 03760, Republic of Korea
*
Author to whom correspondence should be addressed.
Appl. Sci. 2024, 14(2), 622; https://doi.org/10.3390/app14020622
Submission received: 13 December 2023 / Revised: 8 January 2024 / Accepted: 9 January 2024 / Published: 11 January 2024
(This article belongs to the Section Computing and Artificial Intelligence)

Abstract

:
This study addresses the challenge of class imbalance in sentiment analysis by utilizing synthetic data to balance training datasets. We introduce an innovative approach using the GPT-3 model’s sentence-by-sentence generation technique to generate synthetic data, specifically targeting underrepresented negative and neutral sentiments. Our method aims to align these minority classes with the predominantly positive sentiment class in a Coursera course review dataset, with the goal of enhancing the performance of sentiment classification. This research demonstrates that our proposed method successfully enhances sentiment classification performance, as evidenced by improved accuracy and F1-score metrics across five deep-learning models. However, when compared to our previous research utilizing fine-tuning techniques, the current method shows a relative shortfall. The fine-tuning approach yields better results in all models tested, indicating the importance of data novelty and diversity in synthetic data generation. In terms of the deep-learning model used for classification, the notable finding is the significant performance improvement of the Recurrent Neural Network (RNN) model compared to other models like CNN, LSTM, BiLSTM, and GRU, highlighting the impact of the model choice and architecture depth. This study emphasizes the critical role of synthetic data quality and strategic deep-learning model implementation in sentiment analysis. The results suggest that the careful consideration of training data and model attributes is vital for optimal sentiment classification.

1. Introduction

In the era of big data and digitization, there has been rapid growth in unstructured data, including a massive influx of text content on social media, in online news, and in reviews of online stores. This has become a major motivation for the need for advanced methods to extract such information quickly and accurately, particularly to reflect public sentiment on various topics. Sentiment analysis, or opinion mining, is a very suitable technique for this purpose, aiding in better decision making by extracting the sentiments or opinions contained in text data.
According to recent studies, sentiment analysis has been widely applied in various fields, including e-commerce feedback, social media posts like tweets and Facebook updates, YouTube content, blogs, and other domains in data mining and knowledge-based AI systems. The most extensive application of sentiment analysis is in reviewing different products across various brands, offering diverse perspectives for its application [1]. Recent studies in this field include sentiment analysis for Amazon product review data [2] and for online product reviews, particularly using an Android dataset and a movie and TV dataset [3]. These studies illustrate that sentiment analysis is a highly useful technique for extracting unstructured data in the form of product or service reviews.
Sentiment analysis is one of the applications of text classification. A crucial issue that consistently attracts attention in text classification is data imbalance. This is a situation where some classes have more samples, while others have relatively few or very few samples [4]. For instance, in sentiment analysis, it is common to find that the positive sentiment class has more samples, while the negative or neutral sentiments are significantly underrepresented. Situations where some classes in the data are underrepresented compared to others lead to the incapability of standard classifiers to properly discriminate the poorly represented classes [5]. This means that the model will be very good at recognizing the majority class but poor at recognizing the minority class. This is one of the indications of the poor classification performance produced by a model.
This study focuses on addressing the class imbalance in sentiment analysis by balancing the dataset with synthetic data. The primary goal is to enhance the classification performance after balancing the training data. The approach we propose for balancing involves generating synthetic data using the Generative Pre-trained Transformer 3 (GPT-3) model with a sentence-by-sentence generation technique. Generally, there are two methods to generate synthetic text data using the GPT-3 model: fine-tuning and prompt-based generation. The sentence-by-sentence text generation we propose in this study is a technique within prompt-based text generation. It involves instructing the GPT-3 model through a prompt that includes input text from the original dataset as an example. On the other hand, the fine-tuning technique is carried out by training the model using a training dataset through a fine-tuning process and then asking the fine-tuned model to generate new text using a prompt.
The choice of the GPT-3 model for our study is grounded in its recognition as a state-of-the-art large language model, trained on extensive data to generate human-like text [6]. GPT-3’s capabilities extend beyond basic text generation; it is known for producing content that rivals human quality in many instances [7]. Furthermore, GPT-3’s deep-learning framework enables it to understand and produce nuanced, contextually relevant text [8], making it an ideal tool for our goal of generating synthetic data that are both diverse and representative of real-world sentiment. This aligns with the broader trend in NLP research, where GPT-3 has been proven to excel in a range of applications, reaffirming its suitability for our sentiment analysis task.
This reason is further reinforced by recent research. For instance, Skondras et al. [9] successfully utilized ChatGPT for multiclass classification tasks, demonstrating GPT-3’s versatility in complex NLP applications. Additionally, other novel approaches using network science and cognitive psychology to analyze biases in LLMs, like GPT-3, GPT-3.5, and GPT-4 in the math and STEM fields [10], highlight the critical importance of understanding and addressing the inherent biases in these models. These studies exemplify the growing body of work that showcases GPT-3’s capabilities and potential pitfalls, providing a comprehensive backdrop for our research’s focus on sentiment analysis using GPT-3’s advanced text generation.
The studies mentioned show both the good and challenging parts of using GPT-3. They demonstrate how well GPT-3 can generate text and categorize it but also point out areas where it could have problems, like biases. This information is helpful for our study on analyzing feelings in text with GPT-3. It tells us that while GPT-3 is a powerful tool, we should also be aware of and address its limitations for the best results in our research.
This study is a continuation of our previous work [11], which addressed imbalanced sentiment analysis by fine-tuning the GPT-3 model to generate synthetic data. In addition to determining whether balancing with synthetic data through sentence-by-sentence generation can improve the classification performance, a comparison of the classification performance with that of fine-tuning-based text generation was also conducted. From the aspect of classification models, the previous study utilized nine traditional machine-learning and deep-learning models [11]. In this study, we focus exclusively on five deep-learning models.
The contributions of this study are as follows:
  • This study provides an explanation of the text generation procedure using prompt-based generation, specifically utilizing sentence-by-sentence generation techniques.
  • It proposes methods for detecting duplication, both among generated sentences and between generated sentences and the original input data included in the prompt.
  • It compares five deep-learning models for sentiment classification using various kinds of datasets obtained from the results of sentence generation.
The structure of this article is organized as follows: Section 2 summarizes recent research contributions on text data augmentation for handling imbalanced sentiment analysis. Section 3 outlines the proposed approach. Section 4 provides details on the experimental setup, including the dataset and methodology. Section 5 explores the experimental results. Section 6 includes a discussion of the findings. Finally, Section 7 concludes the paper.

2. Related Work

The literature on addressing the class imbalance in sentiment analysis is vast and diverse, encompassing a range of methodologies and approaches. Obiedat et al. [12] introduced a method combining the SVM algorithm with PSO and oversampling techniques to tackle unbalanced sentiment analysis in customer review datasets. Similarly, Han Wen and Junfang Zhao [13] proposed using a BiLSTM structure with Adaptive Synthetic Sampling for unbalanced comment data, specifically when negative instances outnumbered positive ones.
In an innovative approach, Tan et al. [14] created a hybrid system combining RoBERTa and GRU, engineered to address unbalanced datasets via data augmentation and oversampling. Wu and Huang [15] proposed the HEGS method, a hybrid approach using a generative adversarial network and the Shapley algorithm, to create a diverse range of training phrases for minority-class classification.
Expanding into Twitter data, George [16] explored synthetic oversampling techniques by introducing SMOTE combined with the Ensemble Bagging Support Vector Machine (EBSVM) model. Cai and Zhang [17] focused on sentiment information extraction from imbalanced short-text reviews, for which they proposed a multi-channel BLTCN-BLSTM self-attention sentiment classification strategy.
Akkaradamrongrat et al. [18] explored text generation methods, specifically Markov Chains and LSTM, for balancing text datasets. Their research indicates that these techniques are effective in generating synthetic minority-class samples, thereby enhancing recall and the overall performance in text classification. Habbat [19] delved into the effectiveness of BERT embeddings and ensemble learning methods in handling imbalanced datasets. Their methodology, which includes undersampling and oversampling techniques, showed improved classification performance across various languages and deep-learning algorithms.
The technique of generating artificial text using the GPT model has also been explored in previous studies. Habbat et al. [20] utilized a pre-trained AraGPT-2-based model to produce augmented data to address issues in imbalanced datasets. They presented a deep-learning ensemble model for sentiment analysis comprising three base classifiers: Gated Recurrent Unit (GRU), Long Short-Term Memory (LSTM), and Bidirectional LSTM (BiLSTM). Then, Shaikh et al. [21] utilized GPT-2 and LSTM models for text generation. They highlighted the importance of balancing datasets in enhancing classification performance. This approach resulted in a significant performance improvement in imbalanced datasets.
Building on these developments, another pivotal approach in the field of artificial text generation for sentiment analysis is the use of Generative Adversarial Networks (GANs). Imran et al. [22] leveraged a GAN-based model to generate synthetic data, specifically addressing the challenge of imbalanced sentiment analysis with the Coursera review dataset. This exploration of GANs marks a transition to our previous research [11], where we shifted our focus to employing fine-tuning techniques with the GPT-3 model. Our earlier work, which played a major role in guiding the current study, aimed to tackle similar challenges in sentiment analysis, demonstrating the evolving landscape of synthetic data generation methodologies.

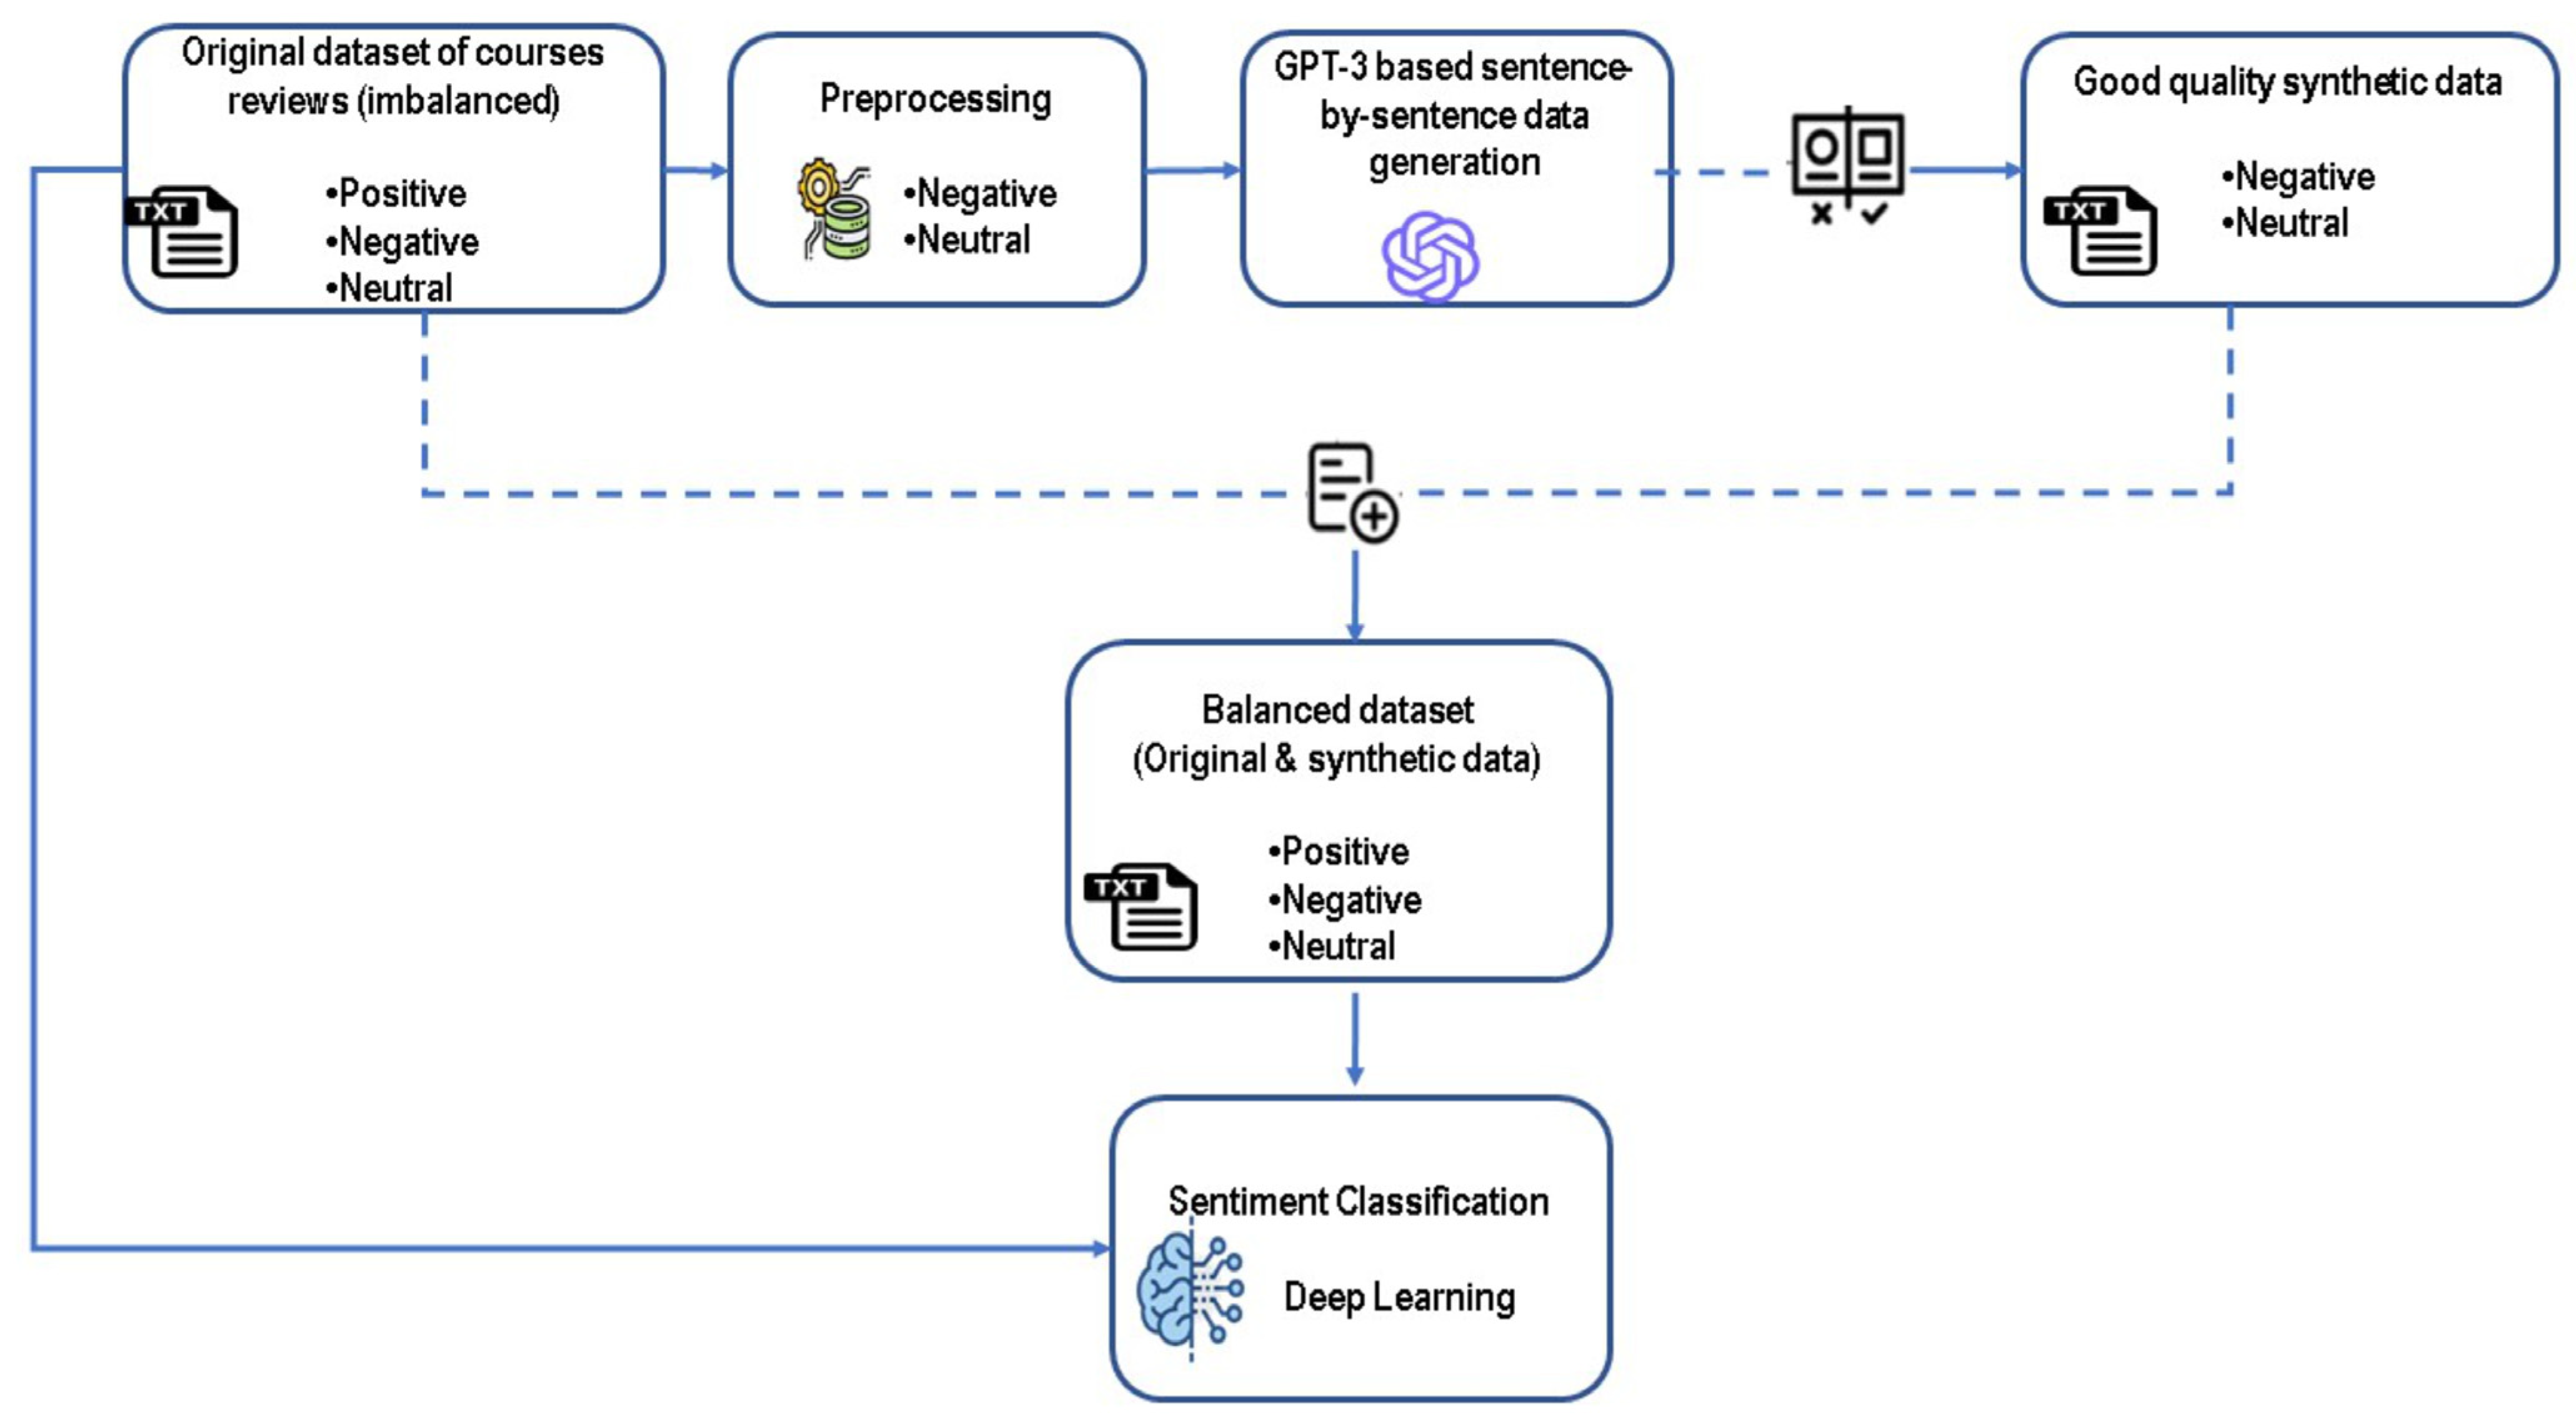
3. Proposed Approach

Our research paper proposes an innovative approach to addressing the class imbalance in sentiment analysis by generating synthetic data using the GPT-3 model, implemented through a sentence-by-sentence generation technique. This method aims to balance the underrepresented classes, specifically the negative and neutral sentiments, to match the level of the majority class, which is the positive sentiment. This balancing process is exclusively applied to the training data for sentiment classification.
As illustrated in Figure 1, our approach begins with the original dataset, specifically a Coursera review dataset, which comprises positive, negative, and neutral sentiments. This dataset is highly unbalanced. Our focus is primarily on the negative and neutral data, which are prepared as inputs for synthetic data generation. To this end, we first perform preprocessing on these specific sentiment classes.
Following preprocessing, we initiate the generation process using the GPT-3 model, employing a sentence-by-sentence generation technique. This implies that each original data input included in the prompt results in one or more output generated sentences.
Once the synthetic data are generated, they undergo an evaluation phase to ensure their quality. Only the synthetic data deemed to be of good quality are selected for the next step. These good-quality synthetic data are then utilized to balance the minor classes in the original dataset, namely, the negative and neutral classes. In other words, we integrate these good-quality synthetic data into the original dataset, preparing them as the training data for the subsequent process of sentiment classification.
Our proposed approach, therefore, not only addresses the imbalance in sentiment classes but also ensures that the quality of the synthetic data is suitable for effective training, aiming to improve the overall performance of sentiment classification models.

4. Experimental Details
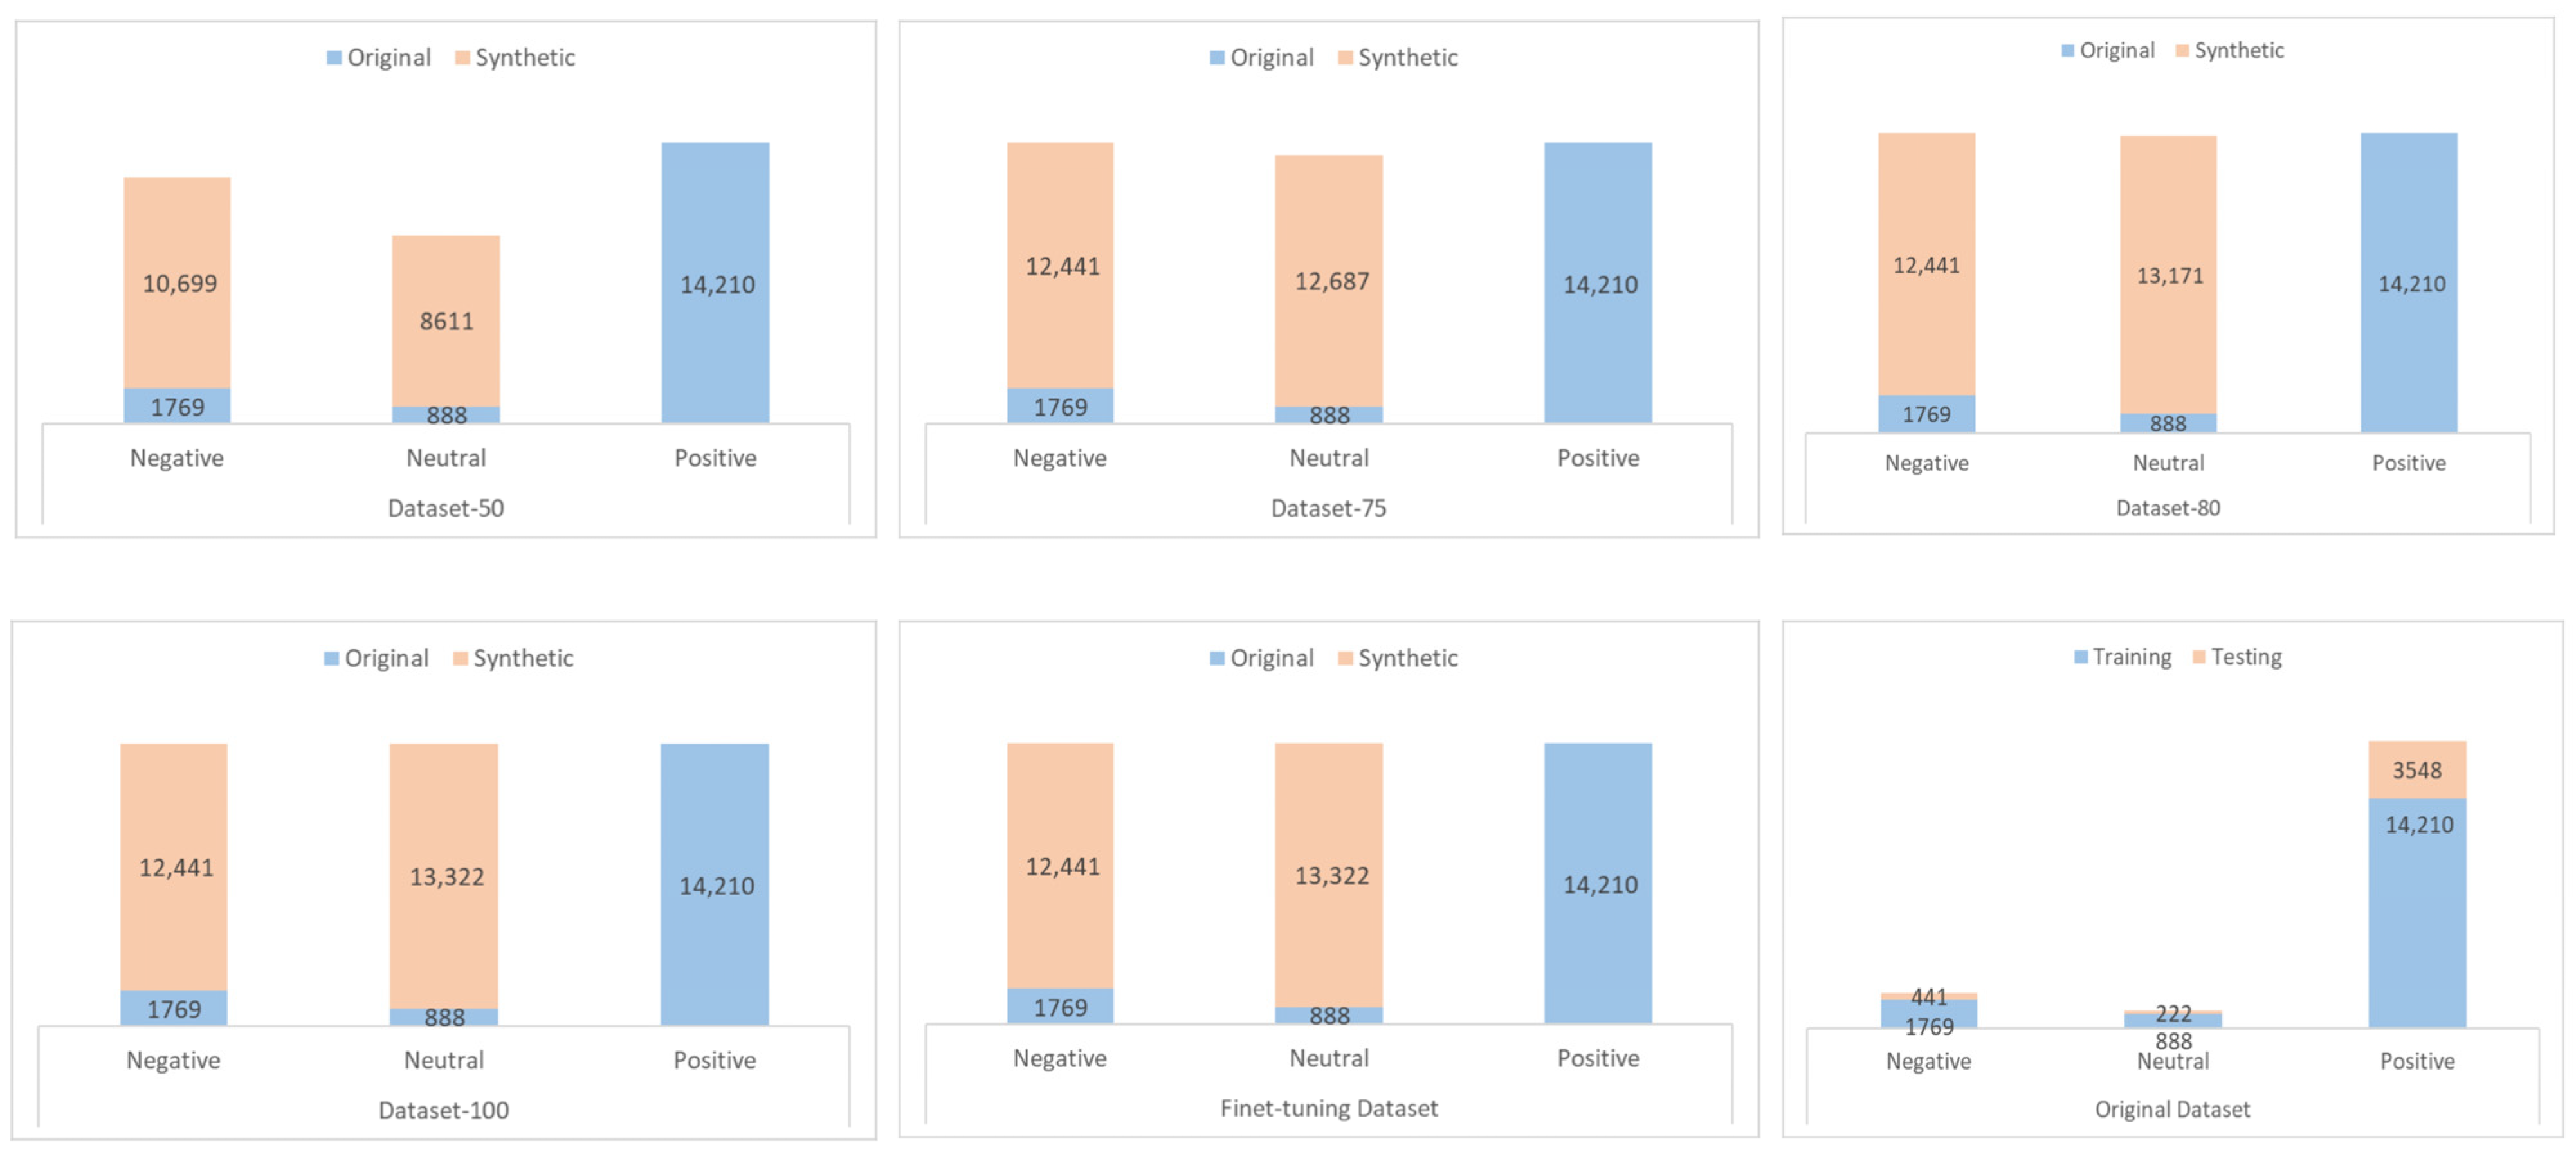
4.1. Dataset

This research utilized a dataset from the study conducted by Kastrati et al. [23], which is a Coursera course review dataset. These reviews, exclusively in English, encompass a broad spectrum of 15 different courses. The dataset comprises a total of 21,937 reviews. Each review in this dataset has been classified into one of three categories based on the sentiment polarity: positive, negative, or neutral. This dataset is identical to the one used in our preceding research [11]. An illustration of the dataset’s distribution is presented in Figure 2.
This dataset is notably unbalanced across its different categories. Out of the total reviews, a substantial portion, amounting to 18,476 (84.2%), are categorized as positive. In contrast, the negative and neutral reviews are significantly less in number, with only 2316 (10.6%) and 1145 (5.2%) reviews, respectively. These imbalanced data present a significant challenge in the process of sentiment classification.

4.2. Sentence-by-Sentence Data Generation

4.2.1. Preprocessing of the Input Data

At this point, the purpose of preprocessing is to get the original Coursera review data ready for use as input in the prompt for the synthetic data generation process. To ensure that the created data have strong coherence with the Coursera dataset, this input is supplied as a reference for the GPT-3 model while generating synthetic data. As a result, for the data created by the GPT-3 model to also be of good quality, they must first be cleaned. Among the preprocessing steps are the elimination of non-English sentences, non-ASCII characters, and other noise, such as the removal of sequences with two or more consecutive equal signs (= =) and the removal of rows that do not contain string data. In the process of creating synthetic data, the cleaned data are regarded as good-quality reference data.

4.2.2. The Synthetic Data Generation Process

In this paper, we introduce an approach for generating synthetic data for sentiment analysis through sentence-by-sentence data generation. This method serves as an alternative to the fine-tuning method we employed in our previous study [11]. The essence of this technique is as follows:
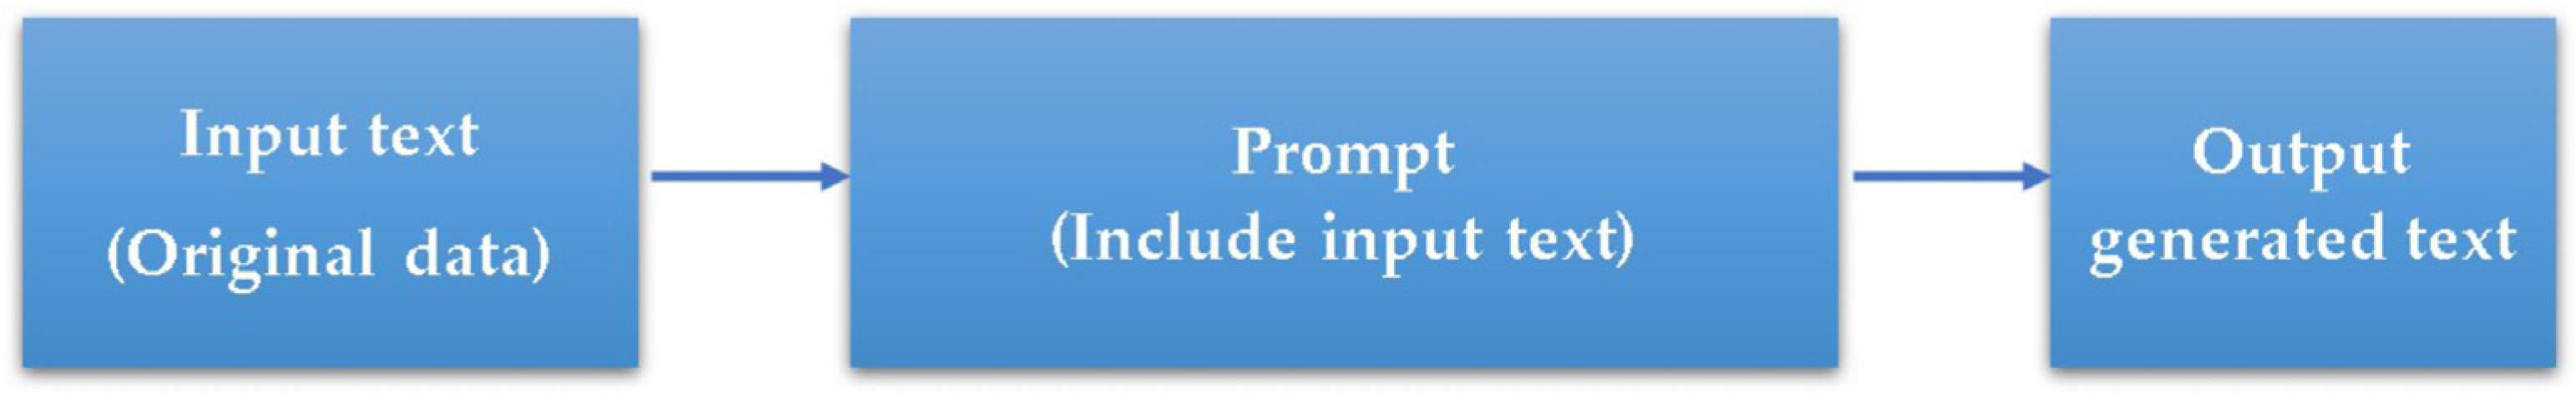
  • Essentially, this method is based on prompt-based text generation, also known as the prompting method.
  • The process includes using the original text input data within the prompt itself.
  • A single prompt can be used to produce one or more outputs, depending on our requirements.
  • This technique utilizes all of the data within the original dataset.
The steps involved in the sentence-by-sentence text generation process are depicted in Figure 3.
Figure 3 illustrates the flow from the initial input text, which is the original data, moving through the prompting phase, where the input text is incorporated into the prompt. From there, the prompt facilitates the generation of the output text, which is the synthetic data we seek to produce.
To obtain the best findings, we carefully chose the model and parameters during the data creation phase of our study. Here are the particulars:
  • Model: “text-davinci-003”. At the time our research was conducted, this model stood out as the best among the GPT-3 variants available.
  • Temperature: 0.9. We set the temperature parameter to 0.9, which we found to strike a balance between coherence and diversity. A temperature setting at this level encourages the model to produce text outputs that are varied and interesting yet still maintain logical consistency with the input text.
  • Maximum Tokens: input tokens + 10. This parameter setting ensures that the length of the generated text is relatively similar to that of the input data. By allowing the model to generate a maximum of 10 additional tokens beyond the input, we ensure that the synthetic data expand on the original text without deviating too much in length, preserving the natural flow of the data.
By using these customized model parameters and specifications, we want to generate synthetic text that closely resembles the features of our original dataset in terms of both structure and content, which will strengthen the sentiment analysis.

4.2.3. The Evaluation of Generated Data

This section describes the approach taken to choose good-quality synthetic data, which is essential to improving the dataset used in sentiment classification. In this research, we propose a definition for good-quality synthetic data, characterizing them as data that exhibit extensive diversity, demonstrate significant novelty, and maintain coherence with the original dataset of course reviews. The evaluation procedure, which consists of several steps, is intended to remove data that do not match our quality standards. To facilitate an explanation of this process, it is necessary to first define a few terms:
  • The “input” refers to the original course review data included in the prompt, which serves as a reference for the GPT-3 model during the synthetic data generation process.
  • The “output” is the synthetic data generated by the GPT-3 model in response to the given prompt.
The following are the main points for evaluating the generated data:
  • Exploration of generated data using novelty and diversity scores
The initial step involves examining the generated data (output) based on novelty and diversity metrics. A low diversity score indicates a high degree of similarity among the outputs, indicating a lack of variation. Similarly, a low novelty score denotes a close similarity between a particular output and the inputs, which indicates that the model is not able to generate new sentences but only copies the input text. Meanwhile, novelty or diversity scores close to 1 are indicative of anomalous data—data that are unusual or irrelevant to the context of course reviews. The formulas for novelty and diversity have been detailed in our previous paper [11], which refers to the work of Liu et al. [24]. Formula (1) represents the computation of the novelty score of each generated review data instance, denoted by R i :
N o v e l t y R i = 1 m a x φ R i , C j j = 1 j = | C |
where C is the review set of the original data, and φ is the Jaccard similarity function. A novelty score tending to 0 indicates that the generated data are not novel, while a score approaching 1 signifies that the generated data are very different from the original data. On the other hand, the diversity score of each generated review data instance, R i , is quantified using Formula (2) below:
D i v e r s i t y R i = 1 m a x φ R i , R j j = 1 j = R , j i
where R is the collection of generated data, and φ is the Jaccard similarity function. A diversity score that tends to zero means that the text is similar to other generated texts, while a score that tends to 1 indicates that the text is different from the other generated texts.
2.
Data duplication analysis
In this study, we define “duplication” as instances where two or more outputs are identical in terms of the words used, their sequence, and punctuation. Our duplication analysis encompasses the following:
  • Overall Duplication: This refers to instances of complete duplication across the dataset, determined through direct calculation.
  • Intra-Duplication: This measures the duplication of outputs associated with each specific input. For example, if input1 has 3 (three) duplicate outputs and input2 has 4 (four), the intra-duplication count is the sum of these, equating to 7.
  • Inter-Duplication: This type of duplication occurs across different inputs, meaning an output for one input exactly matches an output for another input. This calculation is non-mutually exclusive with intra-duplication. For instance, if input1 generates 3 (three) outputs that are duplicated within its set, and input2 has 1 output that duplicates 1 from input1, the inter-duplication count is 3.
3.
Obtaining good-quality synthetic data
Here are the steps to obtain good-quality synthetic data:
Step 1.
Removal of exact duplicates among outputs
This step aims to discard outputs that are exact duplicates of one another. This is accomplished by employing the “duplicated” function in the pandas library, which identifies and removes redundant data while retaining the first occurrence of the duplicate entries. We refer to this process as “removing similar outputs by using a cut-off of 1.” Subsequently, the process involves removing similar outputs using other cut-off thresholds.
Step 2.
Removal of similar outputs
This step is a bit more complex and involves the following:
(1)
Sorting the data based on the output column using lexical sorting, where the data are arranged alphabetically from A to Z. This method groups similar outputs together based on the beginning words or tokens, aiding in the process of identifying duplicates or closely related sequences within the generated text.
(2)
Calculating the similarity score between o u t p u t i and o u t p u t i + 1 .
In our analysis, we define a similarity score measure to assess the degree of similarity between consecutive outputs generated by the GPT-3 model. This formula, while adapted from Jaccard similarity, as presented by Qurashi et al. [25], incorporates a distinctive approach that aligns more closely with our specific requirements for processing text generated by GPT-3. Let us assume that we have n outputs generated by the GPT-3 model. In this context, A represents a set of words in o u t p u t i , and B represents a set of words in o u t p u t i + 1 , where i = 1 ,   2 ,   ,   n . The similarity score between A and B is computed by dividing the count of identical words found in both A and B by the total number of words in A , as expressed in Formula (3):
S i m A , B = | A B | | A |
Here,   | A B | denotes the number of identical words between A and B , and | A | refers to the total count of words in A .
It is crucial to note that, unlike the Jaccard similarity index, which is symmetrical and hence, the similarity score of S i m A , B equals S i m B , A , our adapted formula is asymmetrical: S i m A , B is not equal to S i m B , A . This asymmetry arises because our calculation focuses solely on the proportion of common elements in A relative to its total size, without considering the size of B . This methodological choice is intentional and aligns with our goal of identifying and removing duplications within sorted outputs, where the placement of outputs in the sorted order is significant for identifying duplications.
(3)
Defining the cut-off thresholds. In this step, we set the threshold to 0.8, 0.75, and 0.5.
(4)
Removing o u t p u t i if its similarity score to the subsequent output is greater than or equal to the cut-off threshold.
(5)
Performing steps (2) to (4) until i = n 1 .
Step 3.
Removal of outputs similar to inputs
To ensure the novel of the output, this step includes the following tasks:
(1)
Computing the similarity score between o u t p u t i and i n p u t i using Formula (3).
Let us assume that i n p u t i produces o u t p u t i for i = 1 , 2 , , n .
In this case, A represents a set of words in o u t p u t i , and B represents a set of words in i n p u t i .
(2)
Using the threshold and criteria for removing outputs as described in Step 3 for points (3) and (4).
(3)
Performing steps (1) to (2) until i = n .
To facilitate the understanding of Steps 3 and 4, consider the following example as an illustration.
Consider the following example to illustrate the process. The given input sentence is as follows:
The discussion forums for this course was not quite helpful.”
Through the generation process, two distinct outputs are produced:
  • The discussion forums for this course could have been more helpful.”
  • The discussion forums for this course were unhelpful.”
Subsequently, these input and output sequences are organized in the format of raw data, as depicted in Table 1.
Accordingly, the similarity scores for o u t p u t 1 and o u t p u t 2 are calculated as follows:
Let
A = { t h e ,   d i s c u s s i o n ,   f o r u m s ,   f o r ,   t h i s ,   c o u r s e ,   c o u l d ,   h a v e ,   b e e n ,   m o r e ,   h e l p f u l }
and
B = { t h e ,   d i s c u s s i o n ,   f o r u m s ,   f o r ,   t h i s ,   c o u r s e ,   w e r e ,   u n h e l p f u l }
Then, we have
A B = t h e ,   d i s c u s s i o n ,   f o r u m s ,   f o r ,   t h i s ,   c o u r s e
Therefore,
S i m A , B = | A B | | A | = 6 11 = 0.55
Suppose we use a cut-off value of 0.75. Therefore, since the similarity between o u t p u t 1 and o u t p u t 2 is 0.55, which is less than the cut-off, o u t p u t 1 is retained.
Furthermore, the similarity score between o u t p u t 1 and i n p u t 1 can be calculated as follows:
A = { t h e ,   d i s c u s s i o n ,   f o r u m s ,   f o r ,   t h i s ,   c o u r s e ,   c o u l d ,   h a v e ,   b e e n ,   m o r e ,   h e l p f u l } B = { t h e , d i s c u s s i o n ,   f o r u m s , f o r ,   t h i s ,   c o u r s e ,   w a s , n o t , q u i t e ,   h e l p f u l } A B = t h e ,   d i s c u s s i o n ,   f o r u m s ,   f o r ,   t h i s ,   c o u r s e , h e l p f u l
Therefore,
S i m A , B = | A B | | A | = 7 11 = 0.64
When using a cut-off of 0.75, this similarity value is still below the cut-off, so output 1 is still retained.
However, for o u t p u t 2 , if we calculate A B = 6 and A = 8 , resulting in a similarity score of 0.75, which is equal to the cut-off value, then o u t p u t 2 is removed. This implies that o u t p u t 2 is considered bad-quality synthetic data.
Step 4.
Anomaly Data Removal
Any data that, upon initial examination in Step 1, received a novelty or diversity score equal to or greater than 0.98 are considered anomalous and are subsequently removed from the dataset.
Step 5.
Coherency checking
After undergoing the processes of removing duplications among outputs, eliminating similar outputs, assessing the output’s similarity to the input, and removing anomalous data, we next examine the coherence of the output with the input using a cosine similarity metric based on GloVe embeddings. Having completed this stage, good-quality synthetic data have been successfully obtained. Formula (4) represents the cosine similarity between o u t p u t i and i n p u t i . This formula is also referred to in the paper by Qurashi et al. [25].
C o s A , B = A . B A B
where A represents a set of words in o u t p u t i , and B represents a set of words in i n p u t i . A . B represents the dot product of A and B, and A B represents the product magnitude of A and B.
Step 6.
Reevaluating novelty, diversity, and similarity for good-quality synthetic data
It is crucial to reevaluate the novelty, diversity, and similarity scores after acquiring good-quality synthetic data to make sure that their characteristics satisfy the required criteria.

4.3. Sentiment Classification

Three important stages are involved in this part of our study: preprocessing, sentiment modeling, and evaluation.
  • Stage 1: Preprocessing
Preprocessing at this stage is a preparation for the sentiment classification phase, thereby continuing the preprocessing that was conducted before and after the synthetic data generation process. This process encompasses several key steps. The first step is text normalization, which involves lowercasing all text for consistency and removing any special characters, numbers, and excessive spaces to streamline the content. Next is content reduction, which entails eliminating elements such as hashtags, URLs, and user handles that do not contribute to the core analysis, along with removing overly short words, specifically those just one character in length. The final step is noise removal, focusing on extracting and discarding stop words to reduce redundancy and erasing emojis, which often add unnecessary complexity to the text analysis. Together, these steps effectively refine the data, setting a strong foundation for accurate sentiment analysis.
  • Stage 2: Sentiment Classification
In the sentiment classification stage, we address both the original (imbalanced) data and the balanced dataset augmented with good-quality synthetic data. The methodologies for splitting the data and the sentiment classification process are still the same as the approaches used in our previous studies [11]. This involves dividing the dataset into training and testing subsets at an 80:20 ratio. The training data are further split into training and validation sets, also adhering to an 80:20 ratio. For both the original and balanced data, after modeling using the training and validation datasets, the models are then tested on the same testing dataset, which retains the imbalanced proportion characteristic of the original dataset.
For sentiment modeling, five deep-learning models are utilized, namely, RNN, CNN, LSTM, BiLSTM, and GRU, which incorporate GloVe embeddings. The detailed architectures of the models are presented in Table 2. The fully connected layer configuration across all models is consistent, featuring 256 units with ReLU activation and a dropout of 0.5. This design choice aims to provide a robust learning capability while mitigating the risk of overfitting. The output layer in each model is a dense layer with three units employing a softmax activation function, which is well suited for multiclass classification tasks like sentiment analysis. For hyperparameters, all models share the same settings: the Adam optimizer is used with a learning rate of 0.0005, and each model is trained for 50 epochs with a batch size of 32. This uniformity in hyperparameters ensures a level playing field for comparing the models’ performance.
The primary distinction among the models lies in their main layer structures:
  • RNN uses two layers of SimpleRNN with 256 units each, implementing a dropout rate of 0.5.
  • CNN consists of three Conv1D layers with 128, 128, and 256 filters, each followed by a dropout of 0.5.
  • LSTM features two LSTM layers, each with 256 units, and a dropout rate of 0.5.
  • BiLSTM employs two layers of Bidirectional LSTM, with 256 units per layer and a dropout rate of 0.5.
  • GRU incorporates two GRU layers with 256 units each, accompanied by a dropout of 0.5.
  • Stage 3: Evaluation
In this study, given that the testing dataset was intentionally set to be imbalanced, mirroring the natural composition of the original course review data, we employed two pivotal metrics: balanced accuracy and macro F1-score. These metrics were selected for their effectiveness in offering a more nuanced understanding of model performance in imbalanced datasets.
Balanced accuracy is an essential metric in the context of imbalanced datasets. It is the arithmetic mean of the recall obtained for each class [26]. This metric is particularly useful as it captures the model’s effectiveness across all sentiment categories without being biased toward the majority class. In an imbalanced dataset, traditional accuracy can be misleading, as it might reflect the inherent bias in the dataset rather than the model’s ability to classify sentiments accurately. Therefore, balanced accuracy offers a more reliable measure of the model’s performance across the various classes, ensuring that each class contributes equally to the overall metric, regardless of its frequency in the dataset.
The macro F1-score provides an additional metric of evaluation. It is derived from both macro-precision and macro-recall, effectively averaging the precision for every predicted class and the recall for each actual class [26]. The macro F1-score is crucial for imbalanced datasets, as it treats all classes equally, giving an unbiased measure of the model’s performance. This metric evaluates both the model’s precision (its ability to avoid false positives) and recall (its ability to find all positive samples) for each class separately, before averaging them. This ensures that the performance of the model is not disproportionately influenced by the overrepresented class in the dataset.

5. Results

5.1. Sentence-by-Sentence Generation

5.1.1. The Generated Data

In the sentence-by-sentence data generation phase, we commenced with the provisioning of the preprocessed initial dataset. As illustrated in Figure 4a, a comprehensive preprocessing regimen was undertaken, which included the removal of non-English sentences and duplicate data. This process ensured that the original data used as input for the synthetic data generation process were clean and pertinent. The outcome of this preprocessing yielded a more structured and homogenized dataset, crucial for achieving high-quality synthetic data generation.
Subsequently, we determined the requisite quantity of synthetic data needed to achieve a balance within the dataset. In the context of this research, the need for synthetic data was quantified based on the existing class imbalance within the original dataset. Specifically, to match the dominant number of positive sentiment data, we required an additional 12,441 synthetic instances for the negative class and 13,322 for the neutral class. This strategic augmentation was designed to equalize the representation of sentiments across the board, thereby facilitating a more balanced and equitable sentiment analysis.
To account for the potential emergence of low-quality synthetic data during the generation process, we produced an excess amount of synthetic data than what was needed. Figure 4b depicts the frequency distribution of the generated synthetic data, where it is evident that the volume of synthetic data produced was intentionally made surplus. This approach allowed us the flexibility to selectively curate high-quality synthetic data and eliminate any that did not meet the predetermined standards, ensuring that only the best-quality data would be utilized for balancing in the training dataset.
Thus, these steps facilitated the creation of an optimized dataset for sentiment classification under the premise that the inclusion of high-quality synthetic data would lead to more precise models and the better generalization of sentiment on previously underrepresented data.
Table 3 exemplifies the process of synthetic data generation using the sentence-by-sentence data generation technique, a process that has been delineated in the “Experimental Detail” section, particularly described in conjunction with Figure 3. The table showcases instances of original input data, the corresponding prompts used to guide the GPT-3 model, and the resultant generated output data.
For instance, the first entry in Table 3 presents the original review, “instructor doesn’t seem to be passionate about giving the lecture”. The prompt crafted to elicit synthetic data mirrors the sentiment of the original review and instructs GPT-3 to generate a sentence with a similar meaning: “Please generate a review sentence about a course that has a similar meaning to this review: ‘instructor doesn’t seem to be passionate about giving the lecture’. Keep the generated review under the given maximum token”. The output generated by GPT-3 maintains the core sentiment and succinctly rephrases it as “The instructor appears to lack enthusiasm while delivering the class”.
Table 3 serves as a concrete illustration of the synthetic data generation mechanism in action, demonstrating how prompts derived from the original data can effectively guide the model to generate new sentences that preserve the intended sentiment and meaning while adhering to specified constraints, such as token limits. Each example in this table confirms the model’s capability to reframe the sentiment in a unique but contextually relevant manner, ensuring diversity within the synthetic dataset.

5.1.2. Evaluation of Generated Synthetic Data

Upon obtaining the generated output data, an evaluation was conducted to isolate good-quality synthetic data that satisfied our predetermined criteria. The evaluation began with a thorough normalization of the data, which entailed removing non-essential special characters such as asterisks, single and double quotes, hyphens, slashes, and exclamation marks. Additionally, the normalization process included eliminating superfluous whitespace and converting all text to lowercase, thereby ensuring uniformity and reducing the probability of errors during subsequent processing. The evaluation process to obtain good-quality synthetic data includes several important results, as follows:
(1)
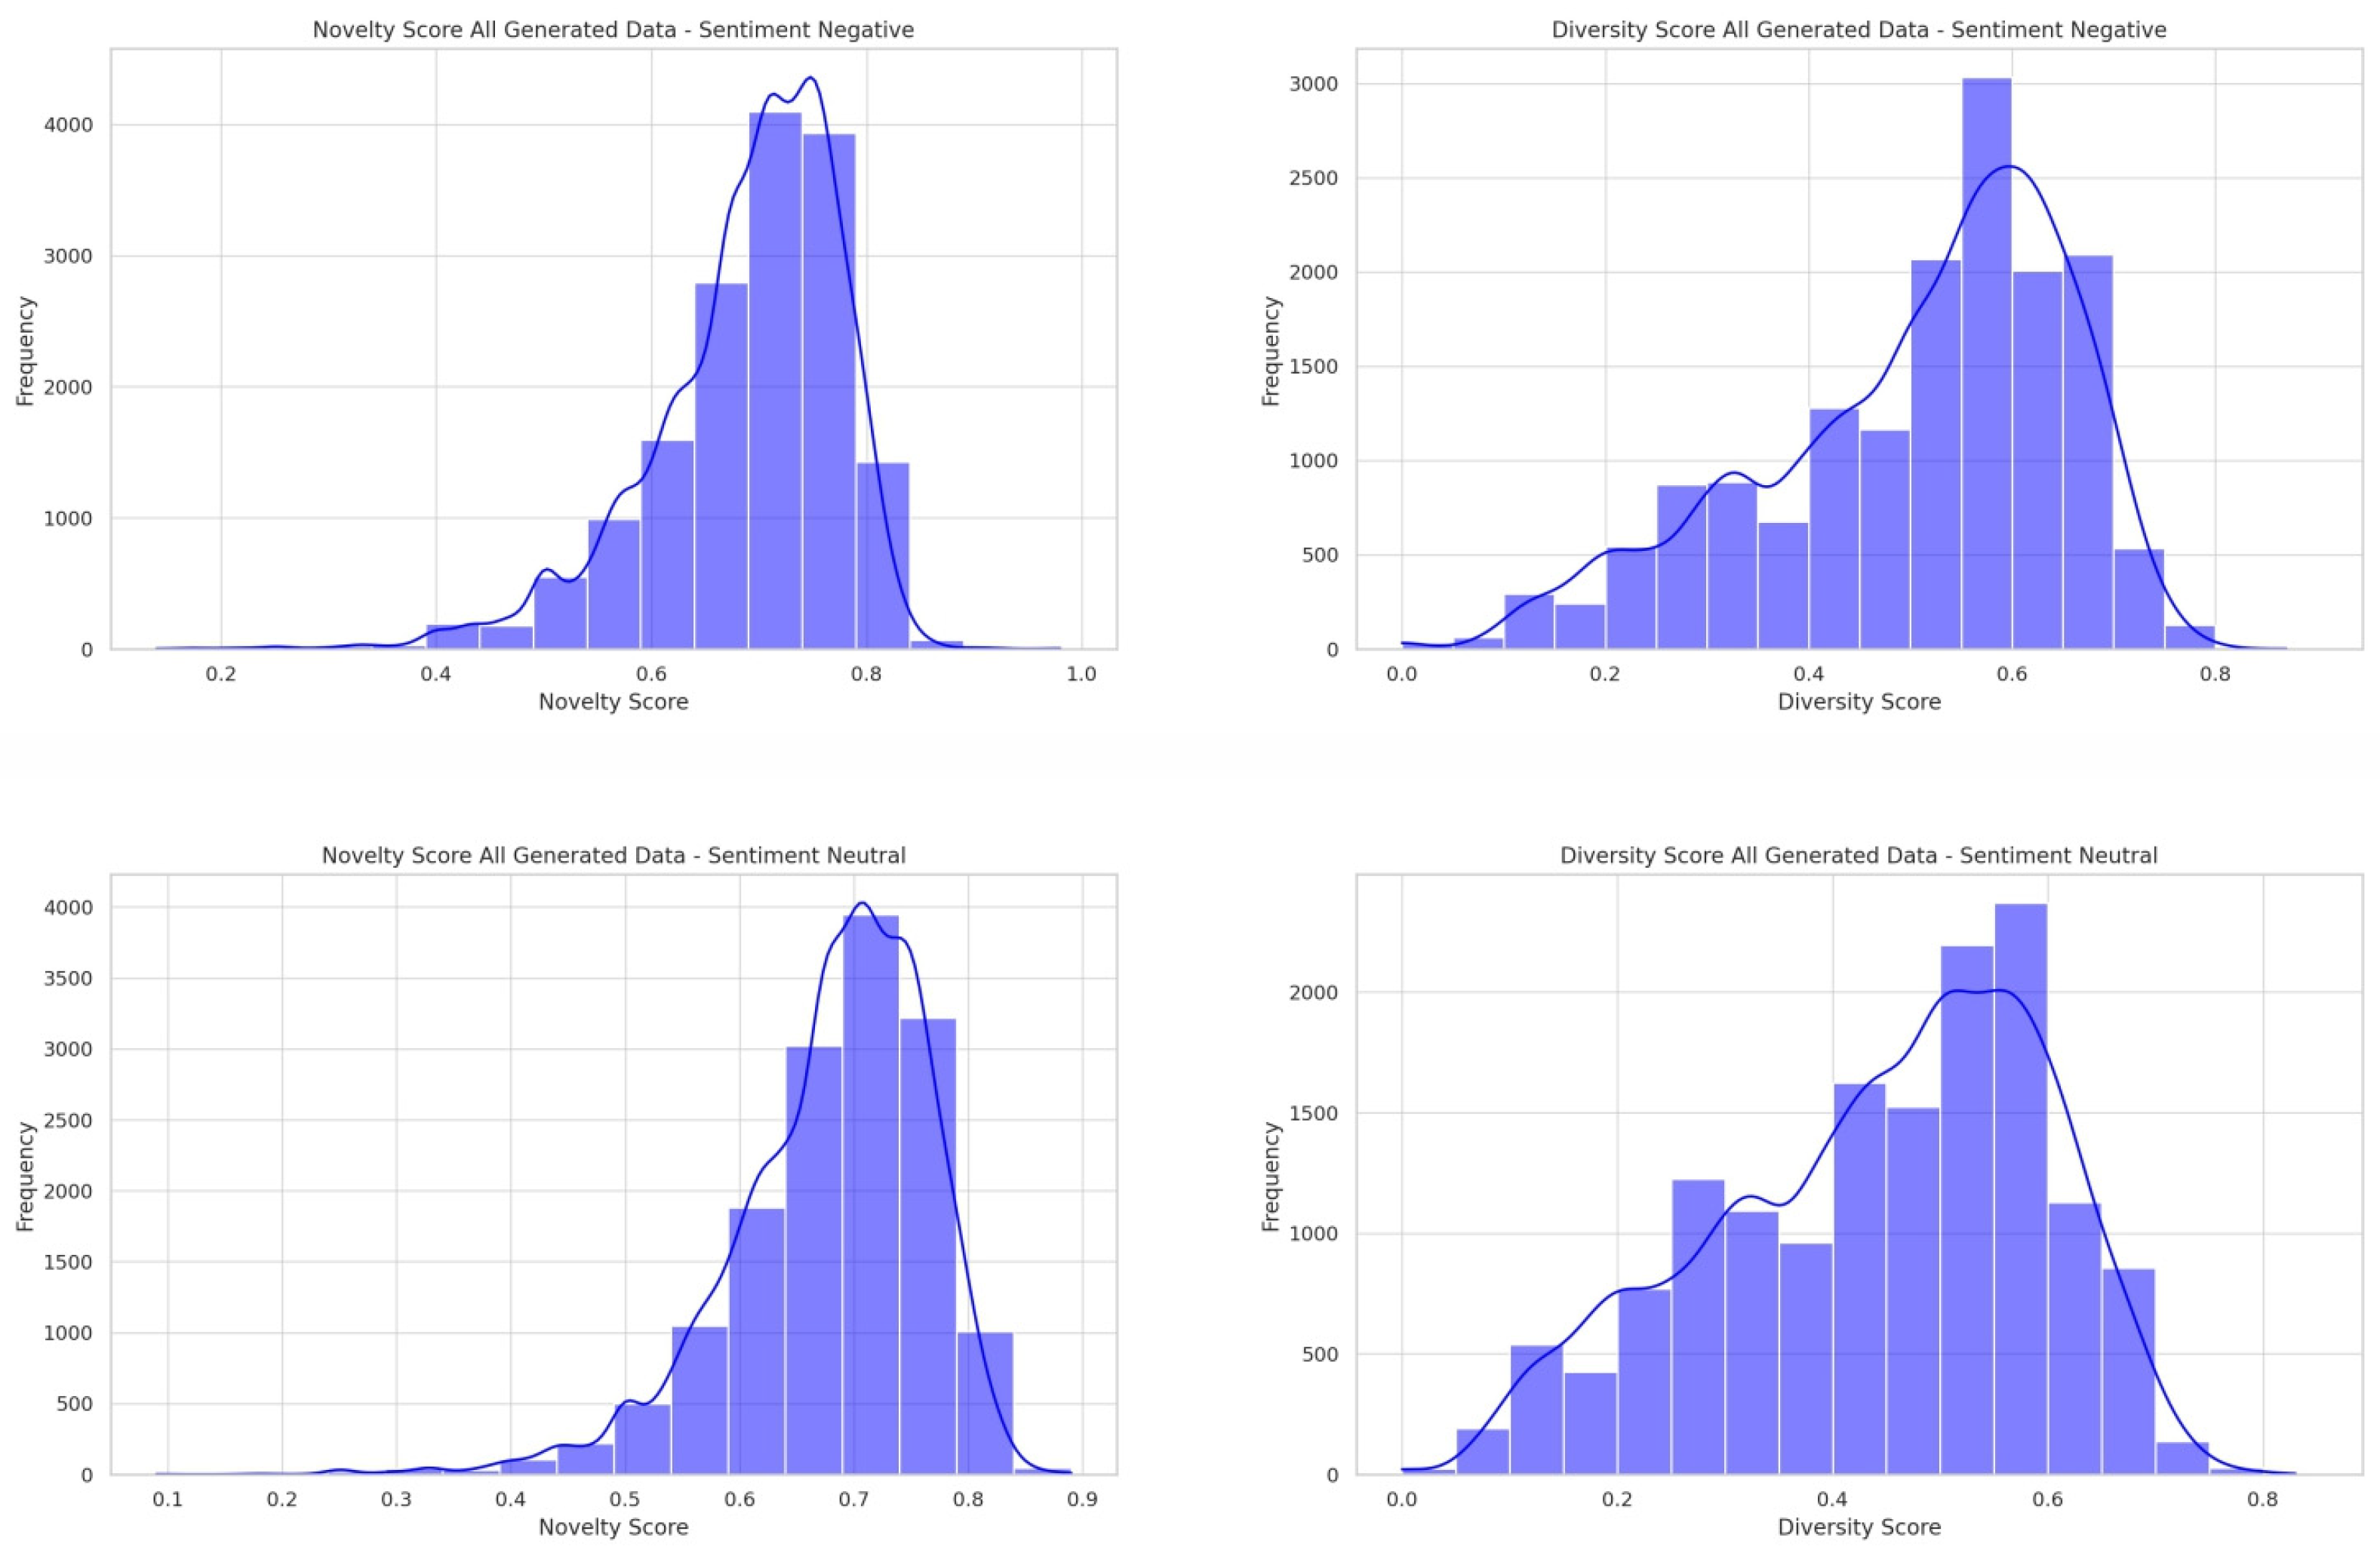
Exploration of all generated data using novelty and diversity scores
After data normalization, the next stage involved conducting a novelty and diversity analysis for all of the generated data for both negative and neutral sentiments. The results of this analysis are graphically depicted in Figure 5. The analysis of Figure 5 yields significant insights; the synthetic data for both negative and neutral sentiments demonstrate comparable trends across the evaluation metrics. The bulk of the synthetic data possess novelty scores ranging between 0.5 and 0.8. Nevertheless, a minority of the data display novelty values approaching 0, suggesting a degree of similarity to the input data, although this constitutes a relatively small proportion of the dataset. Hence, this indicates that while the GPT-3 model, utilizing the sentence-by-sentence generation technique, does not produce entirely novel data, a portion of the output still bears resemblance to the input. Regarding the diversity score, the distribution pattern diverges from that of novelty. For both negative and neutral sentiment data, there is a noticeable increase in the percentage of data points with low diversity scores nearing zero. This trend indicates a high level of similarity among the outputs, suggesting that many of the generated sentences are not distinctly different from one another.
Histograms showing novelty and diversity revealed that the outputs had similarities both among themselves and to the original inputs, underscoring the importance of conducting a duplication analysis. This analysis is crucial for ensuring that only the most original and diverse synthetic data are added to the training set, thus strengthening the dataset’s integrity and the precision of the sentiment classification models derived from them.
(2)
Data duplication analysis
Table 4 provides a summary of the duplication analysis among outputs. The column “The number of replications” indicates the total number of outputs produced per input. As mentioned in Figure 4, this research generated 15,921 synthetic data points for negative sentiment and 15,096 for neutral sentiment. From this corpus, we identified 863 duplicates and 15,058 unique outputs for negative sentiment and 1067 duplicates with 14,029 unique outputs for neutral sentiment. Of the overall duplicates, 767 were categorized as intra-duplications and 311 were classified as inter-duplications for negative sentiment. For neutral sentiment, there were 1042 intra-duplications and 124 inter-duplications.
The findings from this duplication analysis indicate that the sentence-by-sentence generation technique is prone to producing duplicate outputs. This susceptibility exists not only within the same input category but also across different inputs, underscoring the technique’s vulnerability to generating repetitive data.
(3)
Good-quality synthetic data
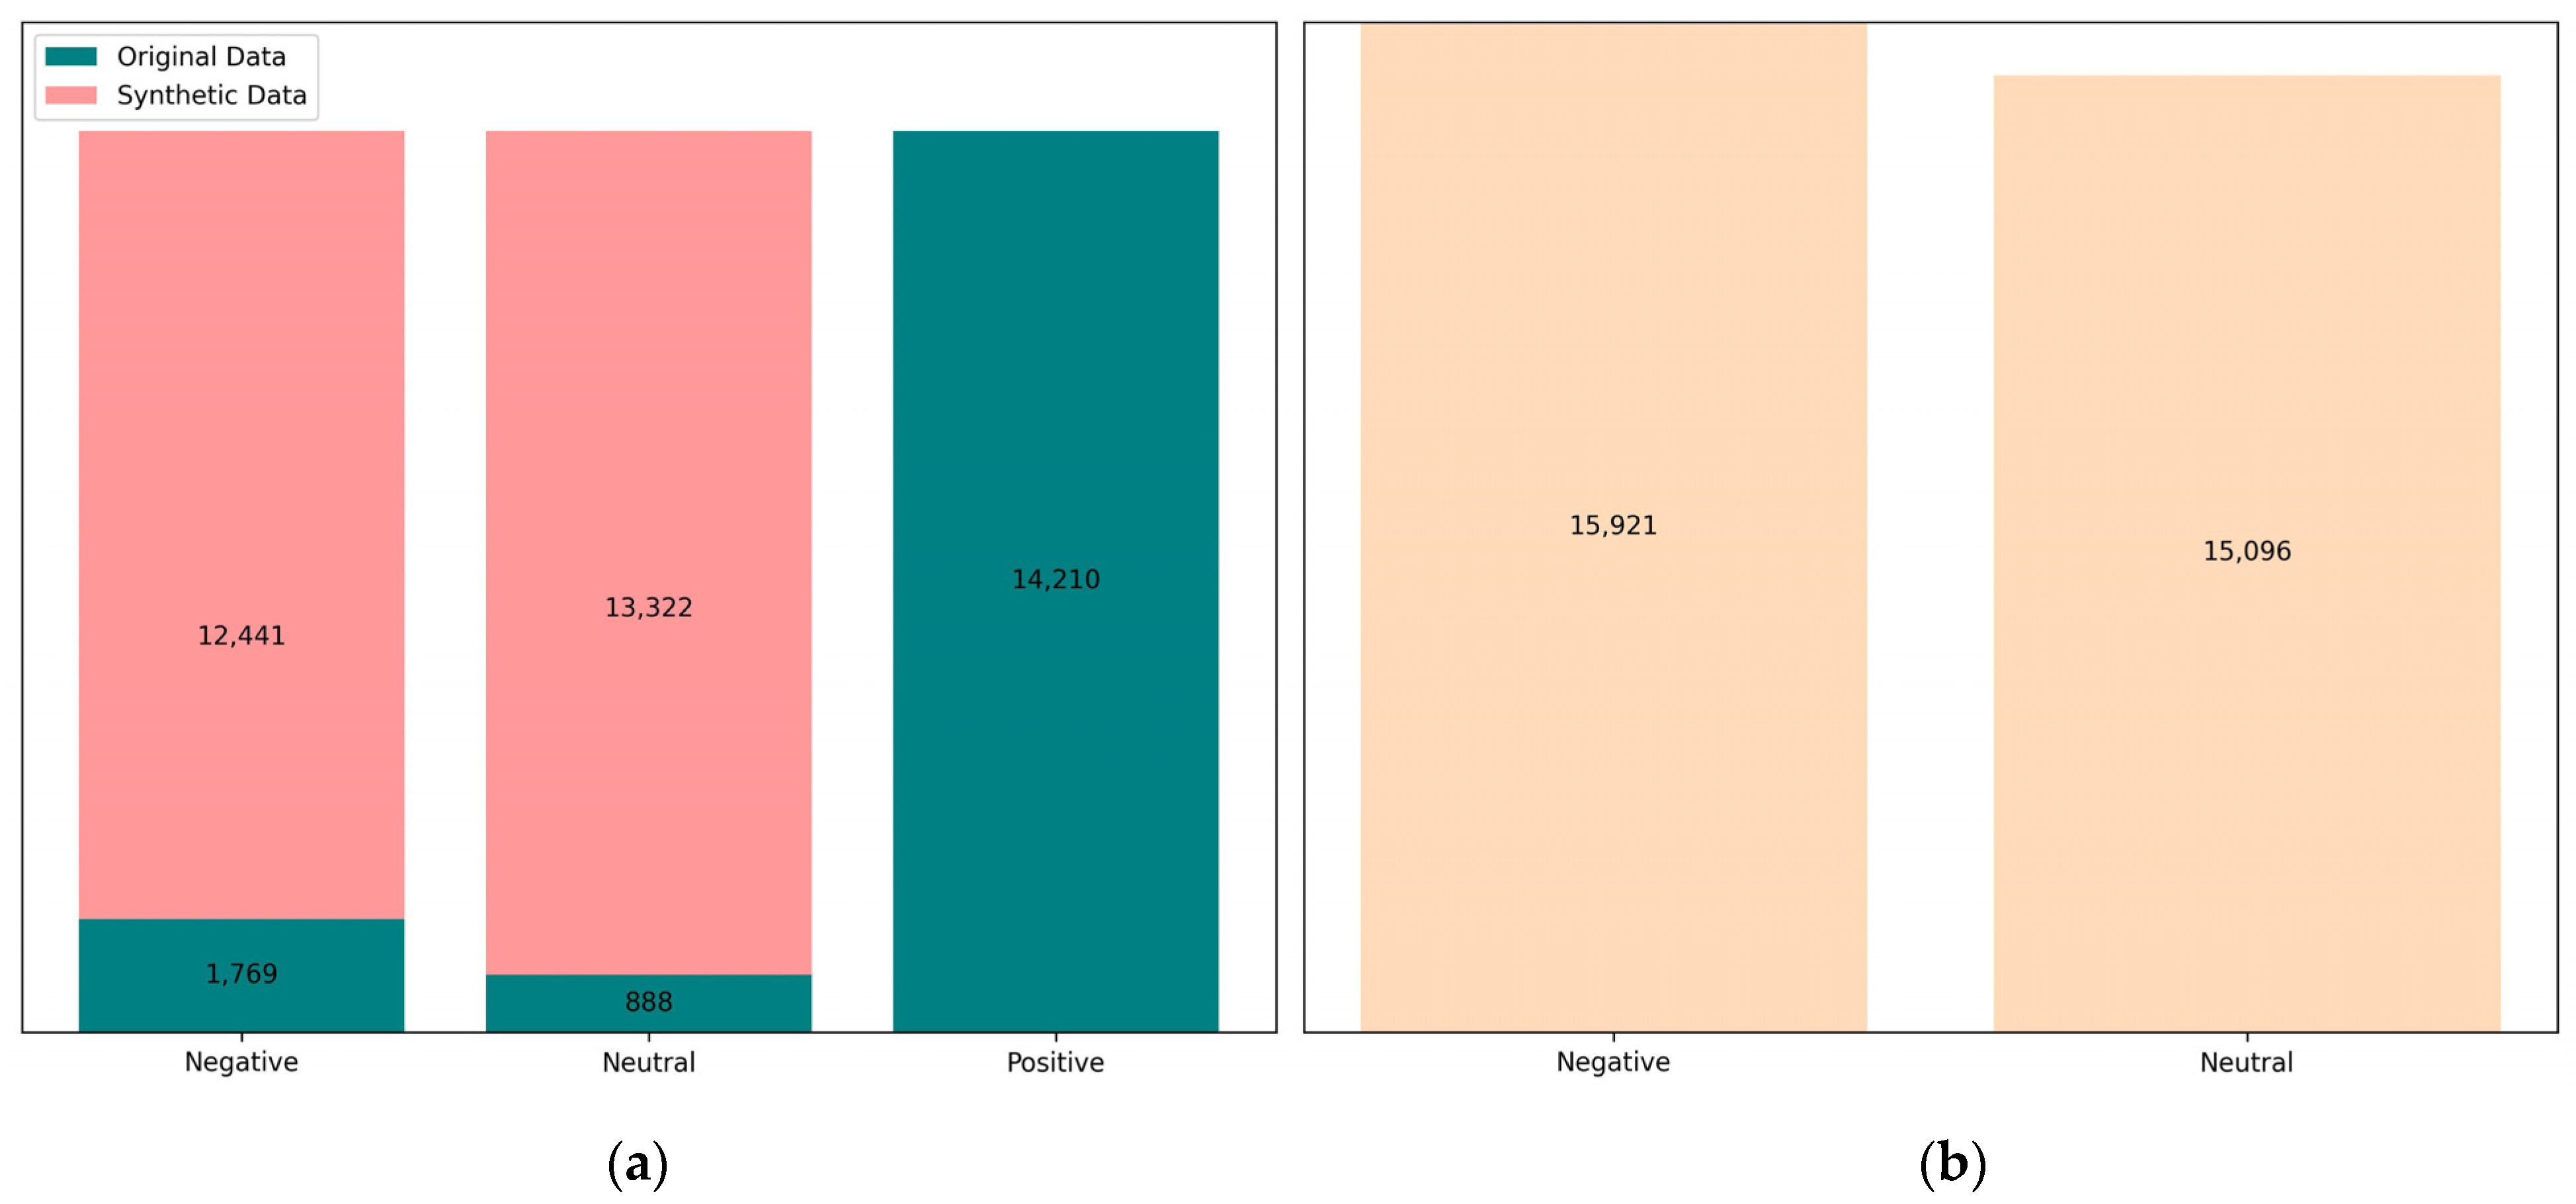
After undergoing the duplication analysis process, the next step involves identifying good-quality output to obtain synthetic data that meet our desired standards. Table 5 provides a summary of the results of the process of obtaining good-quality synthetic data for negative sentiment at each cut-off threshold. The explanation is as follows:
  • Cut-off =1
    A cut-off of 1 is referred to as an exact duplication, which is identified using the “duplicated” function in the pandas library. From the overall duplication, one entry is selected to be retained in the dataset of unique outputs. A total of 571 data points were removed due to being duplicates of other outputs. After removing duplicates, no exact duplications between outputs and inputs were detected. There was only one data anomaly for negative sentiment, characterized by a novelty value of 0.98. Conversely, no data anomalies were found in the neutral sentiment data. From this process, a total of 15,349 outputs of good-quality synthetic data for negative sentiment were obtained.
  • Cut-off = 0.8
    Contrasting with a cut-off of 1, good-quality output with a cut-off of 0.8 was achieved by discarding outputs that have a similarity of 80% or higher to other outputs or to the input, as well as removing anomalous data. A total of 1558 data points were discarded due to similarities to other outputs, and 99 data points were removed due to similarities to the input. By applying a cut-off of 0.8, a total of 14,263 good-quality synthetic data outputs for negative sentiment were obtained.
  • Cut-off = 0.75
    Following the same process as with a cut-off of 0.8, using a cut-off of 0.75 resulted in 13,935 outputs of good-quality synthetic data for negative sentiment, while 1986 outputs were of bad quality.
  • Cut-off = 0.5
    With a cut-off of 50, a total of 10,699 good-quality synthetic data outputs were produced, along with 5222 bad-quality outputs.
Furthermore, from Table 5, we can see that as the cut-off value is lowered, the proportion of data classified as “bad” automatically increases, meaning that the amount of good-quality synthetic data available for use diminishes. This trend leads to a shortfall in the quantity of good-quality synthetic data necessary for achieving a balance within the dataset. For negative sentiment, the number of good-quality synthetic data derived from a cut-off of 0.5 falls short at only 10,699 outputs, whereas 12,441 are required to establish a balance. Similarly, for neutral sentiment, the good-quality synthetic data generated with cut-offs of 0.8, 0.75, and 0.5 are insufficient to meet the balancing need of 13,322 data points. Therefore, only the dataset balanced at a cut-off of 1 can yield a fully balanced dataset. In contrast, datasets derived from other cut-off values do not achieve total balance, indicating the critical impact of the chosen cut-off threshold on data quality and utility.
(4)
Evaluation of good-quality synthetic data
In this study, we define good-quality synthetic data as data that exhibit extensive diversity, demonstrate significant novelty, and maintain coherence with the original dataset concerning course reviews. The approach to assessing this involves analyzing novelty and diversity scores, where values approaching 1 could signal anomalous data, while scores close to 0 might suggest high similarity within outputs and to the input. The use of cosine similarity metrics is thus essential to ascertain the coherence between outputs and inputs. High novelty and diversity scores paired with low cosine similarity would indicate outputs that are not coherent with the inputs. In contrast, outputs with high scores in novelty, diversity, and cosine similarity are considered to meet the criteria for extensive diversity, significant novelty, and coherence. On the flip side, very low novelty and diversity scores suggest that the generated outputs are highly similar to other outputs and even to the input.
This evaluation process is critical to ascertaining whether the good-quality synthetic data produced by sentence-by-sentence generation meet our intended standards. Given the challenges encountered in acquiring high-quality synthetic data—specifically, the issues of duplication or high similarity among outputs—we were prompted to explore various outcomes by setting different cut-off thresholds as a means to manage similarity. Consequently, we established four distinct sets of good-quality synthetic data, each corresponding to different cut-off levels. Figure 6 presents the evaluation results for these datasets, showcasing the implications of our findings for the novelty, diversity, similarity, and cosine similarity metrics.
A novelty score close to 0 represents similarity between an output and all inputs, meaning that the similarity could be between an output and its corresponding input or other inputs. Figure 6 shows that for both negative and neutral data, there are no longer any novelty values very close to 0 across all cut-off datasets, meaning there is no longer a high similarity between the output and input. This is also confirmed by the similarity score metric, which represents the similarity between the output and its input. Across all cut-offs, for both negative and neutral sentiments, there are no values close to 1, indicating that no outputs have a high similarity to their inputs. Then, a diversity score close to zero reflects similarity among outputs. The histogram clearly shows that for both negative and neutral sentiment data, outputs from a cut-off of 1 still have relatively many diversity scores close to 0 compared to outputs from other cut-offs. This suggests that simply removing exact duplicates is not sufficient, meaning there are still outputs with high similarity to other outputs. For cut-offs of 0.8 and 0.75, there are very few data points where the diversity score is still close to 0, indicating that our similarity detection algorithm still has weaknesses. For instance, because the process begins by sorting outputs, if there are outputs that use the same words as others but in a different order, they will not be detected as similar pairs. Furthermore, in terms of anomalies, the novelty and diversity scores show no values very close to 1, meaning there are no outputs that are entirely different in characteristics from the rest. This is also confirmed by the cosine similarity value, which serves as a metric to measure the good-quality synthetic data in this study, namely, the coherence between outputs and inputs. The histogram shows that for both negative and neutral data, across all cut-offs, the cosine similarity scores are above 0.6, meaning the generated outputs have a high semantic similarity to their inputs based on GloVe embeddings.
Therefore, based on these results, we can deduce that, in general, the good-quality synthetic data obtained generally meet the standards we set. However, there is still a minor issue that poses a problem: similarity. For a cut-off of 0.5, we could produce good-quality synthetic data that better meet our expectations compared to other cut-offs, meaning that the similarity among its outputs is very low. However, the consequence is that more generated outputs are discarded as bad data, resulting in a deficit of good-quality synthetic data for balancing needs. Hence, according to our analysis, a cut-off of 0.75 is the most prudent. It generates a relative standard of outputs without discarding too many synthetic data points as bad, allowing the availability of good-quality synthetic data to closely approach the desired requirements.

5.2. Sentiment Classification

5.2.1. Distribution of Dataset for Sentiment Classification

Our proposed approach in this study focuses on data balancing to enhance the performance of sentiment classification. Therefore, we conducted sentiment classification for datasets augmented with good-quality synthetic data as well as the original imbalanced dataset. Because our investigation yielded four versions of good-quality synthetic data through the application of various cut-off thresholds to remove similar outputs, we obtained four datasets from this experiment. The dataset balanced with good-quality synthetic data from a cut-off of 1 is named Dataset-100, and similarly, datasets resulting from cut-offs of 0.8, 0.75, and 0.5 are named Dataset-80, Dataset-75, and Dataset-50, respectively. Hence, the outcomes of the sentence-by-sentence data generation in this study provide four distinct datasets for the sentiment classification process.
In addition to comparing the classification performance of these four datasets with the original imbalanced dataset, we also aimed to benchmark them against the findings from a previous study, which employed a fine-tuning approach to GPT-3 in the synthetic data generation process [11]. Given that the initial preprocessing phase of this study resulted in cleaner, superior original data compared to the preprocessing conducted in the previous study, we elected to use the original data from this study’s preprocessing phase alongside the fine-tuning synthetic data to ensure comparable results. Consequently, we performed sentiment classification for six datasets as training data, which are Dataset-100, Dataset-80, Dataset-75, Dataset-50, the fine-tuning dataset, and the original (imbalanced) dataset. The distribution of these six datasets is displayed in Figure 7. From the figure, we can see that only the fine-tuning dataset and Dataset-100 are truly balanced, while Dataset-80, Dataset-75, and Dataset-50 are not entirely balanced. This is because the good-quality synthetic data generated with cut-offs of 0.8, 0.75, and 0.5 did not completely fulfill the synthetic data requirements for balancing, as mentioned in the previous section.
In the graph of the original data shown in Figure 7, we also present the testing dataset. We set this testing dataset to be imbalanced, mirroring the inherent characteristics of the original Coursera review dataset. These testing data were utilized to evaluate the overall performance of the model trained on all six datasets employed in this experiment. The decision to use an imbalanced testing set is a deliberate one, aiming to provide a stringent testing environment that closely replicates real-world data scenarios, thus allowing for a robust assessment of the model’s ability to generalize across different sentiment classes.

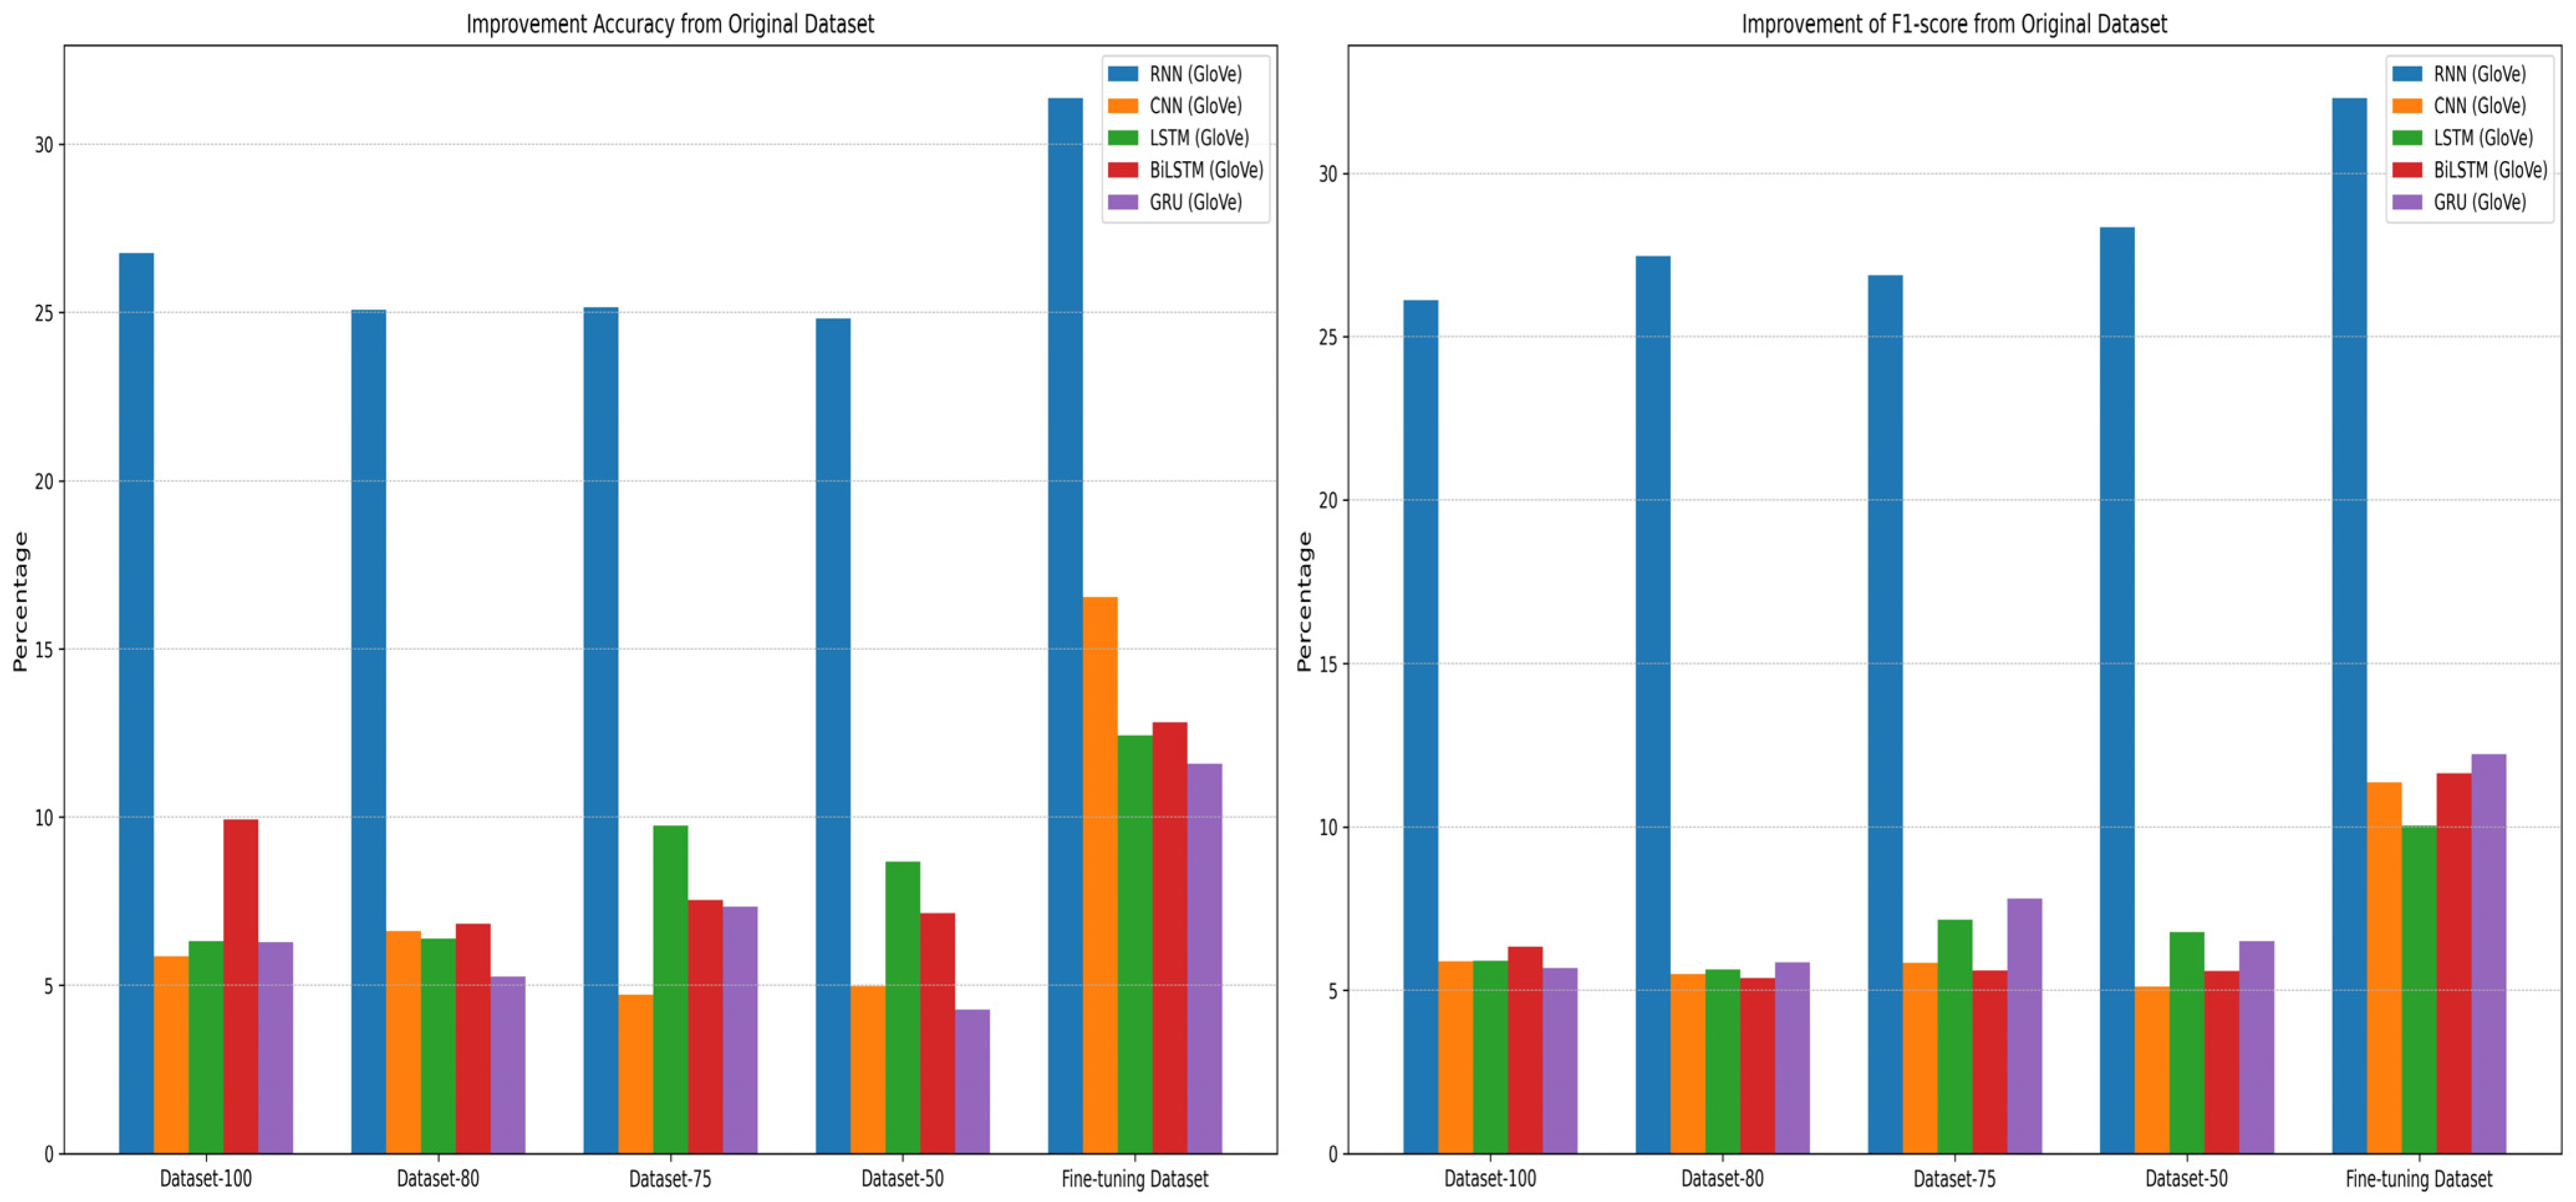
5.2.2. Sentiment Classification Results

The sentiment classification results, featuring balanced accuracy and macro F1-score as metrics, are summarized in Table 6. Meanwhile, Figure 8 visually displays the improvements in the accuracy and F1-score of the proposed datasets over the original dataset. These proposed datasets encompass those created through both sentence-by-sentence and fine-tuning techniques. The objective is to evaluate the classification performance of the sentence-by-sentence generated datasets in comparison to the fine-tuning dataset, especially regarding their improvements over the original imbalanced dataset.
The datasets generated via the sentence-by-sentence generation technique—namely, Dataset-100, Dataset-80, Dataset-75, and Dataset-50—demonstrate significant improvements in sentiment classification performance across all models, reflected in increased accuracy and F1-score metrics. This underscores the efficacy of our synthetic data in enhancing classification performance. Notably, Dataset-100, which represents a perfectly balanced dataset, shows a marked improvement in model accuracy and F1-score across all models when compared to the original dataset. The Recurrent Neural Network (RNN) with GloVe embeddings, for instance, shows an increase in accuracy from 33.33% in the original dataset to 60.10% in Dataset-100, with a similar improvement in the F1-score. This trend is consistent across other models, such as the Convolutional Neural Network (CNN), Long Short-Term Memory (LSTM) network, Bidirectional LSTM (BiLSTM), and Gated Recurrent Unit (GRU), confirming the benefit of a balanced dataset in sentiment classification tasks.
Nevertheless, when compared to the fine-tuning dataset, the sentence-by-sentence datasets exhibit slightly lower performance. The fine-tuning dataset stands out with the highest accuracy and F1-score for all models. For example, the fine-tuning dataset improves the accuracy of the GRU model to 67.49% and the F1-score to 66.67%, outperforming all sentence-by-sentence datasets. Indeed, for all models, the fine-tuning dataset successfully delivers performance improvements of over 10%. Specifically, for the RNN model, this fine-tuning dataset can achieve performance increases of over 30% in both the accuracy and F1-score.
Delving further into data quality and balance, it becomes apparent that Dataset-100, which is fully balanced, typically yields better performance enhancements than the other sentence-by-sentence-generated datasets. However, intriguingly, Datasets-80, -75, and even -50 show performance increases that are not drastically different from those in Dataset-100, with some models displaying superior performance, such as Dataset-75, which excels in accuracy and F1-score for the LSTM model.
This points to an important discovery in our research: the balance and quality of synthetic data used for balancing have a tangible effect on the classification performance. Specifically, while Dataset-100 is balanced, it still contains a degree of output similarity, suggesting its diversity may not entirely align with our expectations. Dataset-75, however, which is not perfectly balanced but has a lower degree of output similarity, indicates a greater diversity and stands as proof that a diverse yet coherent dataset can lead to better performance.
The comparative performance of various models across each dataset highlights the impact of different data enhancement techniques on sentiment classification. The RNN model with GloVe embeddings shows the most significant improvement in accuracy across all of the proposed datasets, peaking at a 31.38% increase with the fine-tuning dataset. Similarly, it leads to an improvement in the F1-score, with a notable 32.31% rise, again with the fine-tuning dataset. For the other models, LSTM demonstrates notable performance enhancements, especially with Dataset-75, where it achieves a 9.75% increase in accuracy and a 7.15% increase in the F1-score. The BiLSTM and GRU models exhibit more modest improvements; however, they still benefit from the sentence-by-sentence generation technique, as shown by their improved metrics over the original dataset. In terms of the datasets generated by the sentence-by-sentence technique, even Dataset-50, which is the least balanced, shows a significant increment in performance, particularly for the RNN model, where it has the highest F1-score improvement at 28.35%. This reveals that even less balanced datasets can considerably enhance the model’s performance when compared to the original dataset.
To sum up, although the sentence-by-sentence generation technique substantially boosts performance over that of the original dataset, the fine-tuning approach remains superior in improving the sentiment classification results. It is a noteworthy point that the fine-tuning dataset comprises synthetic data free from duplications or high-similarity issues. This means that the dataset exhibits good novelty and diversity while still being relevant to the context of course reviews because the GPT-3 model has been fine-tuned. This underscores the importance of further refining the balance and quality of synthetic data to advance sentiment analysis performance.

6. Discussion

In this study, we focused on enhancing the performance of sentiment classification by balancing minority classes using synthetic data generated by the GPT-3 model through the sentence-by-sentence data generation technique. This research builds upon our previous study [11], which utilized the fine-tuning technique of the GPT-3 model for generating synthetic data.
We explored another technique for generating synthetic data, namely, the prompting method, specifically the sentence-by-sentence generation technique. This study defined the criteria for good synthetic data used for balancing to improve the classification performance as data that exhibit good novelty and diversity while maintaining coherence with the original data.
In our experiment, we identified several limitations in GPT-3’s ability to generate synthetic course reviews using sentence-by-sentence generation. We observed that the model often produces outputs that are closely similar to the original input reference data and a high degree of duplications among outputs. This tendency results in the generated data lacking in diversity and novelty, which is a crucial aspect considering our objective of creating novel and diverse data that remain contextually relevant. While GPT-3’s ability to closely mirror input data can be advantageous for certain applications, it poses a significant challenge in scenarios where the uniqueness of and variation in outputs are important. These findings underscore the need for further refinement in using GPT-3 for synthetic data generation, particularly in enhancing the diversity and novelty of the outputs without compromising their relevance and coherence.
Alongside these limitations, a significant challenge we encountered in using GPT-3 is determining the appropriate parameters, particularly the temperature setting and the design of prompts, to guide the model in generating text that aligns with our specific requirements. The temperature parameter, which controls the randomness of the output, requires careful tuning to balance creativity and coherence. Similarly, crafting effective prompts is crucial, as they significantly influence the model’s output. These challenges highlight the intricacies involved in parameter optimization to ensure that GPT-3 generates text that is not only diverse and novel but also contextually appropriate and aligned with our research objectives.
For sentiment classification, our findings show that sentence-by-sentence generation generally enhances imbalanced sentiment classification, as is evident from the improvements in accuracy and F1-score metrics across all datasets generated by this technique compared to the original imbalanced dataset, with increases of around 5 to 25 percent for the five deep-learning models tested. Comparatively, our approach demonstrates certain advantages over other studies, such as the one conducted by Imran et al. [22], which also used Coursera review data but with a GAN-based model. Our study diverges from theirs in crucial aspects, such as preprocessing techniques, data splitting for classification, and the use of different embedding methods. Specifically, we implemented GloVe embeddings for a range of models, including RNN, CNN, LSTM, BiLSTM, and GRU, whereas Imran et al. [22] focused on models like regular RNN, BiLSTM (Glove), BiLSTM (FastText), BILSTM (BERT), and GRU (BERT).
Our results indicate the higher accuracy of balanced datasets for RNN, BiLSTM, and GRU models compared to those reported in [22]. This suggests that not only the choice of the model and architecture but also the methodology of synthetic data generation plays a pivotal role in achieving higher accuracy in sentiment analysis. Moreover, the choice of GPT-3 for generating synthetic data, as opposed to the GAN model used by Imran et al. [22] presents a significant strategic advantage. GPT-3, being one of the latest and largest language models available, offers enhanced capabilities in generating diverse and contextually rich synthetic data. This factor is crucial in dealing with the complexities and nuances of natural language, particularly in sentiment analysis.
However, when compared to the fine-tuning dataset, the sentiment classification performance is still lower. This suggests that the balanced dataset generated through the fine-tuning technique is superior to the four datasets generated by sentence-by-sentence generation. The superior performance of the fine-tuning dataset could be attributed to its better novelty and diversity characteristics compared to the sentence-by-sentence datasets, as indicated by the novelty and diversity scores of good-quality synthetic data from the fine-tuning method, which are above 0.5 [11], signifying better novelty and better diversity. In contrast, the sentence-by-sentence-generated datasets still exhibit diversity values close to 0, indicating that good-quality synthetic data still have similarities among outputs.
This similarity issue is identical to the problem of duplication, though not at an exact 100% level. In the field of text data, duplication is a critical issue, leading to numerous studies discussing the importance of deduplication, the process of eliminating duplication or repetition in data [27,28,29]. In the realm of text classification, the issue of duplication is also a serious concern. In this study, synthetic data were utilized to balance the training dataset. The models trained with these balanced data were subsequently tested on a testing dataset comprising entirely original data, free from synthetic content. We argue that when a model is trained using less diverse data, its ability to accurately predict outcomes when exposed to new, unseen data may be compromised. This is a key finding of our research that warrants further investigation in future studies. Such a limitation highlights the necessity of ensuring data diversity during the training phase to bolster the model’s predictive capabilities, especially when applied to real-world scenarios where it encounters diverse and novel data inputs.
Efforts to remove observations with high similarity were made by setting cut-off thresholds, resulting in four distinct datasets based on these thresholds: Dataset-100, Dataset-80, Dataset-75, and Dataset-50. Ideally, a cut-off of 0.5 would yield good-quality synthetic data with minimal similarity, but the amount of good-quality synthetic data generated at this cut-off was insufficient for balancing the minority classes. Consequently, Dataset-50, generated from the 0.5 cut-off, could not be fully balanced, and hence, its classification performance did not surpass that of Dataset-100 for all deep-learning models. However, Dataset-75 showed superior performance to Dataset-100. Dataset-75, though not entirely balanced, was more balanced than Dataset-50 and had more similar data removed than Dataset-100, leading to more satisfactory classification results.
Besides the quality of synthetic data, we were also focused on preprocessing and the architectures of the deep-learning models used. This is our effort to carry out best practices in conducting sentiment classification. This study applied more stringent preprocessing and deeper deep-learning architectures compared to our previous study [11]. Therefore, the fine-tuning dataset in this study outperformed the deep-learning models in our previous research in terms of classification performance. This result underscores the importance of an appropriate architecture that fits the dataset.
Among the five deep-learning models tested, the RNN model showed a significantly higher improvement in accuracy and F1-score than the other models for all datasets, both fine-tuning and sentence-by-sentence-generated ones. This indicates that the preprocessing and architecture we applied in this study, specifically for the RNN model, significantly enhanced the accuracy and F1-score metrics for sentiment classification. Therefore, through this study, we highlight crucial points in handling imbalanced sentiment analysis: (1) The synthetic data used for balancing should have good novelty and diversity while maintaining coherence with the original data. (2) The balance of the data also affects the resulting classification performance. (3) Proper preprocessing leads to quality data for training. (4) The optimal deep-learning architecture enhances the sentiment classification performance.
This study has limitations, including the algorithm for detecting similar data, which starts by sorting data and has a weakness. If two outputs share similar words but in a different order, they may not be detected as similar outputs. Therefore, a more robust detection of similar outputs needs to be developed.
Future work could explore other techniques for generating higher-quality synthetic data, as well as experimenting with various deep-learning architectures or embeddings to achieve better outcomes. Additionally, further research is needed to thoroughly examine the effects of duplication on the sentiment classification performance. A critical area of investigation will be the refinement of methods to detect similarity among outputs, aiming to achieve more accurate and robust results. This includes developing advanced algorithms and techniques that can more effectively identify and mitigate issues related to data redundancy and similarity, thereby enhancing the overall efficacy of sentiment analysis models. Such advancements are essential for improving the reliability of models trained on synthetic data, ensuring they are well equipped to handle diverse and complex real-world datasets.

7. Conclusions

In concluding our study, we emphasize the importance of generating and evaluating synthetic data to improve sentiment analysis performance. By implementing the sentence-by-sentence generation technique using the GPT-3 model, we aimed to create synthetic data that effectively balance minority classes. This approach showed promising results, as evidenced by the improved accuracy and F1-score metrics across five deep-learning models. However, when compared to our previous research utilizing the fine-tuning method, the current method falls slightly short. The datasets generated through the fine-tuning method displayed better quality in terms of novelty and diversity, primarily because these datasets did not contain duplicated or highly similar outputs. In contrast, the datasets generated by the sentence-by-sentence generation technique faced significant issues with duplication and similarity. This distinction underlines the critical importance of the generation technique and its evaluation process in producing high-quality synthetic data, which is essential for enhancing the performance of sentiment analysis.
Further reflecting on our findings, we underscore the importance of adhering to best practices in sentiment analysis. This encompasses performing thorough preprocessing, selecting the appropriate model, and tailoring the architecture to fit the dataset’s needs. Our experiments with five different deep-learning models, using GloVe embeddings and exploring deeper architectures, provided substantial insights. Notably, the Recurrent Neural Network (RNN) model demonstrated significant advantages in terms of accuracy and F1-score improvements, outperforming other models, such as CNN, LSTM, BiLSTM, and GRU.
The results of our study underline the importance of not only the quality of synthetic data used for balancing minority classes but also the strategic selection and implementation of deep-learning models tailored to the specific characteristics of the dataset. Our findings advocate for a comprehensive approach that considers both the training data and the specifications of various deep-learning models to achieve optimal results in sentiment analysis.

Author Contributions

Conceptualization, H.-S.Y.; Methodology, C.S.; Software, C.S.; Validation, H.-S.Y.; Formal analysis, C.S.; Investigation, C.S.; Resources, H.-S.Y.; Data curation, C.S.; Writing—original draft, C.S.; Writing—review & editing, H.-S.Y.; Visualization, C.S.; Supervision, H.-S.Y.; Project administration, H.-S.Y.; Funding acquisition, H.-S.Y. All authors have read and agreed to the published version of the manuscript.

Funding

This work is partially supported by the Korea Agency for Infrastructure Technology Advancement (KAIA) grant funded by the Ministry of Land, Infrastructure and Transport (Grant RS-2022-00143782).

Institutional Review Board Statement

Not applicable.

Informed Consent Statement

Not applicable.

Data Availability Statement

The data utilized in this study are not publicly available and can be accessed only upon request to Kastrati et al. [23].

Conflicts of Interest

The authors declare no conflicts of interest.

References

  1. Bordoloi, M.; Biswas, S.K. Sentiment Analysis: A Survey on Design Framework, Applications and Future Scopes. Artif. Intell. Rev. 2023, 56, 12505–12560. [Google Scholar] [CrossRef] [PubMed]
  2. Sangeetha, J.; Kumaran, U. Sentiment Analysis of Amazon User Reviews Using a Hybrid Approach. Meas. Sens. 2023, 27, 100790. [Google Scholar] [CrossRef]
  3. Zhao, H.; Liu, Z.; Yao, X.; Yang, Q. A Machine Learning-Based Sentiment Analysis of Online Product Reviews with a Novel Term Weighting and Feature Selection Approach. Inf. Process. Manag. 2021, 58, 102656. [Google Scholar] [CrossRef]
  4. Li, Y.; Sun, G.; Zhu, Y. Data Imbalance Problem in Text Classification. In Proceedings of the IEEE 2010 Third International Symposium on Information Processing, Qingdao, China, 15–17 October 2010; pp. 301–305. [Google Scholar]
  5. Padurariu, C.; Breaban, M.E. Dealing with Data Imbalance in Text Classification. Procedia Comput. Sci. 2019, 159, 736–745. [Google Scholar] [CrossRef]
  6. Brown, T.B.; Mann, B.; Ryder, N.; Subbiah, M.; Kaplan, J.; Dhariwal, P.; Neelakantan, A.; Shyam, P.; Sastry, G.; Askell, A.; et al. Language Models Are Few-Shot Learners. Adv. Neural Inf. Process. Syst. 2020, 33, 1877–1901. [Google Scholar]
  7. Elkins, K.; Chun, J. Can GPT-3 Pass a Writer’s Turing Test? J. Cult. Anal. 2020, 5, 1–16. [Google Scholar] [CrossRef]
  8. Floridi, L.; Chiriatti, M. GPT-3: Its Nature, Scope, Limits, and Consequences. Minds Mach. 2020, 30, 681–694. [Google Scholar] [CrossRef]
  9. Skondras, P.; Zervas, P.; Tzimas, G. Generating Synthetic Resume Data with Large Language Models for Enhanced Job Description Classification. Future Internet 2023, 15, 363. [Google Scholar] [CrossRef]
  10. Abramski, K.; Citraro, S.; Lombardi, L.; Rossetti, G.; Stella, M. Cognitive Network Science Reveals Bias in GPT-3, GPT-3.5 Turbo, and GPT-4 Mirroring Math Anxiety in High-School Students. Big Data Cogn. Comput. 2023, 7, 124. [Google Scholar] [CrossRef]
  11. Suhaeni, C.; Yong, H.-S. Mitigating Class Imbalance in Sentiment Analysis through GPT-3-Generated Synthetic Sentences. Appl. Sci. 2023, 13, 9766. [Google Scholar] [CrossRef]
  12. Obiedat, R.; Qaddoura, R.; Al-Zoubi, A.M.; Al-Qaisi, L.; Harfoushi, O.; Alrefai, M.; Faris, H. Sentiment Analysis of Customers’ Reviews Using a Hybrid Evolutionary SVM-Based Approach in an Imbalanced Data Distribution. IEEE Access 2022, 10, 22260–22273. [Google Scholar] [CrossRef]
  13. Wen, H.; Zhao, J. Sentiment Analysis of Imbalanced Comment Texts Under the Framework of BiLSTM. In Proceedings of the IEEE 2023 6th International Conference on Artificial Intelligence and Big Data (ICAIBD), Chengdu, China, 26–29 May 2023; pp. 312–319. [Google Scholar]
  14. Tan, K.L.; Lee, C.P.; Lim, K.M. RoBERTa-GRU: A Hybrid Deep Learning Model for Enhanced Sentiment Analysis. Appl. Sci. 2023, 13, 3915. [Google Scholar] [CrossRef]
  15. Wu, J.-L.; Huang, S. Application of Generative Adversarial Networks and Shapley Algorithm Based on Easy Data Augmentation for Imbalanced Text Data. Appl. Sci. 2022, 12, 10964. [Google Scholar] [CrossRef]
  16. Department of Computer Science, Avinashilingam Institute for Home Science and Higher Education for Women, Coimbatore, India; George, S.; Srividhya, V. Performance Evaluation of Sentiment Analysis on Balanced and Imbalanced Dataset Using Ensemble Approach. Indian J. Sci. Technol. 2022, 15, 790–797. [Google Scholar] [CrossRef]
  17. Cai, T.; Zhang, X. Imbalanced Text Sentiment Classification Based on Multi-Channel BLTCN-BLSTM Self-Attention. Sensors 2023, 23, 2257. [Google Scholar] [CrossRef]
  18. Akkaradamrongrat, S.; Kachamas, P.; Sinthupinyo, S. Text Generation for Imbalanced Text Classification. In Proceedings of the IEEE 2019 16th International Joint Conference on Computer Science and Software Engineering (JCSSE), Chonburi, Thailand, 10–12 July 2019; pp. 181–186. [Google Scholar]
  19. Habbat, N.; Nouri, H.; Anoun, H.; Hassouni, L. Using AraGPT and Ensemble Deep Learning Model for Sentiment Analysis on Arabic Imbalanced Dataset. ITM Web Conf. 2023, 52, 02008. [Google Scholar] [CrossRef]
  20. Habbat, N.; Nouri, H.; Anoun, H.; Hassouni, L. Sentiment Analysis of Imbalanced Datasets Using BERT and Ensemble Stacking for Deep Learning. Eng. Appl. Artif. Intell. 2023, 126, 106999. [Google Scholar] [CrossRef]
  21. Shaikh, S.; Daudpota, S.M.; Imran, A.S.; Kastrati, Z. Towards Improved Classification Accuracy on Highly Imbalanced Text Dataset Using Deep Neural Language Models. Appl. Sci. 2021, 11, 869. [Google Scholar] [CrossRef]
  22. Imran, A.S.; Yang, R.; Kastrati, Z.; Daudpota, S.M.; Shaikh, S. The Impact of Synthetic Text Generation for Sentiment Analysis Using GAN Based Models. Egypt. Inform. J. 2022, 23, 547–557. [Google Scholar] [CrossRef]
  23. Kastrati, Z.; Arifaj, B.; Lubishtani, A.; Gashi, F.; Nishliu, E. Aspect-Based Opinion Mining of Students’ Reviews on Online Courses. In Proceedings of the ACM 2020 6th International Conference on Computing and Artificial Intelligence, Tianjin, China, 23–26 April 2020; pp. 510–514. [Google Scholar]
  24. Liu, Z.; Wang, J.; Liang, Z. CatGAN: Category-Aware Generative Adversarial Networks with Hierarchical Evolutionary Learning for Category Text Generation. arXiv 2019, arXiv:1911.06641. [Google Scholar] [CrossRef]
  25. Qurashi, A.W.; Holmes, V.; Johnson, A.P. Document Processing: Methods for Semantic Text Similarity Analysis. In Proceedings of the IEEE 2020 International Conference on INnovations in Intelligent SysTems and Applications (INISTA), Novi Sad, Serbia, 24–26 August 2020; pp. 1–6. [Google Scholar]
  26. Grandini, M.; Bagli, E.; Visani, G. Metrics for Multi-Class Classification: An Overview. arXiv 2020, arXiv:2008.05756. [Google Scholar]
  27. Schofield, A.; Thompson, L.; Mimno, D. Quantifying the Effects of Text Duplication on Semantic Models. In Proceedings of the 2017 Conference on Empirical Methods in Natural Language Processing, Copenhagen, Denmark, 7–11 September 2017; Association for Computational Linguistics: Copenhagen, Denmark, 2017; pp. 2737–2747. [Google Scholar]
  28. Lee, K.; Ippolito, D.; Nystrom, A.; Zhang, C.; Eck, D.; Callison-Burch, C.; Carlini, N. Deduplicating Training Data Makes Language Models Better. arXiv 2022, arXiv:2107.06499. [Google Scholar]
  29. Kandpal, N.; Wallace, E.; Raffel, C. Deduplicating Training Data Mitigates Privacy Risks in Language Models. arXiv 2022, arXiv:2202.06539. [Google Scholar]
Figure 1. Detailed schematic of the proposed approach for sentiment classification.
Applsci 14 00622 g001
Figure 2. The frequency distribution of the Coursera review dataset.
Applsci 14 00622 g002
Figure 3. Sentence-by-sentence text generation process.
Applsci 14 00622 g003
Figure 4. The frequency distribution of dataset: (a) original dataset after preprocessing and required synthetic data; (b) generated synthetic data.
Applsci 14 00622 g004
Figure 5. Novelty and diversity scores of all generated synthetic data.
Applsci 14 00622 g005
Figure 6. Evaluation of good-quality synthetic data.
Applsci 14 00622 g006
Figure 7. The frequency distribution of various datasets for sentiment classification.
Applsci 14 00622 g007
Figure 8. Improvement in accuracy and F1-score of proposed datasets compared to original dataset.
Applsci 14 00622 g008
Table 1. Examples of original input data and generated output data.
IndexInputOutput
1the discussion forums for this course was not quite helpful.the discussion forums for this course could have been more helpful.
2the discussion forums for this course was not quite helpful.the discussion forums for this course were unhelpful.
Table 2. The architectures of the deep-learning models used for sentiment classification.
ModelMain Layer: Unit/Filter, DropoutFully Connected Layer: Unit, Activation, DropoutOutput LayerHyperparameters: Optimizer, Learning Rate, Batch Size
RNNSimpleRNN: 256 (2 layers), 0.5256, ReLU, 0.5Dense(3, softmax)Adam, 0.0005, 32
CNNConv1D: 128, 128, 256, 0.5256, ReLU, 0.5Dense(3, softmax)Adam, 0.0005, 32
LSTMLSTM: 256 (2 layers), 0.5256, ReLU, 0.5Dense(3, softmax)Adam, 0.0005, 32
BiLSTMBiLSTM: 256 (2 layers), 0.5256, ReLU, 0.5Dense(3, softmax)Adam, 0.0005, 32
GRUGRU: 256 (2 layers), 0.5256, ReLU, 0.5Dense(3, softmax)Adam, 0.0005, 32
Table 3. The example of data generation process using sentence-by-sentence technique.
Original Input DataPromptGenerated Output Data
instructor doesn’t seem to be passionate about giving the lecturePlease generate a review sentence about a course that has a similar meaning to this review: “instructor doesn’t seem to be passionate about giving the lecture”. Keep the generated review under the given maximum token.The instructor appears to lack enthusiasm while delivering the class.
instructor is not clear and too fast!Please generate a review sentence about a course that has a similar meaning to this review: “instructor is not clear and too fast!”. Keep the generated review under the given maximum token.The instructor is confusing and moves too quickly!
it is very easy and unusefull course.Please generate a review sentence about a course that has a similar meaning to this review: “it is very easy and unusefull course.” Keep the generated review under the given maximum token.It is a straightforward yet unhelpful course.
Table 4. Duplication analysis among outputs.
SentimentThe Number of ReplicationsFrequency
Unique OutputsOverall
Duplication
Intra-
Duplication
Inter-
Duplication
Negative915,058863767311
Neutral1714,02910671042124
Table 5. Good- and bad-quality synthetic data.
SentimentCut-OffSimilar OutputsSimilar to
Inputs
AnomalyBadGoodTotal Output% Bad
Negative15710157215,34915,9213.59%
0.801558991165814,26315,92110.41%
0.751889961198613,93515,92112.47%
0.505147741522210,69915,92132.80%
Neutral17150071514,38115,0964.74%
0.801855700192513,17115,09612.75%
0.752343660240912,68715,09615.96%
0.5064414406485861115,09642.96%
Table 6. Sentiment classification result.
DatasetRNN (GloVe)CNN (GloVe)LSTM (GloVe)BiLSTM (GloVe)GRU (GloVe)
AccuracyF1-ScoreAccuracyF1-ScoreAccuracyF1-ScoreAccuracyF1-ScoreAccuracyF1-Score
Dataset-10060.10%56.61%60.77%60.18%60.64%60.38%63.54%60.73%62.18%60.13%
Dataset-8058.40%57.97%61.53%59.80%60.72%60.14%60.45%59.77%61.16%60.28%
Dataset-7558.48%57.37%59.64%60.13%64.08%61.65%61.16%60.00%63.24%62.24%
Dataset-5058.16%58.84%59.90%59.42%63.00%61.27%60.76%59.99%60.18%60.94%
Fine-tuning Dataset64.71%62.80%71.46%65.66%66.76%64.54%66.44%66.03%67.49%66.67%
Original Dataset33.33%30.49%54.92%54.31%54.33%54.50%53.62%54.40%55.90%54.44%
Disclaimer/Publisher’s Note: The statements, opinions and data contained in all publications are solely those of the individual author(s) and contributor(s) and not of MDPI and/or the editor(s). MDPI and/or the editor(s) disclaim responsibility for any injury to people or property resulting from any ideas, methods, instructions or products referred to in the content.

