Abstract
Brittle failure, or spalling, occurs around openings excavated in hard rock masses with high in situ stresses. It takes place due to the nucleation and growth of cracks around the excavation boundary, induced by the redistribution of stresses following the excavation. Modelling this failure process is a tough challenge. The hybrid finite-discrete element method (FDEM) can overcome the boundary between continuum and discontinuum, capturing emergent discontinuities associated with brittle fracturing processes. In this study, FDEM is applied using a commercial code to show its applicability to model brittle behaviour around deep underground excavations in the case of the Torino-Lyon Base tunnel in three different stress conditions. Except for the hydrostatic condition, cracking is triggered immediately after the excavation. Spalling occurring around the tunnel is quite extended; therefore, an accurately designed support must be installed to prevent blocks from falling from the tunnel boundary. The obtained results are aligned with previous results existing in the literature. However, in this case, a deeper spalling is caused by the shape change due to the gradual stress redistribution. Such a phenomenon underlines the importance of using a code able to identify crack propagation, opening, and the formation of loose blocks that progressively modify the tunnel contour.
1. Introduction
Brittle failure occurs around underground openings excavated in hard, high-strength rock masses (massive to moderately jointed) and subjected to high in situ stresses, usually at high depth. It occurs due to the creation, growth, and accumulation of new micro- and macro-cracks in the parietal areas parallel to the excavation boundary, induced by the redistribution of stresses following the excavation. Such a stress-driven process is called spalling [1]. Under specific conditions, cracks can lengthen conspicuously, forming flakes or unstable rock elements of different sizes and shapes. Consequently, these can fall from the roof and sidewalls or be projected into the excavation.
Seminal work was carried out by [2], who analysed borehole breakouts, i.e., the changes in borehole cross section that occur as fractures or spalling adjacent to the perimeter excavated in a highly stressed rock, in terms of stress redistribution, shape, and size, employing a boundary element technique for stress analysis. Typically, an elongation with a pointed shape is observed along the direction of the minimum principal stress perpendicular to the borehole axis due to the progressive spalling of thin slabs by extensile splitting subparallel to the free surface. Knowing the extent of the slabbing or spalling process is crucial for rock support design.
Significant advancements in understanding brittle failure were made thanks to the well-documented Mine-by experiment conducted in 1992 at the Underground Research Laboratory in Canada [3]. Such an experiment provided a unique opportunity to investigate the formation and characteristics of the Excavation Disturbed Zone (EDZ). A characteristic of stress-induced failure of tunnels in brittle rock is the notched-V shape of the failure region linked to tunnel face advance (Figure 1a) and the associated slabbing and spalling that initiate where tangential compressive stress is highest, in correspondence with the minor principal stress axis (Figure 1b). The tunnel retains its integrity once plane strain conditions are attained. Depending on the in situ state of stress and the confinement level at the excavation boundary, spalling and/or rock-bursting, with a sudden and violent projection of rock blocks (also at 7–10 m/s, according to [4]) into the excavation, can alternatively develop. Slabs can range in thickness from a few millimetres to tens of centimetres and, with large openings, can be several square metres in surface area [3,5]. Unlike at shallow depths, where discontinuities dominate in controlling failure, at high depths, the extent and depth of failure are a function not only of the fracture network but also of the ratio between the in situ stress magnitude and the rock mass strength, as well as of grain-scale geology. Indeed, [3] showed how the extent greatly diminishes in granodiorite compared to granite, and [6], based on several documented case histories, found an empirical linear relationship between the depth of spalling damage to tunnel diameter ratio df/a and the stress to strength ratio. The larger the stress magnitude, the greater the depth of spalling for a similar tunnel size. In [1], a decision tree is presented to assess the occurrence of spalling and the associated hazard. In [7], new techniques were developed to detect crack initiation and propagation thresholds, whereas in [8], guidance is given for estimating the in situ strength factor based on the UCS for different rock types and for different descriptive parameters.
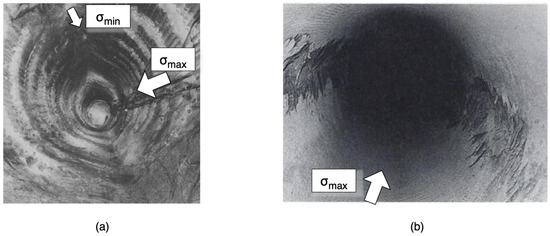
Figure 1.
(a) View of the completed Mine-by test tunnel with the clear V-shaped notch zones (modified from [3]); (b) spalling in the sidewall of a bored raise in massive, highly stressed rock (modified from [9]). Both cases show a stress anisotropy identified by the white arrows.
Ref. [4] defines a rockburst as a seismic event that causes violent and significant damage to a tunnel or a mine excavation. For civil tunnels, these translate into strain-burst, i.e., superficial spalling with forceful ejection, and/or buckling, i.e., outward expulsion of large slabs parallel to the opening surface [10]. A scale to evaluate susceptibility to rockburst was put forward by [11] based on correlations between strain energy density, brittleness (defined as the compressive-to-tensile strength ratio), and uniaxial compressive strength.
The spalling process tends to start very close to the tunnel face, where small rockfalls can occur before the full development of the failure zone. To support the rock, it is also suggested for very deep civil tunnels the use of yielding components for temporary or intermediate support before the final lining is installed, such as rockbolting and shotcrete [4]. Though they do not prevent rock failure from occurring, they can control it once it has started [9]. The early installation of stiff supports will result in overstressing and failure of the support itself.
After a brief review of the approaches available for modelling brittle failure and their limitations, this paper illustrates the concepts of the hybrid Finite-Discrete Element Method (FDEM) and applies a novel FDEM code commercially available to model rock spalling in deep tunnels. Such a method is able to capture crack propagation, opening, and the formation of loose blocks that progressively modify the tunnel contour. In particular, the case study refers to the Torino-Lyon base tunnel, which will be described hereafter. Results are finally compared to those previously obtained in the literature to show the applicability of the novel combined FDEM code to model brittle behaviour around underground excavations.
2. Materials and Methods
2.1. Fundamentals of Brittle Failure Numerical Modelling
Modelling rock mass behaviour presents several challenges; among these, the modelling of failure process, comprising nucleation, growth, and coalescence of microcracks, followed by strain localisation and macroscopic fracturing, is one of the toughest. Furthermore, the rock mass fabric, with the presence of pre-existing discontinuities such as joints, faults, bedding planes, etc., affects the failure process of intact rock in several ways.
A straightforward way to predict the depth/extent of brittle failure would be to perform an elastic stress analysis and compare the induced stresses with the rock mass strength. However, with this method, the actual failed zone is significantly underestimated, as well as with an elastic-perfectly plastic or an elastic-brittle model, as shown in [12]. Indeed, as described in [12,13], conventional approaches such as the linear Mohr-Coulomb (M-C) envelope or the non-linear Hoek and Brown (H&B) envelope, being shear-strength-based constitutive models, have limited ability to predict the depth/extent of brittle failure and to capture the behaviour of moderately jointed to massive rock masses where damage is the result of extensile fracturing. In these criteria, cohesive and frictional strengths are mobilised simultaneously. This is not the case in brittle failure, as frictional strength starts playing a role only when significant cohesion is lost [14]. Following this observation, [6] modified the conventional H&B criterion by proposing a brittle version with the H&B parameter m set to zero.
Later, Ref. [15] suggested a new constitutive model for brittle failure where the various strength components mobilise differently as a function of plastic strains (or damage), with a progressive cohesion loss due to tensile cracking and crack coalescence, followed by the mobilisation of frictional strength once the rock fragments can move relatively to each other in shear (CWFS, Cohesion Weakening Friction Strengthening). Ref. [12] showed that this model satisfactorily predicts the failed zone depth and shape around the Mine-by test tunnel mentioned above.
The CWFS approach was implemented in the widely used generalised Hoek and Brown criterion to numerically simulate brittle response in hard, massive rocks at great depths [16]. Thus, brittle failure can be well captured in continuum modelling by resorting to the so-called Damage Initiation Spalling Limit (DISL) approach. However, it was shown to be unable to distinguish areas with different damage intensities: the so-called Highly Damaged Zone (HDZ), where the material collapses, and the EDZ, where the material is fractured but does not collapse [13].
While revising empirical and numerical techniques to estimate spalling depth around underground openings, Ref. [17] noted, recalling [18], that continuum modelling is clearly an approximation to the discrete fracturing process associated with spalling damage. Hence, another possibility is to adopt the Discrete Element Method (DEM) by [19] to capture combined intact material fracturing and discontinuity failure. Such a method treats the material as an assembly of separate blocks or particles that can move, rotate, and detach from one another until new contacts are established during the simulation. Thanks to the bonding between discrete elements, DEM can be used to simulate the fracturing of brittle materials. The advantage of DEM is that the complex empirical constitutive criterion is replaced with simple contact logic [18].
One of the significant areas for improvement in DEM is that fracture initiation and growth are generally not directly modelled but are implicitly accounted for using elastoplastic material constitutive laws assigned to the rock blocks [20]. New discontinuities cannot grow through continuum blocks, thus making it impossible to simulate the fracturing of intact rock and losing the pivotal role of micro-heterogeneities in the spalling failure of massive and brittle rocks. Although the introduction of a randomly sized polygonal block pattern, such as the Voronoi tessellation (concept of the grain-based model introduced by [21]; for an example, see [22]), together with a constitutive law accounting for shear and tensile strength along the block interface or contacts can help to overcome this drawback, very long computational times are needed when a dense tessellation is used. Another DEM approach is represented by particle flow codes, which can simulate materials at a smaller scale by means of spherical particles [23].
Hybrid, combined finite-discrete element methods (FDEM) can overcome the traditional boundary between continuum and discontinuum methods by capturing emergent discontinuities associated with brittle fracturing processes, progressive damage, and failure processes in rock. The idea is to start with a continuum representation of the domain by finite elements and to progressively move to a discontinuum by the explicit nucleation and growth of fractures as the rock is strained. As stated by [24], FDEM can capture the anisotropic and inhomogeneous effects of natural jointing, being more realistic than methods relying on just continuum or discontinuum.
FDEM was first introduced in 1995 by Prof. Munjiza [25]. Still, it was as of 2008 that the original open-source code Y-2D was further extended by including several essential features for geomechanical applications (Y-Geo code, [20]; Irazu, [26]). The latter will be used in this paper. Ref. [27] illustrates how the FDEM code with a hydro-mechanical coupled formulation in 2D and 3D was parallelised in Irazu using general-purpose Graphics Processing Unit (GPU) computing to reduce execution times and run faster, more extensive, higher-resolution, and multi-physics simulations. In the following, the theoretical fundamentals will be briefly recalled [28] concerning the two-dimensional case.
Each intact body is discretised into three-noded, constant-strain triangular finite elements that interact with the neighbouring elements through a four-noded, strain-softening cohesive crack element (Figure 2). The equation of motion can be written as:
where M and C are mass and damping matrices, x is the vector of nodal displacements, fint is the vector of internal resisting forces, fext is the vector of externally applied loads, and fc, fh, and fr are the vectors of contact forces, fluid-pressure forces, and rock support forces, respectively. This equation is integrated step by step to determine nodal coordinates.
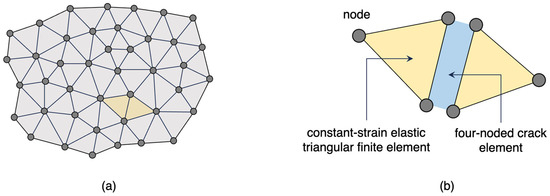
Figure 2.
(a) Example of discretisation of an intact body into finite elements; (b) zoom of two neighbouring finite elements together with the interface between them, the so-called cohesive crack element (modified by [28]).
Finite elements behave according to linear elasticity, with an isotropic or transversely isotropic constitutive relationship used to derive the stress tensor (and then, equivalent nodal forces) from the strain tensor. The calculated forces are used to solve Equation (1) over the next integration time step. Contacts between all overlapping pairs of elements are detected, and interaction forces are applied: repulsive forces in the normal direction and friction forces in the tangential direction.
Crack initiation and growth modelling is based on non-linear fracture mechanics (NLFM). When the material tensile strength starts being exceeded at the tip of a crack (Mode I failure, opening), non-linear behaviour comes into play by giving birth to a fracture process zone (FPZ), characterised by inter-locking and microcracking, albeit still able to transfer loads (Figure 3). A similar behaviour occurs in shear (Mode II failure, sliding). Four-noded cohesive crack elements (Figure 2) approximate the FPZ and its load-carrying capacity. They can yield and break under Mode I, II, or mixed I-II conditions. The fracture nucleation site does not need to be defined a priori.
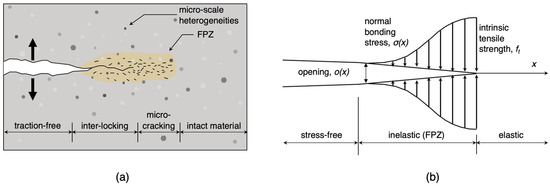
Figure 3.
(a) Schematic of Fracture Process Zone (FPZ) in brittle geomaterials (after Labuz et al. (1985); (b) theoretical FPZ model (modified by [28]).
As shown in Figure 4, showing the constitutive behaviour of a cohesive crack element, if the opening is smaller than a peak value op, the behaviour is elastic (Figure 4a); otherwise, tensile strength ft is reached and yielding starts with a strain-softening post-peak behaviour with a residual opening or governed by Mode I fracture energy GfI. The same goes for Mode II (Figure 4b). Usually, the dominant fracturing mode is the mixed one (Figure 4c).
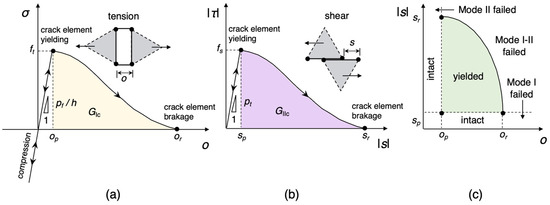
Figure 4.
Built-in FDEM fracture model in (a) Mode I, (b) Mode II, and (c) Mixed mode (modified from [28]; fs = shear strength, ft = tensile strength, GIc = Mode I fracture energy, GIIc = Mode II fracture energy, op = peak opening, or = residual opening, pf = fracture penalty, pt = tangential penalty, sp = peak slip, sr = residual slip, Mode I = opening mode, and Mode II = sliding mode).
Examples of the use of FDEM for modelling brittle failure can be found, to name some, in [29] with a research on the influence of loading rate and sample orientation in a Brazilian test simulation on a layered rock sample, in [30] that simulated biaxial loading on a homogeneous rock sample capturing failure localisation, fracture initiation and growth, increase of strength with confinement, brittle-ductile transition, in [17] that used an FDEM model with a micro-Discrete Fracture Network (μDFN) to account for micro-heterogeneities and reproduce spalling around the Mine-By tunnel, in [31] with reference to the study of failure mechanisms of anisotropic rock masses around unsupported deep tunnels and relative influencing factors. For a detailed review of discrete modelling techniques for rock mass fracturing processes, the interested reader can refer to [32].
2.2. Description of the Case Study
The case study considered in this paper is the Turin–Lyon tunnel, which will be part of a new railway line to connect the two cities. Such a line is an essential component of the Mediterranean corridor that will connect Algeciras, in Spain, with Budapest, in Hungary, and which, in turn, is part of the TEN-T project, the European Union’s high-speed rail network. The project will have to be suitable for transalpine freight traffic, as it is intended in particular to limit road traffic in these sensitive areas from an environmental point of view.
The connection between Lyon and Turin will extend for 270 km and will also have great relevance for the transport of passengers since it will connect the Italian and French high-speed networks, therefore reducing travel times between the two frontier regions, namely Piedmont and the Savoy.
The main infrastructure of the Turin–Lyon connection is the Mont Cenis Base Tunnel (Figure 5), which will allow crossing the Alps at the plain level by reducing time and cost for transporting goods and people. It is a twin-tube, single-track tunnel 57.5 km long (12.5 km in Italian territory and 45 km in French territory) with a slope of less than 0.12% and an overburden of more than 2000 m. The tunnel’s diameter is 10.4 m. The tunnel connects the international stations of Saint-Jean-de-Maurienne and Susa, points of connection to their respective national lines in France and Italy, and it is equipped with four access points, railway service areas, and ventilation shafts.
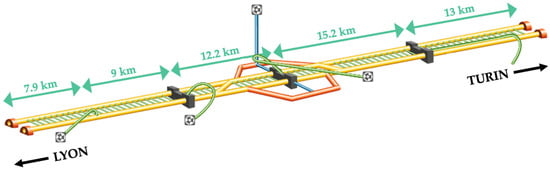
Figure 5.
Summary view of the Mont Cenis Base Tunnel (modified from [33]).
The Base Tunnel route passes through an extremely complex geological context in terms of lithological variety and geomechanical-hydrogeological aspects [33]. As seen in Figure 6, the formations crossed from west to east will start with the loose deposits of the Saint-Julien alluvial fan, followed by the flysch lithotypes of the Zone ultradauphinoise (External Alps). Once the Pennine Front is crossed, the Zone subriançonnaise, the Zone houillère, the Zone briançonnaise (Vanoise), the Zone piémontaise (Schistes lustrés), the Nappe des gypses, the Zone briançonnaise (Massif d’Ambin), and the Zone piémontaise (calcschists) will be intersected. These formations are increasingly deformed from west to east and are separated from each other by tectonised horizons [33]. These very complex geological conditions were recognised with more than 40 deep boreholes from the surface, about 500 boreholes while advancing, and 17 km of access adits and galleries.
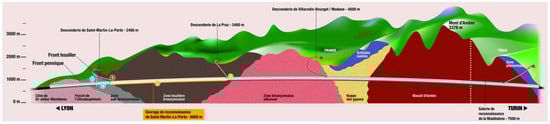
Figure 6.
Sketch of the longitudinal geological cross-section along the Mont Cenis Base Tunnel (modified from https://chantier.smp4.eu/travaux/, accessed on 3 January 2024).
In particular, the tunnel will reach its maximum depth (and temperatures) below the Ambin Massif. Here, the prevailing lithology features hard rock such as micaschists and gneiss, and water is present in small quantities [34,35]. Ref. [35] reports that in geomechanical terms, the rock mass varies between fair and good quality. Because of the high in situ stresses in this zone and the typical lithology described above, problems induced by brittle failure are to be expected. For this reason, a 2D cross-section of the tunnel at a depth of 2500 m in the Ambin Massif was selected for the numerical analyses described in this paper.
As described in [34], the stiffness and strength properties of the Ambin Massif micaschists and gneiss (Table 1) can be derived from the characterisation of the F2 tunnel excavated in the same massif along the Val Clarea for the Pont Ventoux-Susa Hydropower Project according to [36], as well as the in situ state of stress known at lower depths thanks to in situ testing. The Ambin Massif is known to be characterised by a stress state in the horizontal plane greater than the vertical stress. Y

Table 1.
Ambin Massif rock mass stiffness and strength parameters (Young’s modulus E, Poisson’s ratio ν, Geological Strength Index GSI, intact rock tensile strength σti, intact rock unconfined compressive strength σci, Hoek and Brown parameters for peak and residual condition mp, mr, sp, sr, peak and residual cohesion cp, cr, peak and residual friction angle Φp, Φr, density γ) [34,36].
Given such properties, numerical analyses are performed and described in the following in order to simulate deep, circular tunnel excavation in the Ambin Massif zone at a depth of 2500 m and to investigate the effectiveness of the FDEM in reproducing spalling behaviour. The results obtained are subsequently compared to previous results existing in the literature [34], where different approaches were employed.
2.3. Construction of the Numerical Model
The construction of the numerical model has to consider that fracture trajectories are restricted along the edges of finite elements and that larger elements will require more significant energy to fracture. For this reason, the mesh setup, beyond affecting the elastic response like any other Finite Element (FE) code, also influences strength response and fracture pattern and has to be designed appropriately with a sufficiently small size, especially in areas where high stress/strain gradients and fracturing are expected, and the adoption of unstructured grids with random triangulation. Given its simplicity, the model geometry and mesh were built directly into the Irazu User Interface, as shown in Figure 7. External boundaries are placed far enough from the area of interest (10 times the diameter) not to constrain the simulated displacement field. As depicted in Figure 7, the model considers a 10.4 m diameter circular tunnel at the centre of a 200 m × 200 m square domain; the model mesh comprises 60,678 elements and 30,420 nodes. The average size of the elements in the immediate surroundings of the excavation is set at 0.1 m, while outside, it is 5 m. Based on an automatic mesh quality check, the minimum angle, the edge length, and the aspect ratio fall into acceptable ranges. Since the model is two-dimensional, a plain strain condition is assumed. About boundary conditions, rollers with zero velocity in the vertical direction are assigned to the nodes belonging to the horizontal external boundaries; rollers with zero velocity in the horizontal direction are assigned to the nodes belonging to the vertical external boundaries; pins are applied to the four external vertices to prescribe zero velocity in all directions.
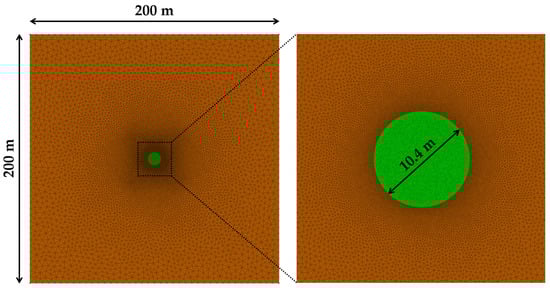
Figure 7.
Geometry of the FDEM model.
The domain is homogeneous. Elastic properties are assigned to the constant strain triangular finite elements pertaining to both the rock mass and the tunnel core to be excavated (see Table 1, considering a unit viscous damping). Instead, strength properties and penalty values are assigned to the cohesive crack elements placed between all finite elements throughout the model. The values pertaining to these properties are also derived from [34] and are summarised in Table 2.
Table 2.
Strength properties and penalty values assigned to the cohesive crack elements in the numerical model.
Based on the above-mentioned observation of an anisotropic in situ state of stress, the domain is subjected to a uniform pre-excavation stress field with a horizontal stress higher than the vertical one. The in situ state of stress is based on the model condition described in [34], by considering the vertical component σv equal to 66.4 MPa. The calculation then examines three cases with k0 equal to 1, 1.5, and 2. The different initial in situ stress conditions applied are shown in Table 3, with reference to the three independent values of Cauchy’s stress tensor in a 2D xy system of reference σx, σy, and σxy (the latter is null). Since the tunnel is deep, gravitational gradients are neglected. The calculation is carried out, enabling the absorbing boundary condition to speed up the convergence of the in situ stage. Moreover, the gravity option is not enabled, so the displacements shown refer only to the effect due to the spalling.
Table 3.
Initial in situ stress conditions adopted for the different cases considered.
The time step size selected for the equation of motion integration is 1 × 10⁻⁷ s, and the total number of time steps is 600,000. The output frequency of results is set at 20,000 time steps (30 outputs). First, an FE analysis is run where crack elements are not generated, exactly as in a FE model. After time-stepping until elastic equilibrium, the initial state of stress is applied. The nodal coordinates calculated by the FEM solver (deformed mesh) are input for the following FDEM simulation run. The number of steps selected for the FE simulation was successfully verified by observing nodal velocities, i.e., to check whether equilibrium had been reached.
Tunnel excavation is simulated by using a preliminary core replacement procedure. Therefore, the initial Young’s modulus of the tunnel core material was progressively softened by two orders of magnitude over 75,000 time steps, from time step 25,000 to time step 100,000, in a linear way. This was carried out to mimic the gradual 3D excavation process and the progressive advancement of the tunnel face. Indeed, the sudden removal of the core material could result in dynamic artefacts and unrealistic fractures. Then, the inner core elements are removed by setting them to “excavated”, i.e., the corresponding triangular FEs are instantaneously removed from the simulation loop, and the state of the surrounding crack elements is set to “broken”. The models describing the three cases A, B, and C are simulated, considering no lining installed and examining the possibility of installing a simplified lining around the opening. This stage consists of inserting a 400-millimetre-thick layer of concrete in contact with the contour of the tunnel. The layer is made of an elastic material with Young’s modulus equal to 30 GPa, which is installed just one time step after the complete excavation, deriving from the above-mentioned core replacement procedure. This methodology represents a simplification, as the concrete is installed immediately after the simulated core excavation; therefore, the deformations are minimal, whereas the stresses on the lining are very high. In this case, the results are helpful in simulating and identifying crack propagation in the presence of a hypothetical reinforcement intervention.
3. Results
The results obtained after running the models described in Section 2 will be hereby presented. Please note that compressive stresses are negative. In particular, the interest is in the possible spalling phenomenon occurring during the tunnel excavation. Figure 8 shows the initial principal maximum stress configuration around the excavation at the instant in which the core is removed at time step 100,000 (the initial time step with the tunnel completely excavated, thus reproducing the face at the instant in which the Young’s modulus of the core is set to zero), while Figure 9, Figure 10 and Figure 11 exhibit the evolution of the crack propagation due to the stress-induced damage, starting from the same time step to the last computed time step 600,000.
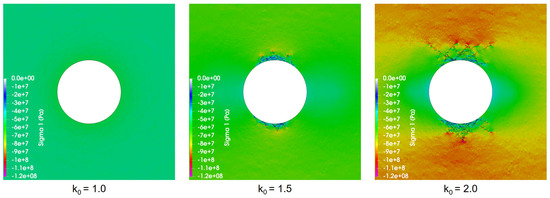
Figure 8.
Principal maximum stress around the excavation at the instant of the core removal.
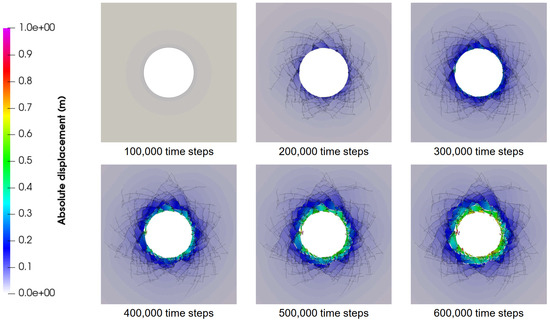
Figure 9.
Simulated evolution of displacement contour and fracture pattern for k0 = 1.0 (video provided in the Supplementary Materials).
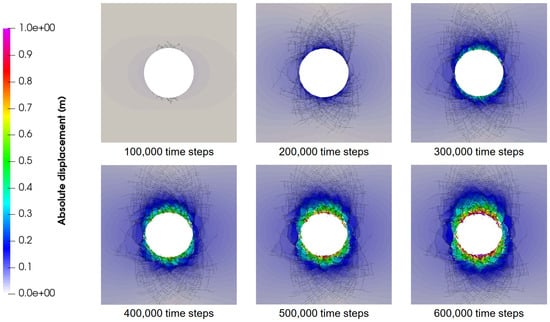
Figure 10.
Simulated evolution of displacement contour and fracture pattern for k0 = 1.5 (video provided in the Supplementary Materials).
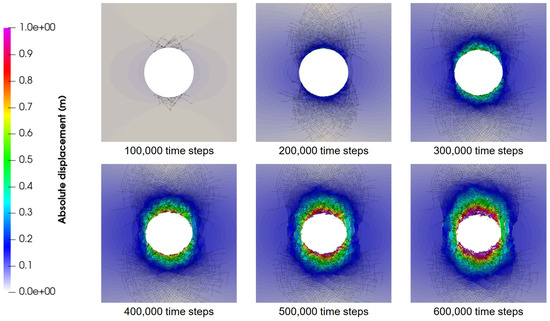
Figure 11.
Simulated evolution of displacement contour and fracture pattern for k0 = 2.0 (video provided in the Supplementary Materials).
Figure 8 underlines the presence of high in situ stress, as the cracking, except for the hydrostatic condition, is triggered immediately after the excavation. Regarding Figure 9, Figure 10 and Figure 11, at the last time step 600,000, spalling occurring around the tunnel is quite extended already with the lowest in situ stress (k0 = 1). This evidence points out the necessity of considering a support to be installed to prevent the fall of blocks from the contour of the cavity. Considering the conditions with k0 = 1.5 and k0 = 2, the extension of the spalling phenomenon increases, as expected, in the crown and the invert of the tunnel, as in the remaining parts the tangential stress σθ is not increasing. The results also reveal the need to consider enough time steps to capture crack propagation and show the full depth of the unstable blocks.
Regarding the simulation including the simplified lining layer, the results are presented in Figure 12. In this case, there is evidence of the contribution of the reinforcement around the opening, which ideally minimises the deformations occurring in the contours. On the other hand, the same picture highlights the price of such a contribution in terms of stress applied: the maximum compressive stress induced in the elastic lining ranges from around 190 MPa for the hydrostatic in situ stress case to 340 MPa with k0 = 2.0. These values represent a theoretical threshold that cannot be reached with the usual technologies (a typical stiff concrete support can hold some tens of MPa in compression). Thus, in this case, it appears to be more realistic to apply a different kind of support (for example, bolting and shotcreting), which can allow enough relaxation to the rock mass to reduce the stress applied to the support itself.
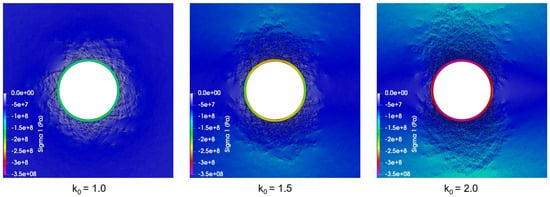
Figure 12.
Principal maximum stress in the lining after the tunnel excavation.
4. Discussion
In this chapter, the results described in Section 3 are compared with previous results existing in the literature for the same case study. Such results are illustrated in detail in terms of the plastic or fractured zone developed around the tunnel in [34]. The comparable results pertain only to the case of hydrostatic in situ stress conditions. The paper refers to the use of three different methods:
- the Damage Initiation-Spalling Limit (DISL) approach [16], which is a composite envelope describing different rock behaviour depending on the level of confinement,
- the Cohesion Weakening and Frictional Strengthening (CWFS) approach [12], which assumes that cohesive and frictional resistances are not mobilised at the same time and
- the FDEM method, adopting the Y-Geo code [20].
The comparison can be seen in Figure 13: the picture referred to the present study shows as background colours the velocity magnitude of the elements. All numerical results reproduce spalling behaviour in a qualitatively comparable way, as the fractured (for the FDEM methods) or yielded (for the continuum FEM and FDM methods) area develops in all cases uniformly around the cavity. Beyond the shape, the spalling depth is also rather similar and is included between 2.5 and 5.2 m for the current study. The higher values refer to elements with lower velocity that may be considered partially detached from the surrounding rock mass.
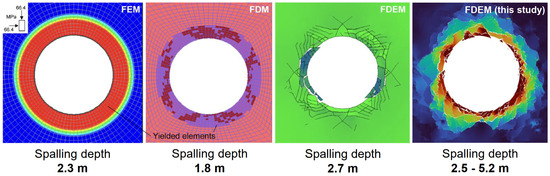
Figure 13.
Comparison of previous results from [34] with the FDEM results of the current study (hydrostatic conditions).
It has to be noted that, compared to a continuum model, where plane-strain conditions effectively simulate deformations around a long tunnel, 2D FDEM models represent the crack growth only in the plane considered and might slightly differ from the results of a 3D model because it depends on the fracturing which is better captured in 3D. However, in this case, the rock mass is highly massive and 2D models are therefore suitable to effectively reproduce fracturing.
5. Conclusions
The application of this novel FDEM code allows a more precise and suitable prediction of the spalling and, in general, any stress-induced damage around deep underground openings. This is due to the fact that brittle failure occurs mainly due to crack propagation driven by intense in situ stress, and it is mostly a dynamic phenomenon. Moreover, the fact that the geometry in the FDEM is changing due to the crack opening and the formation of loose blocks allows a redistribution of the stress according to the evolving shape of the excavations. These evolutions, as evident from the results obtained by the models pertaining to this case study, underlined the necessity of an accurate design of the support applied to the tunnels. This includes the use of supports such as bolts and shotcrete in order to reduce the compression that might occur within a concrete lining. Indeed, the lining considered in the current study was simply elastic and could sustain unrealistically high stress states. The results obtained in hydrostatic conditions are aligned with those obtained from other methods. In this case, the results show a deeper spalling caused by the shape change due to the gradual stress redistribution. Such a phenomenon underlines the importance of using a code able to identify crack propagation, which progressively modifies the tunnel contour. The parameters used in the study come from past laboratory experiments and should be appropriately back-analysed once in situ evidence from the tunnel excavation is available.
Supplementary Materials
The following supporting information can be downloaded at: https://www.mdpi.com/article/10.3390/app14020591/s1. Video S1: Simulated evolution of displacement contour and fracture pattern for k0 = 1.0. Video S2: Simulated evolution of displacement contour and fracture pattern for k0 = 1.5. Video S3: Simulated evolution of displacement contour and fracture pattern for k0 = 2.0.
Author Contributions
Conceptualization, D.M. and A.I.; methodology, D.M. and A.I.; software, D.M.; formal analysis, D.M. and A.I.; data curation, D.M.; writing—original draft preparation, A.I.; writing—review and editing, D.M. All authors have read and agreed to the published version of the manuscript.
Funding
This research received no external funding.
Institutional Review Board Statement
Not applicable.
Informed Consent Statement
Not applicable.
Data Availability Statement
The raw data supporting the conclusions of this article will be made available by the authors on request.
Conflicts of Interest
The authors declare no conflicts of interest.
References
- Martin, C.D.; Kaiser, P.K.; Christiansson, R. Stress, instability and design of underground excavations. Int. J. Rock Mech. Min. Sci. 2003, 40, 1027–1047. [Google Scholar] [CrossRef]
- Zheng, Z.; Kemeny, J.; Cook, N.G.W. Analysis of borehole breakouts. J. Geophys. Res. 1989, 94, 7171–7182. [Google Scholar] [CrossRef]
- Martin, C.D.; Read, R.S.; Martino, J.B. Observation of brittle failure around a circular test tunnel. Int. J. Rock Mech. Min. Sci. 1997, 34, 1065–1073. [Google Scholar] [CrossRef]
- Ortlepp, W.D. The behaviour of tunnels at great depth under large static and dynamic pressures. Tunn. Undergr. Space Technol. 2001, 16, 41–48. [Google Scholar] [CrossRef]
- Ortlepp, W.D. Rock Fracture and Rockbursts—An Illustrative Study; Monograph Series M9, South African Institute of Mining and Metallurgy: Johannesburg, South Africa, 1997. [Google Scholar]
- Martin, C.D.; Kaiser, P.K.; McCreath, D.R. Hoek–Brown parameters for predicting the depth of brittle failure around tunnels. Can. Geotech. J. 1999, 36, 136–151. [Google Scholar] [CrossRef]
- Eberhardt, E.; Stead, D.; Stimpson, B.; Read, R.S. Identifying crack initiation and propagation thresholds in brittle rock. Can. Geotech. J. 1998, 35, 222–233. [Google Scholar] [CrossRef]
- Diederichs, M. Damage initiation and propagation in hard rock during tunnelling and the influence of near-face stress rotation. Int. J. Rock Mech. Min. Sci. 2004, 41, 785–812. [Google Scholar] [CrossRef]
- Hoek, E.; Kaiser, P.K.; Bawden, W.F. Support of Underground Excavations in Hard Rock, 1st ed.; CRC Press: London, UK, 2000; pp. 1–228. [Google Scholar]
- Ortlepp, W.D.; Stacey, T.R. Rockburst mechanisms in tunnels and shafts. Tunn. Undergr. Space Technol. 1994, 9, 59–65. [Google Scholar] [CrossRef]
- Lee, S.M.; Park, B.S.; Lee, S.W. Analysis of rockbursts that have occurred in a waterway tunnel in Korea. Int. J. Rock Mech. Min. Sci. 2004, 41, 911–916. [Google Scholar] [CrossRef]
- Hajiabdolmajid, V.; Kaiser, P.; Martin, C.D. Modelling brittle failure of rock. Int. J. Rock Mech. 2002, 39, 731–741. [Google Scholar] [CrossRef]
- Vlachopoulos, N.; Vazaios, I. The Numerical Simulation of Hard Rocks for Tunnelling Purposes at Great Depths: A Comparison between the Hybrid FDEM Method and Continuous Techniques. Adv. Civ. Eng. 2018, 2018, 3868716. [Google Scholar] [CrossRef]
- Martin, C.D.; Chandler, N.A. The progressive fracture of Lac du Bonnet granite. Int. J. Rock Mech. Min. Sci. Geomech. Abstr. 1994, 31, 643–659. [Google Scholar] [CrossRef]
- Hajiabdolmajid, V.R. Mobilization of Strength in Brittle Failure of Rock. Ph.D. Thesis, Department of Mining Engineering, Queen’s University, Kingston, ON, Canada, 2001. [Google Scholar]
- Diederichs, M. Mechanistic interpretation and practical application of damage and spalling prediction criteria for deep tunneling. Can. Geotech. J. 2007, 44, 1082–1116. [Google Scholar] [CrossRef]
- Hamdi, P.; Stead, D.; Elmo, D. A Review of the Application of Numerical Modelling in the Prediction of Depth of Spalling Damage around Underground Openings. In Proceedings of the 51st U.S. Rock Mechanics/Geomechanics Symposium, San Francisco, CA, USA, 25–28 June 2017. [Google Scholar]
- Martin, D. The impact of brittle behaviour of rocks on tunnel excavation design. In Rock Engineering and Rock Mechanics: Structures in and on Rock Masses; Alejano, R., Perucho, Á., Olalla, C., Jiménez, R., Eds.; CRC Press: London, UK, 2014; pp. 51–62. [Google Scholar]
- Cundall, P.A.; Hart, R.D. Numerical modelling of discontinua. Eng. Comput. 1992, 9, 101–113. [Google Scholar] [CrossRef]
- Mahabadi, O.K.; Lisjak, A.; Munjiza, A.; Grasselli, G. Y-Geo: New Combined Finite-Discrete Element Numerical Code for Geomechanical Applications. Int. J. Geomech. 2012, 12, 676–688. [Google Scholar] [CrossRef]
- Lan, H.; Martin, C.D.; Hu, B. Effect of heterogeneity of brittle rock on micromechanical extensile behavior during compression loading. J. Geophys. Res. 2010, 115, B01202. [Google Scholar] [CrossRef]
- Insana, A.; Elmo, D.; Barla, M. Multi scale numerical modelling related to hydrofracking for deep geothermal energy exploitation. Procedia Eng. 2016, 158, 314–319. [Google Scholar] [CrossRef]
- Wang, Z.; Böhlke, T.; Zhang, W.; Gu, D. A novel random angular bend (RAB) algorithm and DEM modeling of thermal cracking responses of sandstone. Geomech. Energy Environ. 2022, 32, 100335. [Google Scholar] [CrossRef]
- Elmo, D.; Stead, D. An Integrated Numerical Modelling–Discrete Fracture Network Approach Applied to the Characterisation of Rock Mass Strength of Naturally Fractured Pillars. Rock Mech. Rock Eng. 2010, 43, 3–19. [Google Scholar] [CrossRef]
- Munjiza, A.; Owen, D.R.J.; Bicanic, N. A combined finite-discrete element method in transient dynamics of fracturing solids. Eng. Comput. 1995, 12, 145–174. [Google Scholar] [CrossRef]
- Mahabadi, O.K.; Lisjak, A.; He, L.; Tatone, B.S.A.; Kaifosh, P.; Grasselli, G. Development of a new fully-parallel finite-discrete element code: Irazu. In Proceedings of the 50th U.S. Rock Mechanics/Geomechanics Symposium 2016, Houston, TX, USA, 26–29 June 2016; Volume 4, pp. 2695–2703. [Google Scholar]
- Lisjak, A.; Mahabadi, O.K.; He, L.; Tatone, B.S.A.; Kaifosh, P.; Haque, S.A.; Grasselli, G. Acceleration of a 2D/3D finite-discrete element code for geomechanical simulations using General Purpose GPU computing. Comput. Geotech. 2018, 100, 84–96. [Google Scholar] [CrossRef]
- Geomechanica Inc. Irazu 2D Geomechanical Simulation Software, V. 6.1.; Theory Manual; Geomechanica Inc.: Toronto, ON, Canada, 2023. [Google Scholar]
- Mahabadi, O.K.; Grasselli, G.; Munjiza, A. Numerical modelling of a Brazilian Disc test of layered rocks using the combined finite-discrete element method. In Proceedings of the 3rd Canada-US (CANUS) Rock Mechanics Symposium (RockEng09), Toronto, ON, Canada, 9–15 May 2009. [Google Scholar]
- Mahabadi, O.K.; Lisjak, A.; Grasselli, G.; Lukas, T.; Munjiza, A. Numerical modelling of a triaxial test of homogeneous rocks using the combined finite-discrete element method. In Proceedings of the European Rock Mechanics Symposium EUROCK 2010, EPFL, Lausanne, Switzerland, 15–18 June 2010. [Google Scholar]
- Deng, P.; Liu, Q.; Huang, X.; Pan, Y.; Wu, J. FDEM numerical modelling of failure mechanism of anisotropic rock masses around deep tunnels. Comput. Geotech. 2022, 142, 104535. [Google Scholar] [CrossRef]
- Lisjak, A.; Grasselli, G. A review of discrete modeling techniques for fracturing processes in discontinuous rock masses. J. Rock Mech. Geotech. Eng. 2014, 6, 301–314. [Google Scholar] [CrossRef]
- Senemaud, J.; Serrano, B.; Salot, C.; Parisi, M.E.; Brino, L. Contribution of twenty years of exploratory work in the complex carboniferous formation of the montcenis base tunnel. In Proceedings of the ITA-AITES World Tunnel Congress 2023 (WTC 2023), Athens, Greece, 12–18 May 2023. [Google Scholar]
- Barla, M.; Antolini, F. Combined Finite-Discrete numerical modeling of rock spalling in tunnels. In Proceedings of the 14th International Conference of the International Association for Computer Methods and Advances in Geomechanics, Kyoto, Japan, 21–24 September 2014. [Google Scholar]
- Parisi, M.E.; Farinetti, A.; Brino, L. Measurement of massif temperatures through the Maddalena exploration tunnel. In Proceedings of the ITA-AITES World Tunnel Congress 2018 (WTC 2018), Dubai, United Arab Emirates, 21–26 April 2018. [Google Scholar]
- Barla, G.; Barla, M. Continuum and discontinuum modelling in tunnel engineering. Rud. Geol. Naft. Zb. 2000, 12, 45–57. [Google Scholar]
Disclaimer/Publisher’s Note: The statements, opinions and data contained in all publications are solely those of the individual author(s) and contributor(s) and not of MDPI and/or the editor(s). MDPI and/or the editor(s) disclaim responsibility for any injury to people or property resulting from any ideas, methods, instructions or products referred to in the content. |
© 2024 by the authors. Licensee MDPI, Basel, Switzerland. This article is an open access article distributed under the terms and conditions of the Creative Commons Attribution (CC BY) license (https://creativecommons.org/licenses/by/4.0/).