
Numerical Simulation of Droplet Dispersion and Passenger Infection Risk Assessment in a Subway Carriage

Abstract
1. Introduction
2. Methodology
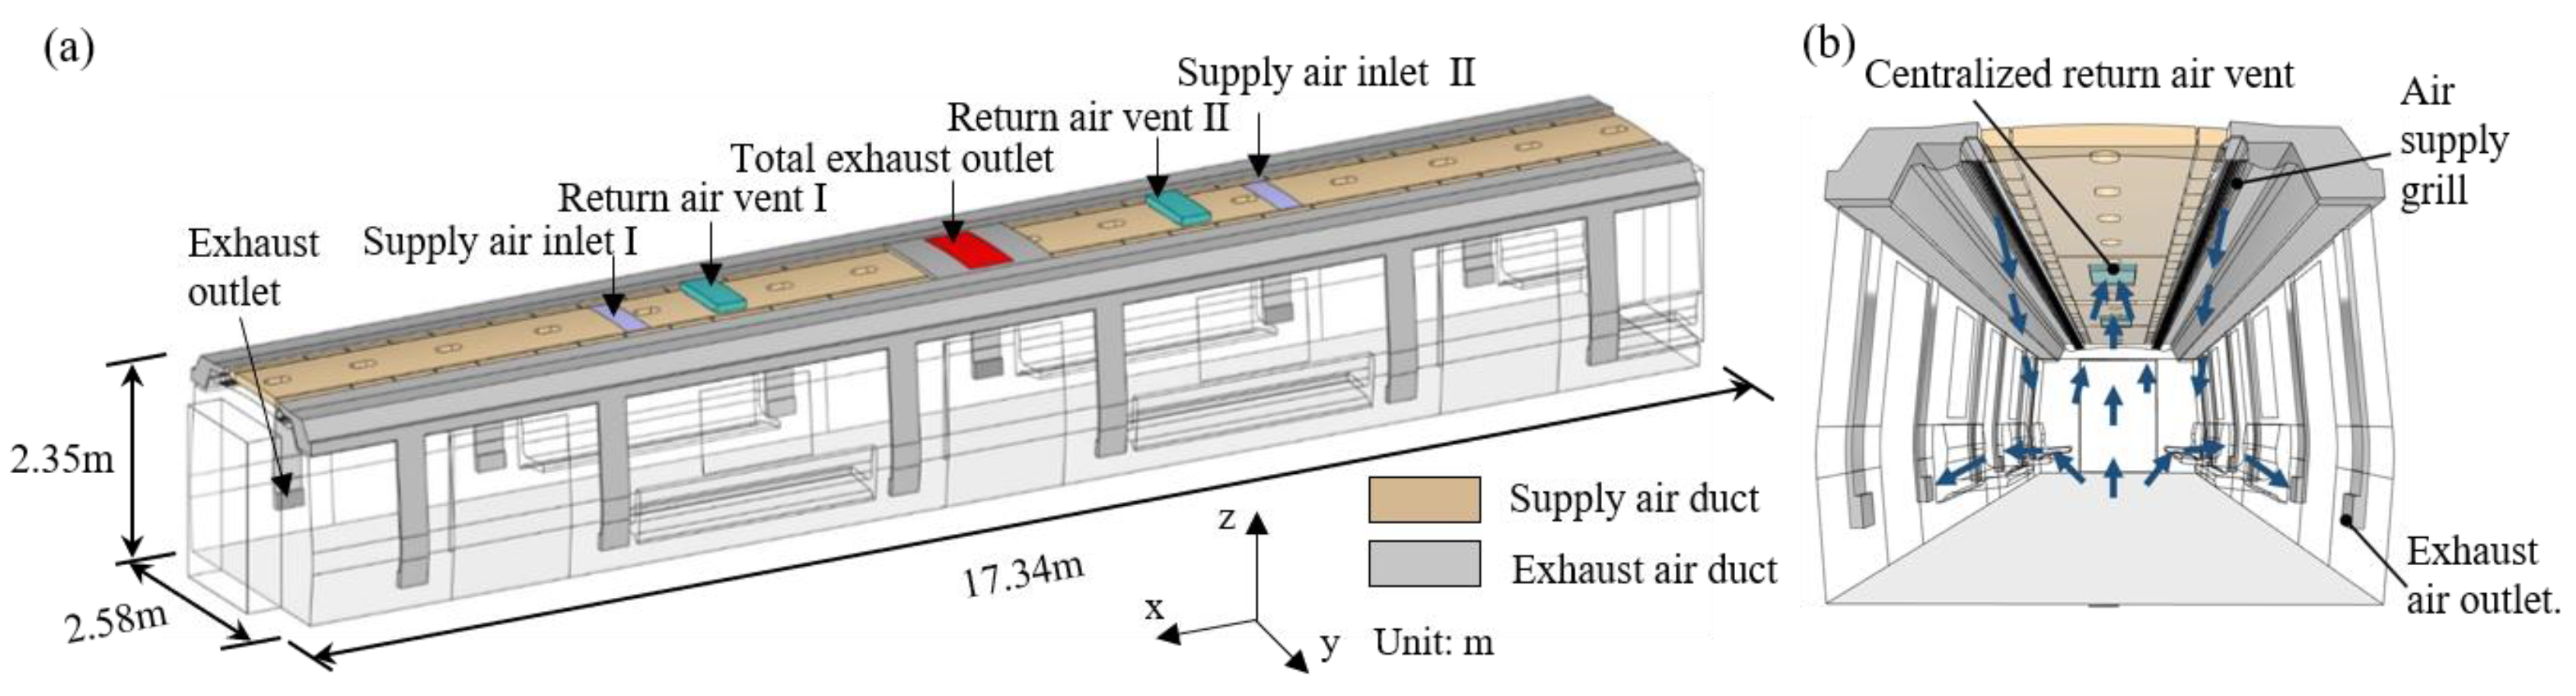
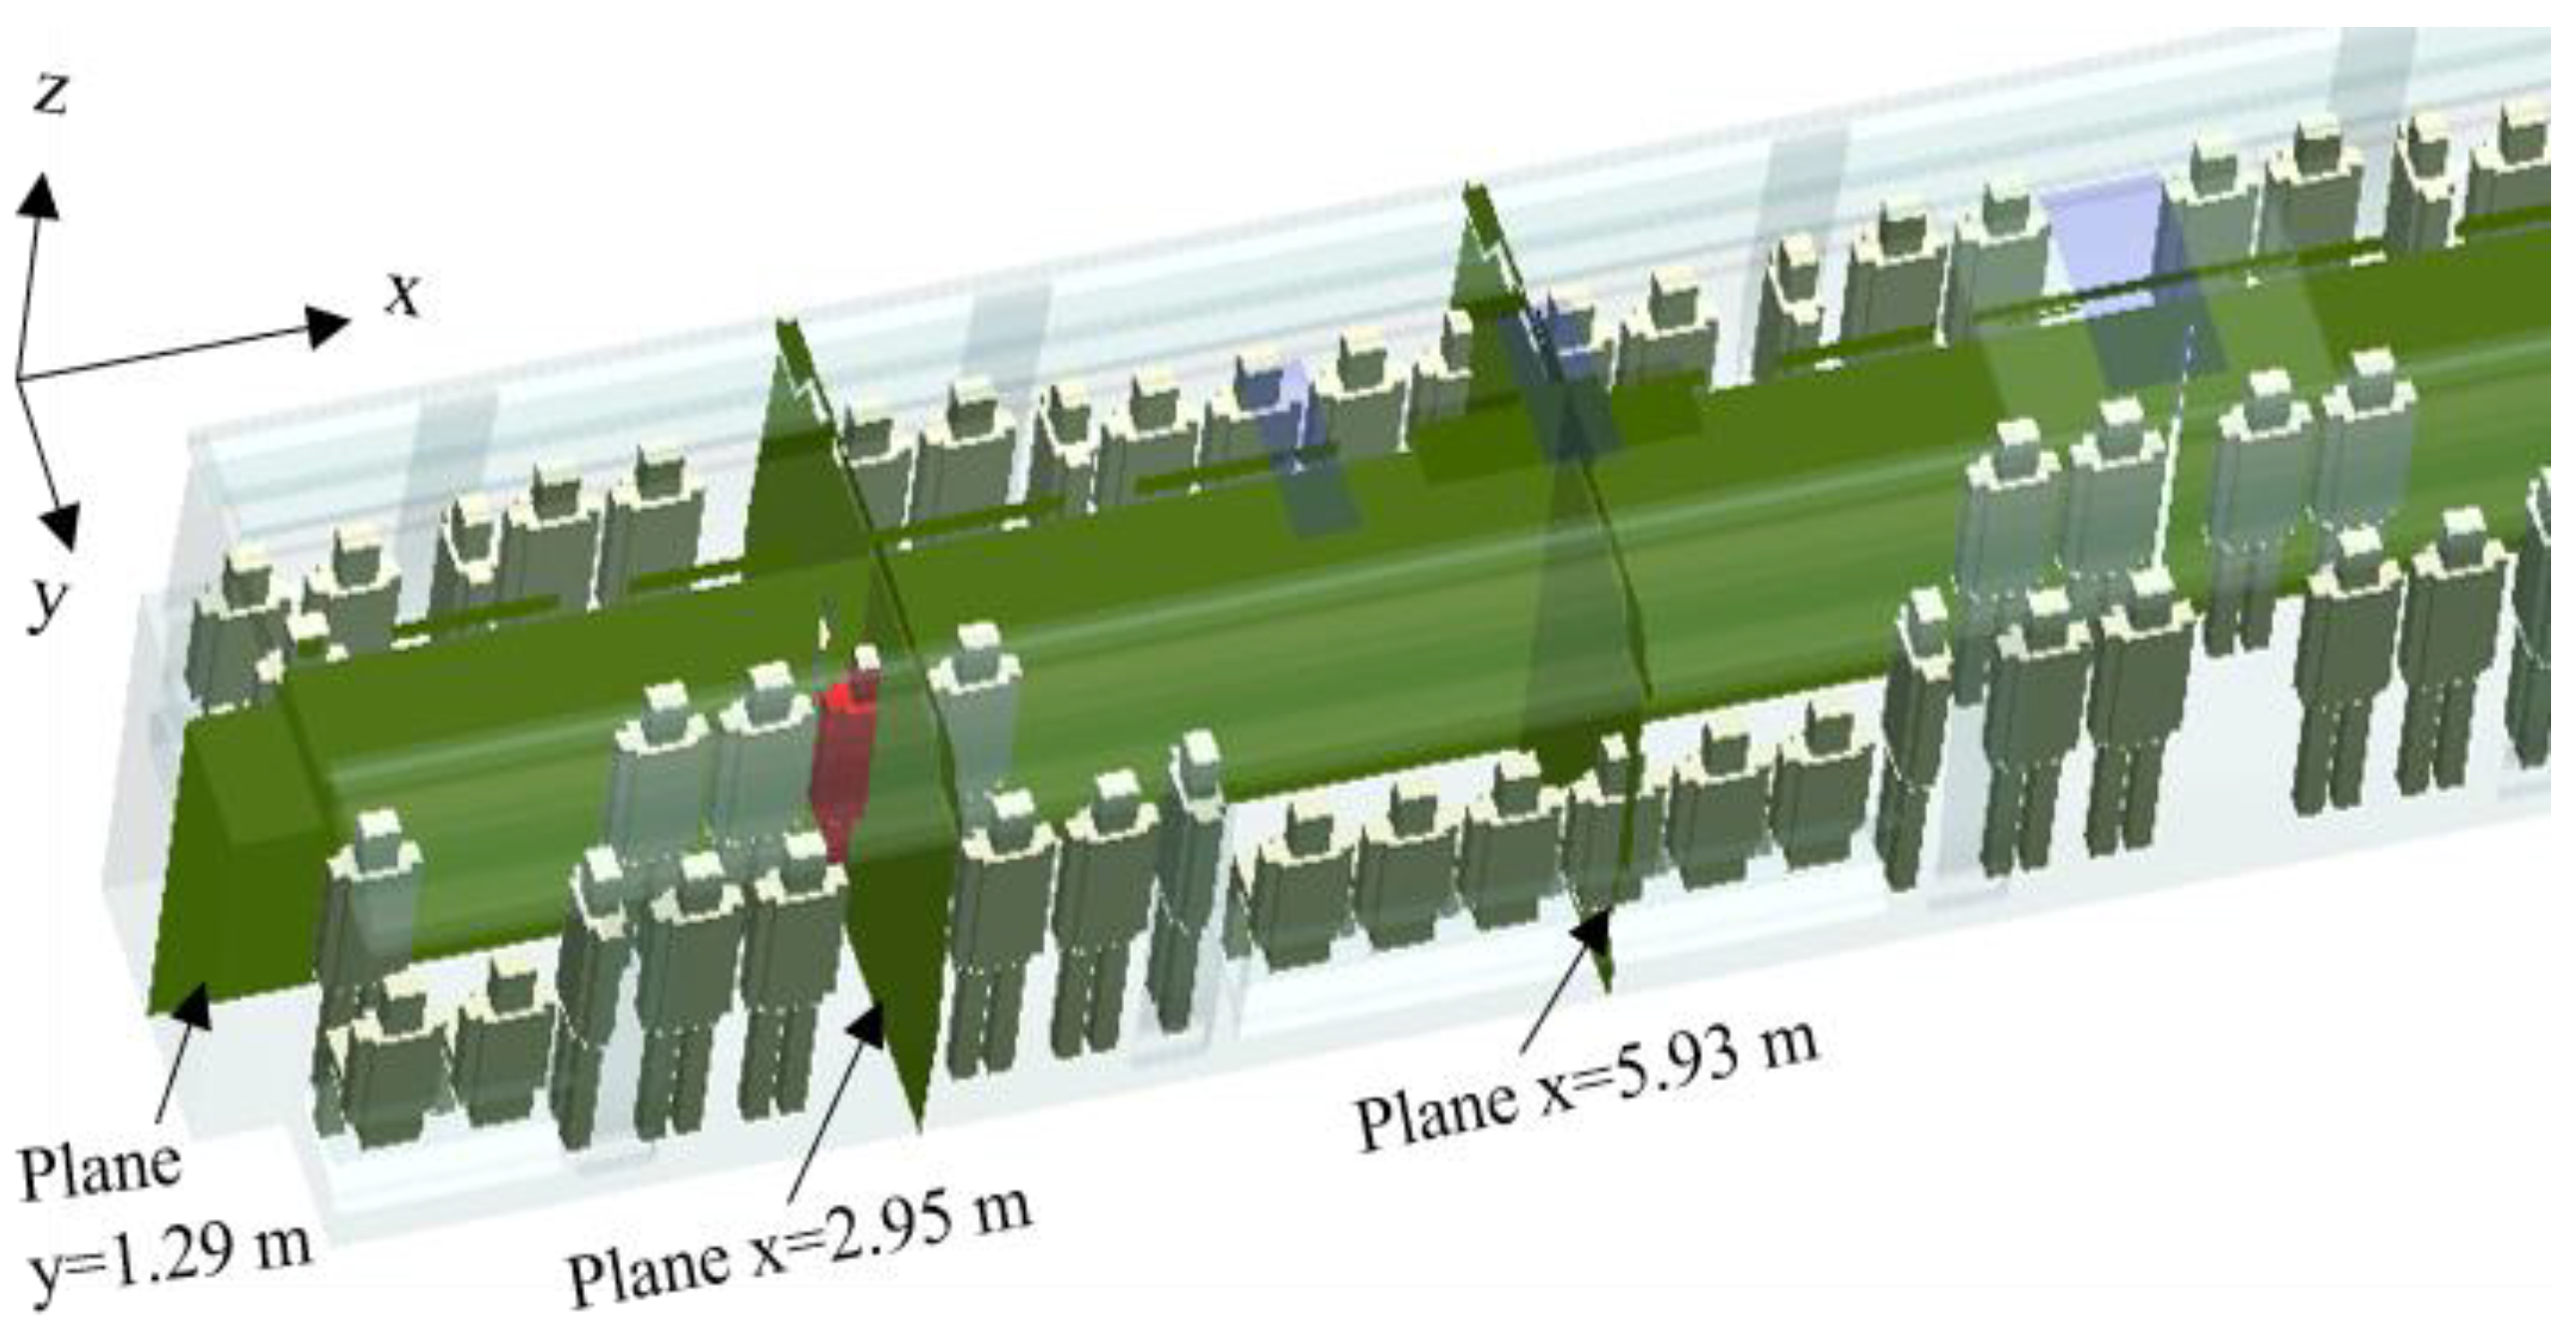
2.1. Physical Model
2.2. Dose–Response Model
2.3. Simulation Setup
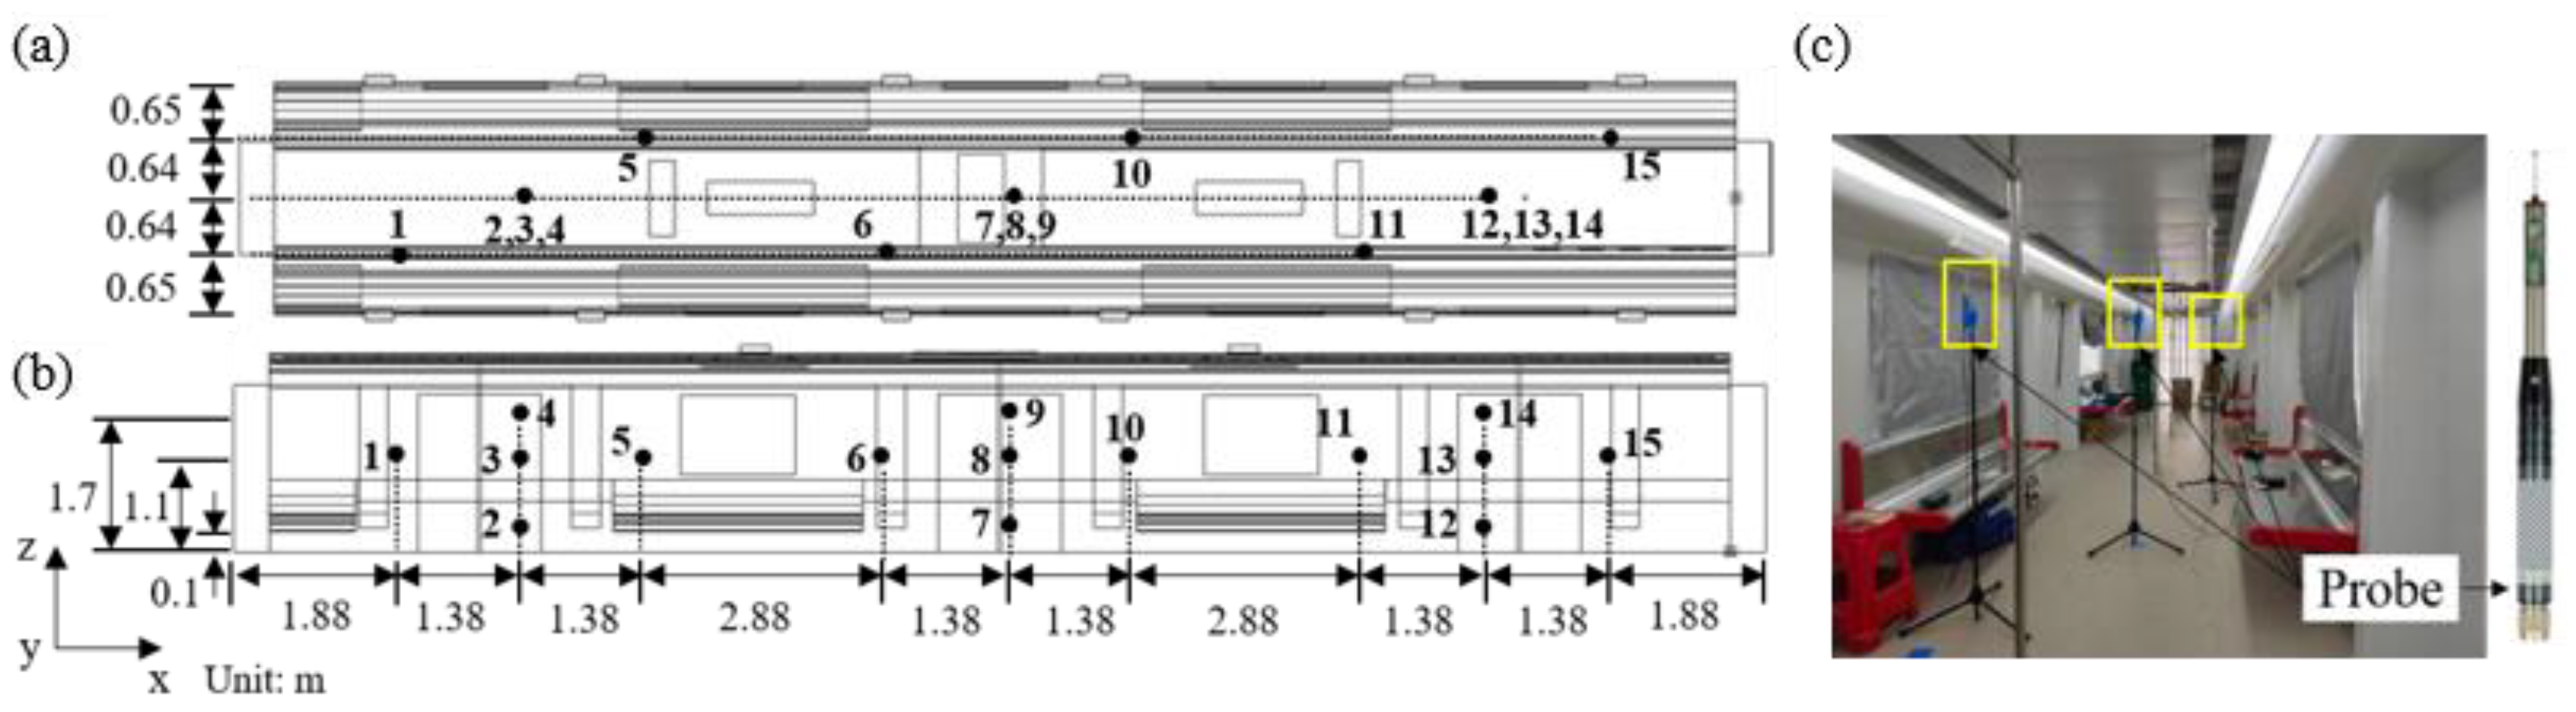
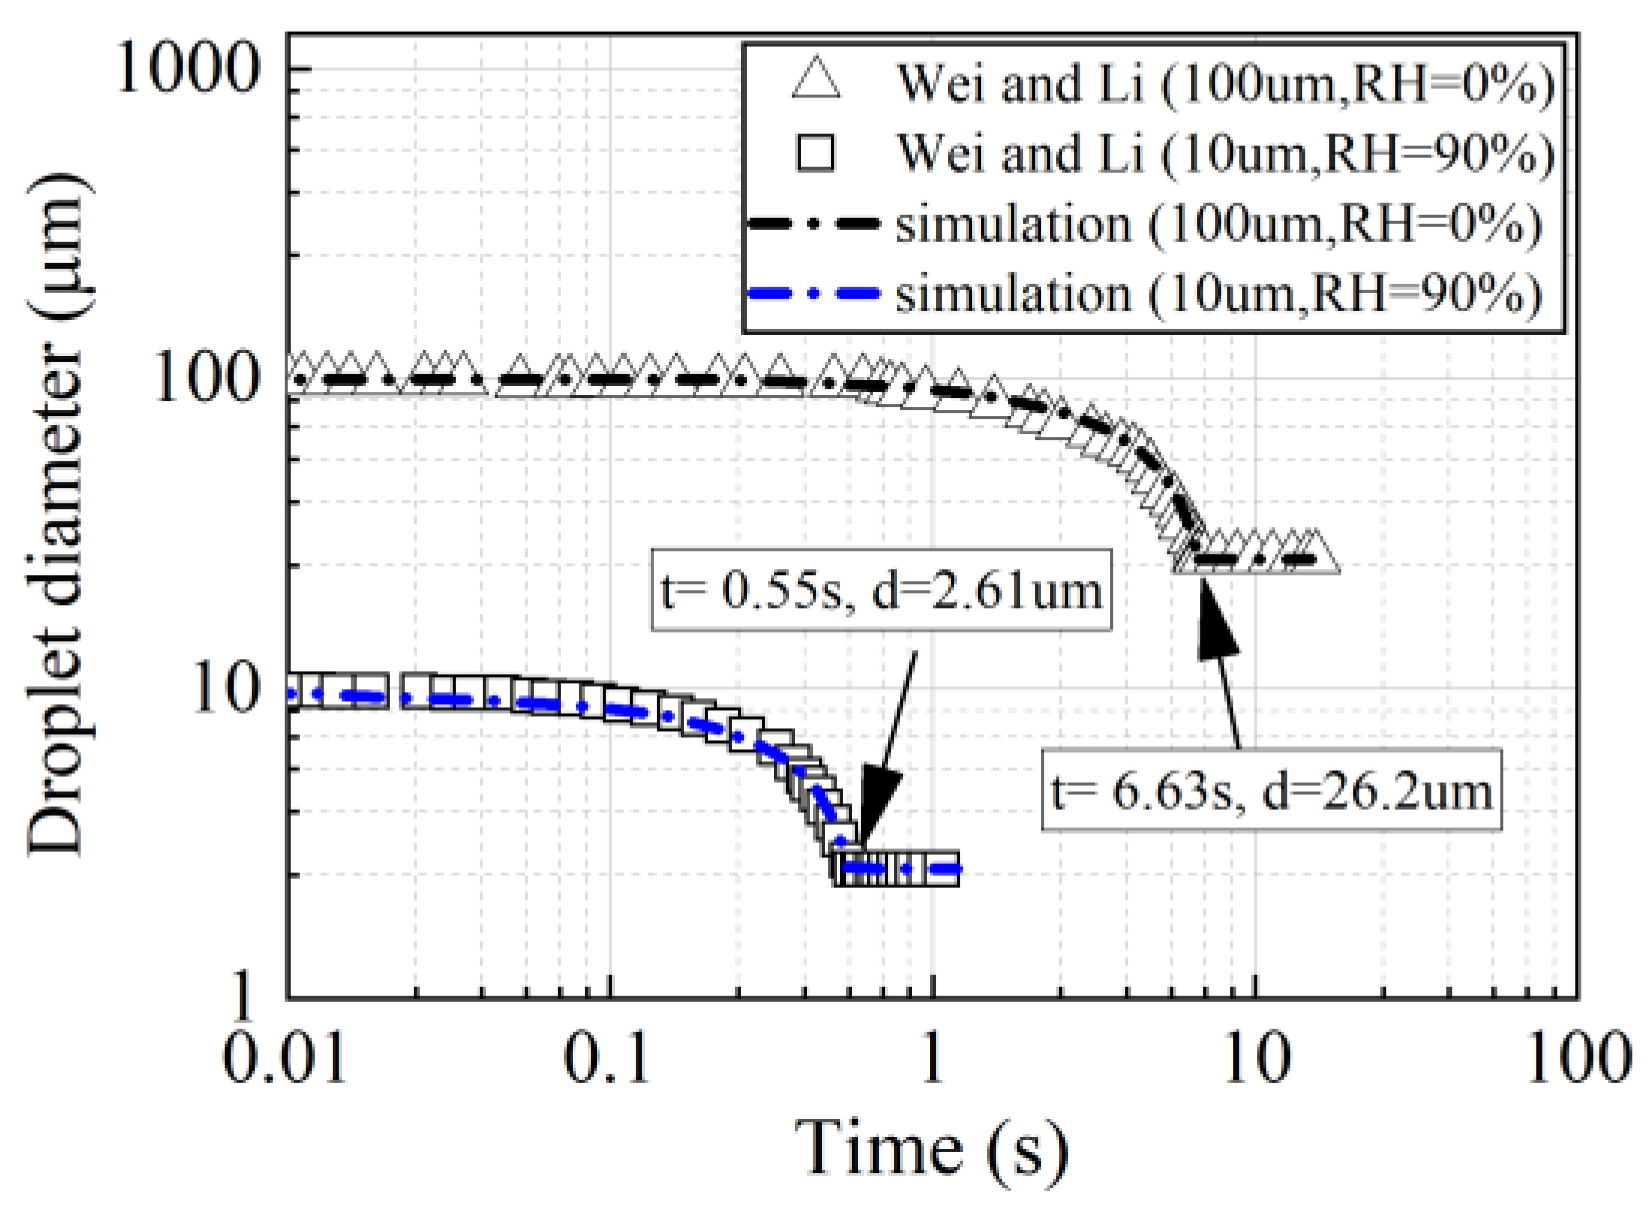
2.4. Numerical Model Validation
3. Results and Discussion
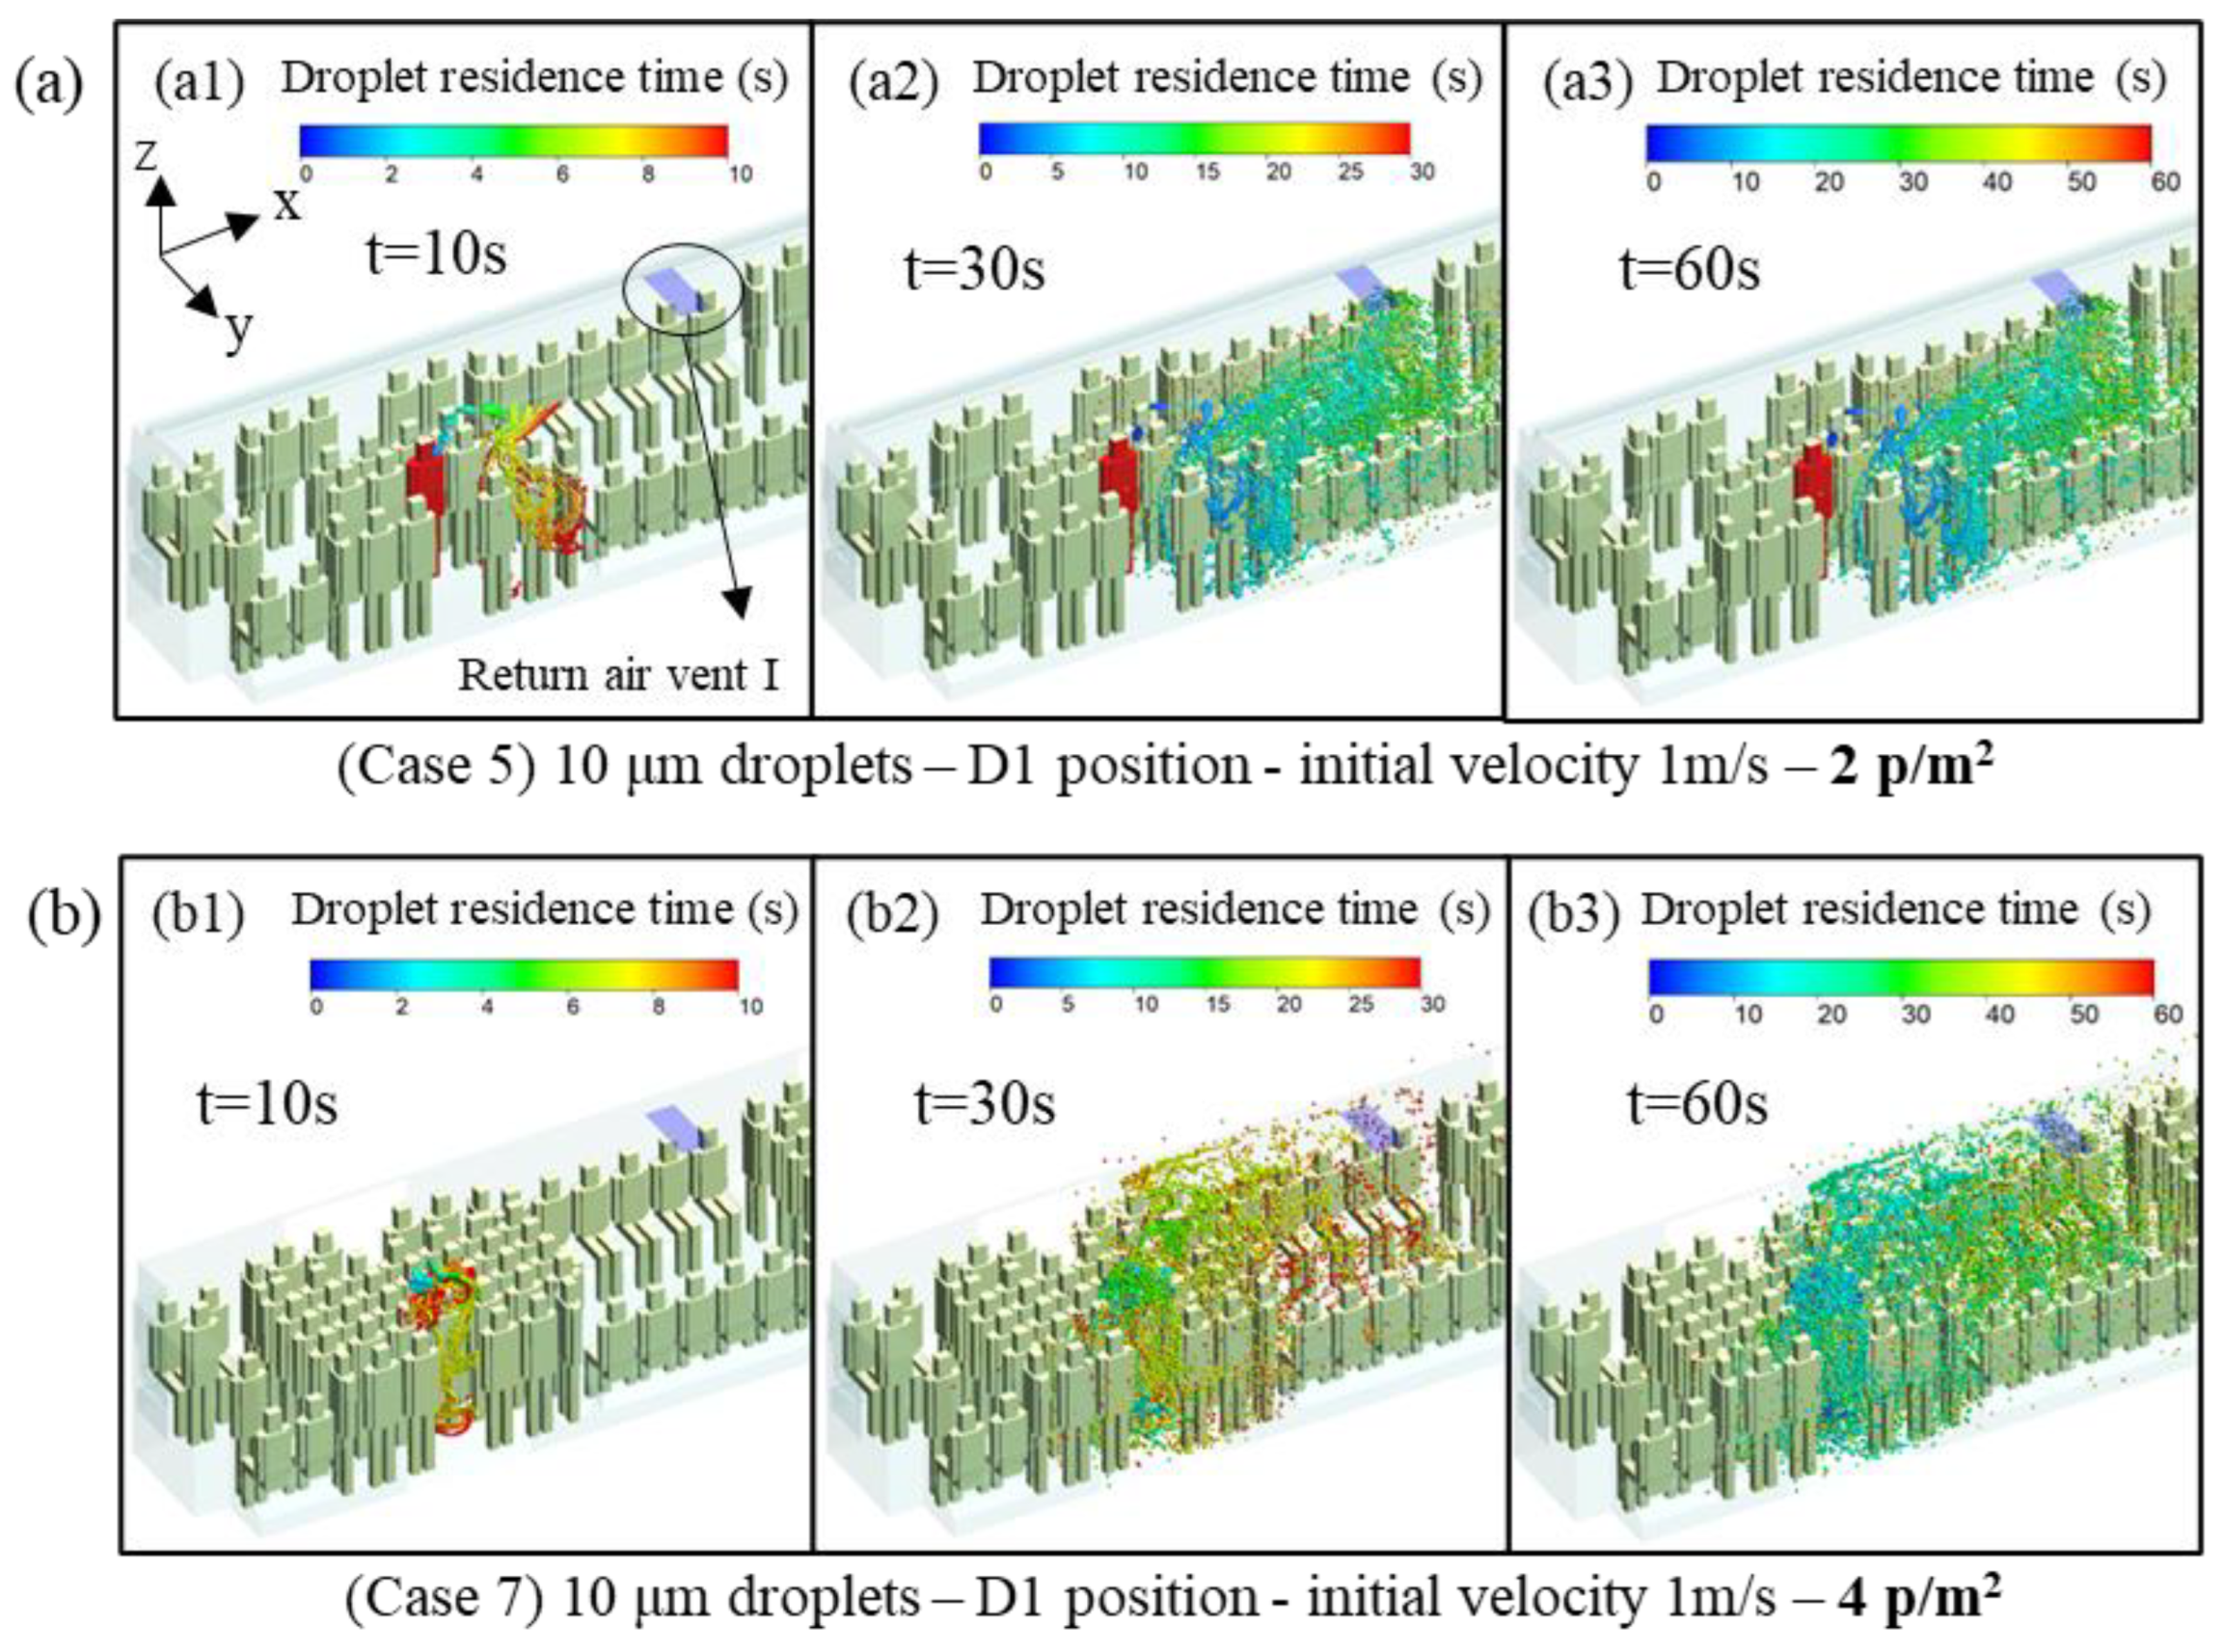
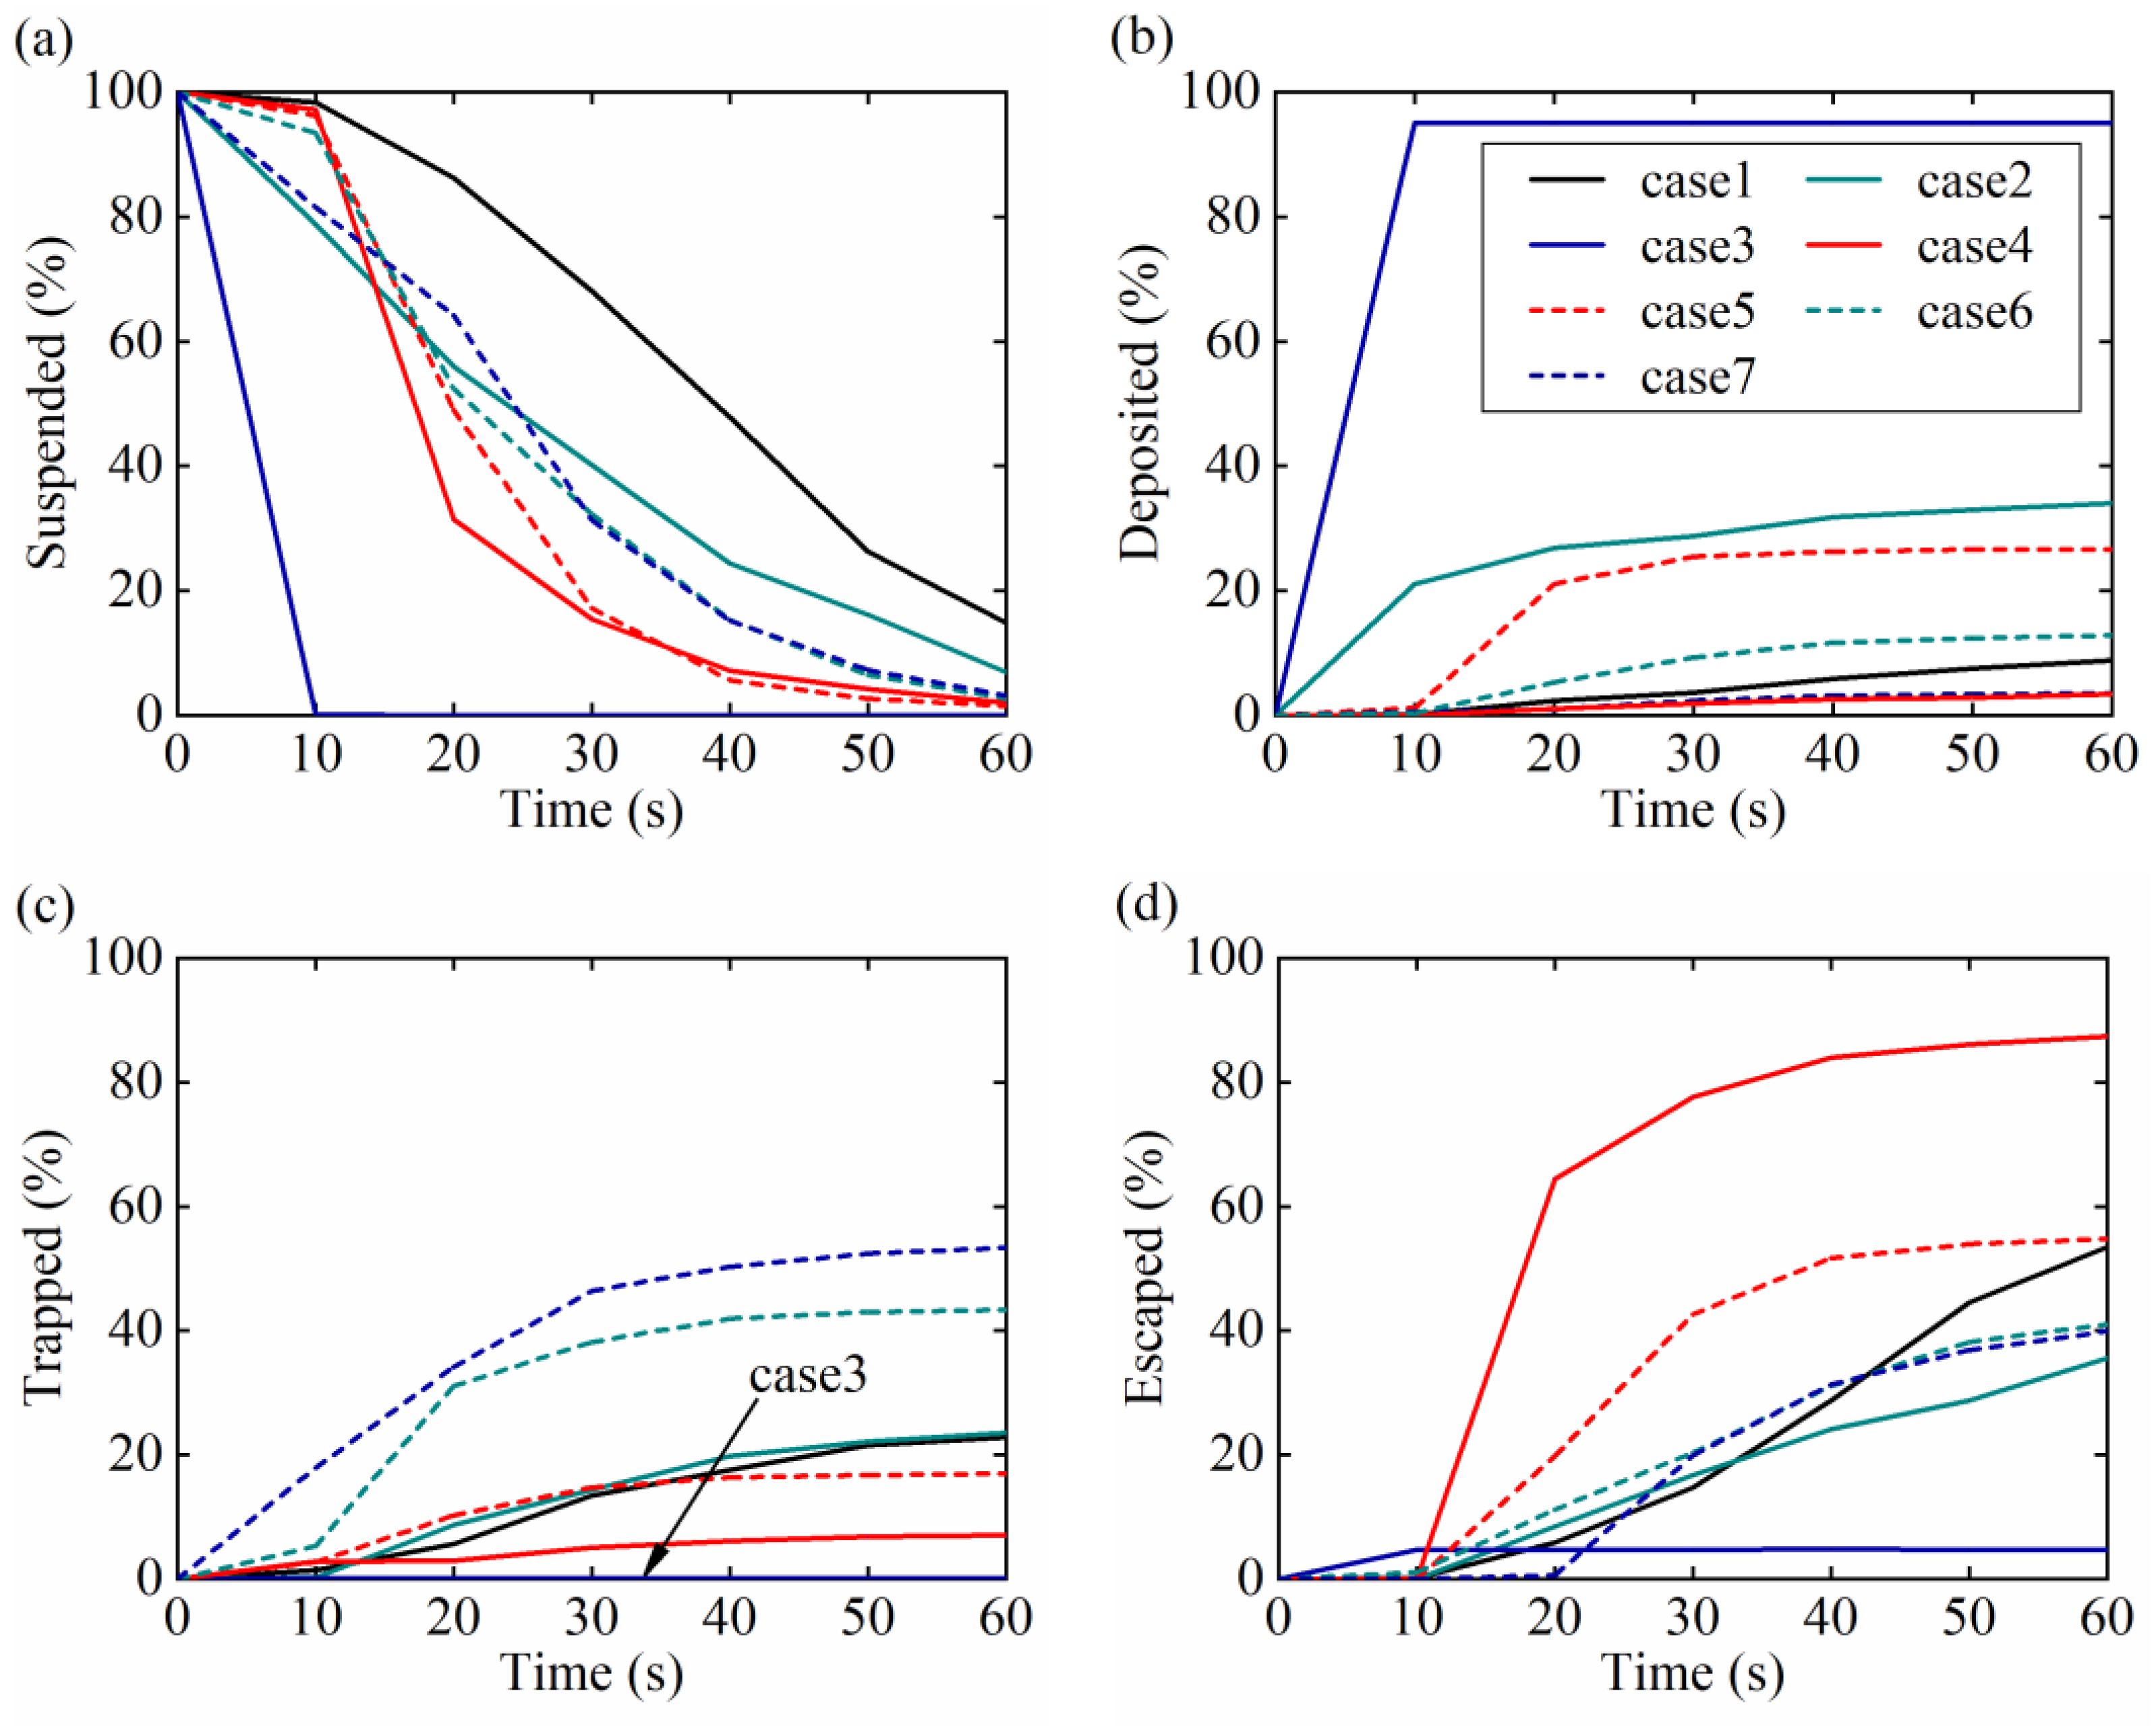
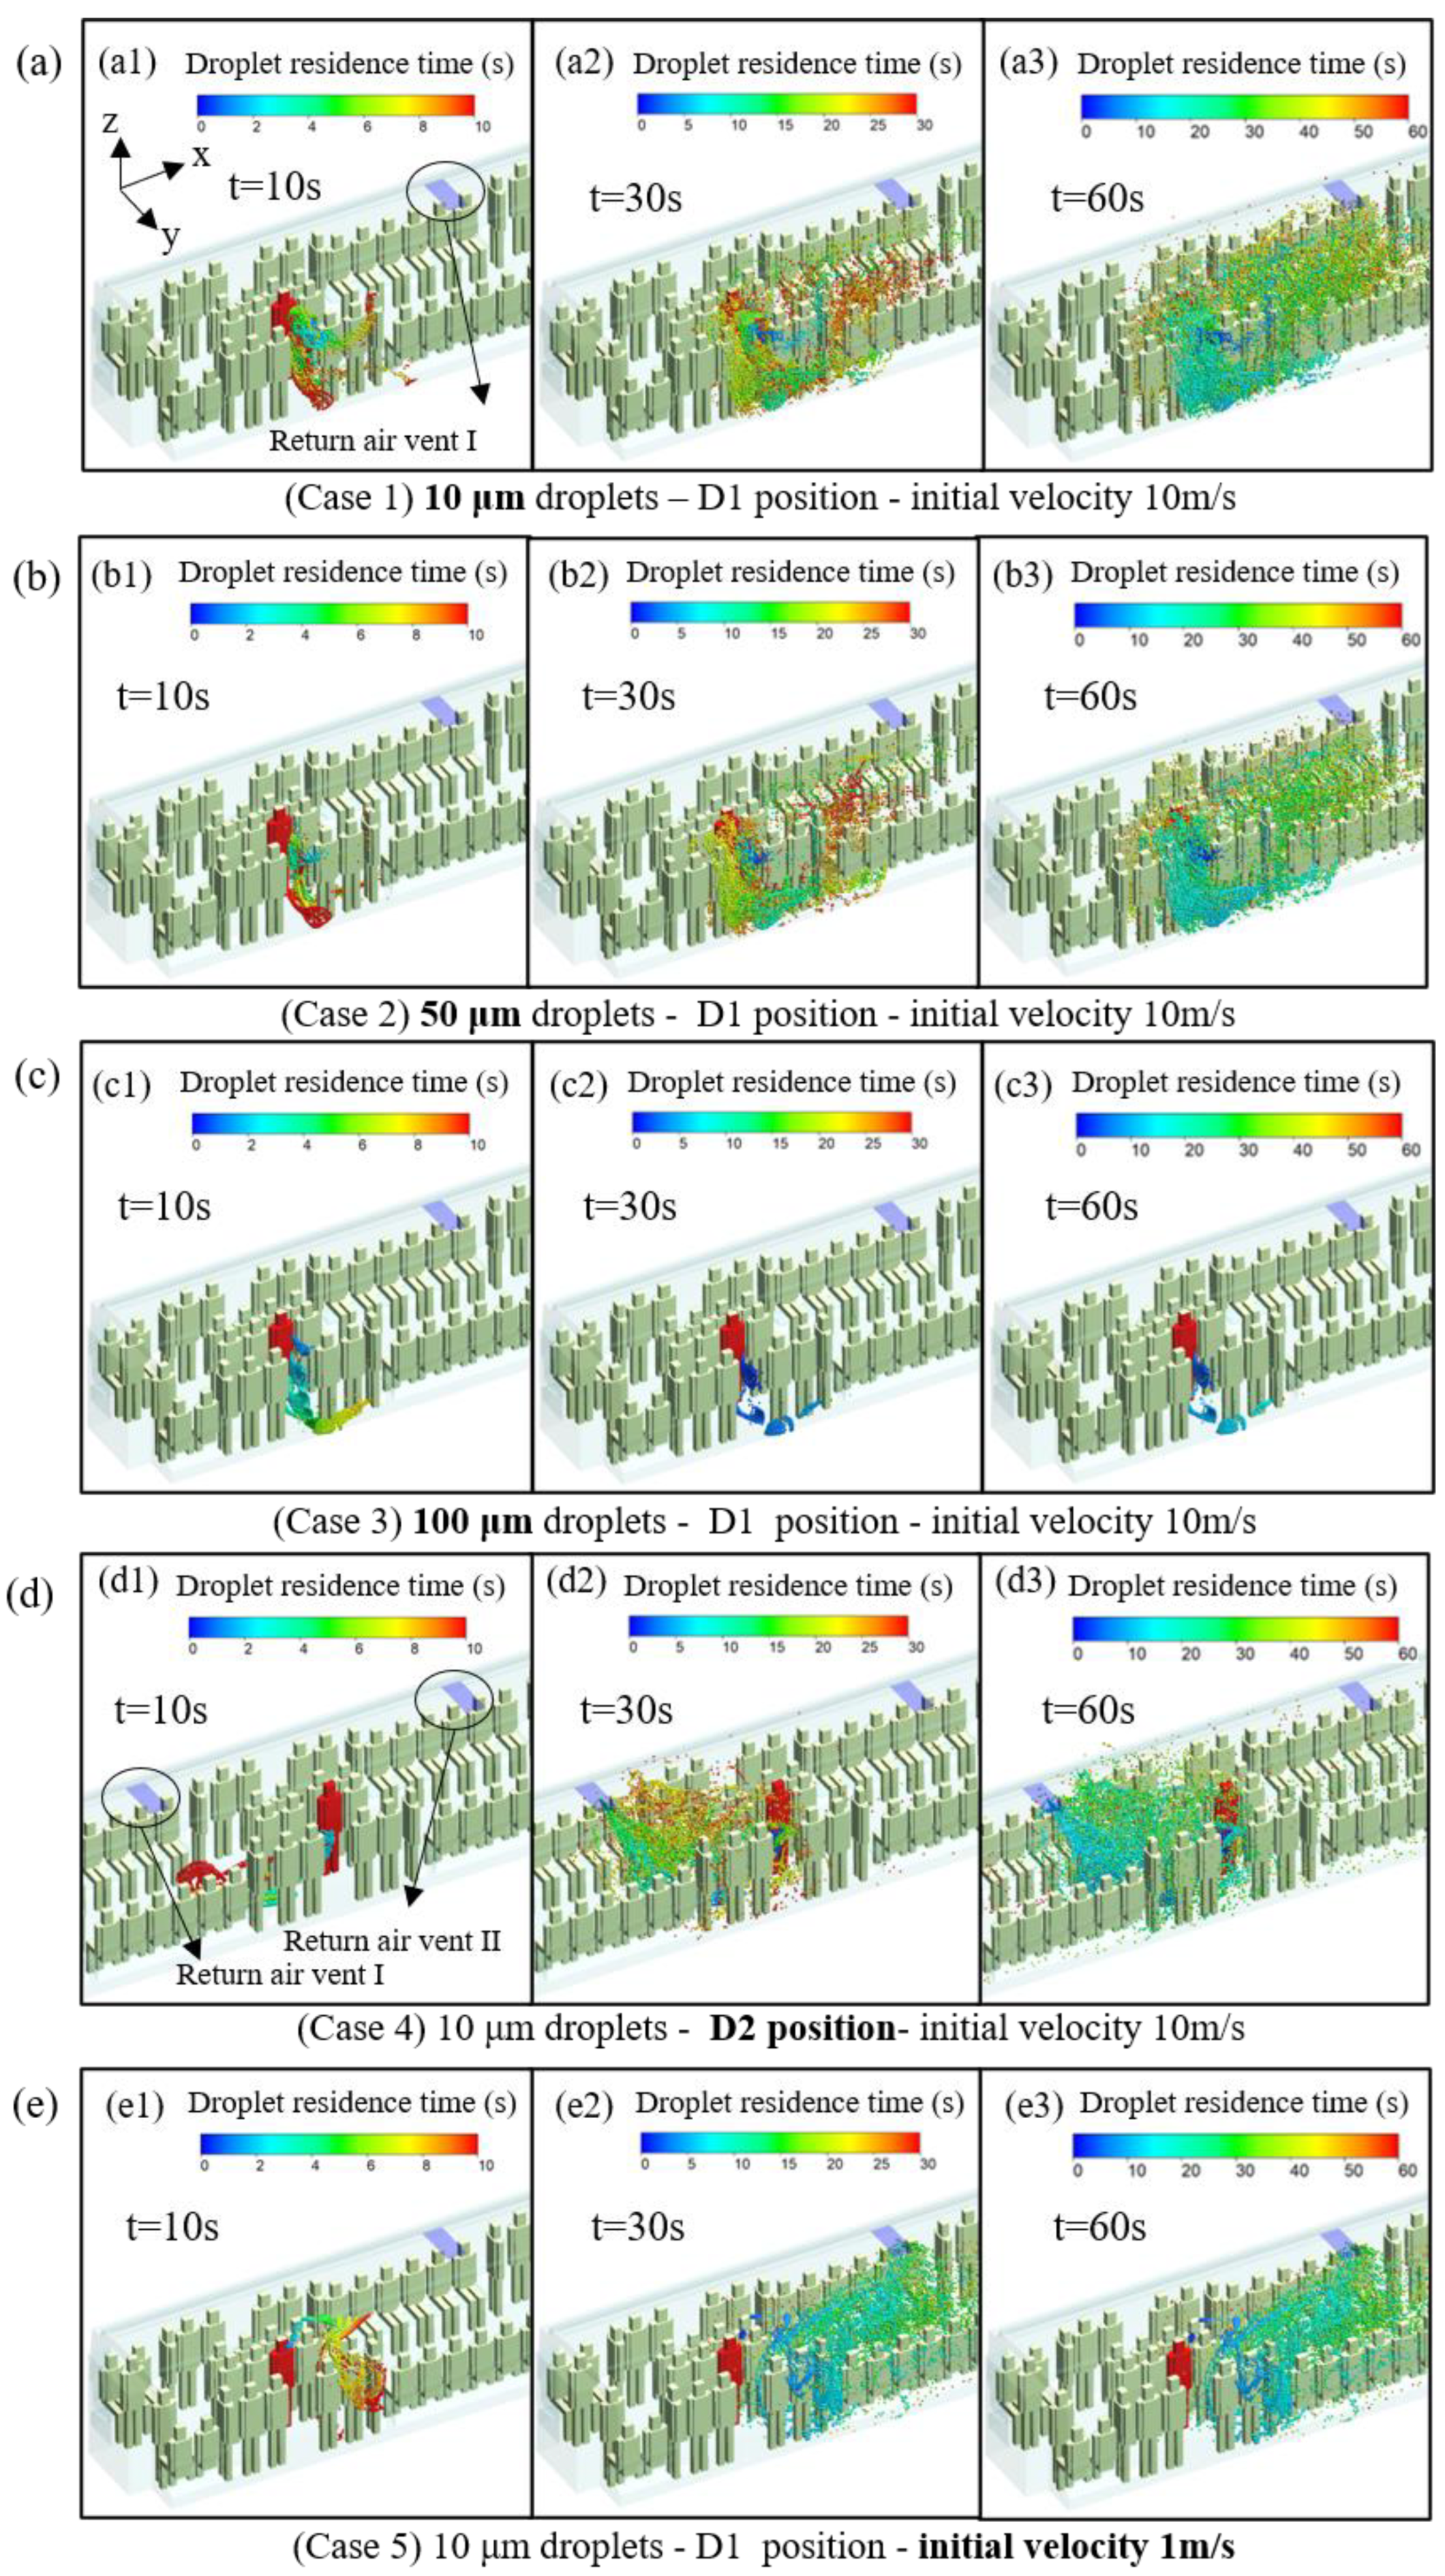
3.1. Effect of Various Initial Conditions on Droplet Diffusion
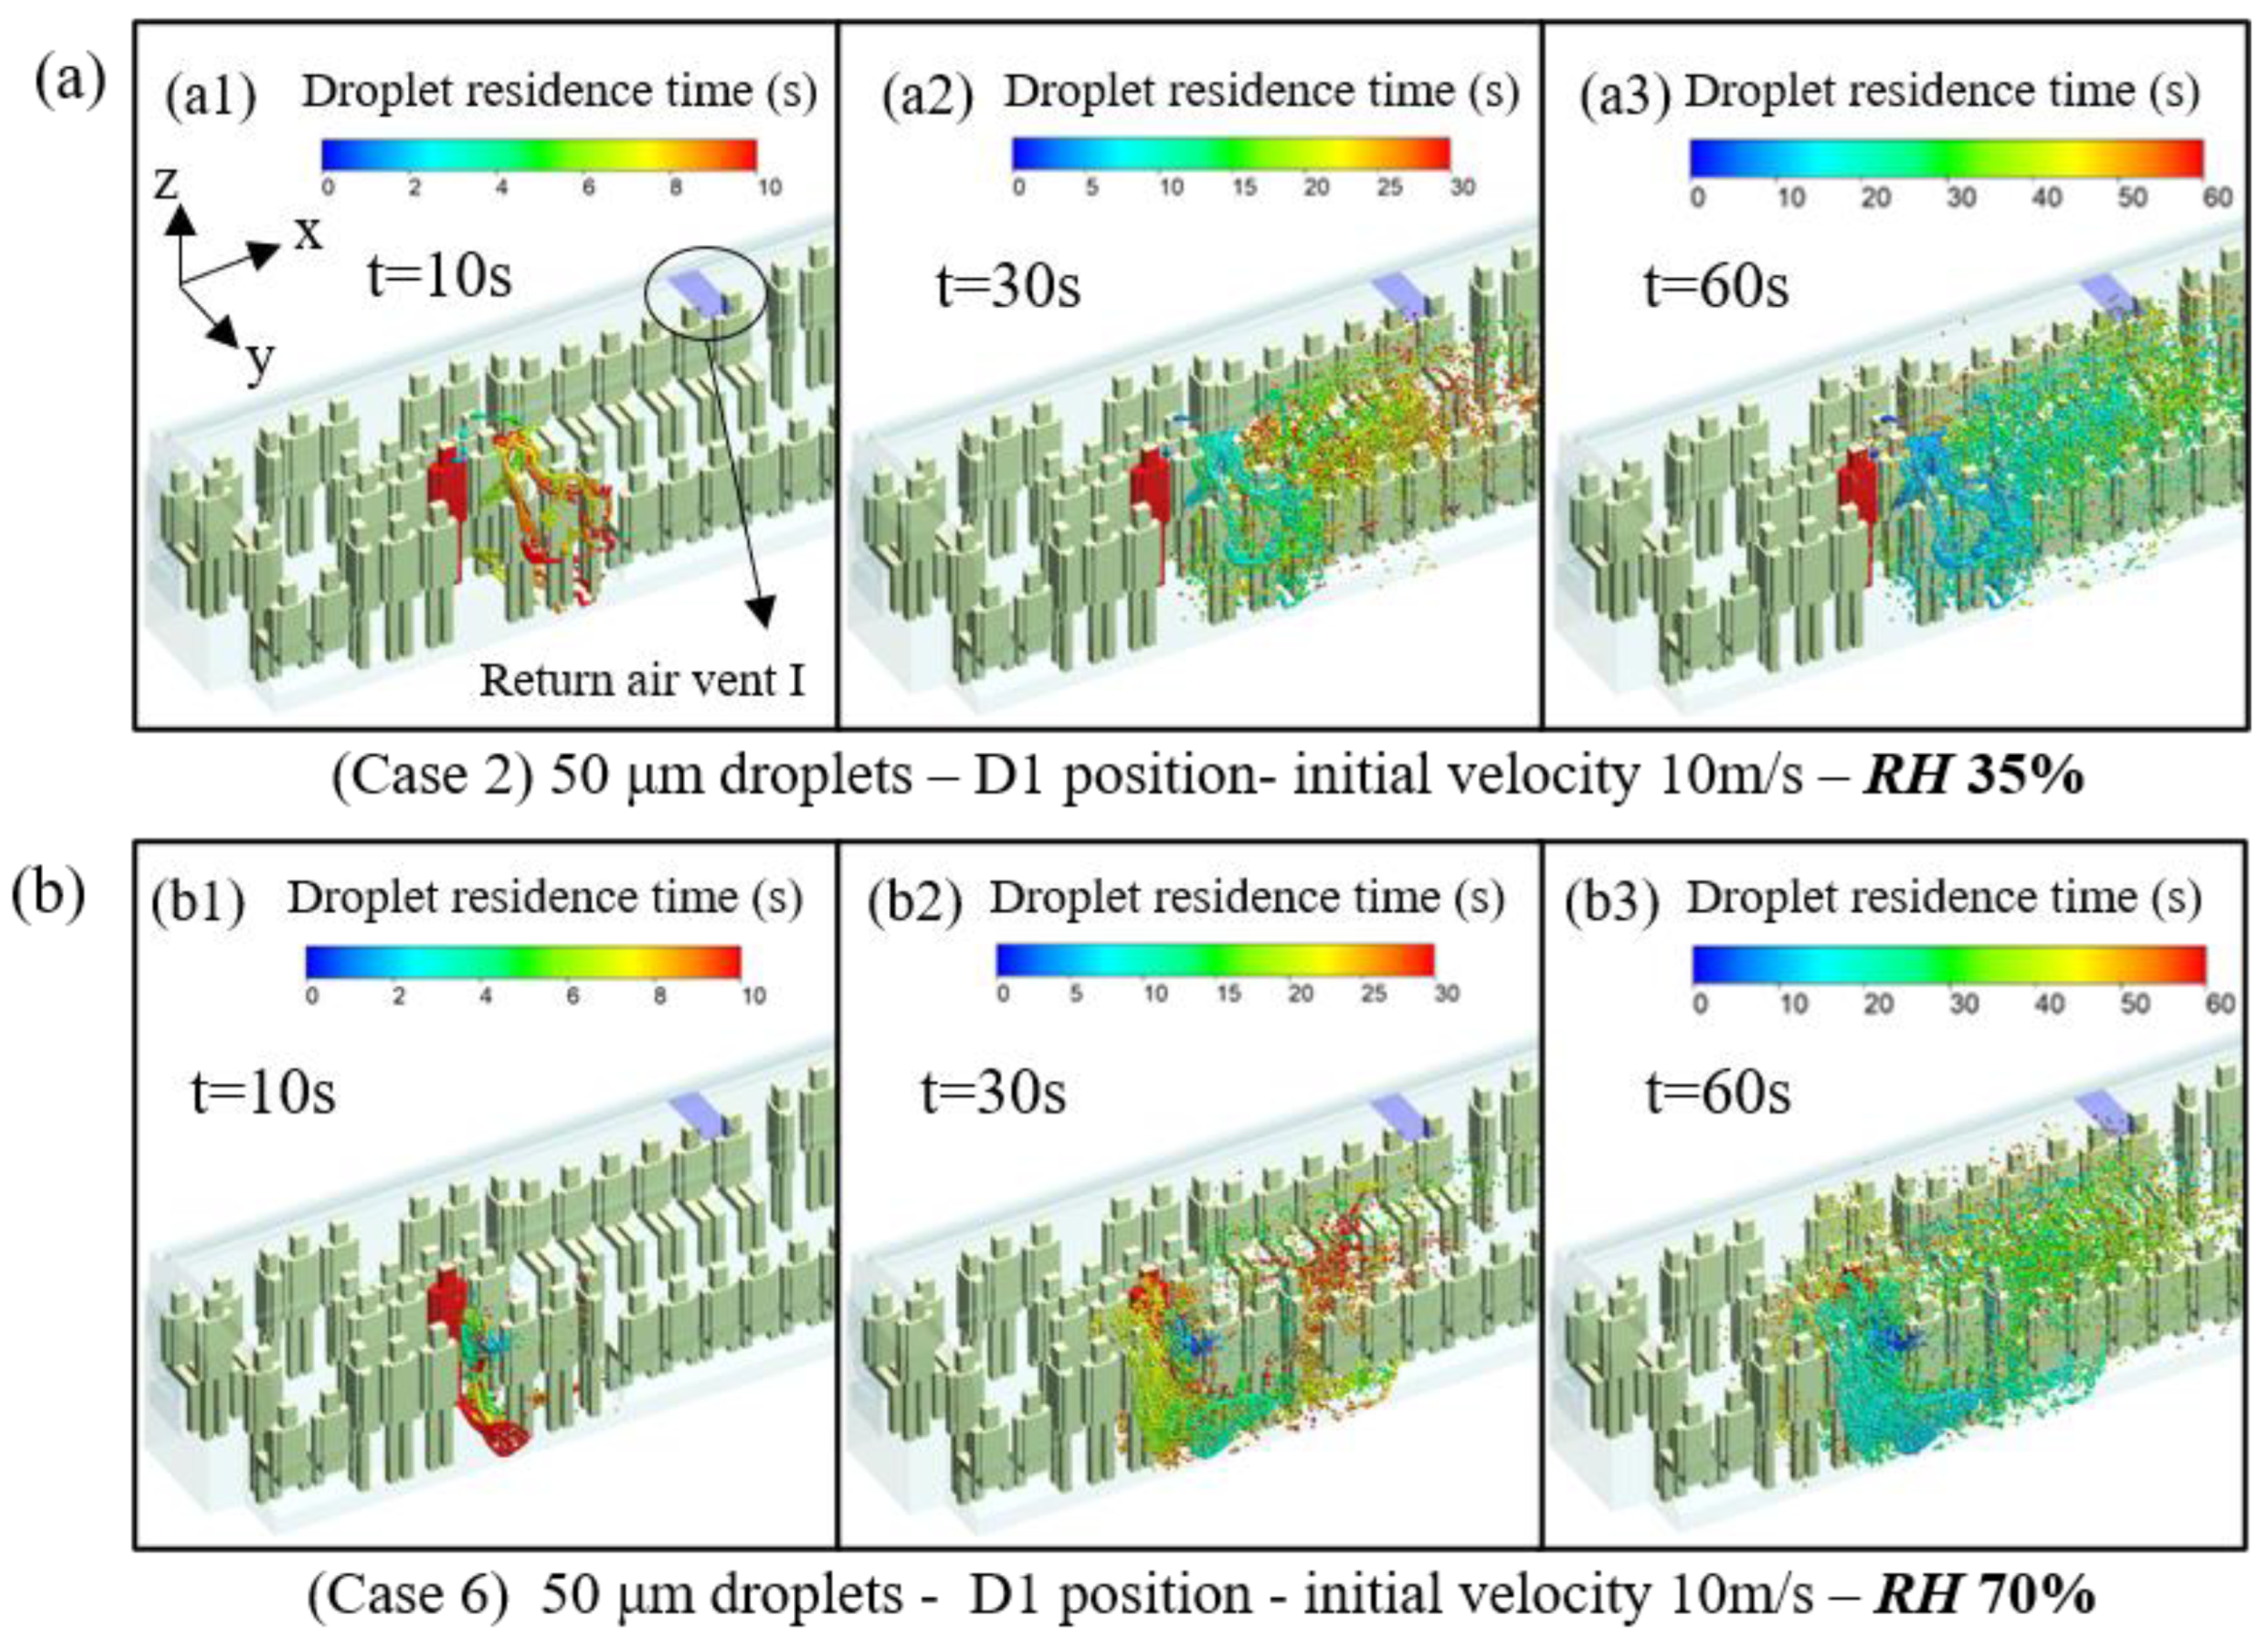
3.2. Droplet Distribution at Different Times within the Carriage
3.3. Passenger Infection Risk Assessment
4. Conclusions
Author Contributions
Funding
Institutional Review Board Statement
Informed Consent Statement
Data Availability Statement
Acknowledgments
Conflicts of Interest
References
- El Hassan, M.; Assoum, H.; Bukharin, N.; Al Otaibi, H.; Mofijur, M.; Sakout, A. A review on the transmission of COVID-19 based on cough/sneeze/breath flows. Eur. Phys. J. Plus 2022, 137, 1. [Google Scholar] [CrossRef]
- Mao, N.; Zhang, D.; Li, Y.; Li, Y.; Li, J.; Zhao, L.; Wang, Q.; Cheng, Z.; Zhang, Y.; Long, E. How do temperature, humidity, and air saturation state affect the COVID-19 transmission risk? Environ. Sci. Pollut. Res. 2023, 30, 3644–3658. [Google Scholar] [CrossRef] [PubMed]
- Song, Y.; Yang, C.; Li, H.; Chen, H.; Shen, S.; Hou, Y.; Wang, J. Aerodynamic performance of a ventilation system for droplet control by coughing in a hospital isolation ward. Environ. Sci. Pollut. Res. 2023, 30, 1–13. [Google Scholar] [CrossRef] [PubMed]
- Lordly, K.; Kober, L.; Jadidi, M.; Antoun, S.; Dworkin, S.B.; Karataş, A.E. Understanding lifetime and dispersion of cough-emitted droplets in air. Indoor Built Environ. 2022, 32, 1929–1948. [Google Scholar] [CrossRef] [PubMed]
- Pan, S.; Xu, C.; Liu, L. Characterization and size distribution of initial droplet concentration discharged from human breathing and speaking. Indoor Built Environ. 2022, 32, 2020–2033. [Google Scholar] [CrossRef]
- Martinez-Vazquez, L.; Casas, P.F.I. A Mathematical Model for the COVID-19 Pandemic in Tokyo through Changing Point Calculus. Appl. Sci. 2023, 13, 12252. [Google Scholar] [CrossRef]
- Martins, V.; Moreno, T.; Mendes, L.; Eleftheriadis, K.; Diapouli, E.; Alves, C.A.; Duarte, M.; de Miguel, E.; Capdevila, M.; Querol, X. Factors controlling air quality in different European subway systems. Environ. Res. 2016, 146, 35–46. [Google Scholar] [CrossRef]
- Mao, Y.; Ma, J.; Wang, S.; Liang, J.; Liang, J. A stratum ventilation system for pollutants and an improved prediction model for infection in subway cars. Atmos. Pollut. Res. 2022, 13, 101354. [Google Scholar] [CrossRef]
- Moreno, T.; Pintó, R.M.; Bosch, A.; Moreno, N.; Alastuey, A.; Minguillón, M.C.; Anfruns-Estrada, E.; Guix, S.; Fuentes, C.; Buonanno, G. Tracing surface and airborne SARS-CoV-2 RNA inside public buses and subway trains. Environ. Int. 2021, 147, 106326. [Google Scholar] [CrossRef]
- Harris, J.E. Critical role of the subways in the initial spread of SARS-CoV-2 in New York City. Front. Public Health 2021, 9, 754767. [Google Scholar] [CrossRef]
- Zhang, T.; Wu, Q.; Zhang, Z. Probable pangolin origin of SARS-CoV-2 associated with the COVID-19 outbreak. Curr. Biol. 2020, 30, 1346–1351. [Google Scholar] [CrossRef] [PubMed]
- Kutter, J.S.; de Meulder, D.; Bestebroer, T.M.; Lexmond, P.; Mulders, A.; Richard, M.; Fouchier, R.A.; Herfst, S. SARS-CoV and SARS-CoV-2 are transmitted through the air between ferrets over more than one meter distance. Nat. Commun. 2021, 12, 1653. [Google Scholar] [CrossRef] [PubMed]
- Fabregat, A.; Gisbert, F.; Vernet, A.; Ferré, J.A.; Mittal, K.; Dutta, S.; Pallarès, J. Direct numerical simulation of turbulent dispersion of evaporative aerosol clouds produced by an intense expiratory event. Phys. Fluids 2021, 33, 033329. [Google Scholar] [CrossRef] [PubMed]
- Liu, K.; Allahyari, M.; Salinas, J.S.; Zgheib, N.; Balachandar, S. Peering inside a cough or sneeze to explain enhanced airborne transmission under dry weather. Sci. Rep. 2021, 11, 9826. [Google Scholar] [CrossRef]
- Wang, Q.; Gu, J.; An, T. The emission and dynamics of droplets from human expiratory activities and COVID-19 transmission in public transport system: A review. Build. Environ. 2022, 219, 109224. [Google Scholar] [CrossRef]
- Chao, C.; Yu, H.; Wan, M.; Sze To, G. Transport and removal of expiratory droplets in hospital ward environment. Aerosol Sci. Technol. 2008, 42, 377–394. [Google Scholar] [CrossRef]
- Fan, X.; Zhang, X.; Weerasuriya, A.; Hang, J.; Zeng, L.; Luo, Q.; Li, C.Y.; Chen, Z. Numerical investigation of the effects of environmental conditions, droplet size, and social distancing on droplet transmission in a street canyon. Build. Environ. 2022, 221, 109261. [Google Scholar] [CrossRef]
- Kukkonen, J.; Vesala, T.; Kulmala, M. The interdependence of evaporation and settling for airborne freely falling droplets. J. Aerosol Sci. 1989, 20, 749–763. [Google Scholar] [CrossRef]
- Xie, X.; Li, Y.; Chwang, A.; Ho, P.; Seto, W. How far droplets can move in indoor environments--revisiting the Wells evaporation-falling curve. Indoor Air 2007, 17, 211–225. [Google Scholar] [CrossRef]
- Hu, G.; Tse, K.-T.; Kwok, K.C.; Zhang, Y. Large eddy simulation of flow around an inclined finite square cylinder. J. Wind. Eng. Ind. Aerodyn. 2015, 146, 172–184. [Google Scholar] [CrossRef]
- Ge, H.; Chen, L.; Xu, C.; Cui, X. Large-eddy simulation of droplet-laden cough jets with a realistic manikin model. Indoor Built Environ. 2022, 31, 1271–1286. [Google Scholar] [CrossRef]
- Borro, L.; Mazzei, L.; Raponi, M.; Piscitelli, P.; Miani, A.; Secinaro, A. The role of air conditioning in the diffusion of SARS-CoV-2 in indoor environments: A first computational fluid dynamic model, based on investigations performed at the Vatican State Children's hospital. Environ. Res. 2021, 193, 110343. [Google Scholar] [CrossRef] [PubMed]
- Dao, H.T.; Kim, K.-S. Behavior of cough droplets emitted from COVID-19 patient in hospital isolation room with different ventilation configurations. Build. Environ. 2022, 209, 108649. [Google Scholar] [CrossRef] [PubMed]
- Li, T.; Wu, S.; Yi, C.; Zhang, J.; Zhang, W. Diffusion characteristics and risk assessment of respiratory pollutants in high-speed train carriages. J. Wind. Eng. Ind. Aerodyn. 2022, 222, 104930. [Google Scholar] [CrossRef]
- Xu, R.; Wu, F.; Li, X.; Yu, C.; Li, H.; Wu, R.; Wu, Y. Numerical comparison of ventilation modes on the transmission of coughing droplets in a train compartment. J. Wind. Eng. Ind. Aerodyn. 2022, 231, 105240. [Google Scholar] [CrossRef]
- Ji, Y.; Qian, H.; Ye, J.; Zheng, X. The impact of ambient humidity on the evaporation and dispersion of exhaled breathing droplets: A numerical investigation. J. Aerosol Sci. 2018, 115, 164–172. [Google Scholar] [CrossRef]
- Yan, Y.; Li, X.; Tu, J. Thermal effect of human body on cough droplets evaporation and dispersion in an enclosed space. Build. Environ. 2019, 148, 96–106. [Google Scholar] [CrossRef]
- Xu, R.; Qian, B.; Wu, F.; Li, X.; Zhang, G.; Wang, L. Dispersion of evaporating droplets in the passenger compartment of high-speed train. J. Build. Eng. 2022, 48, 104001. [Google Scholar] [CrossRef]
- Wei, J.; Li, Y. Enhanced spread of expiratory droplets by turbulence in a cough jet. Build. Environ. 2015, 93, 86–96. [Google Scholar] [CrossRef]
- Yang, L.; Li, X.; Yan, Y.; Tu, J. Effects of cough-jet on airflow and contaminant transport in an airliner cabin section. J. Comput. Multiph. Flows 2017, 10, 72–82. [Google Scholar] [CrossRef]
- Nazari, A.; Jafari, M.; Rezaei, N.; Taghizadeh-Hesary, F. Jet fans in the underground car parking areas and virus transmission. Phys. Fluids 2021, 33, 013603. [Google Scholar] [CrossRef] [PubMed]
- Qian, H.; Li, Y.; Nielsen, P.V.; Hyldgaard, C.-E.; Wong, T.W.; Chwang, A. Dispersion of exhaled droplet nuclei in a two-bed hospital ward with three different ventilation systems. Indoor Air 2006, 16, 111–128. [Google Scholar] [CrossRef]
- Saw, L.H.; Leo, B.F.; Nor, N.S.M.; Yip, C.W.; Ibrahim, N.; Hamid, H.H.A.; Latif, M.T.; Lin, C.Y.; Nadzir, M.S.M. Modeling aerosol transmission of SARS-CoV-2 from human-exhaled particles in a hospital ward. Environ. Sci. Pollut. Res. 2021, 28, 53478–53492. [Google Scholar] [CrossRef] [PubMed]
- Obeidat, B.; Alrebei, O.F.; Abdallah, I.A.; Darwish, E.F.; Amhamed, A. CFD Analyses: The Effect of pressure suction and airflow velocity on coronavirus dispersal. Appl. Sci. 2021, 11, 7450. [Google Scholar] [CrossRef]
- Lu, Y.; Lin, Z. Coughed droplet dispersion pattern in hospital ward under stratum ventilation. Build. Environ. Int. 2022, 208, 108602. [Google Scholar] [CrossRef]
- Kumar, S.; King, M.D. Numerical investigation on indoor environment decontamination after sneezing. Environ. Res. 2022, 213, 113665. [Google Scholar] [CrossRef] [PubMed]
- Liu, H.; He, S.; Shen, L.; Hong, J. Simulation-based study of COVID-19 outbreak associated with air-conditioning in a restaurant. Phys. Fluids 2021, 33, 023301. [Google Scholar] [CrossRef] [PubMed]
- Schreck, J.H.; Lashaki, M.J.; Hashemi, J.; Dhanak, M.; Verma, S. Aerosol generation in public restrooms. Phys. Fluids 2021, 33, 033320. [Google Scholar] [CrossRef]
- Kharrufa, S.; Panigrahi, D.; Makky, S.; Al Muaitah, A.; Aziz, O.; Basheer, M. A Study of Expiratory Droplet Dispersion and Deposition Density in an Enclosed Residential Space. Buildings 2023, 13, 1869. [Google Scholar] [CrossRef]
- Dbouk, T.; Drikakis, D. On airborne virus transmission in elevators and confined spaces. Phys. Fluids 2021, 33, 011905. [Google Scholar] [CrossRef]
- Yang, X.; Ou, C.; Yang, H.; Liu, L.; Song, T.; Kang, M.; Lin, H.; Hang, J. Transmission of pathogen-laden expiratory droplets in a coach bus. J. Hazard. Mater. 2020, 397, 122609. [Google Scholar] [CrossRef] [PubMed]
- Yun, S.; Kim, J.-C. Numerical Evaluation of a Novel Vertical Drop Airflow System to Mitigate Droplet Transmission in Trains. Atmosphere 2022, 13, 829. [Google Scholar] [CrossRef]
- Yang, Y.; Wang, Y.; Su, C. Numerical investigation on the droplet dispersion inside a bus and the infection risk prediction. Appl. Sci. 2022, 12, 5909. [Google Scholar] [CrossRef]
- Armand, P.; Tâche, J. 3D modelling and simulation of the dispersion of droplets and drops carrying the SARS-CoV-2 virus in a railway transport coach. Sci. Rep. 2022, 12, 4025. [Google Scholar] [CrossRef]
- Narayanan, S.R.; Yang, S. Airborne transmission of virus-laden aerosols inside a music classroom: Effects of portable purifiers and aerosol injection rates. Phys. Fluids 2021, 33, 033307. [Google Scholar] [CrossRef]
- Wu, L.; Liu, X.; Yao, F.; Chen, Y. Numerical study of virus transmission through droplets from sneezing in a cafeteria. Phys. Fluids 2021, 33, 023311. [Google Scholar] [CrossRef]
- Li, M.; Zhao, B.; Tu, J.; Yan, Y. Study on the carbon dioxide lockup phenomenon in aircraft cabin by computational fluid dynamics. Build. Simul. 2015, 8, 431–441. [Google Scholar] [CrossRef]
- Komperda, J.; Peyvan, A.; Li, D.; Kashir, B.; Yarin, A.L.; Megaridis, C.M.; Mirbod, P.; Paprotny, I.; Cooper, L.F.; Rowan, S. Computer simulation of the SARS-CoV-2 contamination risk in a large dental clinic. Phys. Fluids 2021, 33, 033328. [Google Scholar] [CrossRef] [PubMed]
- Kumar, S.; Klassen, M.; Klassen, D.; Hardin, R.; King, M.D. Dispersion of sneeze droplets in a meat facility indoor environment–Without partitions. Environ. Res. 2023, 236, 116603. [Google Scholar] [CrossRef]
- Zhang, Z.; Zhang, W.; Zhai, Z.J.; Chen, Q.Y. Evaluation of various turbulence models in predicting airflow and turbulence in enclosed environments by CFD: Part 2—Comparison with experimental data from literature. HVAC&R Res. 2007, 13, 871–886. [Google Scholar]
- Armenio, V.; Fiorotto, V. The importance of the forces acting on particles in turbulent flows. Phys. Fluids 2001, 13, 2437–2440. [Google Scholar] [CrossRef]
- Elghannay, H.; Tafti, D.; Yu, K. Evaluation of physics based hard-sphere model with the soft sphere model for dense fluid-particle flow systems. Int. J. Multiph. Flow 2019, 112, 100–115. [Google Scholar] [CrossRef]
- Hong, W.; Wang, X.; Zheng, J. Numerical study on particle deposition in rough channels with different structure parameters of rough elements. Adv. Powder Technol. 2018, 29, 2895–2903. [Google Scholar] [CrossRef]
- Talbot, L.; Cheng, R.; Schefer, R.; Willis, D. Thermophoresis of particles in a heated boundary layer. J. Fluid Mech. 1980, 101, 737–758. [Google Scholar] [CrossRef]
- Saffiman, P.G. The lift on a small sphere in a slow shear flow. J. Fluid Mech. 1968, 31, 624. [Google Scholar] [CrossRef]
- Li, A.; Ahmadi, G. Dispersion and deposition of spherical particles from point sources in a turbulent channel flow. Aerosol Sci. Technol. 1992, 16, 209–226. [Google Scholar] [CrossRef]
- Yang, Y.; Wang, Y.; Song, B.; Fan, J.; Cao, Y.; Duan, M. Transport and control of droplets: A comparison between two types of local ventilation airflows. Powder Technol. 2019, 345, 247–259. [Google Scholar] [CrossRef]
- Watanabe, T.; Bartrand, T.A.; Weir, M.H.; Omura, T.; Haas, C.N. Development of a dose-response model for SARS coronavirus. Risk Anal. 2010, 30, 1129–1138. [Google Scholar] [CrossRef]
- Bale, R.; Iida, A.; Yamakawa, M.; Li, C.; Tsubokura, M. Quantifying the COVID19 infection risk due to droplet/aerosol inhalation. Sci. Rep. 2022, 12, 11186. [Google Scholar] [CrossRef]
- Takii, A.; Yamakawa, M.; Kitagawa, A.; Watamura, T.; Chung, Y.M.; Kim, M. Numerical model for cough-generated droplet dispersion on moving escalator with multiple passengers. Indoor Air 2022, 32, e13131. [Google Scholar] [CrossRef]
- Augenbraun, B.L.; Lasner, Z.D.; Mitra, D.; Prabhu, S.; Raval, S.; Sawaoka, H.; Doyle, J.M. Assessment and mitigation of aerosol airborne SARS-CoV-2 transmission in laboratory and office environments. J. Occup. Environ. Hyg. 2020, 17, 447–456. [Google Scholar] [CrossRef]
- Kolinski, J.M.; Schneider, T.M. Superspreading events suggest aerosol transmission of SARS-CoV-2 by accumulation in enclosed spaces. Phys. Rev. E 2021, 103, 033109. [Google Scholar] [CrossRef]
- Wölfel, R.; Corman, V.M.; Guggemos, W.; Seilmaier, M.; Zange, S.; Müller, M.A.; Niemeyer, D.; Jones, T.C.; Vollmar, P.; Rothe, C. Virological assessment of hospitalized patients with COVID-2019. Nature 2020, 581, 465–469. [Google Scholar] [CrossRef]
- Feng, Y.; Marchal, T.; Sperry, T.; Yi, H. Influence of wind and relative humidity on the social distancing effectiveness to prevent COVID-19 airborne transmission: A numerical study. J. Aerosol Sci. 2020, 147, 105585. [Google Scholar] [CrossRef]
- Tao, Y.; Yang, M.; Qian, B.; Wu, F. Numerical and experimental study on ventilation panel models in a subway passenger compartment. Engineering 2019, 5, 329–336. [Google Scholar] [CrossRef]
- Luo, Q.; Yang, X.; Hang, J.; Fan, X.; Luo, Z.; Gu, Z.; Ou, C. Influence of natural ventilation design on the dispersion of pathogen-laden droplets in a coach bus. Sci. Total Environ. 2023, 885, 163827. [Google Scholar] [CrossRef]
- Luo, Q.; Ou, C.; Hang, J.; Luo, Z.; Yang, H.; Yang, X.; Zhang, X.; Li, Y.; Fan, X. Role of pathogen-laden expiratory droplet dispersion and natural ventilation explaining a COVID-19 outbreak in a coach bus. Build. Environ. Int. 2022, 220, 109160. [Google Scholar] [CrossRef]
- National Academies of Sciences Engineering Medicine. Transit Capacity and Quality of Service Manual, 3rd ed.; The National Academies Press: Washington, DC, USA, 2017. [Google Scholar]
- EN14750-1; Railway Applications—Air Conditioning for Urban and Suburban Rolling Stock—Part 1: Comfort Parameters. iTeh Standards: Toronto, ON, Canada, 2006. [CrossRef]
- Lu, Y.; Oladokun, M.; Lin, Z. Reducing the exposure risk in hospital wards by applying stratum ventilation system. Build. Environ. Int. 2020, 183, 107204. [Google Scholar] [CrossRef]
- Zhang, B.; Xue, T.; Hu, N. Analysis and improvement of the comfort performance of a car’s indoor environment based on the predicted mean vote–predicted percentage of dissatisfied and air age. Adv. Mech. Eng. 2017, 9, 1687814017695693. [Google Scholar] [CrossRef]
- Yang, L.; Li, M.; Li, X.; Tu, J. The effects of diffuser type on thermal flow and contaminant transport in high-speed train (HST) cabins–a numerical study. Int. J. Vent. 2018, 17, 48–62. [Google Scholar] [CrossRef]
- Qian, H.; Li, Y. Removal of exhaled particles by ventilation and deposition in a multibed airborne infection isolation room. Indoor Air 2010, 20, 284–297. [Google Scholar] [CrossRef] [PubMed]
- Nazari, A.; Hong, J.; Taghizadeh-Hesary, F.; Taghizadeh-Hesary, F. Reducing virus transmission from heating, ventilation, and air conditioning systems of urban subways. Toxics 2022, 10, 796. [Google Scholar] [CrossRef] [PubMed]
- Liu, L.; Wei, J.; Li, Y.; Ooi, A. Evaporation and dispersion of respiratory droplets from coughing. Indoor Air 2017, 27, 179–190. [Google Scholar] [CrossRef] [PubMed]


| Name | Type | Values and Units |
|---|---|---|
| Supply air inlet | Mass flow inlet | 1.45 kg/s, 293 K |
| Return air vent | Pressure outlet | 0 Pa, 293 K |
| Exhaust air outlet | Pressure outlet | 0 Pa, 293 K |
| Main exhaust air outlet | Mass flow outlet | −0.88 kg/s, 293 K |
| Case Number | Initial Droplet Diameter (μm) | Initial Droplet Velocity (m/s) | Release Position | Air RH | Passengers’ Density |
|---|---|---|---|---|---|
| 1 | 10 | 10 | D1 | 70% | 2 p/m2 |
| 2 | 50 | 10 | D1 | 70% | 2 p/m2 |
| 3 | 100 | 10 | D1 | 70% | 2 p/m2 |
| 4 | 10 | 10 | D2 | 70% | 2 p/m2 |
| 5 | 10 | 1 | D1 | 70% | 2 p/m2 |
| 6 | 50 | 10 | D1 | 35% | 2 p/m2 |
| 7 | 10 | 1 | D1 | 70% | 4 p/m2 |
| Infection Risk (P) | Case 1 | Case 2 | Case 3 | Case 4 | Case 5 | Case 6 | Case 7 |
|---|---|---|---|---|---|---|---|
| ≥0.01 | 3 | 15 | 3 | 0 | 2 | 16 | 4 |
| ≥0.05 | 0 | 13 | 3 | 0 | 0 | 14 | 2 |
| ≥0.1 | 0 | 8 | 2 | 0 | 0 | 10 | 0 |
| ≥0.2 | 0 | 5 | 2 | 0 | 0 | 8 | 0 |
| ≥0.5 | 0 | 3 | 0 | 0 | 0 | 6 | 0 |
Disclaimer/Publisher’s Note: The statements, opinions and data contained in all publications are solely those of the individual author(s) and contributor(s) and not of MDPI and/or the editor(s). MDPI and/or the editor(s) disclaim responsibility for any injury to people or property resulting from any ideas, methods, instructions or products referred to in the content. |
© 2024 by the authors. Licensee MDPI, Basel, Switzerland. This article is an open access article distributed under the terms and conditions of the Creative Commons Attribution (CC BY) license (https://creativecommons.org/licenses/by/4.0/).
Share and Cite
Wu, F.; Yu, C.; Xu, R.; Li, H. Numerical Simulation of Droplet Dispersion and Passenger Infection Risk Assessment in a Subway Carriage. Appl. Sci. 2024, 14, 590. https://doi.org/10.3390/app14020590
Wu F, Yu C, Xu R, Li H. Numerical Simulation of Droplet Dispersion and Passenger Infection Risk Assessment in a Subway Carriage. Applied Sciences. 2024; 14(2):590. https://doi.org/10.3390/app14020590
Chicago/Turabian StyleWu, Fan, Chao Yu, Renze Xu, and Hengkui Li. 2024. "Numerical Simulation of Droplet Dispersion and Passenger Infection Risk Assessment in a Subway Carriage" Applied Sciences 14, no. 2: 590. https://doi.org/10.3390/app14020590
APA StyleWu, F., Yu, C., Xu, R., & Li, H. (2024). Numerical Simulation of Droplet Dispersion and Passenger Infection Risk Assessment in a Subway Carriage. Applied Sciences, 14(2), 590. https://doi.org/10.3390/app14020590