Article

Predicting Runoff from the Weigan River under Climate Change

1
College of Water Conservancy & Architectural Engineering, Shihezi University, Shihezi 832000, China
2
China Institute of Water Resources and Hydropower Research, Beijing 100038, China
3
School of Civil Engineering, Tianjin University, Tianjin 300072, China
*
Authors to whom correspondence should be addressed.
Appl. Sci. 2024, 14(2), 541; https://doi.org/10.3390/app14020541
Submission received: 18 December 2023 / Revised: 5 January 2024 / Accepted: 7 January 2024 / Published: 8 January 2024

Abstract

:
With the warming and humidification process in the Northwest Arid Zone over the past 30 years, the runoff of a vast majority of rivers has been affected to different degrees. In this paper, the runoff from the Weigan River, a typical inland river in the arid zone of Northwest China, is taken as an example, and seven types of CMIP6 data are selected with the help of a SWAT model to predict the runoff volume of the Weigan River in the next 30 years under climate change. The results show that (1) the SWAT model can simulate the runoff from the Weigan River well and has good applicability in this study area. (2) With an increase in radiative forcing, the temperature, precipitation and runoff in the study area show an increasing trend. (3) Under the four radiative forcing scenarios in 2030 and 2050, the runoff from the Weigan River out of the mountain is predicted to be maintained at 25.68 to 30.89 × 10⁸ m3, which is an increase of 1.35% to 21.91% compared with the current runoff, of which the contribution to the increase in future runoff caused by the changes in temperature and precipitation is 68.71% and 27.24%, respectively. It is important to explore the impact of climate change on the runoff from the Weigan River to understand the impact of climate change on the Northwest Arid Region scientifically and rationally, and to provide a scientific basis for evaluating the risk of climate change and formulating policies to deal with it.

1. Introduction

With the continuation of global warming, increasing temperatures and intensified water cycle rates [1], the spatial and temporal distribution of water resources has changed. Extreme hydrological events are frequent in most regions, precipitation intensity has increased [2], and there is a general trend of increasing extreme precipitation [3,4]. The Special Report on Climate Change and Land released by the IPCC (The Intergovernmental Panel on Climate Change) in 2019 also suggests that the continuation of climate change amplifies the impacts and pressures that humans are exerting on land. As a result of land–air interactions, land degradation exacerbates climate change, which in turn exacerbates land degradation and desertification in a variety of ways. Climate change contributes to the intensification and frequency of extreme disasters, which also pose many challenges to land degradation and food security [5]. Currently, climate warming is a crisis that is of particular concern to the scientific community and governments, and global action to mitigate and adapt to climate change is urgent [6]. The World Climate Research Programme (WCRP) has launched a series of Coupled Model Intercomparison Projects (CMIP) to mitigate and respond to climate change. With the continuous development of the economy, the future development of a “path” is also changing and has entered the sixth phase (i.e., CMIP6), where great progress has been made to its physical properties, resolution and other parameters compared with previous generations. Compared to local regional models, global climate models (GCMs) exhibit better performance in matching actual observations in large-scale areas [7,8]. At the same time, due to the different sources of climate models, there is a certain degree of variability among them. Therefore, it is particularly important to harmonise the spatial resolution of different GCMs and downscale their bias revision before future climate prediction.
Currently, there are many statistical downscaling bias correction methods used by scholars at home and abroad. For example, Ferreira et al. [9] used the quantile delta mapping method for statistical downscaling to assess future precipitation changes and the occurrence of hydrological droughts in South Asia, and Velázque et al. [10] used a bias-corrected downscaling method to process four GCMs and assessed and analysed historical trends. Guo et al. [11], Xiang et al. [12], Hu et al. [13] and other scholars processed multiple GCMs under different scenarios with bias correction, and assessed and analysed the simulation ability of these models in terms of temperature and precipitation characteristics in China. Kang et al. [14] used ensemble averaging of five CMIP6 models to predict the spatial and temporal changes of blue–green water in the Wujiang River Basin, and quantitatively analysed its response to climate and land-use changes. Zhao et al. [15] used a weighting strategy to place constraints on 28 GCMs based on CMIP6 and carried out a simulation prediction analysis of the historical and future runoff change of the Yangtze River Basin. Dai et al. [16] evaluated the simulation ability of 11 climate models based on CMIP6 at Shiyang River Basin using observational data and downscaled their climate data using the Equidistant Cumulative Distribution Function Method (EDCDFm) to obtain the future climate change trend in the basin. He et al. [17] used the daily bias correction (DBC) method based on quantile mapping to explore the applicability of six climate models for the Hetian River Basin, and applied the r-MME (r-Multi-Model Ensemble) averaging method to calculate the bias correction results of each model in order to analyse the characteristics of the future temporal and spatial evolution of temperature and precipitation. Zhang et al. [18] predicted the annual and seasonal changes in temperature and precipitation in Xinjiang in the 21st century under three different scenarios using the data from 20 models, which demonstrated good simulation ability of temperature and precipitation in Xinjiang. It can be seen that, following the introduction of the CMIP6 climate model, many scholars have used various downscaling methods to apply GCMs to their study areas, based on which of the impacts of climate change can be further explored.
Climate change will inevitably cause changes in the global hydrological cycle processes and directly or indirectly affect precipitation, evaporation, runoff, soil, humidity, etc. [19]. It will not only lead to the redistribution of water resources in time and space, and increase the frequency and intensity of extreme disasters such as floods and droughts, but will also increase evapotranspiration, change rainfall and rainfall distribution, and lead to changes in land/crop suitability [20]. In this paper, from the perspective of water resources, the flow-producing area of the Weigan River is taken as an example. Seven GCMs are selected for delta downscaling bias correction; the downscaling results of each meteorological element are processed via the r-MME averaging method; and then the simulation capabilities of temperature and precipitation are evaluated and predicted. Finally, after being processed by the r-MME averaging method, the CMIP6 climate model data are combined with the SWAT model to predict the evolution of the outflow of the Weigan River in the next 30 years under climate change, and to explore the impacts of climate change on flow production in the study area. The results of this study can provide an important theoretical basis for future economic development and ecological civilisation construction at the Weigan River Basin under climate change, as well as for the prediction of water resource supply and demand. At the same time, it also provides a scientific basis for assessing the possible risks of climate change and formulating response policies.

2. Data Sources and Methods

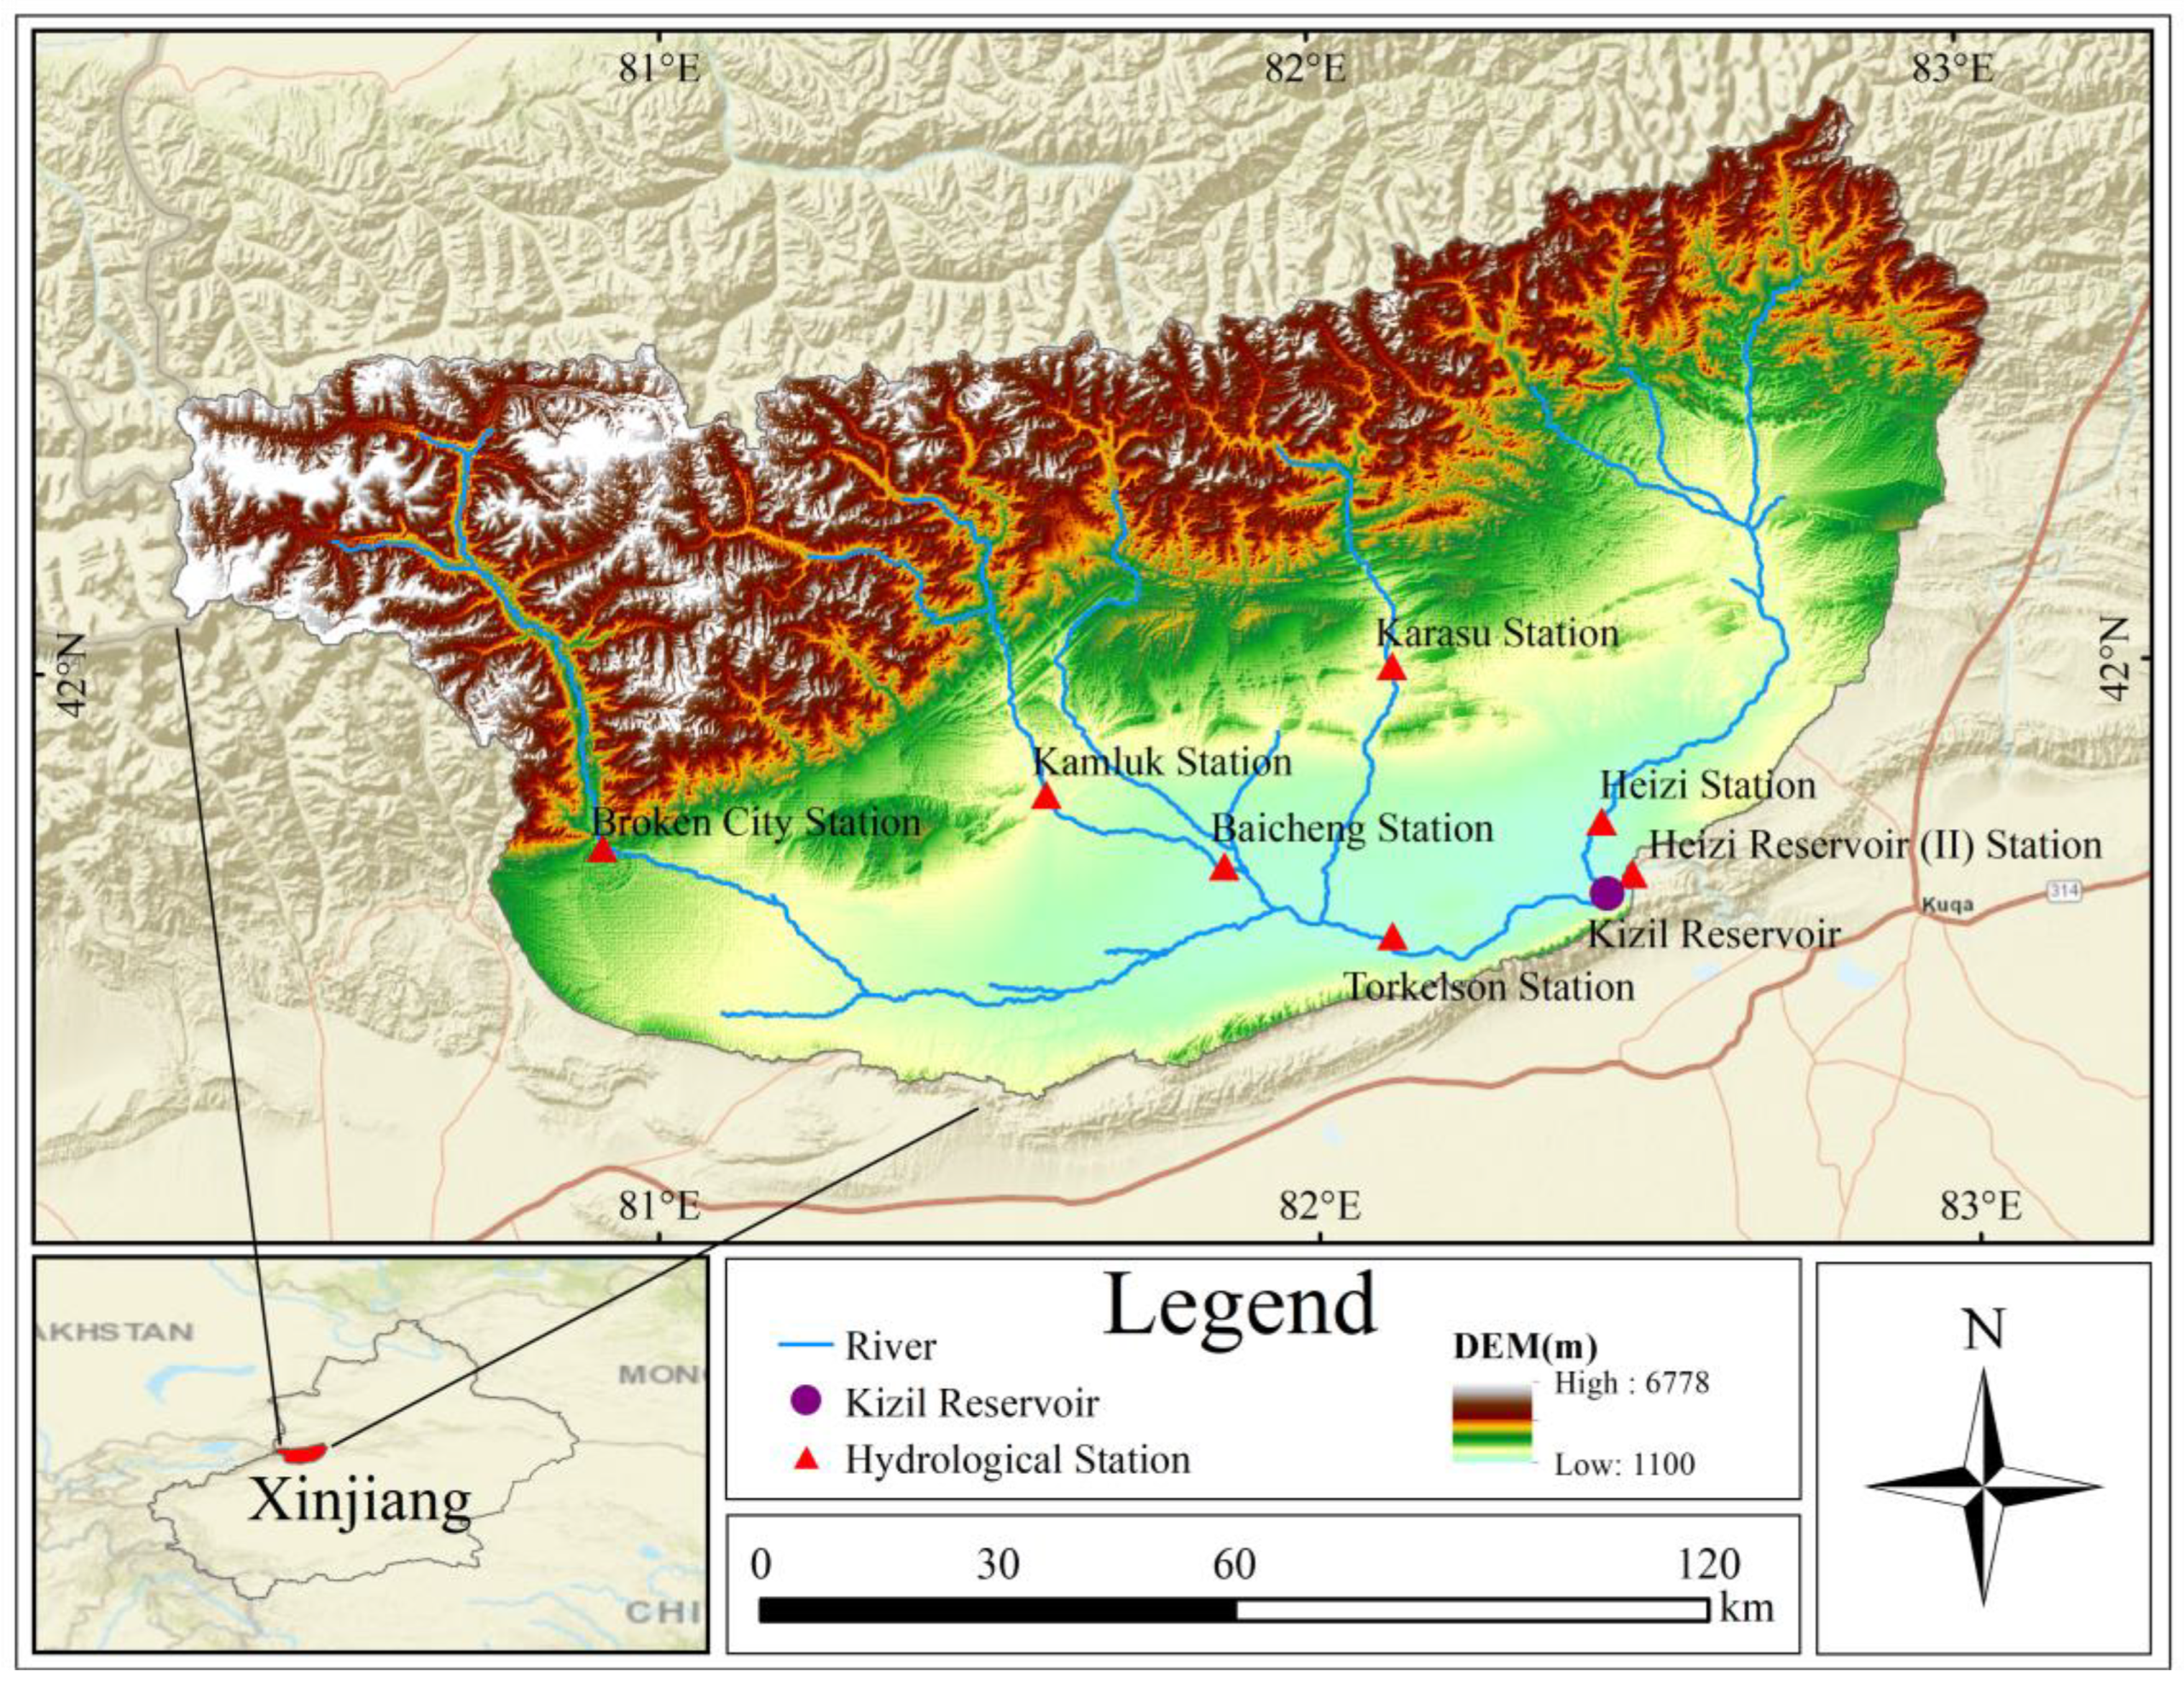
2.1. Overview of the Study Area

The upper watershed of the Weigan River out of the mountain pass (80°15′~83°02′ E, 41°31′~42°39′ N) is located in the Aksu region at the southern foot of the middle section of the Tianshan Mountains in Xinjiang, China (Figure 1). The topography of the basin is high in the northwest and low in the southeast, with elevations above 3500 m in the high mountainous areas in the north. The basin is fan-shaped, with a basin area of about 16,792.56 km2. The study area is located in the hinterland of the Eurasian continent, far from the sea and surrounded by mountains, and it has a continental arid climate with a large temperature difference between day and night, high evaporation and low precipitation. The average multi-year temperature is 1.95 °C, the average multi-year evaporation is 1139.3 mm, the average multi-year precipitation is 382.62 mm, and the distribution of temperature and precipitation is uneven during the year, which is mainly concentrated in June–August. The Weigan River is a first-class tributary of the Tarim River system, and its upper reaches consist of five tributaries that converge in the southeast corner of the Baicheng Basin, namely, Muzati River, Kapuslang River, Tylervichuk River, Karasu River and Heizi River. The recharge sources of the runoff of the Weigan River are mainly three types: glacial meltwater, snowmelt and rainfall, of which glacial meltwater accounts for about 32.40% of the total runoff [21]. The Heizi reservoir hydrological station was originally located 3 km above the dam site of Kizil reservoir, and after the official construction of Kizil reservoir in 1985, the Heizi reservoir hydrological station was relocated down to 1 km below the cross-section of the dam site and renamed the Heizi Reservoir (II) hydrological station.
Baicheng County in the study area has a special geographic location, surrounded by mountains, with a terrain of high north and low south and an arid and semi-arid natural environment, and its land-use type is mainly dominated by grassland and unused land. The area of arable land, forest land and construction land in Baicheng County increased year by year from 2005 to 2015, of which the area of arable land increased by 10.43 km2, the area of forest land increased by 5.62 km2, and the area of construction land increased most significantly by 48.74 km2. However, from 2005 to 2015, the area of grassland and unused land showed a decreasing trend of 43.56 km2 and 35.97 km2, respectively. Water areas showed a trend of increasing and then decreasing, with an increase of 5.92 km2 in 2005–2010 due to the increase in water conservancy facilities, and a decrease of 1.18 km2 in 2010–2015, which was a small decrease and an insignificant change [22]. Although the decrease in grassland and unused land and the increase in construction land are in line with the current situation of regional development, the increase in forest land is the result of the effective implementation of projects such as returning farmland to forest land and afforestation in recent years. However, it is undeniable that in addition to the impact of the rapid expansion of arable land and the significant reduction in grassland caused by the increasing exploitation of natural resources by human beings brought about by the rapid development of society, there are some parts of forest land and unused land in the study area that have been degraded by the effects of climate change.

2.2. Data Sources

The basic data used in this study included hydrological and meteorological data, digital elevation (DEM) data, glacier cataloguing data, soil data, land-use data and CMIP6 climate model data. The hydrological and meteorological data (temperature, precipitation and runoff data) were sourced from the CN05 grid observation dataset, the measured runoff data from the Heizi Reservoir (II) hydrological station, and the inflow runoff data from the Kizil Reservoir. The DEM data use SRTMDEM raw elevation data with a precision of 90 m, sourced from the Geospatial Data Cloud Platform. The glacier cataloguing data included the first and second glacier cataloguing data sourced from the National Glacier Frozen Soil Desert Science Data Center. The soil data were drawn from the 1:100,000 soil data provided by the Nanjing Soil Institute of the Second National Land Survey. The land-use data were adopted from the 1980 and 2000 national land-use data, with a resolution of 30 m, which were sourced from the Geospatial Data Cloud Platform. A global climate model is an important tool for predicting future climate change [23], and the model used in this study was sourced from the latest 6th International Coupled Model Comparison Program (CMIP6). This study selected 7 models from different countries, climate centres and climate scenario simulations (Table 1), and selected 4 greenhouse gas emission scenarios, including SSP1–2.6, SSP2–4.5, SSP3–7.0 and SSP5–8.5.

2.3. Research Methodology

2.3.1. Delta Change Method

In this study, the delta change method was used for bias revision downscaling. The delta correction method assumes that model biases (absolute increase in temperature, relative rate of change in precipitation, etc.) do not change over time and applies them to point or regional historical observations to obtain point or regional future climate change scenarios. This method, as a part of the Bias Correction and Spatial Decomposition (BCSD) method, is mostly applied to correct data in the mean state, and has been widely used in research studies because of its relatively simple principle and high accuracy [24,25]. The specific calculation formulae are as follows:
Temperature:
(1) Calculation Bias
d e l t a m o n i = T ¯ M , m o n i T ¯ O , m o n i
(2) Monthly Revisions
T C o r , M , m o n i = T M , m o n i d e l t a m o n i
Precipitation:
(1) Calculation Bias
d e l t a m o n i = P ¯ O , m o n i / P ¯ M , m o n i
(2) Monthly Revisions
P C o r , M , m o n i = P M , m o n i × d e l t a m o n i
where delta is the reconstructed future gridded model data series, i.e., the month-by-month deviation of the model data from the observed data within a historical period; T ¯ m o n i denotes the monthly average gridded temperature series; P ¯ m o n i represents the month-by-month mean gridded precipitation series; M and O represent model data and observation data, respectively; and Cor represents the corrected temperature series.

2.3.2. r-Multi-Model Ensemble

Due to the systematic errors and uncertainties in the data of each climate model, the effects on different meteorological elements are not consistent. A single “optimal” model has a large bias, which often has a large impact on the simulation and assessment of future climate change. Zhang et al. [26] and others have shown that the results of ensemble averaging of model data are better than most individual models. Therefore, this study adopted the Multi-Model Ensemble (MME) averaging method based on Pearson’s r-correlation coefficient (r-MME) to eliminate previous variability in and uncertainty of individual model data, reduce systematic errors and, thus, improve the accuracy of future climate change prediction. The calculation formula is as follows:
F r M M E = i = 1 n F i × r i / i = 1 n r i
where F r M M E is the result of the r-MME averaging method based on Pearson’s r-correlation coefficient; Fi is the simulation result of each single mode; r i / i = 1 n r i is the weight based on the correlation coefficient r for the corresponding pattern; and ri is the correlation coefficient between each single model and the observation data within a historical period.

2.3.3. Building A SWAT Hydrological Model

A SWAT (soil and water assessment tool) model is a distributed watershed hydrological model based on GIS [27]. In recent years, this type of model has been developed rapidly and has been widely used at home and abroad. Zhao et al. [28] constructed a drought assessment model, SWAT-PDSI, based on the Palmer Drought Severity Index (PDSI) and a SWAT model, and analysed the spatial and temporal distribution characteristics and frequency characteristics of drought disasters in the Weihe River basin. This study constructed a hydrological model of the mountainous area of the Weigan River based on the SWAT platform and simulated the runoff from the Weigan River out of the mountain to recreate its hydrological process. On this basis, the SWAT model was combined with the CMIP6 climate model data to predict the future runoff evolution trend.
The modelling process of the SWAT model was mainly divided into the following steps: Firstly, we imported the DEM data, determined the catchment threshold of the study area and performed operations such as watershed and water system extraction and sub-watershed division. Secondly, we imported data from a pre-constructed soil-type database and land-use database for easy association with the constructed model in the later stage. Finally, we divided the hydrological response units in the study area and completed the model construction work. In terms of model tuning, the optimal operating parameters for localising the SWAT model in the Weigan River Basin have been described in detail in a research article by Su et al. [21], and the same parameters were used in this study. After completing the above steps, it was necessary to import the pre-downloaded and processed historical temperature and precipitation model data into the SWAT model for operation to verify its feasibility in order to obtain a SWAT model suitable for the prediction of future runoff.

2.3.4. Slope Change Ratio of Accumulative Quantity

The SCRAQ (Slope Change Ratio of Accumulative Quantity) was first proposed by Wang [29], and many scholars [30,31] have improved and applied it. This method is mainly based on the linear relationship between runoff, precipitation and evaporation during the period with an abrupt change in the year before and after, and then uses the slope change rate of each cumulative amount to calculate their contribution rate to the variation in runoff. The calculation formula is as follows:
The Contribution Rate of Precipitation Changes to Runoff Changes:
C P = R S P / R S R = S P a / S P b 1 / S R a / S R b 1
The Contribution Rate of Temperature Changes to Runoff Changes:
C T = R S T / R S R = S T a / S T b 1 / S R a / S R b 1
The Contribution Rate of Human Activities to Runoff Changes:
C H = 1 C P C T
where CP, CT and CH represent the contribution rates of changes in precipitation, temperature and human activities to changes in runoff, respectively. RSP, RSR and RST represent cumulative precipitation, cumulative runoff and cumulative temperature slope change rate, respectively. Spb and Spa respectively, represent the slopes of the annual linear relationship of cumulative precipitation in the two periods before and after the inflection point, and SRb, SRa, STb and STa are the same.

3. Results

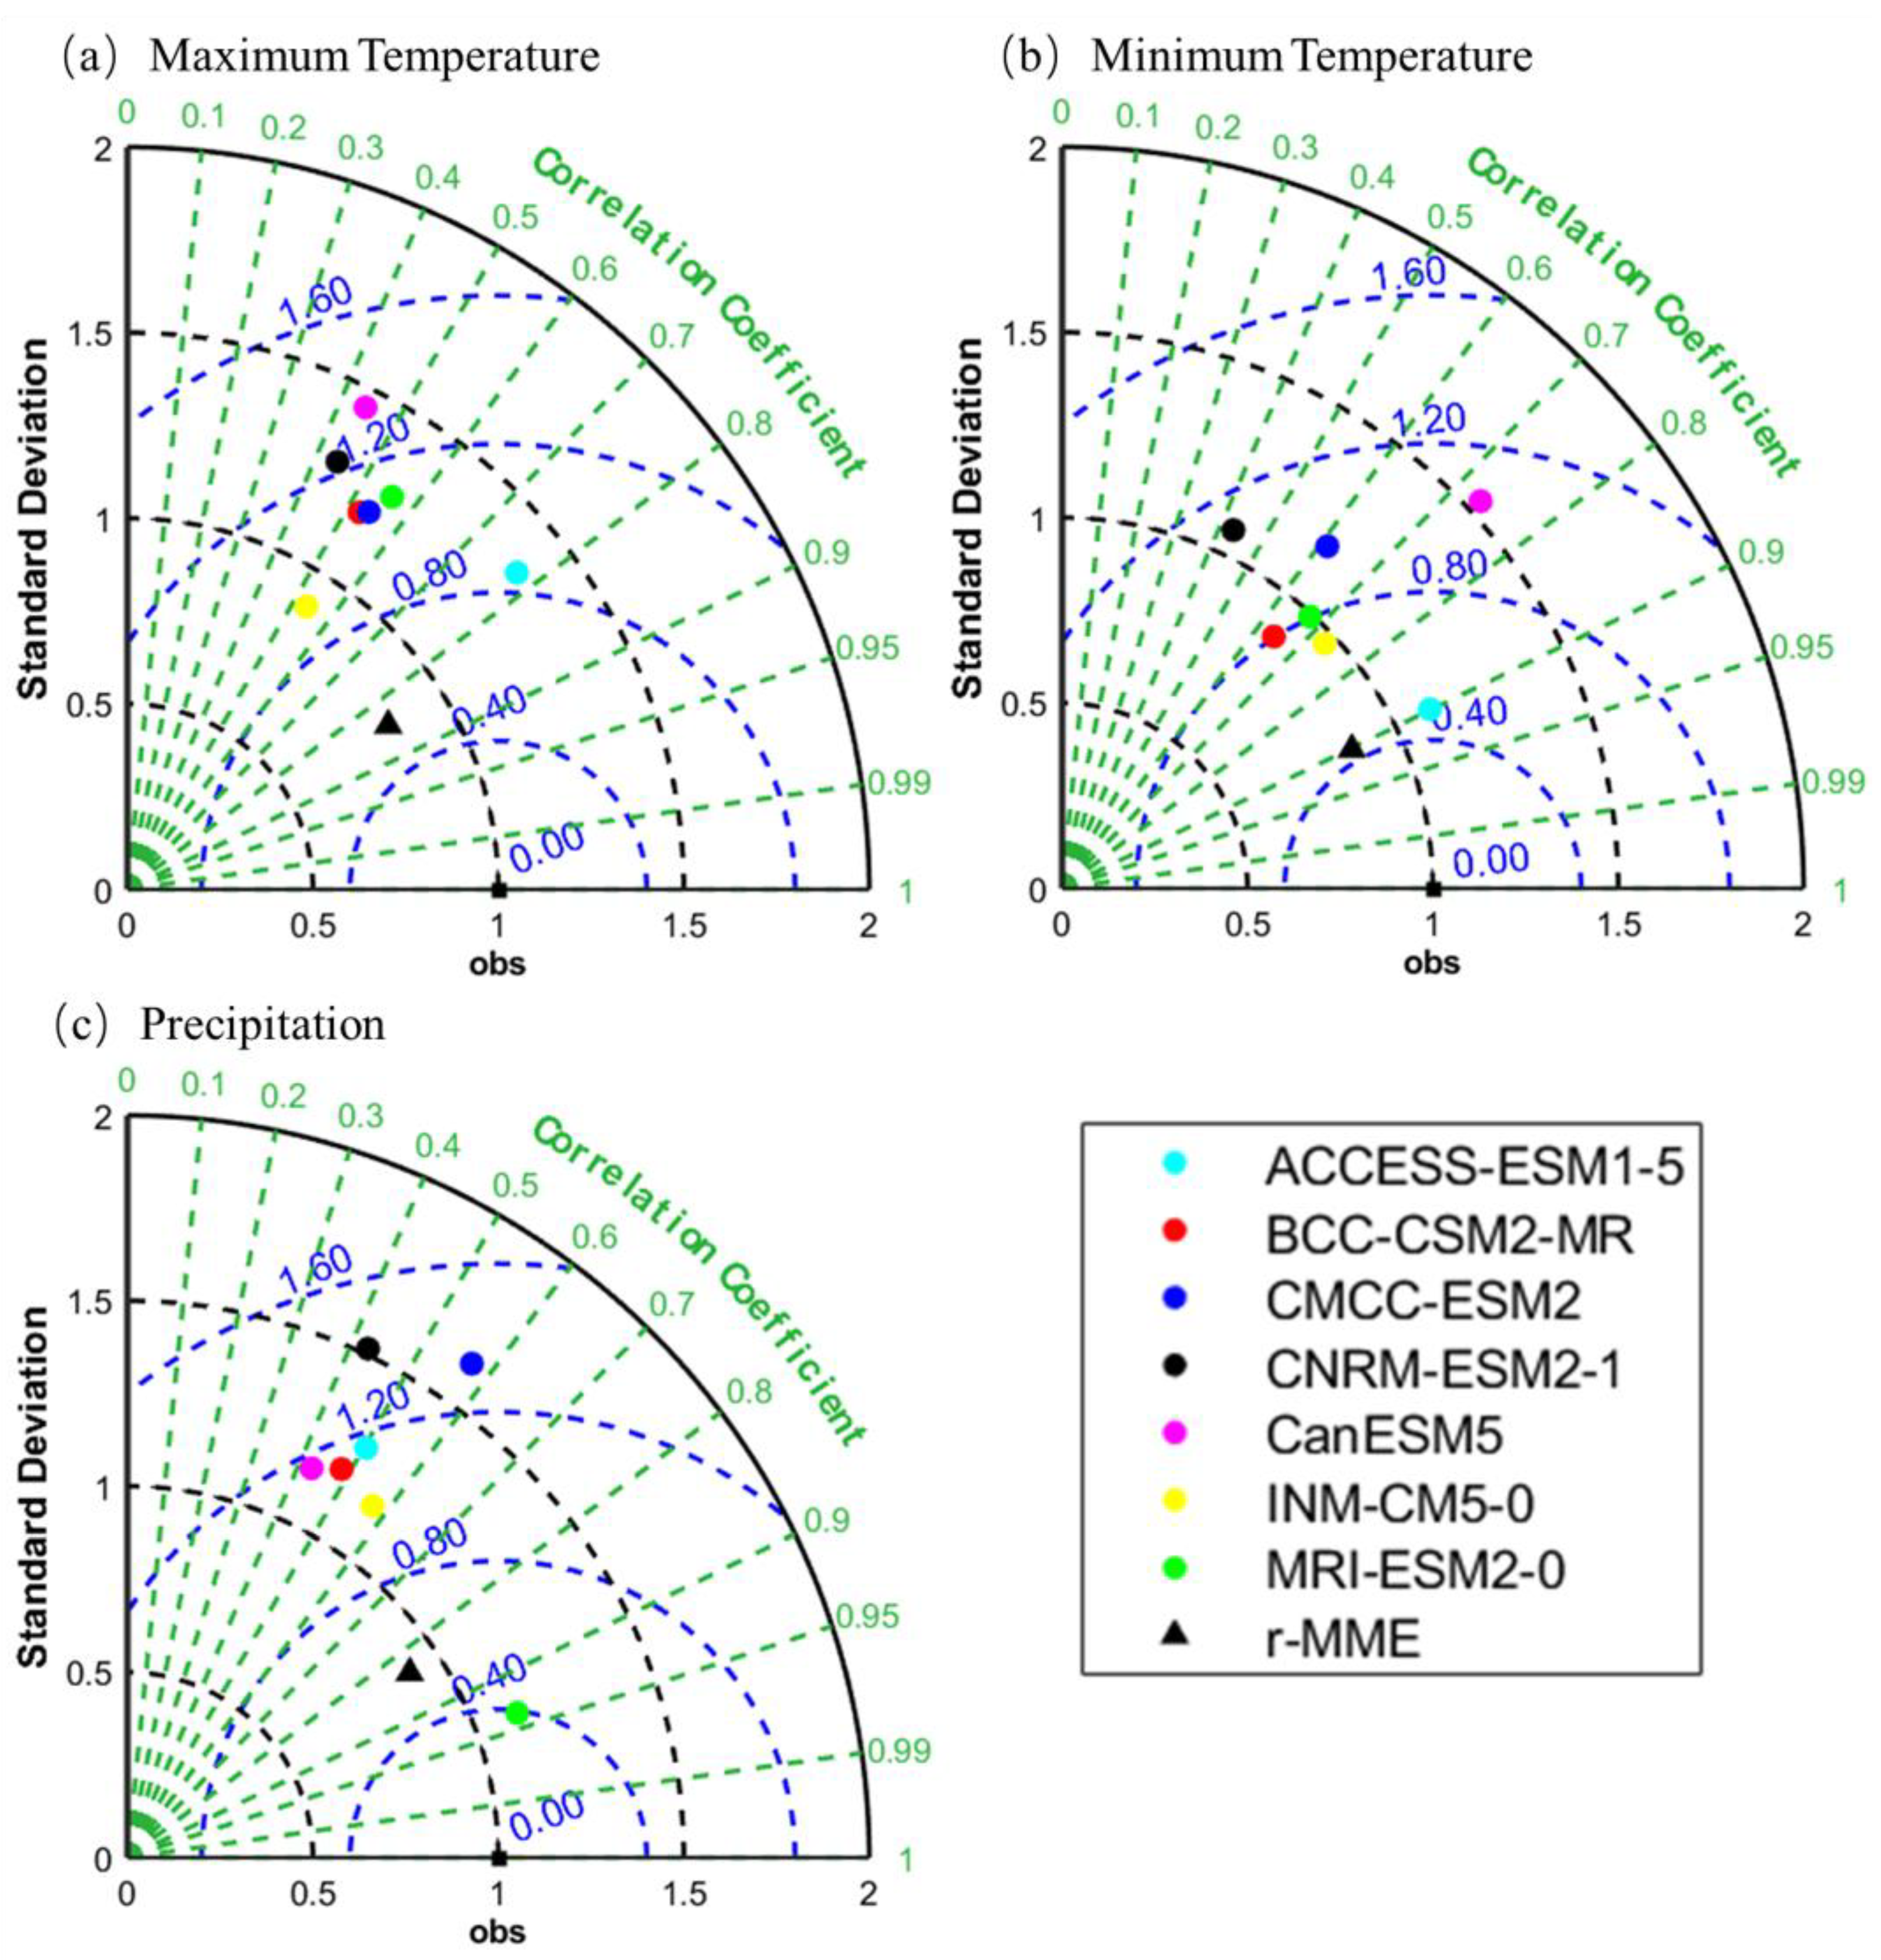
3.1. Evaluation of Temperature and Precipitation Simulation Capability and Future Prediction
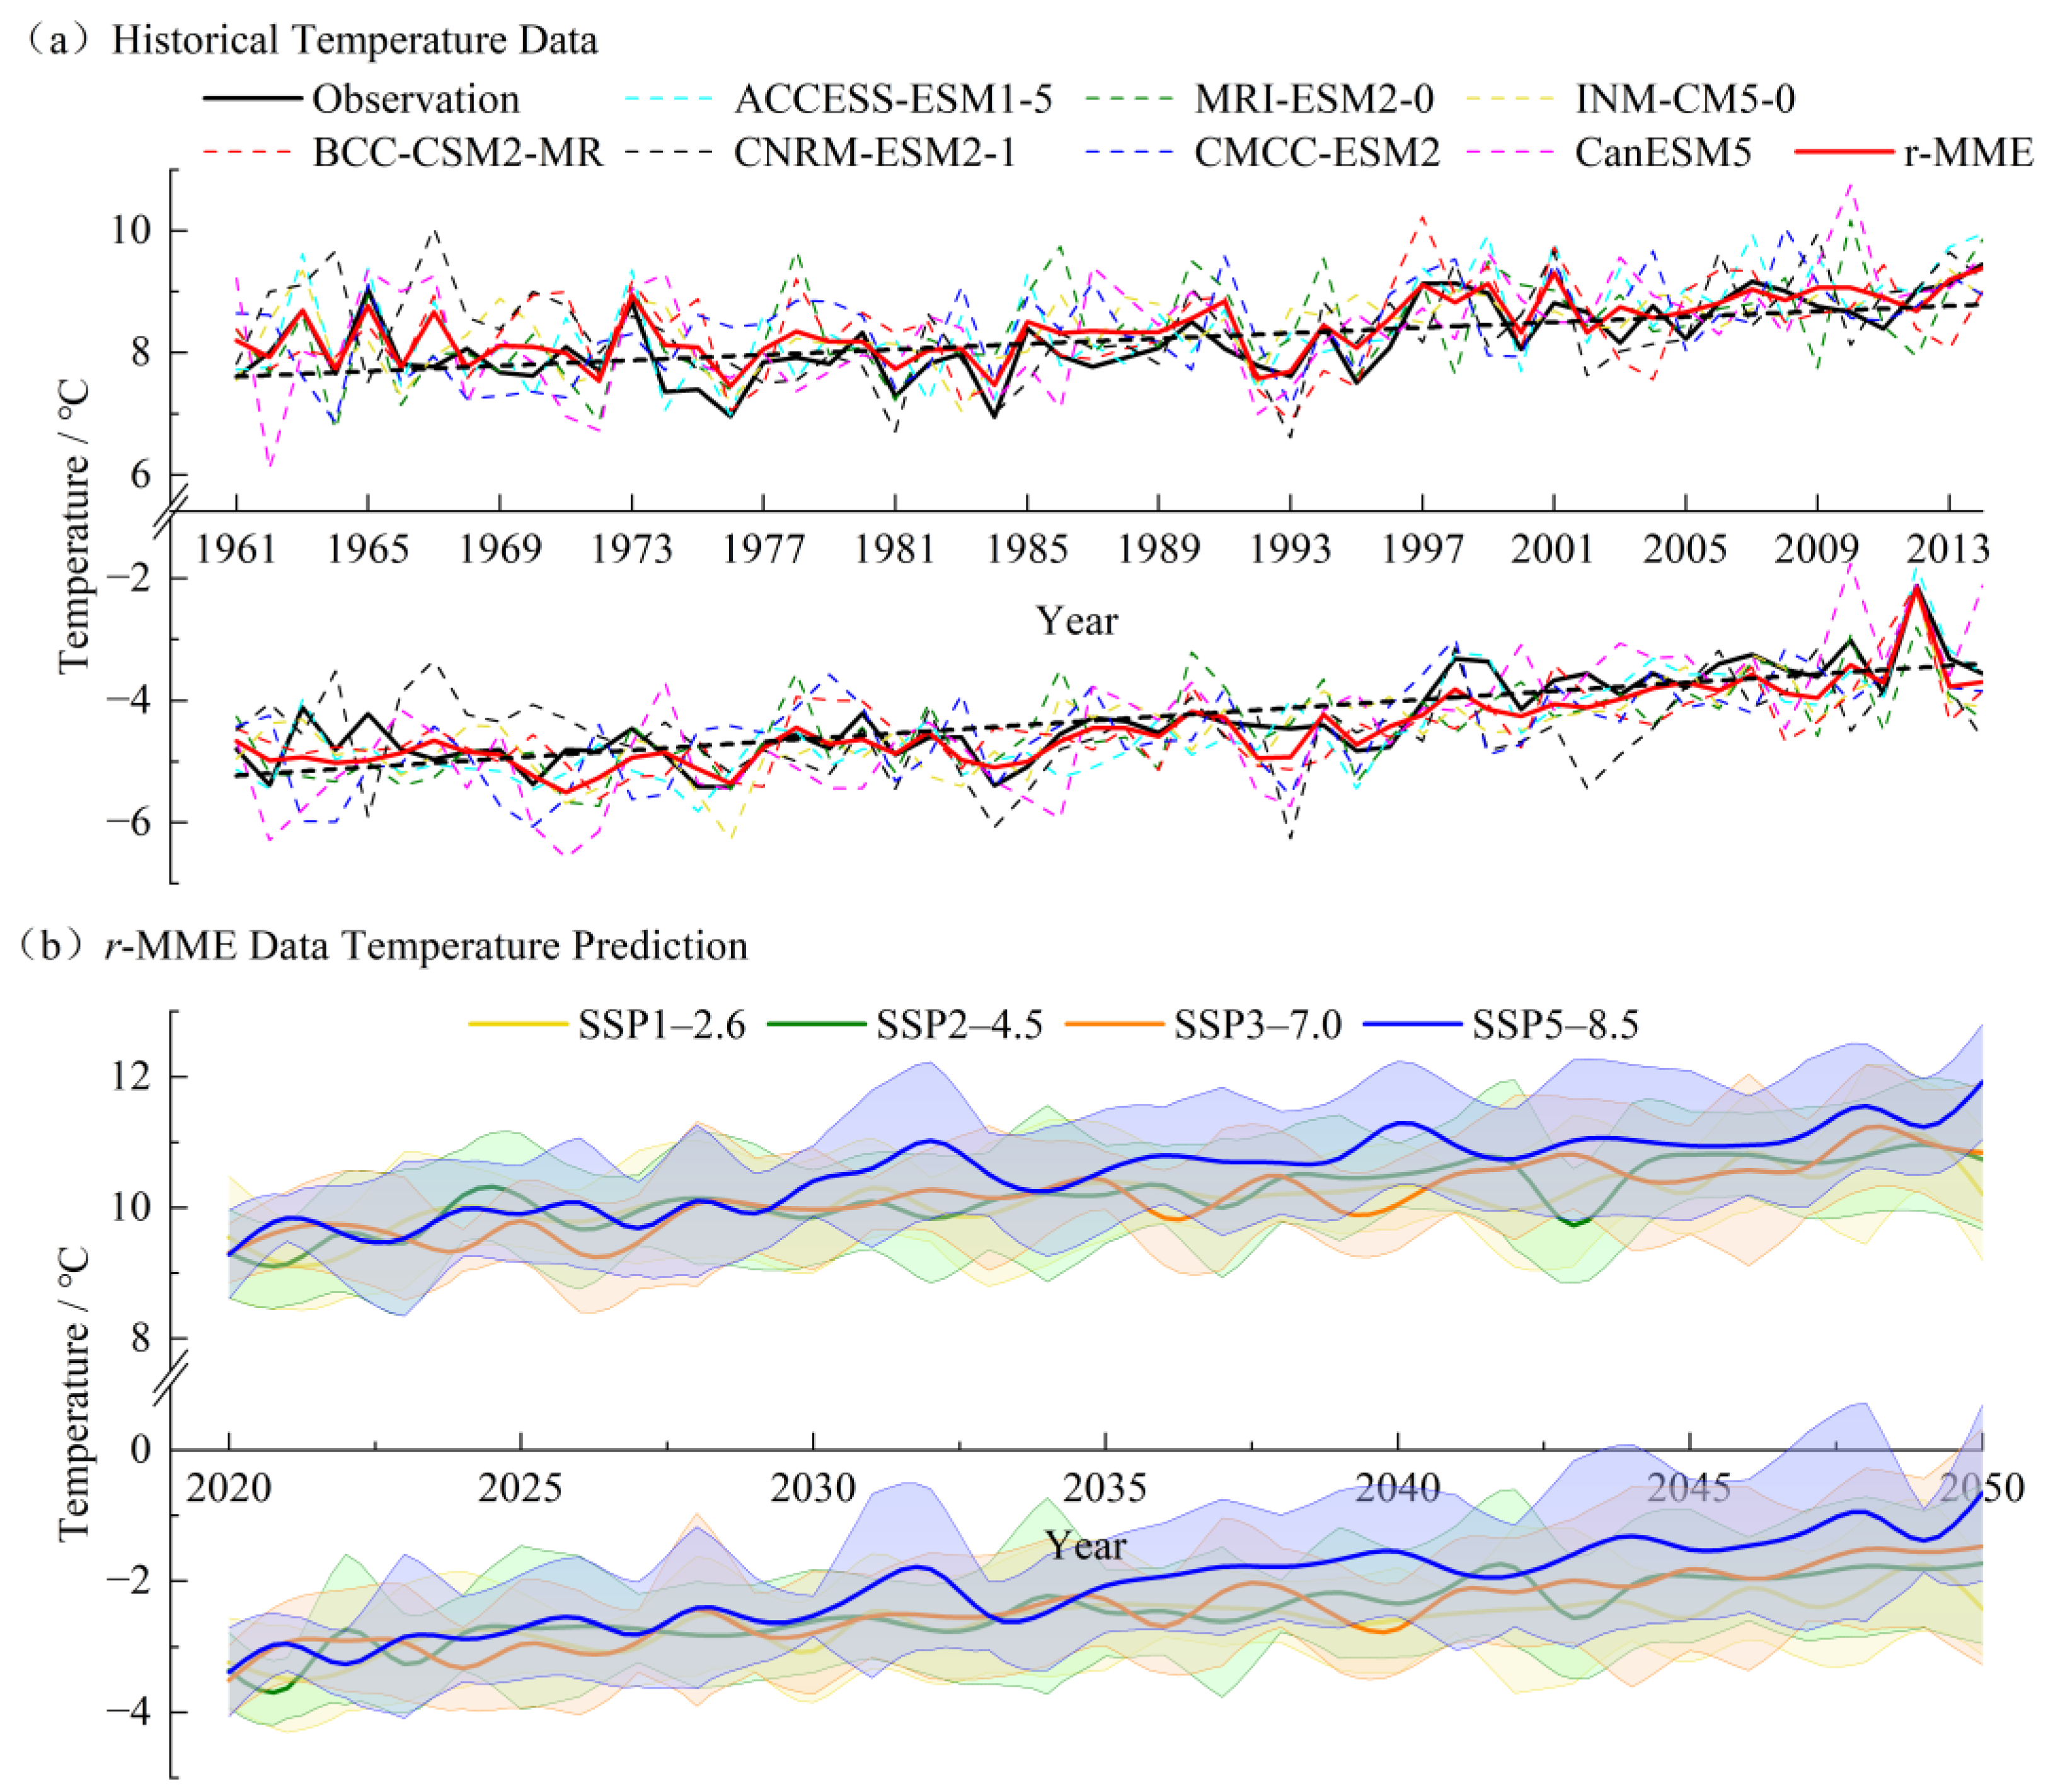
3.1.1. Temperature

The simulation ability of the selected climate models, the r-MME maximum and minimum temperature data was evaluated by using Taylor diagrams (Figure 2a,b) to more comprehensively assess the simulation results after downscaling the data of each model. Compared with the maximum temperature observation series, the simulation effect of the ACCESS-ESM1-5 model in terms of maximum temperature is relatively better, and the correlation coefficient can reach up to 0.776, showing a strong correlation with the observed data. The simulation effect of the CNRM-ESM2-1 model is relatively poorer than that of the CanESM5 model, and the correlation coefficient only reaches about 0.440. The simulation effects of the remaining four models (BCC-CSM2-MR, INM-CM5-0, MRI-ESM2-0 and CMCC-ESM2) are not much different, with correlation coefficients ranging from 0.524 to 0.559, thus showing moderate correlations with the observed data. In the lowest-temperature simulation scenario, the ACCESS-ESM1-5 model has the best simulation effect, with a strong correlation coefficient as high as 0.899. The CNRM-ESM2-1 model has, relatively, the worst simulation effect, with a weak correlation coefficient, and the correlation coefficients of the INM-CM5-0 model and the CanESM5 model are around 0.730, demonstrating a good simulation effect. The correlation coefficients of the remaining three models (MRI-ESM2-0, BCC-CSM2-MR and CMCC-ESM2) are between 0.613 and 0.674, showing relatively good correlations. The r-MME correlation coefficients of the maximum and minimum temperature data are 0.846 and 0.902, respectively, and the correlations are all relatively significant. In summary, the simulation effect of the models for the minimum temperature is better than that for the maximum temperature, and there are some differences in the simulation effects of different GCMs regarding the maximum and minimum temperatures. The simulation results of r-MME data for temperature are better than single-model data.
A comparison of temperature changes in the study area from 1961 to 2014 based on the observed data, each model’s data and r-MME data is shown in Figure 3a. The maximum and minimum temperature data simulated by each GCM showed a trend of fluctuating and increasing, with the annual average maximum temperatures ranging from 8.39 °C to 8.43 °C and the annual average minimum temperatures ranging from −4.49 °C to −4.44 °C, and the upward trend of the observed series of minimum temperatures was more significant than that of the maximum temperature series. The annual average maximum and minimum temperatures of the observed series were 8.20 °C and −4.31 °C, respectively. In the observed temperature series, the maximum temperature increased to 9.45 °C in 2014, with an average rate of increase of 0.03 °C/a. The minimum temperature increased from −4.80 °C to −3.56 °C, with an average rate of increase of 0.02 °C/a. The annual mean maximum and minimum temperatures of the r-MME data were 8.40 °C and −4.47 °C, respectively, and compared to the observed series, the maximum temperature of the r-MME series was higher by 0.2 °C and the minimum temperature was lower by 0.16 °C. The projected temperature change using the r-MME data for 2020–2050 (Figure 3b) demonstrates that the maximum and minimum temperatures based on the r-MME data under the four radiative forcing scenarios show an increasing trend. The average annual increase rates in maximum temperature are 0.02 °C/a, 0.05 °C/a, 0.05 °C/a and 0.09 °C/a. The average annual increase rates in minimum temperature are 0.03 °C/a, 0.05 °C/a, 0.07 °C/a and 0.09 °C/a. Among them, the increase rates in maximum temperature are closer under the SSP2–4.5 and SP3–7.0 scenarios. The overall increase in minimum temperature is greater than that of maximum temperature in the simulated future period. Under the SSP5–8.5 scenario, the r-MME minimum temperature increases from −3.38 °C in 2020 to −0.66 °C in 2050, which is the fastest growth rate.

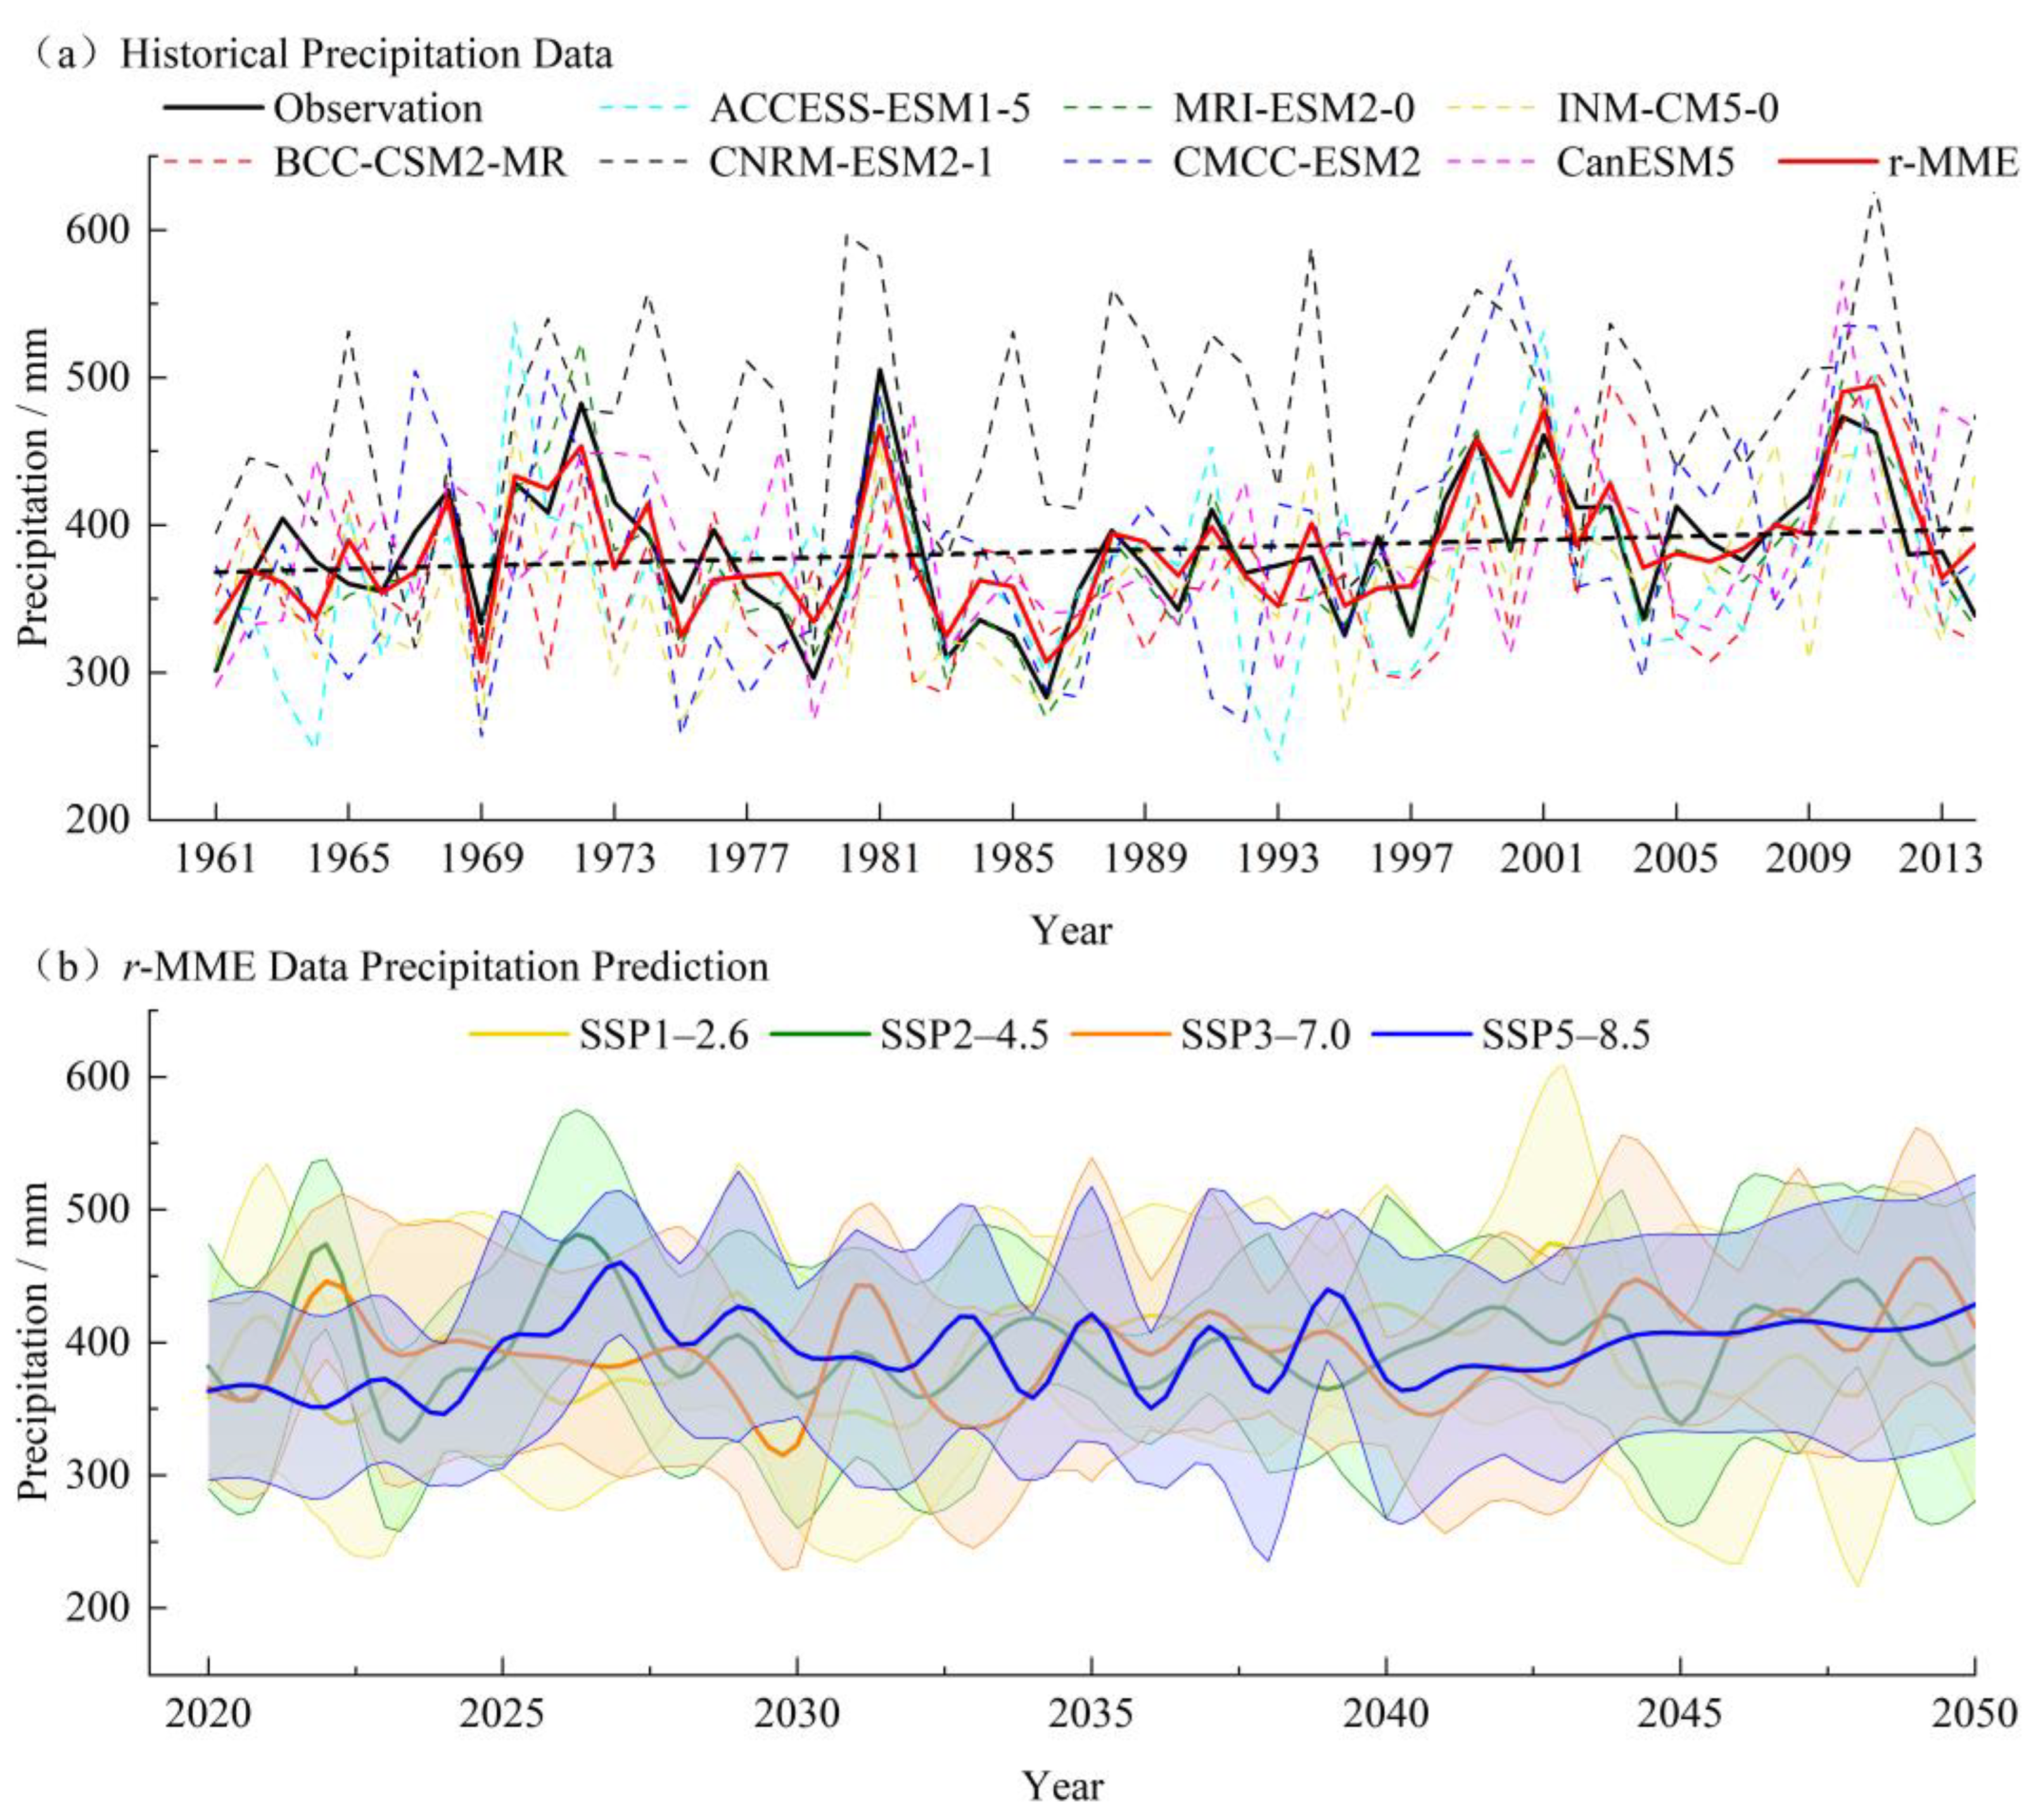
3.1.2. Precipitation

When comparing the precipitation data simulated by each model, the r-MME data and the assessment of the observed data (Figure 2c), it is clear that the simulation effect of the precipitation data simulated by the MRI-ESM2-0 model is relatively the best, with a correlation coefficient as high as 0.937, showing strong correlation with the observation series. The simulation effect of the CNRM-ESM2-1 model and the CanESM5 model is relatively the poorest, with a correlation coefficient of only 0.428. The correlation coefficients of the precipitation data of the remaining four models (ACCESS-ESM1-5, INM-CM5-0, BCC-CSM2-MR and CMCC-ESM2) are in the range from 0.483 to 0.572, thus showing moderate correlations. The r-MME precipitation data have a correlation coefficient of up to 0.837, which shows strong correlation. It can be seen that most of the GCMs generally simulate temperature data better than precipitation data, except for individual models that optimally simulate precipitation. The r-MME method can reduce the variability among models, which enables the simulation results to have higher stability and accuracy compared to the use of single-model data.
A comparison of precipitation variations in the historical observed data, the data of each model and the r-MME data in the study area is shown in Figure 4a. The observed precipitation series showed a fluctuating upward trend, increasing from 301.55 mm in 1961 to 338.94 mm in 2014, with an average growth rate of 0.71 mm/a. The average annual precipitation during the historical period was 382.62 mm. The annual precipitation simulated by the GCMs ranged from 361.54 mm to 469.64 mm. The CNRM-ESM2-1 model’s precipitation value is overall 87.02 mm larger than the observed value, and the rest of the model data basically fluctuated up and down around it. However, the CNRM-ESM2-1 model data were not excluded from the r-MME of the GCM data because the trend of the CNRM-ESM2-1 model is more similar to that of the observed series and most of the values of the precipitation data predicted by the other models are smaller than those of the observed data. The prediction of future precipitation changes based on the r-MME data (Figure 4b) shows an increasing trend in r-MME precipitation under all radiative forcing scenarios from 2020 to 2050. Under the SSP1–2.6 scenario, the r-MME precipitation increases to 361.56 mm in 2050, which is the slowest increase of 2.63 mm. The increase under the SSP2–4.5 scenario and SSP3–7.0 scenario is 14.89 mm and 45.09 mm, respectively, during the next 30 years. Under the SSP5–8.5 radiative forcing scenario, it increases from 363.60 mm in 2020 to 428.63 mm in 2050, with an average annual increase of 2.17 mm, which is the fastest growth rate.

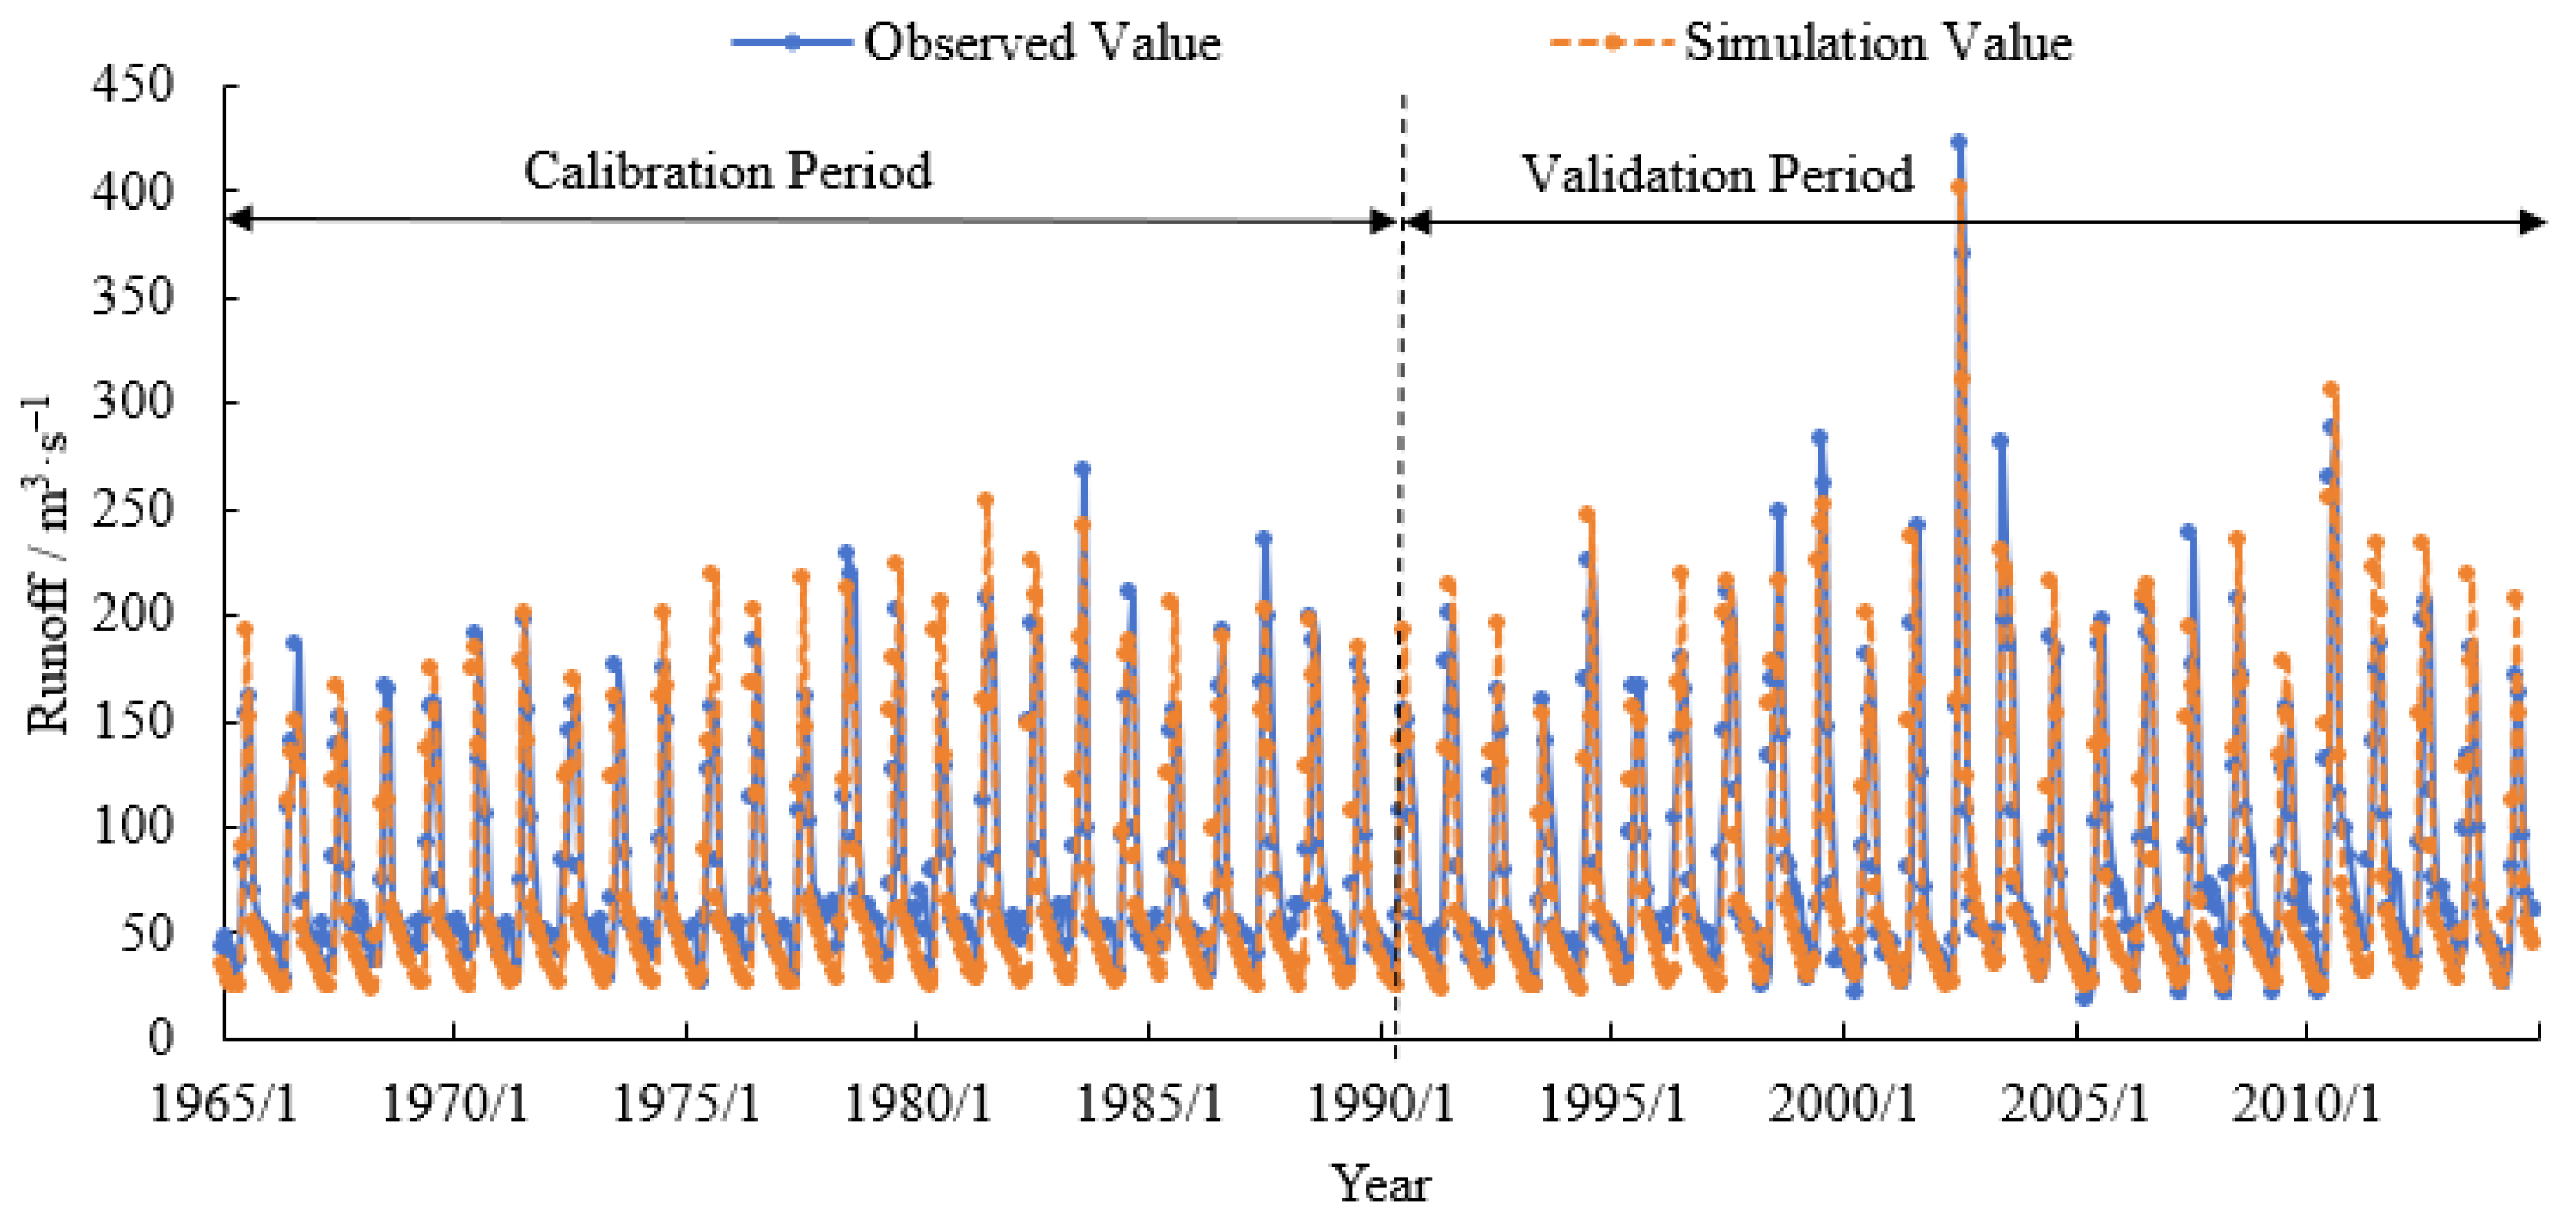
3.2. Evaluation of Model Simulation Results

In this study, the period 1961–1964 was selected as the model warm-up period, the period 1965–1989 as the model calibration period, and the period 1990–2014 as the model validation period. The monthly runoff of the study area in the last 50 years was simulated to recreate its hydrological process in order to construct a SWAT model applicable to the upper watershed of the Weigan River outflow. It should be noted that the measured runoff from the Heizi Reservoir (II) hydrological station since August 1991 is affected by the regulating effect of the Kizil Reservoir, and the dam site section and the Heizi Reservoir (II) hydrological station are close to each other, with a distance of only about 1 km. Therefore, in this study, when simulating and verifying the SWAT model upstream of the Weigan River outlet, the inflow flow of the Kizil Reservoir was used to replace the flow data measured at the Heizi Reservoir (II) hydrological station in the same period. The best simulation results of the model could be obtained after the model was adjusted and run.
From the simulation results of the multi-year monthly average flow (Figure 5), it can be seen that the difference between the simulated runoff value and the measured runoff value is relatively small, and the two runoff series’ curves are well-fitted. This indicates that the constructed SWAT model for the upper reaches of the Weigan River outflow can relatively accurately describe the annual runoff process in this study area. And from the evaluation of the model’s simulation results of monthly runoff for each time period (Table 2), it can be seen that the NSE coefficient is >0.75, the RSR is <0.50, the PBIAS is <±10%, and their simulation results are excellent. This indicates that the SWAT model has good applicability in the study area and can be used to predict future runoff evolution trends in the next step.

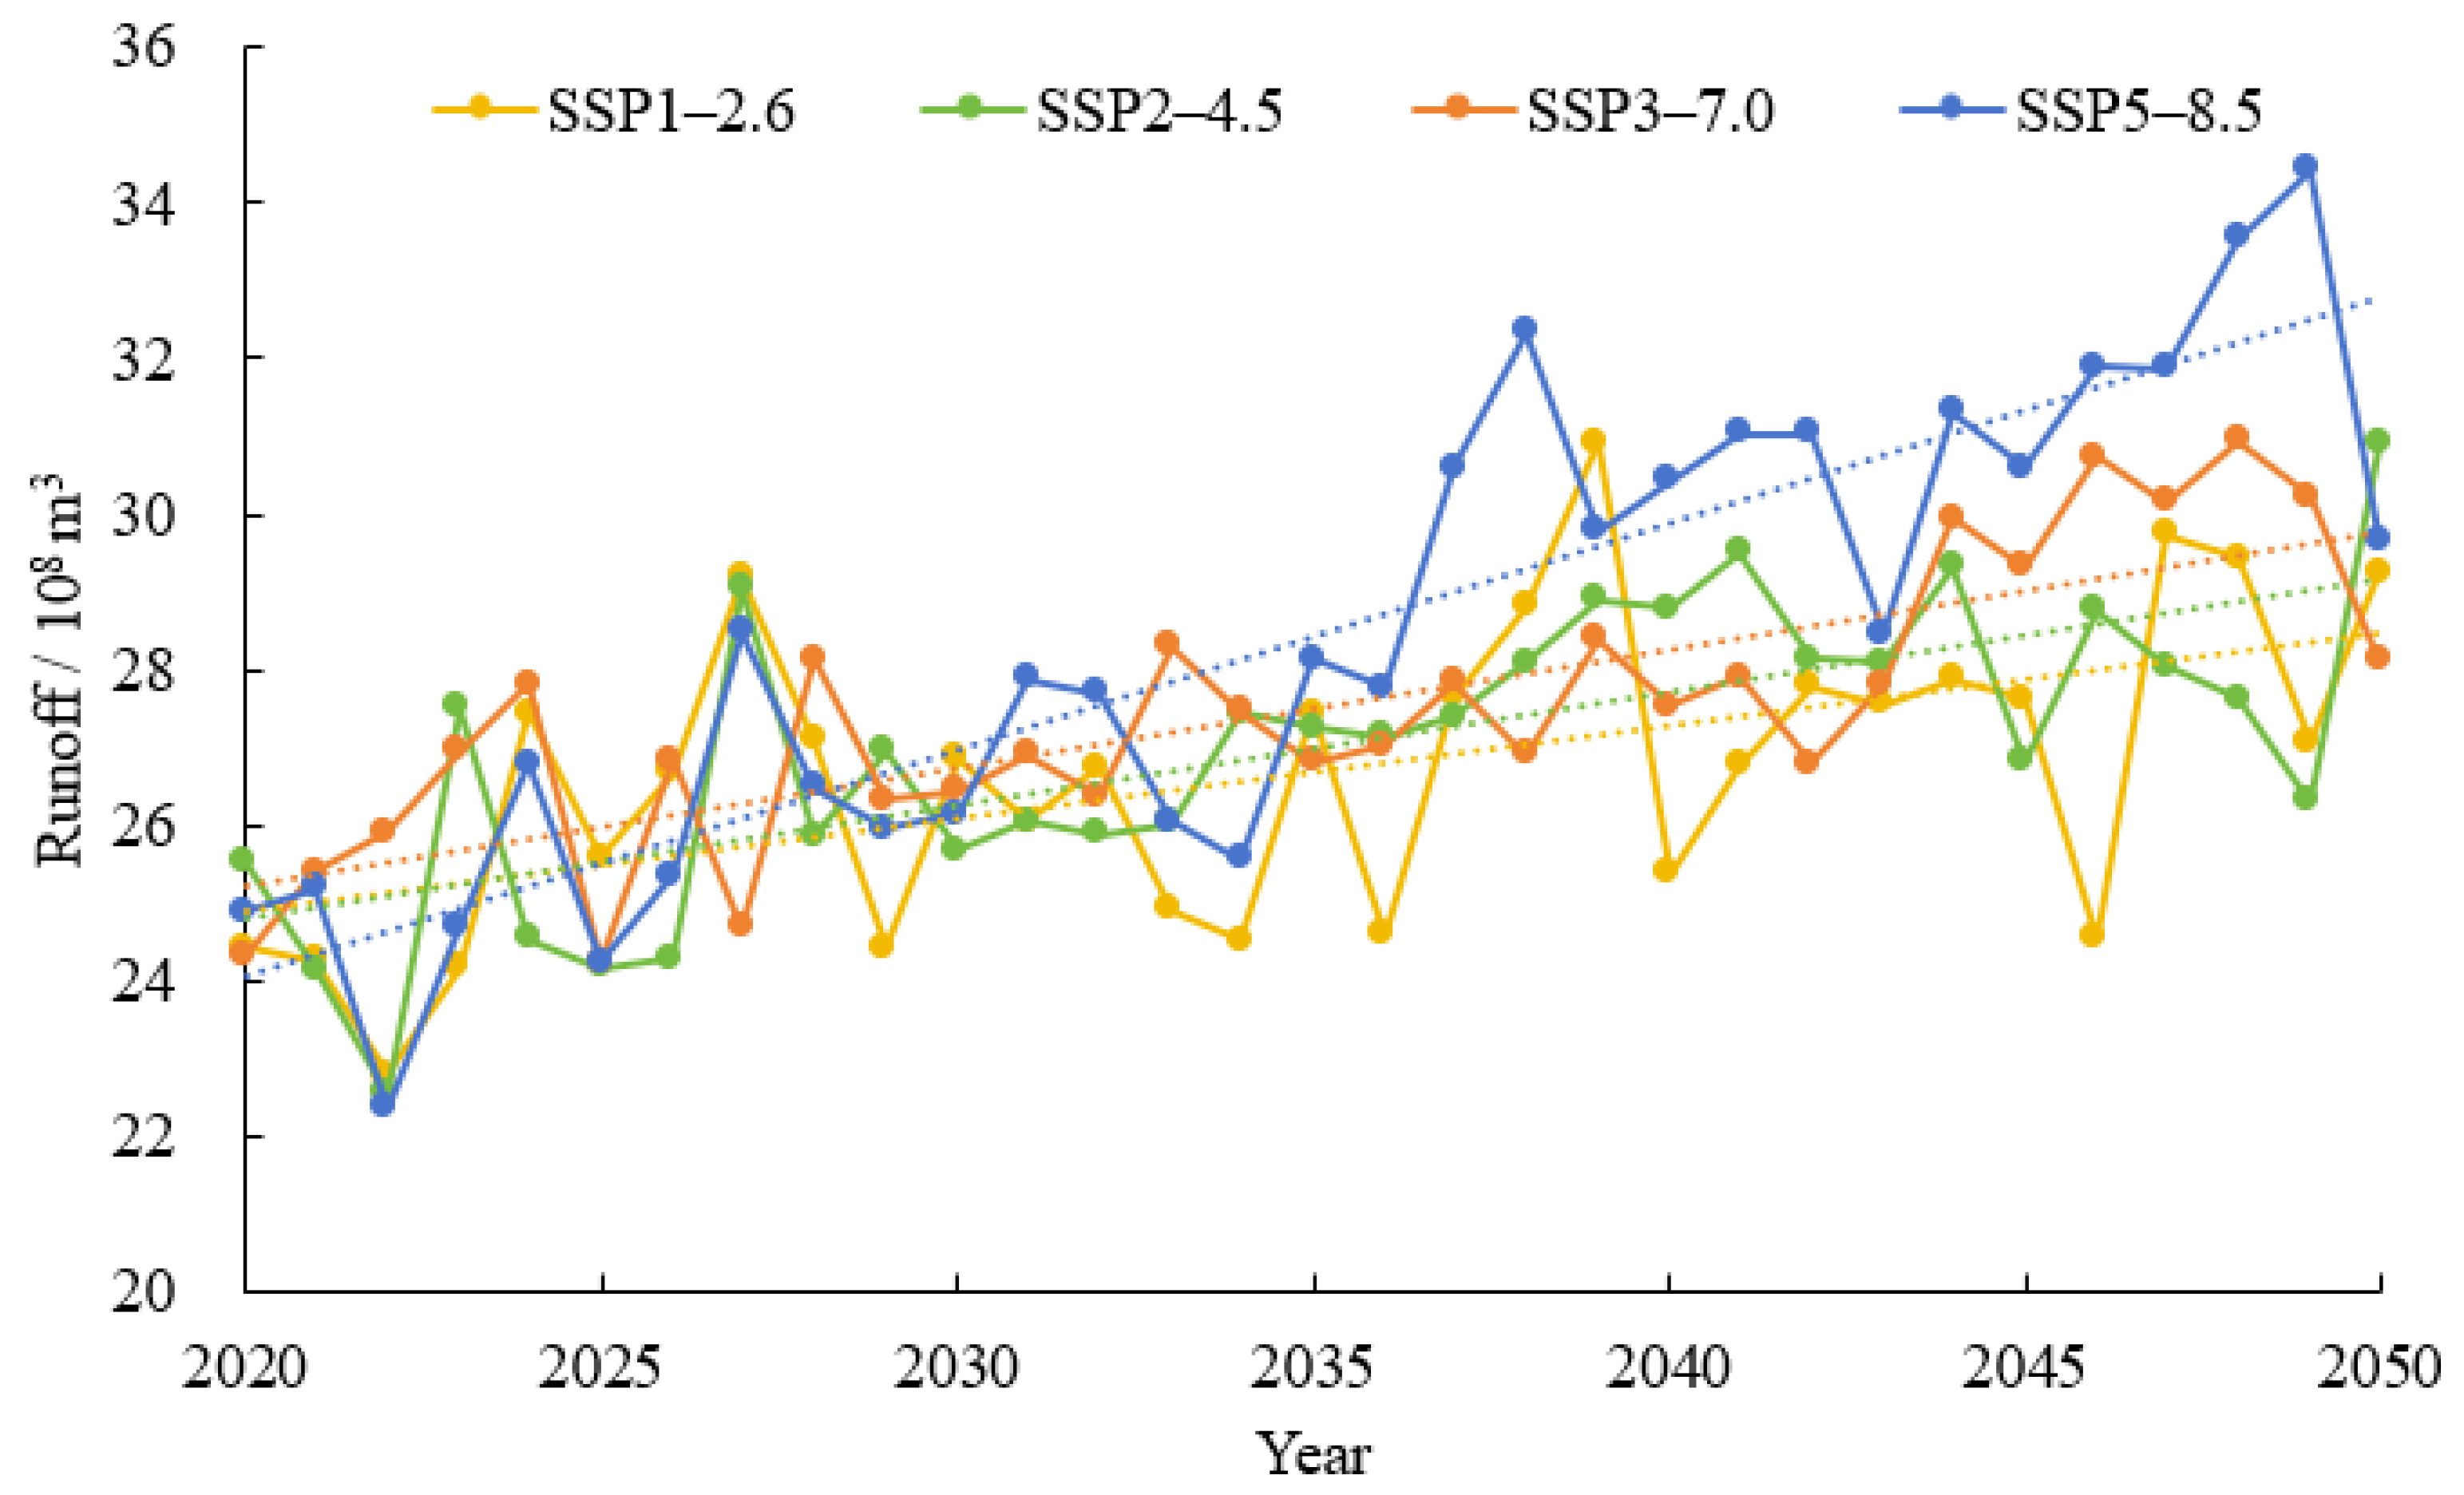
3.3. Prediction and Analysis of Future Runoff Evolution Trends

The r-MME temperature and precipitation data under four different radiative forcing scenarios were inputted into the well-constructed SWAT model to predict the future evolution of outflow runoff from 2020 to 2050 (Figure 6). From the statistics of the runoff data output by the SWAT model, it can be seen that the runoff out of the mountain in the upper Weigan River Basin under the four radiative forcing scenarios is maintained at 25.68~30.89 × 10⁸ m3 in 2030 and 2050, which is an increase of 1.35~21.91% compared with the current runoff. Under the four different radiative forcing scenarios of SSP1–2.6, 2–4.5, 3–7.0 and 5–8.5, the average annual flow in the next 30 years shows an increasing trend, with an increase of 84.58 m3·s−1, 85.52 m3·s−1, 87.13 m3·s−1 and 90.01 m3·s−1, respectively. The average annual flow from 2036 to 2050 increases by 6.89%, 9.37%, 7.77% and 18.82%, respectively, compared to 2021 and 2035. Under the SSP2–4.5 radiative forcing scenario, the average annual outflow runoff of the Weigan River increases from 25.52 × 10⁸ m3 in 2020 to 30.89 × 10⁸ m3 in 2050, which is an increase of 5.37 × 10⁸ m3 or 21.03% compared to 2020, with the fastest growth rate being about 1.79 × 10⁸ m3/10a. The SSP1–2.6 scenario has the next fastest growth rate of future runoff out of the mountain of about 1.61 × 10⁸ m3/10a. The SSP3–7.0 radiative forcing scenario has the slowest growth rate of future runoff, at only 1.26 × 10⁸ m3/10a. And although the growth rate of the SSP5–8.5 scenario is 1.59 × 10⁸ m3/10a, the fluctuation of its future runoff is the largest during the next 30 years, with the runoff out of the mountain as high as 34.41 × 10⁸ m3 in 2049. It can be seen that the annual runoff of the upper Weigan River increases with an increase in radiative forcing intensity, and the different radiative forcing scenarios show different future runoff evolutions during the period 2020–2050.The future runoff predicted by the SSP3–7.0 radiative forcing scenario is relatively large, and the runoff predicted by the other three radiative forcing scenarios is similar during the same period. For the whole period, as the radiative forcing intensity increases, the upward trend of future runoff is more pronounced. As shown in Figure 6, the SSP5–8.5 radiative forcing scenario shows the most obvious increase in annual runoff in the study area, followed by the SSP3–7.0 radiative forcing scenario, and then the SSP2–4.5 and SSP1–2.6 scenarios.
From the interdecadal changes in future runoff out of the mountain (Table 3), it can be seen that under different radiative forcing scenarios, the runoff from the Weigan River increases with increasing radiative forcing. Compared to the historical runoff, the average annual flow in all time periods shows an increasing trend. The rate of change of runoff in the first time period (2021–2023) is lower under the SSP2–4.5 and SSP5–8.5 radiative forcing scenarios than under the SSP1–2.6 and SSP3–7.0 radiative forcing scenarios. The third time period (2041–2050) shows the most significant increase under all scenarios, and the increase in runoff is more pronounced with increasing radiative forcing. It can be seen that under different radiative forcing scenarios, the future runoff from the Weigan River out of the mountain shows a fluctuating upward trend, and with an increase in time, the impact of radiative forcing on runoff is more pronounced.

4. Discussion

4.1. Evaluation of Models’ Simulation Capability

In this study, data from seven global climate models from different countries and institutions were selected for delta downscaling bias revision for the upper watershed of the Weigan River outflow basin and evaluated and analysed in conjunction with Taylor diagrams. The maximum temperature simulated by the ACCESS-ESM1-5 model is better than the other six models, and the minimum temperature simulated by the ACCESS-ESM1-5, CanESM5 and INM-CM5-0 models is better than the other climate models. To date, most of the studies on climate models focus on the Tibetan Plateau and the Loess Plateau, and there are relatively few studies focused on Northwest China. In their simulation of temperature using various model data, Helali et al. [32], Zhang et al. [33] and Zhang [34] reported that the ACCESS-ESM1-5 model performs very well in temperature simulation and has the best effect. But the research results reported by Firpo et al. [35] and He et al. [36] showed that models such as CMCC-ESM2 and CanESM5 are the best for simulation of temperature, and the ACCESS-ESM1-5 model is not as effective. He et al. [17] showed that the temperature series simulated by the CanESM5 model is superior to the actual observed series. It can be seen that the optimal temperature model data identified in different regions are not exactly the same. Meanwhile, in this study, as far as the temperature data of each model are concerned, except for the CNRM-ESM2-1 model where the simulation accuracy of the maximum and minimum temperatures is close to that of the observed data, the simulation effect of the minimum temperature of the other models is better than that for the maximum temperature. This is more consistent with the results obtained by Wu et al. [37] in their study on the assessment of extreme climate change in the upper and middle Huaihe River Basin, which concluded that the simulation ability of the ACCESS-ESM1-5 and CMCC-ESM2 models for the minimum temperature is better than that for the maximum temperature.
As for the simulation of precipitation data, the MRI-ESM2-0 model has better simulation results, and the simulation results of the remaining six models, such as ACCESS-ESM1-5, are closer to each other, with a moderate correlation with the actual observation series. Yasen et al. [38], Ali et al. [39] and Yazdandoost et al. [40] also agreed that the MRI-ESM2-0 model can simulate the actual observed precipitation better when predicting the evolution of future hydrometeorological elements. The results of this study are more consistent with their results. On the other hand, Sime et al. [41], Chen [42] and Liu [43] reported that the precipitation data simulated by the MRI-ESM2-0 climate model differed greatly from the actual observed series. Zhang et al. [44] concluded that the ACCESS-ESM1-5 model is the single model with the best simulation effect in predicting daily-scale precipitation at the Jinsha River basin. It can be seen that the data of the optimal precipitation models in different regions are also not completely consistent. From the point of view of the meteorological elements simulated by each model, the simulation effect of air temperature is better than that of precipitation, which is more consistent with the results of the studies by He et al. [17], Liu [45] and others. However, there is also a single model with the best simulation effect for predicting precipitation, whose accuracy is closer to the observed values. In summary, there is a certain degree of variability between the simulation effects of different climate models for different meteorological elements, and the simulation effects reflected by the same model data in different regions are not the same as the actual observation series.

4.2. Model Applicability and Prediction Results

In this study, the hydrological processes in the upper watershed of the Weigan River outflow in historical years were recreated by constructing a SWAT model. And the model data processed by using the r-MME averaging method were also input into the model to predict the trend of runoff evolution in the study area for the next 30 years. When evaluating the simulation results, the NSE coefficient of the calibration period and validation period are all greater than 0.75, and the R2 reaches higher than 0.8, suggesting that the simulation results are excellent, and the simulation results of the runoff curves in the historical period are better fitted. It can be seen that the SWAT model constructed in this study has good applicability in the upper watershed of the Weigan River outflow.
The SWAT model predicts that the average annual runoff values during the next 30 years under four different radiative forcing scenarios, namely, SSP1–2.6, 2–4.5, 3–7.0 and 5–8.5, are 84.58 m3·s−1, 85.52 m3·s−1, 87.13 m3·s−1 and 90.01 m3·s−1, respectively. The runoff of the Weigan River is predicted to be maintained at 25.68 to 30.89 × 10⁸ m3 in 2030 and 2050, in which the contribution of temperature change and precipitation change to future runoff increase is 68.71% and 27.24%, respectively, and the contribution of human activities to future runoff increase is 4.05%. With the continuation of global warming, the increase in temperature directly affects the evaporation rate, the glacier ablation rate and the frequency of extreme precipitation. The study area is located in an alpine mountainous region, and the impacts on glaciers under warming will be more pronounced, so the obtained results are improved compared to past research results (the percentage of increase in incoming water due to temperature increase during the period 1965–2016 was 58.55%) [21]. In terms of interdecadal variation, the average annual runoff in the study area under the four different radiative forcing scenarios shows an increasing trend. This is more in line with the findings of Ni et al. [46]. The results of the current study suggest that with global warming and the gradual warming and humidification of Northwest China [47,48], the outflow runoff from the Weigan River will likely show an increasing trend in the future. However, it should be noted that warming and humidification will not change the basic characteristics of aridity and low rainfall in Northwest China and will only improve the degree of wetness in this arid region to a certain extent [49]. The results of this study can be applied to relevant research on typical inland river basins in the arid region of Northwest China, while providing scientific support for regional climate estimation to mitigate the potential risks of climate change and formulate timely response policies.

4.3. Shortcomings of This Study

As we all know, the Xinjiang region has perennial drought and little rain, most of the rivers in this region are glacial snow-melt recharge-type rivers, and many glaciers in southern Xinjiang are widely distributed, such as the Kanas Glacier, Moustagh Glacier and Ouyitak Glacier. The glacier flow rate is not only affected by the melting and evaporation of ice, but also by solar radiation, glacier size, ice surface nature and so on, which are closely related. The Weigan River is a typical arid inland glacier snow-melt recharge river. According to existing research results, the proportion of glacier runoff in the outflow of Weigan River reaches 32.40% [21], which is not small, and the glacier-produced flow in the context of global warming has a certain impact on the outflow of the Weigan River. However, although the SWAT model constructed in this study was validated for its applicability in the study area, it cannot fully and accurately reproduce the hydrological processes of the watershed. And when predicting the future runoff from the Weigan River, due to the immaturity of current research techniques and tools, we failed to complete the separation and prediction of the proportion of glacier runoff in future runoff. Therefore, the primary task of the next study is to separate glacier runoff from future runoff, and to clarify the proportion of future runoff due to the increases in precipitation and temperature caused by an increase in the incoming water from the perspective of the physical model, which can provide a reference for the allocation and management of water resources in the surrounding areas.
Although substantial work was performed in this study to correct the downscaling bias of the GCM data, and the simulation ability of the results is relatively consistent, it cannot be denied that the GCM data themselves have systematic errors and high levels of uncertainty. These uncertainties are related to factors such as the structure of the GCMs, spatial resolution, initial conditions and parameterisation scheme settings [50]. There is a certain variability in the simulation effects for different regions and elements [51], which also demonstrates the fact that different choices of climate models lead to certain differences in the simulation results. In the face of the large differences between models, and with the uncertainties in the simulation results of each model, the current solution is to target better-performing climate models. As for the many general common deviations and uncertainties in the simulation results of each model, these uncertainties can only be eliminated by using weighted ensemble averaging or other methods to reduce the deviations as much as possible so that the simulation and prediction results are more accurate. These problems are important obstacles to overcome in the use of numerical model simulation to predict climate change, which seriously affect the credibility of the model prediction method used [52]. Therefore, research in this area should be strengthened in the next phase of research work to solve such problems.

5. Conclusions

In this study, data from seven GCMs from different countries and organisations were selected and subjected to downscaling bias correction using the delta method, and the correlations between the temperature and precipitation data of each model and the observed data of the historical period were assessed. The weighted ensemble averaging method based on Pearson’s r correlation coefficient was used to process the selected GCM data, and the ensemble averaged processed r-MME data were coupled with the SWAT model to predict the future runoff out of the mountain in the study area. The following conclusions are drawn based on the results:
(1) The SWAT model constructed in this study has good applicability in the upper watershed of the Weigan River outflow, which can recreate the hydrological process of the study area in historical years and reveal the trend of its future runoff evolution.
(2) Under four different radiative forcing scenarios, namely, SSP1–2.6, 2–4.5, 3–7.0 and 5–8.5, the maximum and minimum temperatures, precipitation and runoff in the study area in the years 2020–2050 show an increasing trend, and the magnitude of the increase and the trend of the increase in these elements are not the same, with the increase under the radiative forcing scenario of SSP5–8.5 being the most pronounced in comparison to the other three scenarios.
(3) Under the four radiative forcing scenarios, the runoff from the Weigan River out of the mountain is predicted to be maintained at 25.68~30.89 × 10⁸ m3 in 2030 and 2050, which is an increase of 1.35~21.91% compared with the current runoff, among which the contribution of changes in temperature and precipitation to the increase in future runoff is 68.71% and 27.24%, respectively.

Author Contributions

Conceptualisation, J.S., C.R. and A.L.; methodology, J.S. and F.C.; software, J.S.; validation, J.S., P.Z. and A.L.; formal analysis, J.S., C.R. and J.Z.; investigation, J.S.; resources, A.L. and X.D.; data curation, J.S. and A.L.; writing—original draft preparation, J.S.; writing—review and editing, C.R., A.L. and P.Z.; visualisation, J.S., C.R. and J.Z.; supervision, A.L., P.Z. and F.C.; project administration, A.L.; funding acquisition, X.D. and P.Z. All authors have read and agreed to the published version of the manuscript.

Funding

This work was financially supported by the National Natural Science Foundation of China (Grant No. 52309041; Grant No. 52179028) and the Third Xinjiang Scientific Expedition (Grant No. 2022xjkk0103).

Institutional Review Board Statement

Not applicable.

Informed Consent Statement

Not applicable.

Data Availability Statement

The original contributions presented in the study are included in the article, further inquiries can be directed to the corresponding author.

Acknowledgments

We express our sincere thanks to Shuhong Wang from Xinjiang Corps Survey and Design Institute (Group) Co., Ltd., for her assistance in investigation and resources.

Conflicts of Interest

The authors declare no conflicts of interest.

References

  1. Zhou, B.; Qian, J. Changes of weather and climate extremes in the IPCC AR6. Clim. Chang. Res. 2021, 17, 713–718. [Google Scholar] [CrossRef]
  2. Contractor, S.; Donat, M.G.; Alexander, L.V. Changes in Observed Daily Precipitation over Global Land Areas since 1950. J. Clim. 2021, 34, 3–19. [Google Scholar] [CrossRef]
  3. Goswami, B.N.; Venugopal, V.; Sengupta, D.; Madhusoodanan, M.S.; Xavier, P.K. Increasing trend of extreme rain events over India in a warming environment. Science 2006, 314, 1442–1445. [Google Scholar] [CrossRef] [PubMed]
  4. Zhang, W.; Zhou, T. Significant Increases in Extreme Precipitation and the Associations with Global Warming over the Global Land Monsoon Regions. J. Clim. 2019, 32, 8465–8488. [Google Scholar] [CrossRef]
  5. Huang, L.; Wang, C.; Chao, Q. Interpretation of IPCC special report on climate change and land. Clim. Chang. Res. 2020, 16, 1–8. [Google Scholar] [CrossRef]
  6. Fan, X.; Qin, Y.; Gao, X. Interpretation of the Main Conclusions and Suggestions of IPCC AR6 Working Group I Report. Environ. Prot. 2021, 49, 44–48. [Google Scholar] [CrossRef]
  7. Piao, J.; Chen, W.; Wang, L.; Chen, S. Future projections of precipitation, surface temperatures and drought events over the monsoon transitional zone in China from bias-corrected CMIP6 models. Int. J. Climatol. 2022, 42, 1203–1219. [Google Scholar] [CrossRef]
  8. Zhu, X.; Lee, S.-Y.; Wen, X.; Ji, Z.; Lin, L.; Wei, Z.; Zheng, Z.; Xu, D.; Dong, W. Extreme climate changes over three major river basins in China as seen in CMIP5 and CMIP6. Clim. Dyn. 2021, 57, 1187–1205. [Google Scholar] [CrossRef]
  9. Ferreira, G.W.d.S.; Reboita, M.S.; Ribeiro, J.G.M.; Souza, C.A.d. Assessment of Precipitation and Hydrological Droughts in South America through Statistically Downscaled CMIP6 Projections. Climate 2023, 11, 166. [Google Scholar] [CrossRef]
  10. Velázquez, M.A.; Martínez, M.J.M. Historical and Projected Trends of the Mean Surface Temperature in South-Southeast Mexico Using ERA5 and CMIP6. Climate 2023, 11, 111. [Google Scholar] [CrossRef]
  11. Guo, J.; Shen, Y.; Wang, X.; Liang, X.; Liu, Z.; Liu, L. Evaluation and projection of precipitation extremes under 1.5 °C and 2.0 °C GWLs over China using bias-corrected CMIP6 models. iScience 2023, 26, 106179. [Google Scholar] [CrossRef] [PubMed]
  12. Xiang, J.; Zhang, L.; Deng, Y.; She, D.; Zhang, Q. Projection and evaluation of extreme temperature and precipitation in major regions of China by CMIP6 models. Eng. J. Wuhan Univ. 2021, 54, 46–57 + 81. [Google Scholar] [CrossRef]
  13. Hu, Y.; Xu, Y.; Li, J.; Han, Z. Evaluation on the performance of CMIP6 global climate models with different horizontal resolution in simulating the precipitation over China. Clim. Chang. Res. 2021, 17, 730–743. [Google Scholar] [CrossRef]
  14. Kang, W.; Ni, F.; Deng, Y.; Xiang, J. Response of blue and green water to climate and land use changes: A study in the Wujiang River Basin, China. Trans. Chin. Soc. Agric. Eng. 2023, 39, 131–140. [Google Scholar] [CrossRef]
  15. Zhao, J.; He, S.; Wang, H. Historical and future runoff changes in the Yangtze River Basin from CMIP6 models constrained by a weighting strategy. Environ. Res. Lett. 2022, 17, 024015. [Google Scholar] [CrossRef]
  16. Dai, J.; Hu, H.; Mao, X.; Zhang, J. Future climate change trends in the Shiyang River Basin based on the CMIP6 multimodel estimation data. Arid. Zone Res. 2023, 40, 1547–1562. [Google Scholar] [CrossRef]
  17. He, C.; Luo, C.; Chen, F.; Long, A.; Tang, H. CMIP6 multi-model prediction of future climate change in the Hotan River Basin. Earth Sci. Front. 2023, 30, 515–528. [Google Scholar] [CrossRef]
  18. Zhang, X.; Wang, X.; Hua, L.; Jiang, D. Projections of Temperature and Precipitation over Xinjiang Based on CMIP6 Model. Chin. J. Atmos. Sci. 2023, 47, 387–398. [Google Scholar] [CrossRef]
  19. Li, F.; Zhang, G.; Dong, L. Studies for Impact of Climate Change on Hydrology and Water Resources. Sci. Geogr. Sin. 2013, 33, 457–464. [Google Scholar] [CrossRef]
  20. FAO. The State of the World’s Land and Water Resources for Food and Agriculture—Systems at Breaking Point; Synthesis Report 2021; ResearchGate: Rome, Italy, 2021; p. 58. [Google Scholar]
  21. Su, J.; Long, A.; Chen, F.; Ren, C.; Zhang, P.; Zhang, J.; Gu, X.; Deng, X. Impact of the Construction of Water Conservation Projects on Runoff from the Weigan River. Water 2023, 15, 2431. [Google Scholar] [CrossRef]
  22. Yang, C. Dynamic Change and Prediction Research of Land Use in Baicheng County. Master’s Thesis, Xinjiang University, Ürümqi, China, 2018. [Google Scholar]
  23. Xu, J.; Hu, Y.; Li, J.; Zhu, B.; Ren, N. Assessment of long-term variations of wind speed and wind resources in china seas under the global warming. Adv. Mar. Sci. 2023, 42, 1–12. [Google Scholar] [CrossRef]
  24. Liu, J.; Tang, H.; Yan, F.; Liu, S.; Tang, X.; Ding, Z.; Yu, P. Future variation of land surface temperature in the Yangtze River Basin based on CMIP6 model. Int. J. Digit. Earth 2023, 16, 2776–2796. [Google Scholar] [CrossRef]
  25. Peng, S.; Ding, Y.; Wen, Z.; Chen, Y.; Cao, Y.; Ren, J. Spatiotemporal change and trend analysis of potential evapotranspiration over the Loess Plateau of China during 2011–2100. Agric. For. Meteorol. 2017, 233, 183–194. [Google Scholar] [CrossRef]
  26. Zhang, X.; Hua, L.; Jiang, D. Assessment of CMIP6 model performance for temperature and precipitation in Xinjiang, China. Atmos. Ocean. Sci. Lett. 2022, 15, 41–48. [Google Scholar] [CrossRef]
  27. Lou, H. Analysis of Water Resource Availability in Yanghe River Basin Basedon SWATmodel. Master’s Thesis, Hubei University of Technology, Wuhan, China, 2020. [Google Scholar]
  28. Zhao, A.; Liu, X.; Zhu, X.; Pan, Y.; Li, Y. Spatiotemporal patterns of droughts based on SWAT model for the Weihe River Basin. Prog. Geogr. 2015, 34, 1156–1166. [Google Scholar] [CrossRef]
  29. Wang, S.; Yan, Y.; Yan, M.; Zhao, X. Contributions of Precipitation and Human Activities to the Runoff Change of the Huangfuchuan Drainage Basin: Application of Comparative Method of the Slope Changing Ratio of Cumulative Quantity. Acta Geogr. Sin. 2012, 67, 388–397. [Google Scholar] [CrossRef]
  30. Chen, F.; Wang, Y.; Wu, Z.; Feng, P. Impacts of Climate Change and Human Activities on Runoff of Continental River in Arid Areas. Arid. Zone Res. 2015, 32, 692–697. [Google Scholar] [CrossRef]
  31. Zheng, J.; Yan, Z.; Li, D.; Zhou, Z.; Zhang, X.; Liu, J. Spatio-temporal evolution of the rainfall—Runoff relationship in the Yellow River Basin. J. Water Resour. Water Eng. 2021, 32, 77–85 + 92. [Google Scholar] [CrossRef]
  32. Helali, J.; Oskouei, E.A.; Hosseini, S.A.; Saeidi, V.; Modirian, R. Projection of changes in late spring frost based on CMIP6 models and SSP scenarios over cold regions of Iran. Theor. Appl. Climatol. 2022, 149, 1405–1418. [Google Scholar] [CrossRef]
  33. Zhang, J.; Lun, Y.; Liu, L.; Liu, Y.; Li, X.; Xu, Z. CMIP6 evaluation and projection of climate change in Tibetan Plateau. J. Beijing Norm. Univ. (Nat. Sci.) 2022, 58, 77–89. [Google Scholar] [CrossRef]
  34. Zhang, J. Sea Level Change in Coastal China Seas during the 21st Based on SSPs Scenarios. Master’s Thesis, Zhejiang Ocean University, Zhoushan, China, 2022. [Google Scholar]
  35. Firpo, M.Â.F.; Guimarães, B.d.S.; Dantas, L.G.; Silva, M.G.B.d.; Alves, L.M.; Chadwick, R.; Llopart, M.P.; Oliveira, G.S.d. Assessment of CMIP6 models’ performance in simulating present-day climate in Brazil. Front. Clim. 2022, 4, 948499. [Google Scholar] [CrossRef]
  36. He, X.; Jiang, C.; Wang, J.; Wang, X. Comparison of CMIP6 and CMIP5 models performance in simulating temperature in Northeast China. Chin. J. Geophys. 2022, 65, 4194–4207. [Google Scholar] [CrossRef]
  37. Wu, C. Assessment and Cause Analysis of Extreme Climate Change in the Upper and Middle Reaches of Huai River Basin Based on CMIP6. Master’s Thesis, Yangzhou University, Yangzhou, China, 2023. [Google Scholar]
  38. Yasin, G.; Zhang, J.; Zhao, T. CMIP6 Model-Projected Future Changes in Extreme Precipitation over Central Asia in the 21st Century. Clim. Environ. Res. 2023, 28, 286–302. [Google Scholar] [CrossRef]
  39. Ali, Z.; Hamed, M.M.; Muhammad, M.K.I.; Iqbal, Z.; Shahid, S. Performance evaluation of CMIP6 GCMs for the projections of precipitation extremes in Pakistan. Clim. Dyn. 2023, 61, 4717–4732. [Google Scholar] [CrossRef]
  40. Yazdandoost, F.; Moradian, S.; Izadi, A.; Aghakouchak, A. Evaluation of CMIP6 precipitation simulations across different climatic zones: Uncertainty and model intercomparison. Atmos. Res. 2021, 250, 105369. [Google Scholar] [CrossRef]
  41. Sime, C.H.; Dibaba, W.T. Evaluation of CMIP6 model performance and extreme precipitation prediction in the Awash basin. Heliyon 2023, 9, e21578. [Google Scholar] [CrossRef] [PubMed]
  42. Chen, C. Analysis of Water Resources Evolution and Vulnerability Assessment under Climate Change in the Chushandian Reservoir Basin. Master’s Thesis, Zhengzhou University, Zhengzhou, China, 2022. [Google Scholar]
  43. Liu, Q. Study on the Evolution Mechanisms of Water Resources in Taoer River Basin under the Changing Environment. Master’s Thesis, Dalian University of Technology, Dalian, China, 2020. [Google Scholar]
  44. Zhang, D.; Liang, H.; He, X.; Shi, Y. Projections of runoff and hydrological drought in the Jinsha River Basin based on CMIP6. Water Resour. Prot. 2023, 39, 53–62. [Google Scholar] [CrossRef]
  45. Liu, Q. Downscaling of Temperature and Precipitation in the Daling River Basin, Liaoning Province. Master’s Thesis, Fujian Normal University, Fuzhou, China, 2022. [Google Scholar]
  46. Ni, M.; Duan, Z.; Xia, J. Melting of mountain glacier and its risk to future water resources in Southern Xinjiang, China. Mt. Res. 2022, 40, 329–342. [Google Scholar] [CrossRef]
  47. Shi, Y.; Shen, Y.; Li, D.; Zhang, G.; Ding, Y.; Hu, R.; Kang, E. Discussion on The Present Climate Change From Warm-dry to Warm-wet in Northwest China. Quat. Sci. 2003, 23, 152–164. [Google Scholar] [CrossRef]
  48. Hua, L.; Zhao, T.; Zhong, L. Future changes in drought over Central Asia under CMIP6 forcing scenarios. J. Hydrol. Reg. Stud. 2022, 43, 101191. [Google Scholar] [CrossRef]
  49. Wang, C.; Zhang, S.; Zhang, F.; Li, K.; Yang, K. On the increase of precipitation in the Northwestern China under the global warming. Adv. Earth Sci. 2021, 36, 980–989. [Google Scholar] [CrossRef]
  50. Yan, D.; Werners, S.E.; Ludwig, F.; Huang, H.Q. Hydrological response to climate change: The Pearl River, China under different RCP scenarios. J. Hydrol. Reg. Stud. 2015, 4, 228–245. [Google Scholar] [CrossRef]
  51. Wu, J.; Ju, Q.; Liu, X.; Lian, Z.; Zhang, Y.; Duan, Y. Assessment of precipitation and temperature in the water conservation region of the Yellow River Basin using CMIP6 models. Hydro-Sci. Eng. 2023, 6, 1–14. [Google Scholar] [CrossRef]
  52. Huang, P.; Ying, J. A Multimodel Ensemble Pattern Regression Method to Correct the Tropical Pacific SST Change Patterns under Global Warming. J. Clim. 2015, 28, 4706–4723. [Google Scholar] [CrossRef]
Figure 1. Overview of the upper reaches of the Weigan River outlet.
Applsci 14 00541 g001
Figure 2. Results of the assessment of the modelled values of maximum temperature (a), minimum temperature (b) and precipitation (c) compared to the observed values.
Applsci 14 00541 g002
Figure 3. Historical temperature data (a) and r-MME temperature prediction (b) situation. The solid, coloured lines in (b) represent the r-MME data for each scenario, and the shaded areas represent the range of plus or minus one standard deviation of the annual average temperature for each scenario.
Applsci 14 00541 g003
Figure 4. Historical precipitation data (a) and r-MME precipitation prediction (b) situation. The solid, coloured lines in (b) represent the r-MME data for each scenario, and the shaded areas represent the range of plus or minus one standard deviation of the annual average precipitation for each scenario.
Applsci 14 00541 g004
Figure 5. SWAT model’s monthly average flow simulation results for the 1965–2014 historical period.
Applsci 14 00541 g005
Figure 6. Evolution of future runoff out of the mountain under different radiative forcing scenarios.
Applsci 14 00541 g006
Table 1. Basic information on seven global climate models.
NumberPattern NameResearch InstitutionsSource CountryOriginal Resolution
1ACCESS-ESM1-5Australian Community Climate and Earth System SimulatorAustralia1.88 × 1.25
2BCC-CSM2-MRNational Climate CentreChina2.88 × 1.92
3CanESM5Canadian Centre for Climate Modelling and AnalysisCanada2.8 × 2.8
4CMCC-ESM2Centro Euro-Mediterraneo sui Cambiamenti ClimaticiItaly1.25 × 1.0
5CNRM-ESM2-1National Center for Meteorological ResearchFrance1.41 × 1.39
6INM-CM4-8Marchuk Institute of Numerical MathematicsRussia2.0 × 1.5
7MRI-ESM2-0Meteorological Research InstituteJapan1.1 × 1.1
Table 2. Evaluation of monthly runoff simulation results by time period based on the r-MME data.
Time PeriodActual Runoff/108 m3 a−1Simulate Runoff/108 m3 a−1NSERSRPBIAS/%R2Simulation Results
Calibration Period
(1 January 1965–31 December 1989)
24.1922.770.750.505.910.82Good
Validation Period
(1 January 1990–31 December 2014)
26.7024.840.830.416.980.86Good
Whole Period
(1 January 1965–31 December 2014)
25.4723.820.800.456.470.84Good
Table 3. Interdecadal variation in future runoff from the Weigan River.
Time Period SSP1–2.6SSP2–4.5SSP3–7.0SSP5–8.5
Runoff/m3·s−1Rate/%Runoff/m3·s−1Rate/%Runoff/m3·s−1Rate/%Runoff/m3·s−1Rate/%
1965–201480.63-80.63-80.63-80.63-
2021–203081.921.61%80.730.12%83.253.26%81.030.50%
2031–204084.584.90%86.487.26%86.657.48%90.6912.48%
2041–205087.989.12%89.8311.42%92.5214.75%99.4423.34%
Disclaimer/Publisher’s Note: The statements, opinions and data contained in all publications are solely those of the individual author(s) and contributor(s) and not of MDPI and/or the editor(s). MDPI and/or the editor(s) disclaim responsibility for any injury to people or property resulting from any ideas, methods, instructions or products referred to in the content.

