
Introduction of a Novel Technique in Density-Adjusted 3D Printing for the Manufacture of Soft-Tissue-Equivalent Radiological Phantoms

Abstract
1. Introduction
2. Materials and Method
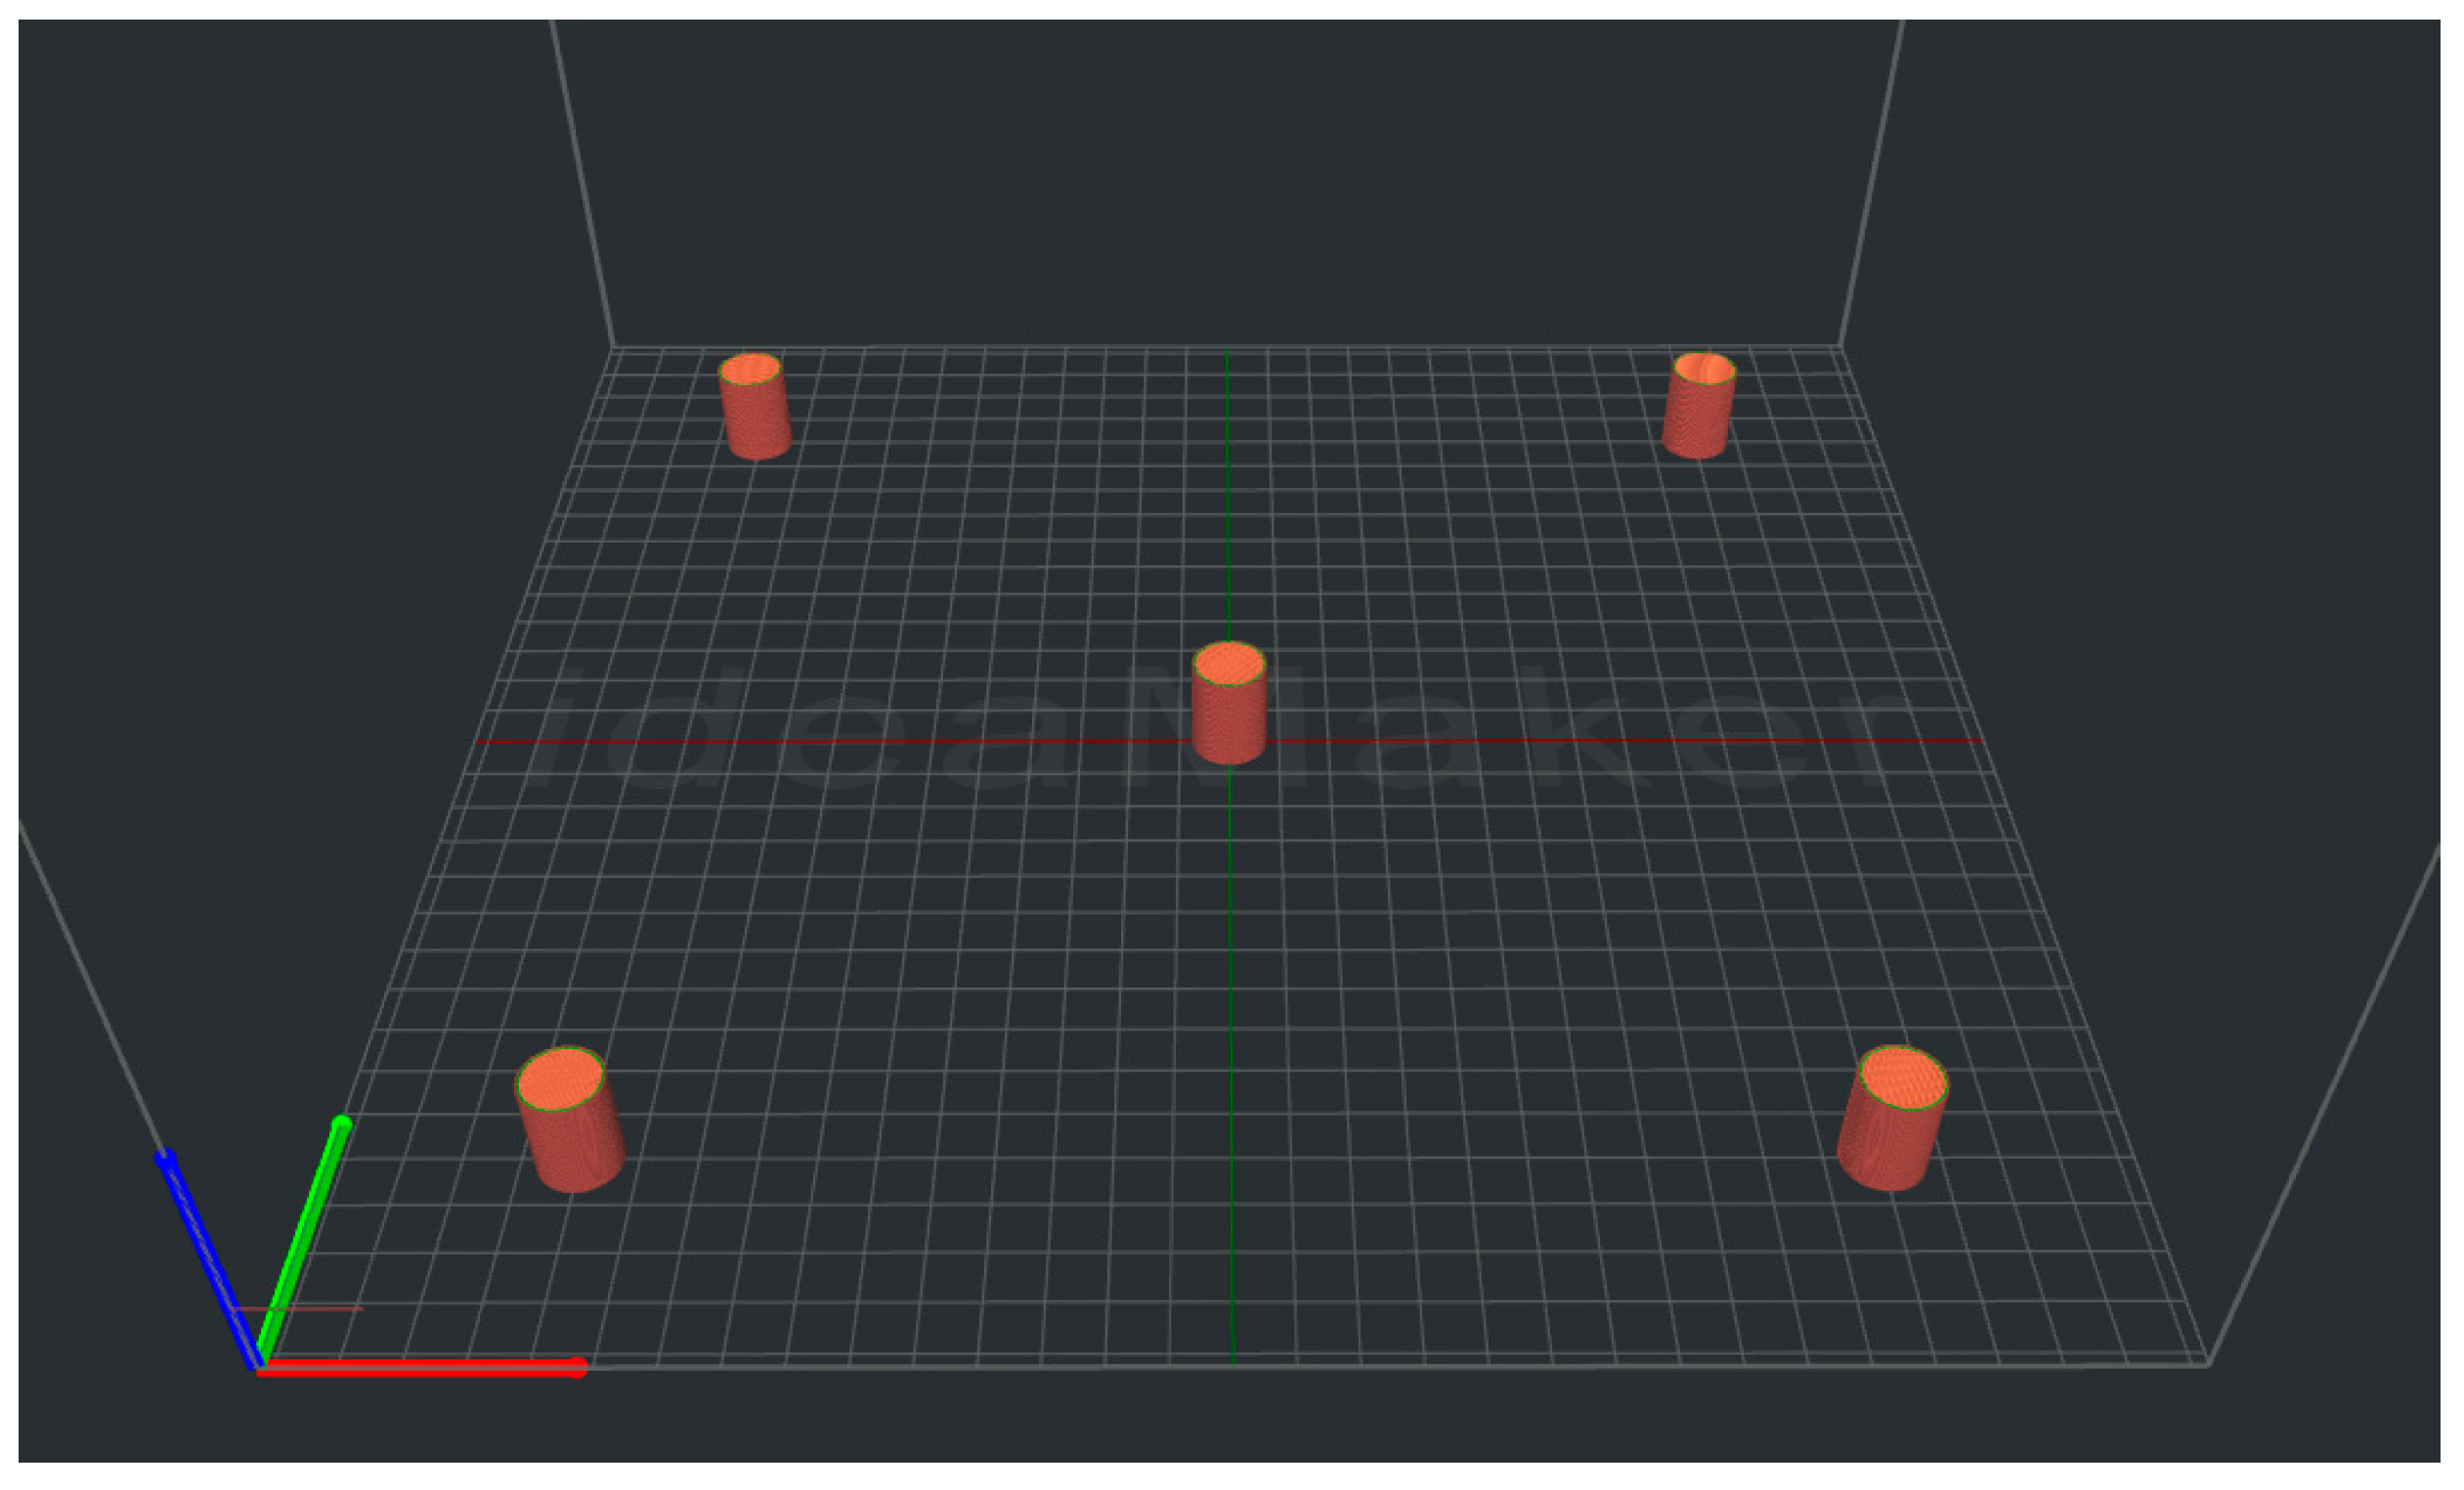
2.1. 3D Printing Cylindrical LW-PLA Samples for Radiological Characterization
2.2. Testing for the Reproducibility of the Print Job
2.3. Investigating the Effect of Print Size and Print Speed
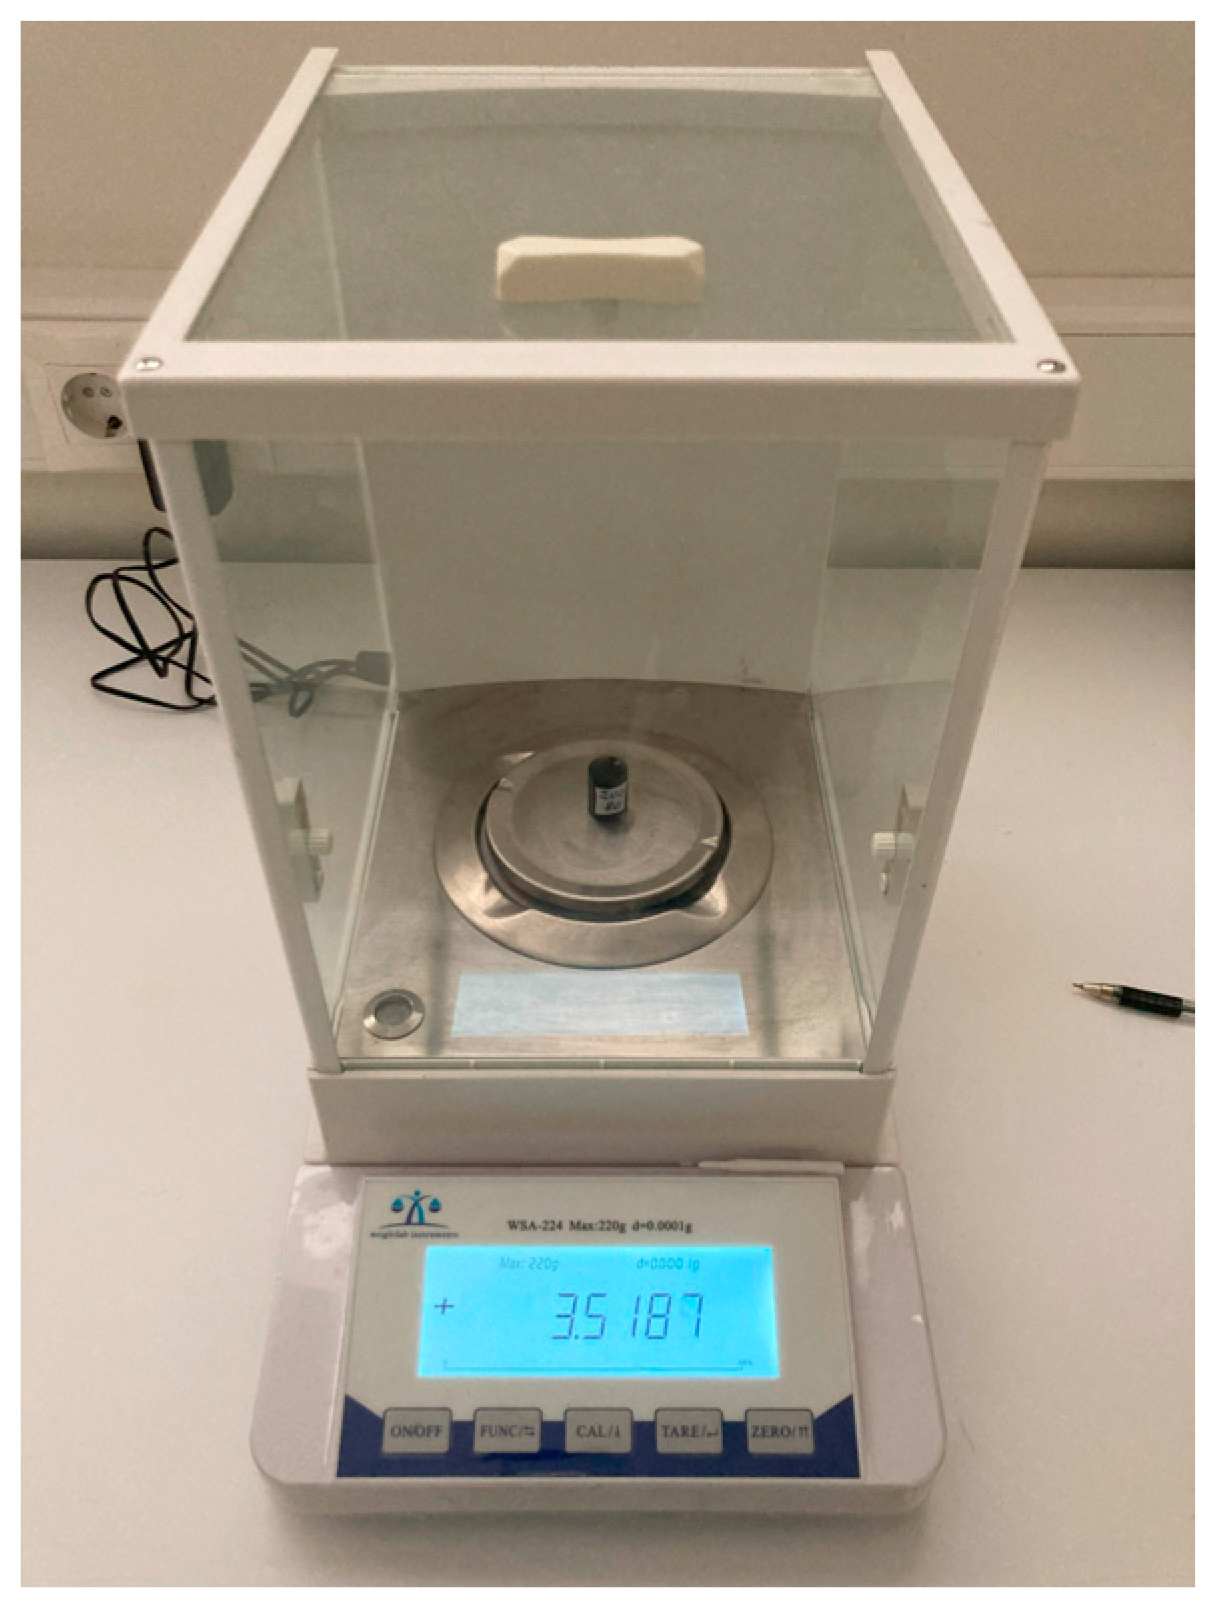
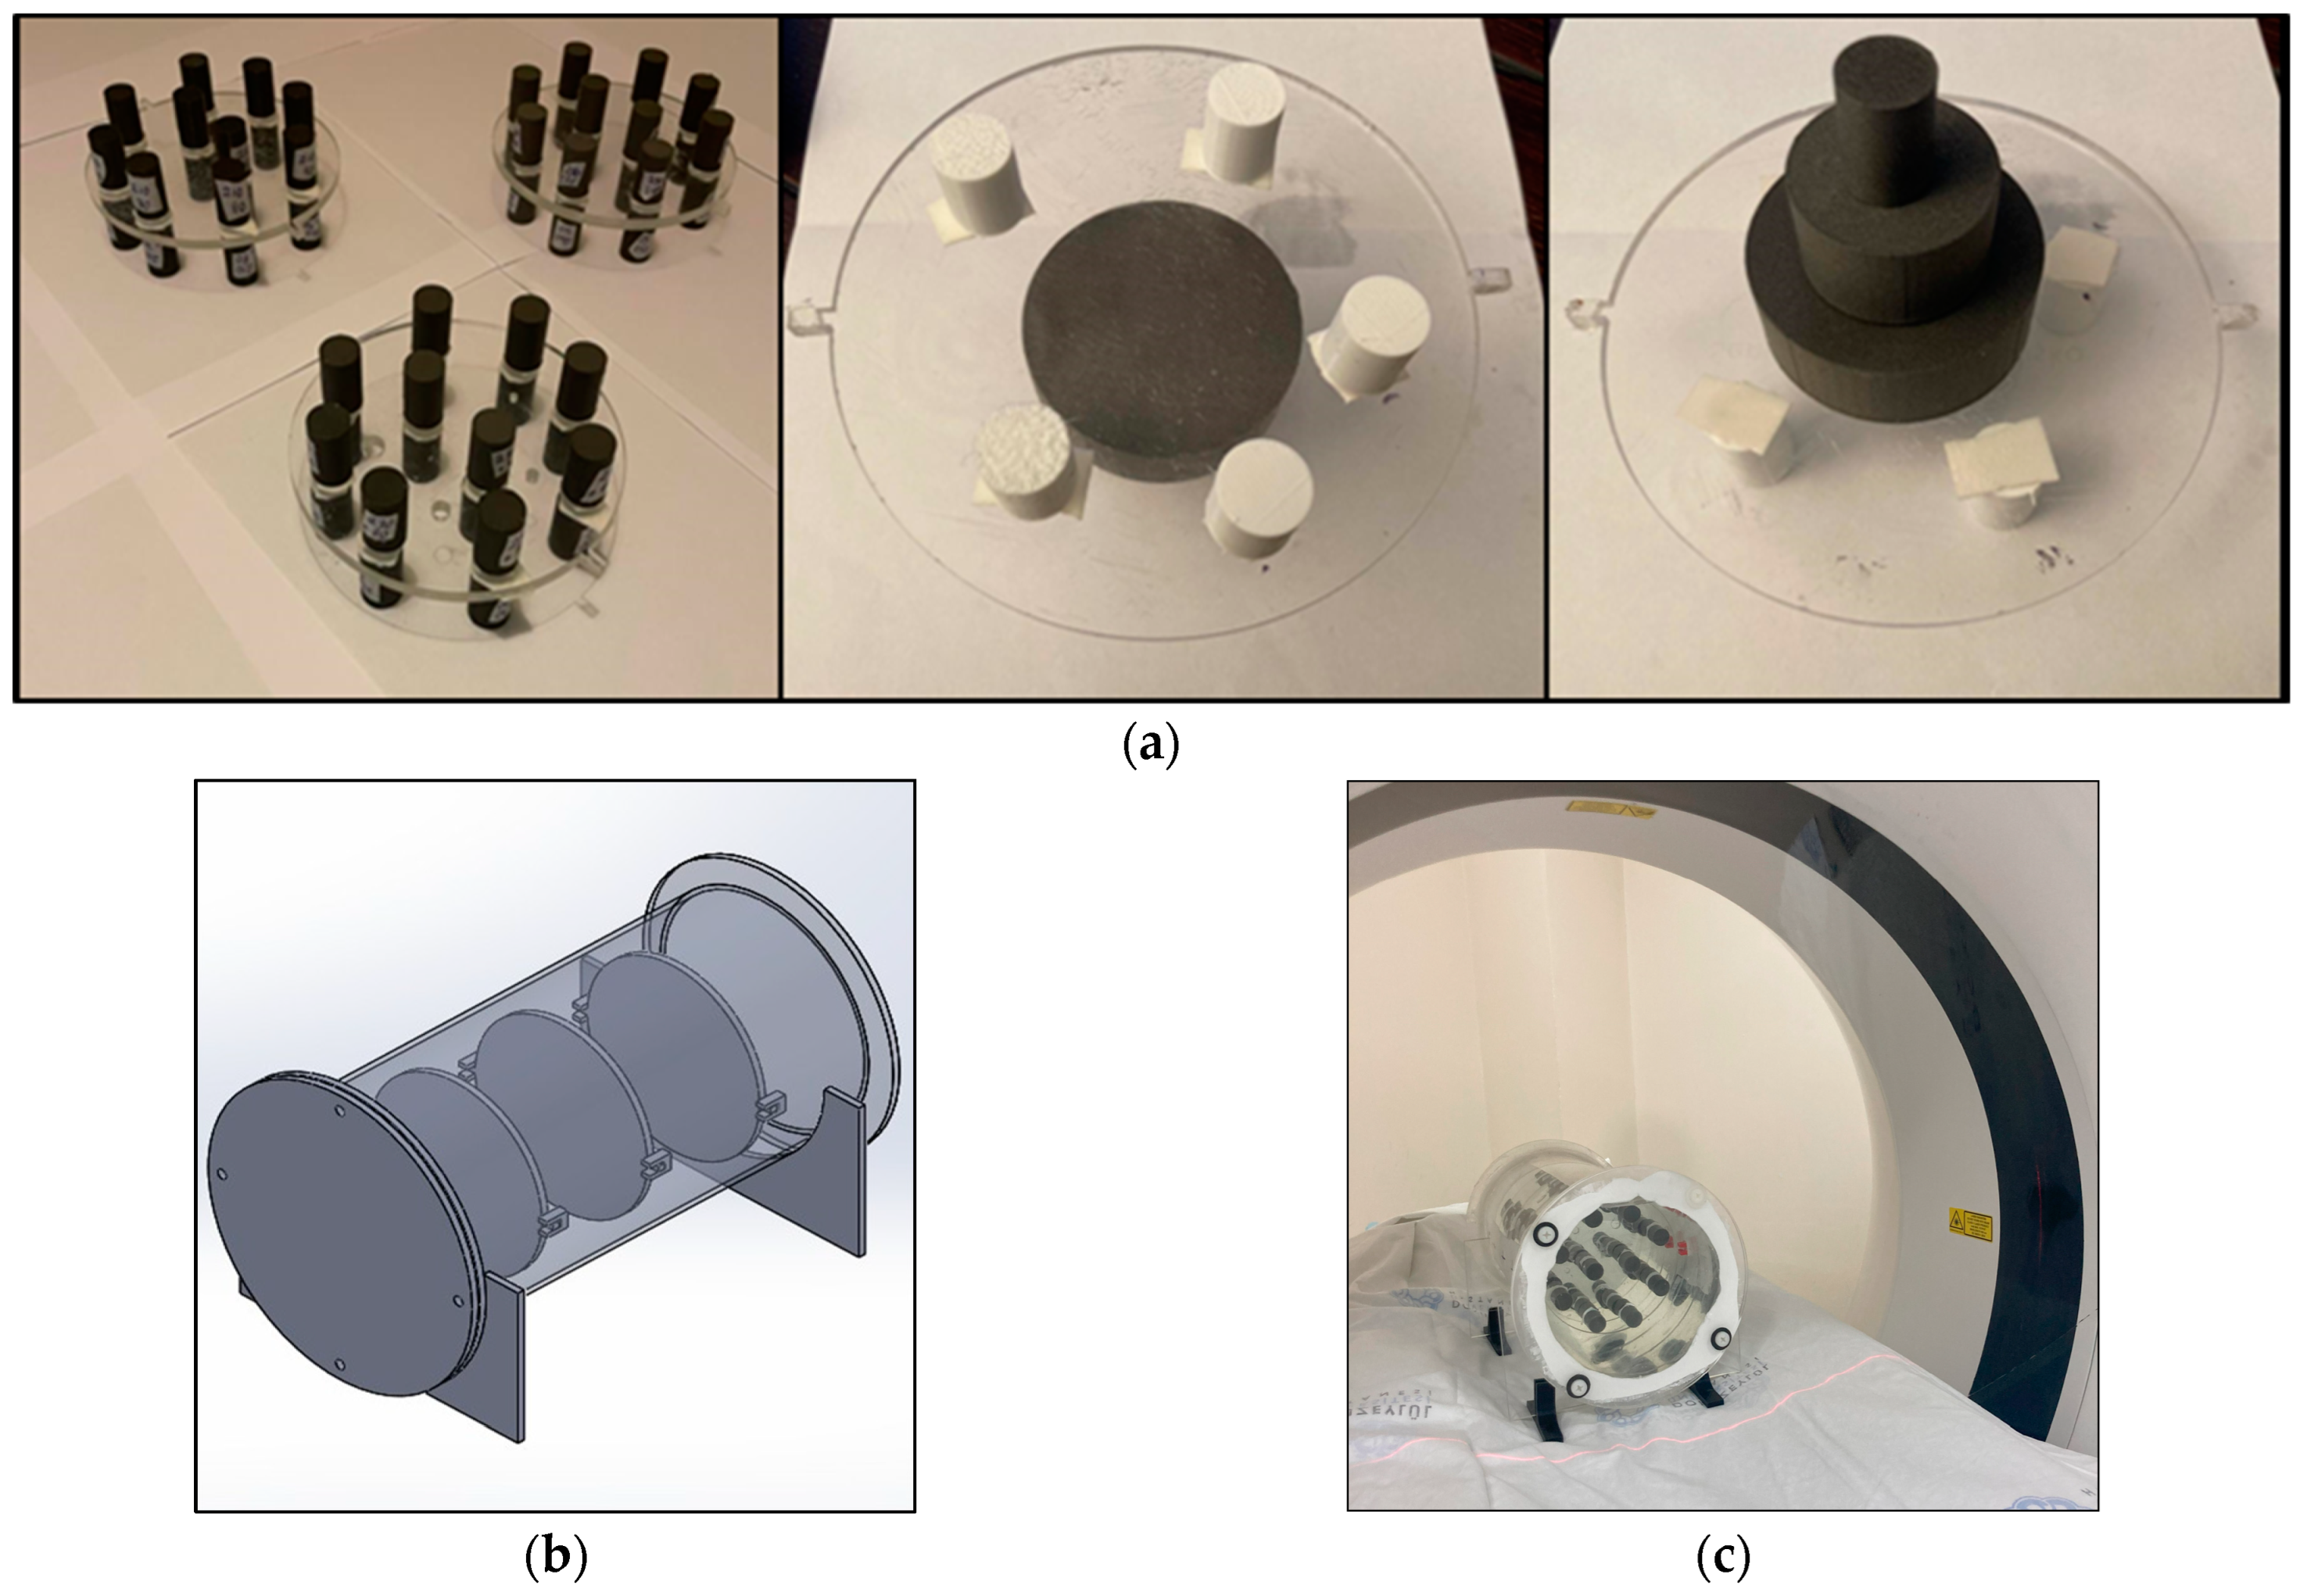
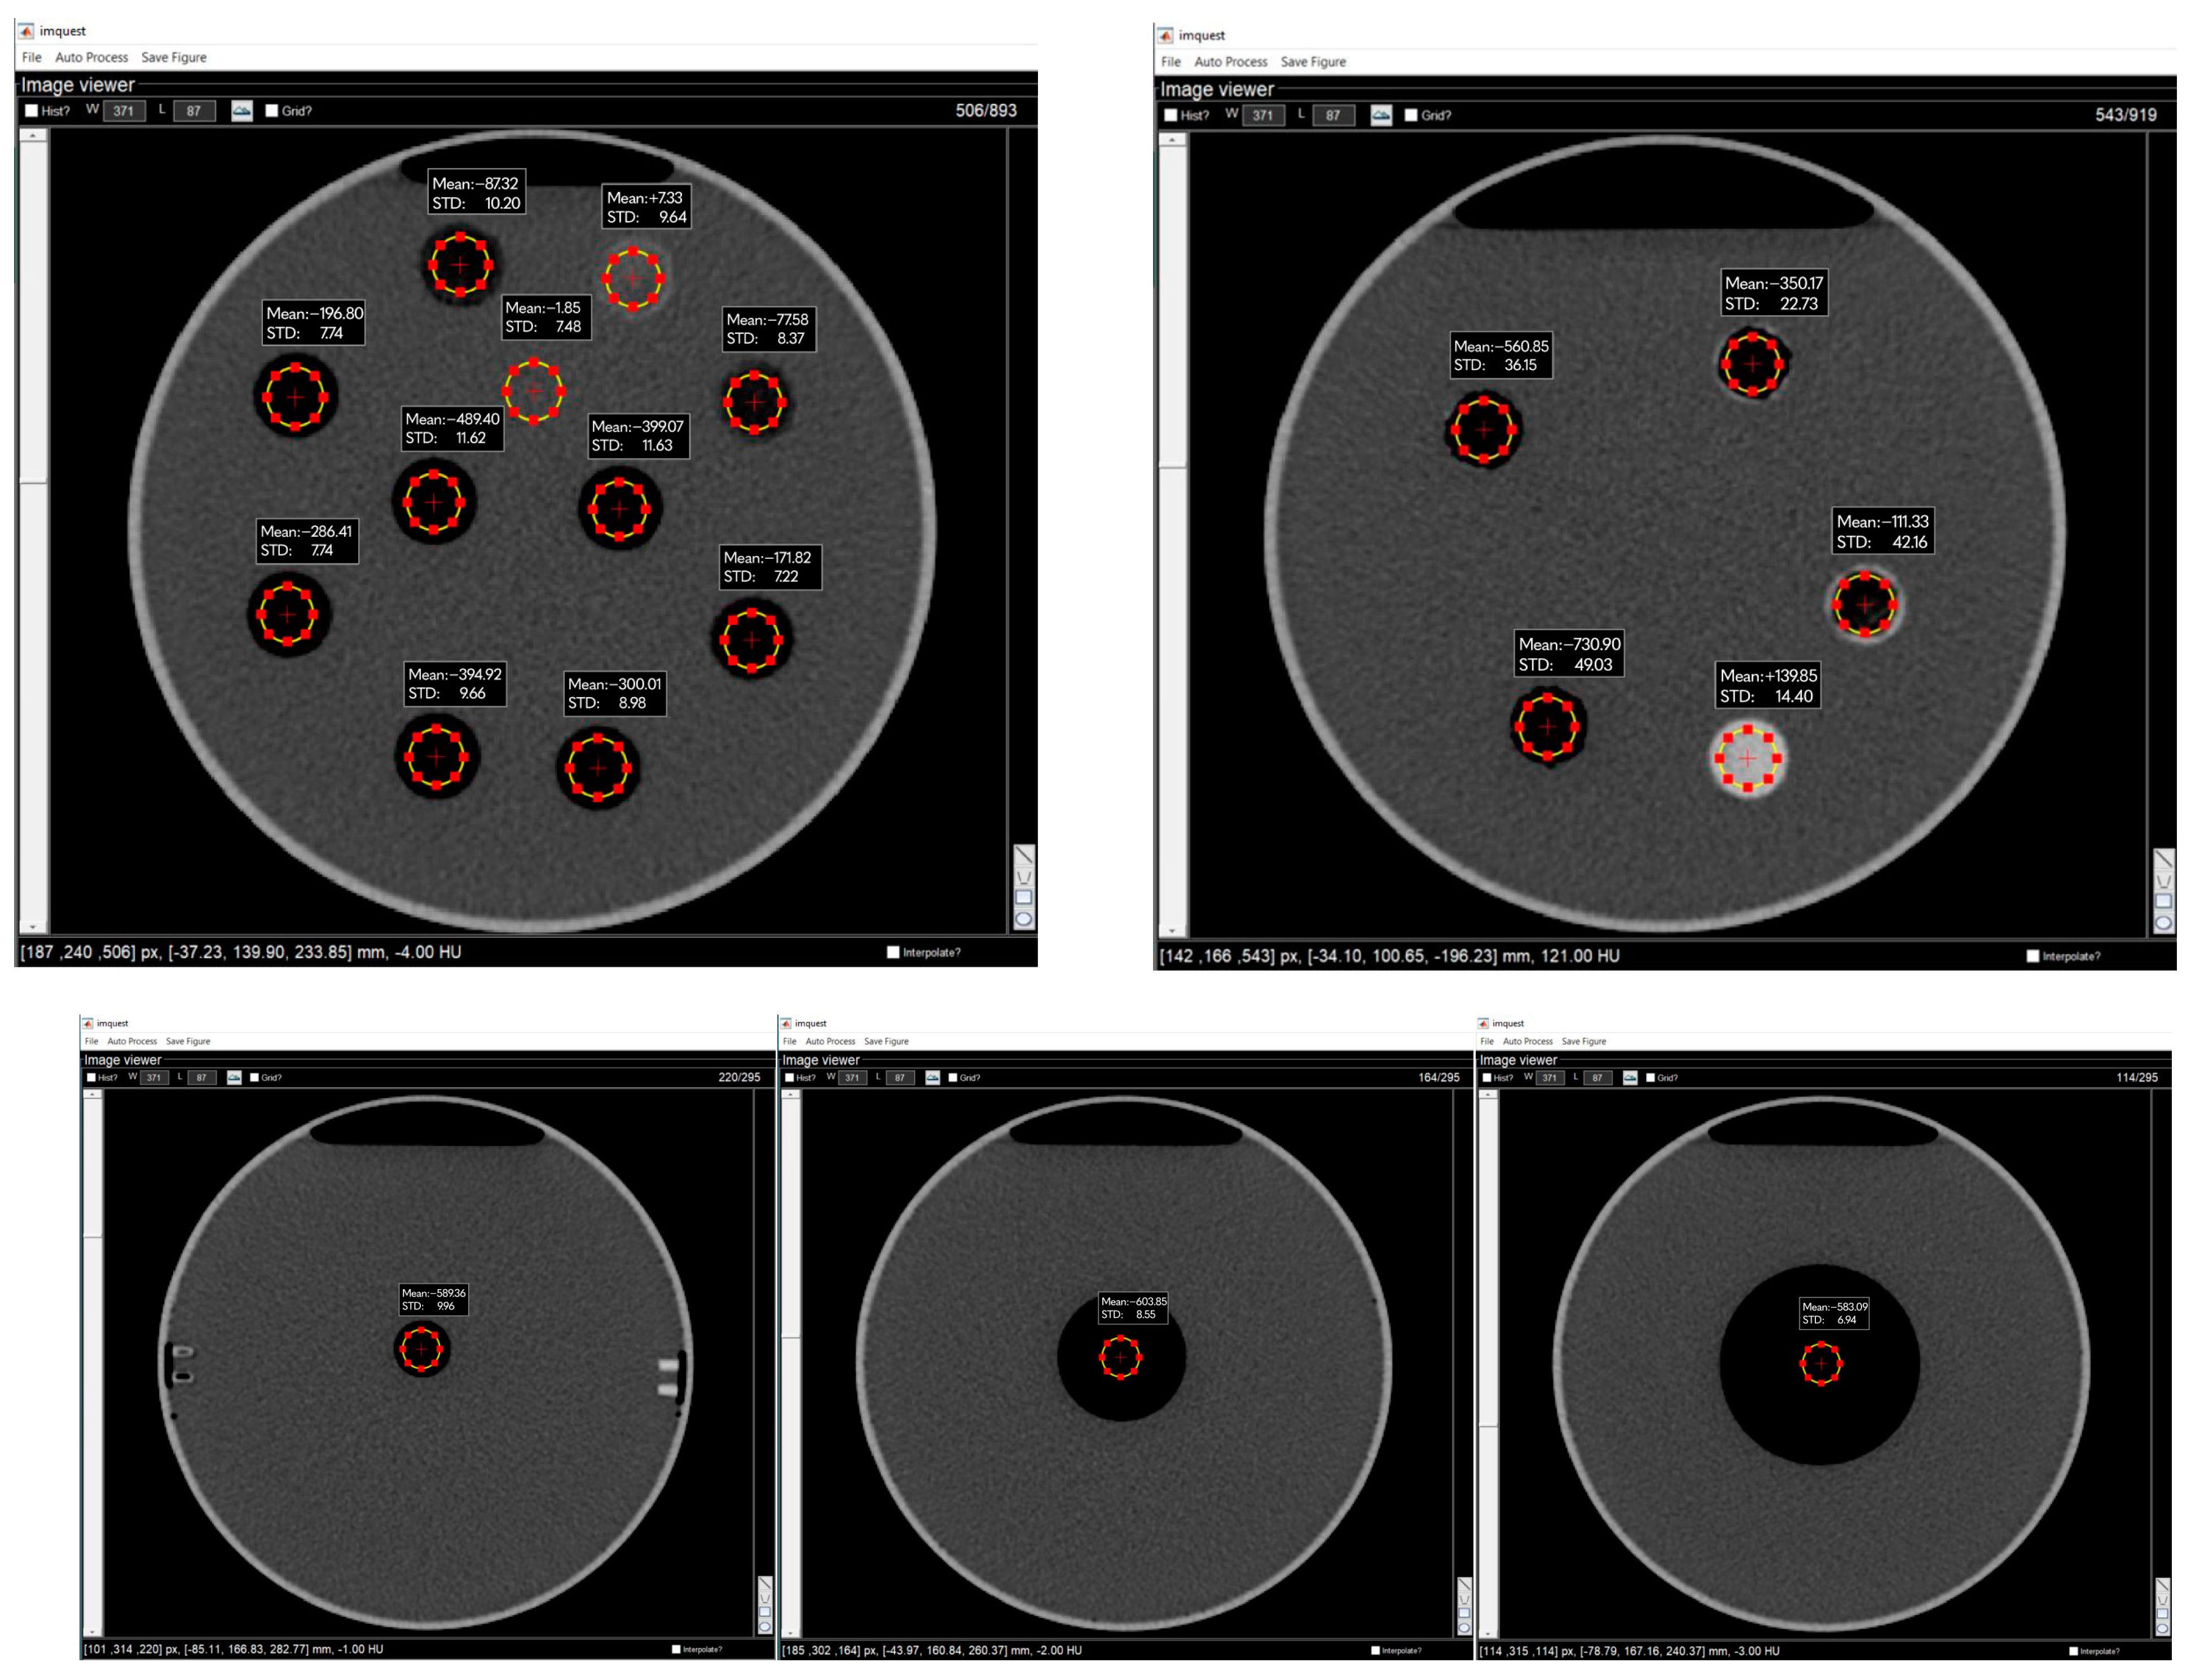
2.4. Data Collection and Analysis
3. Results
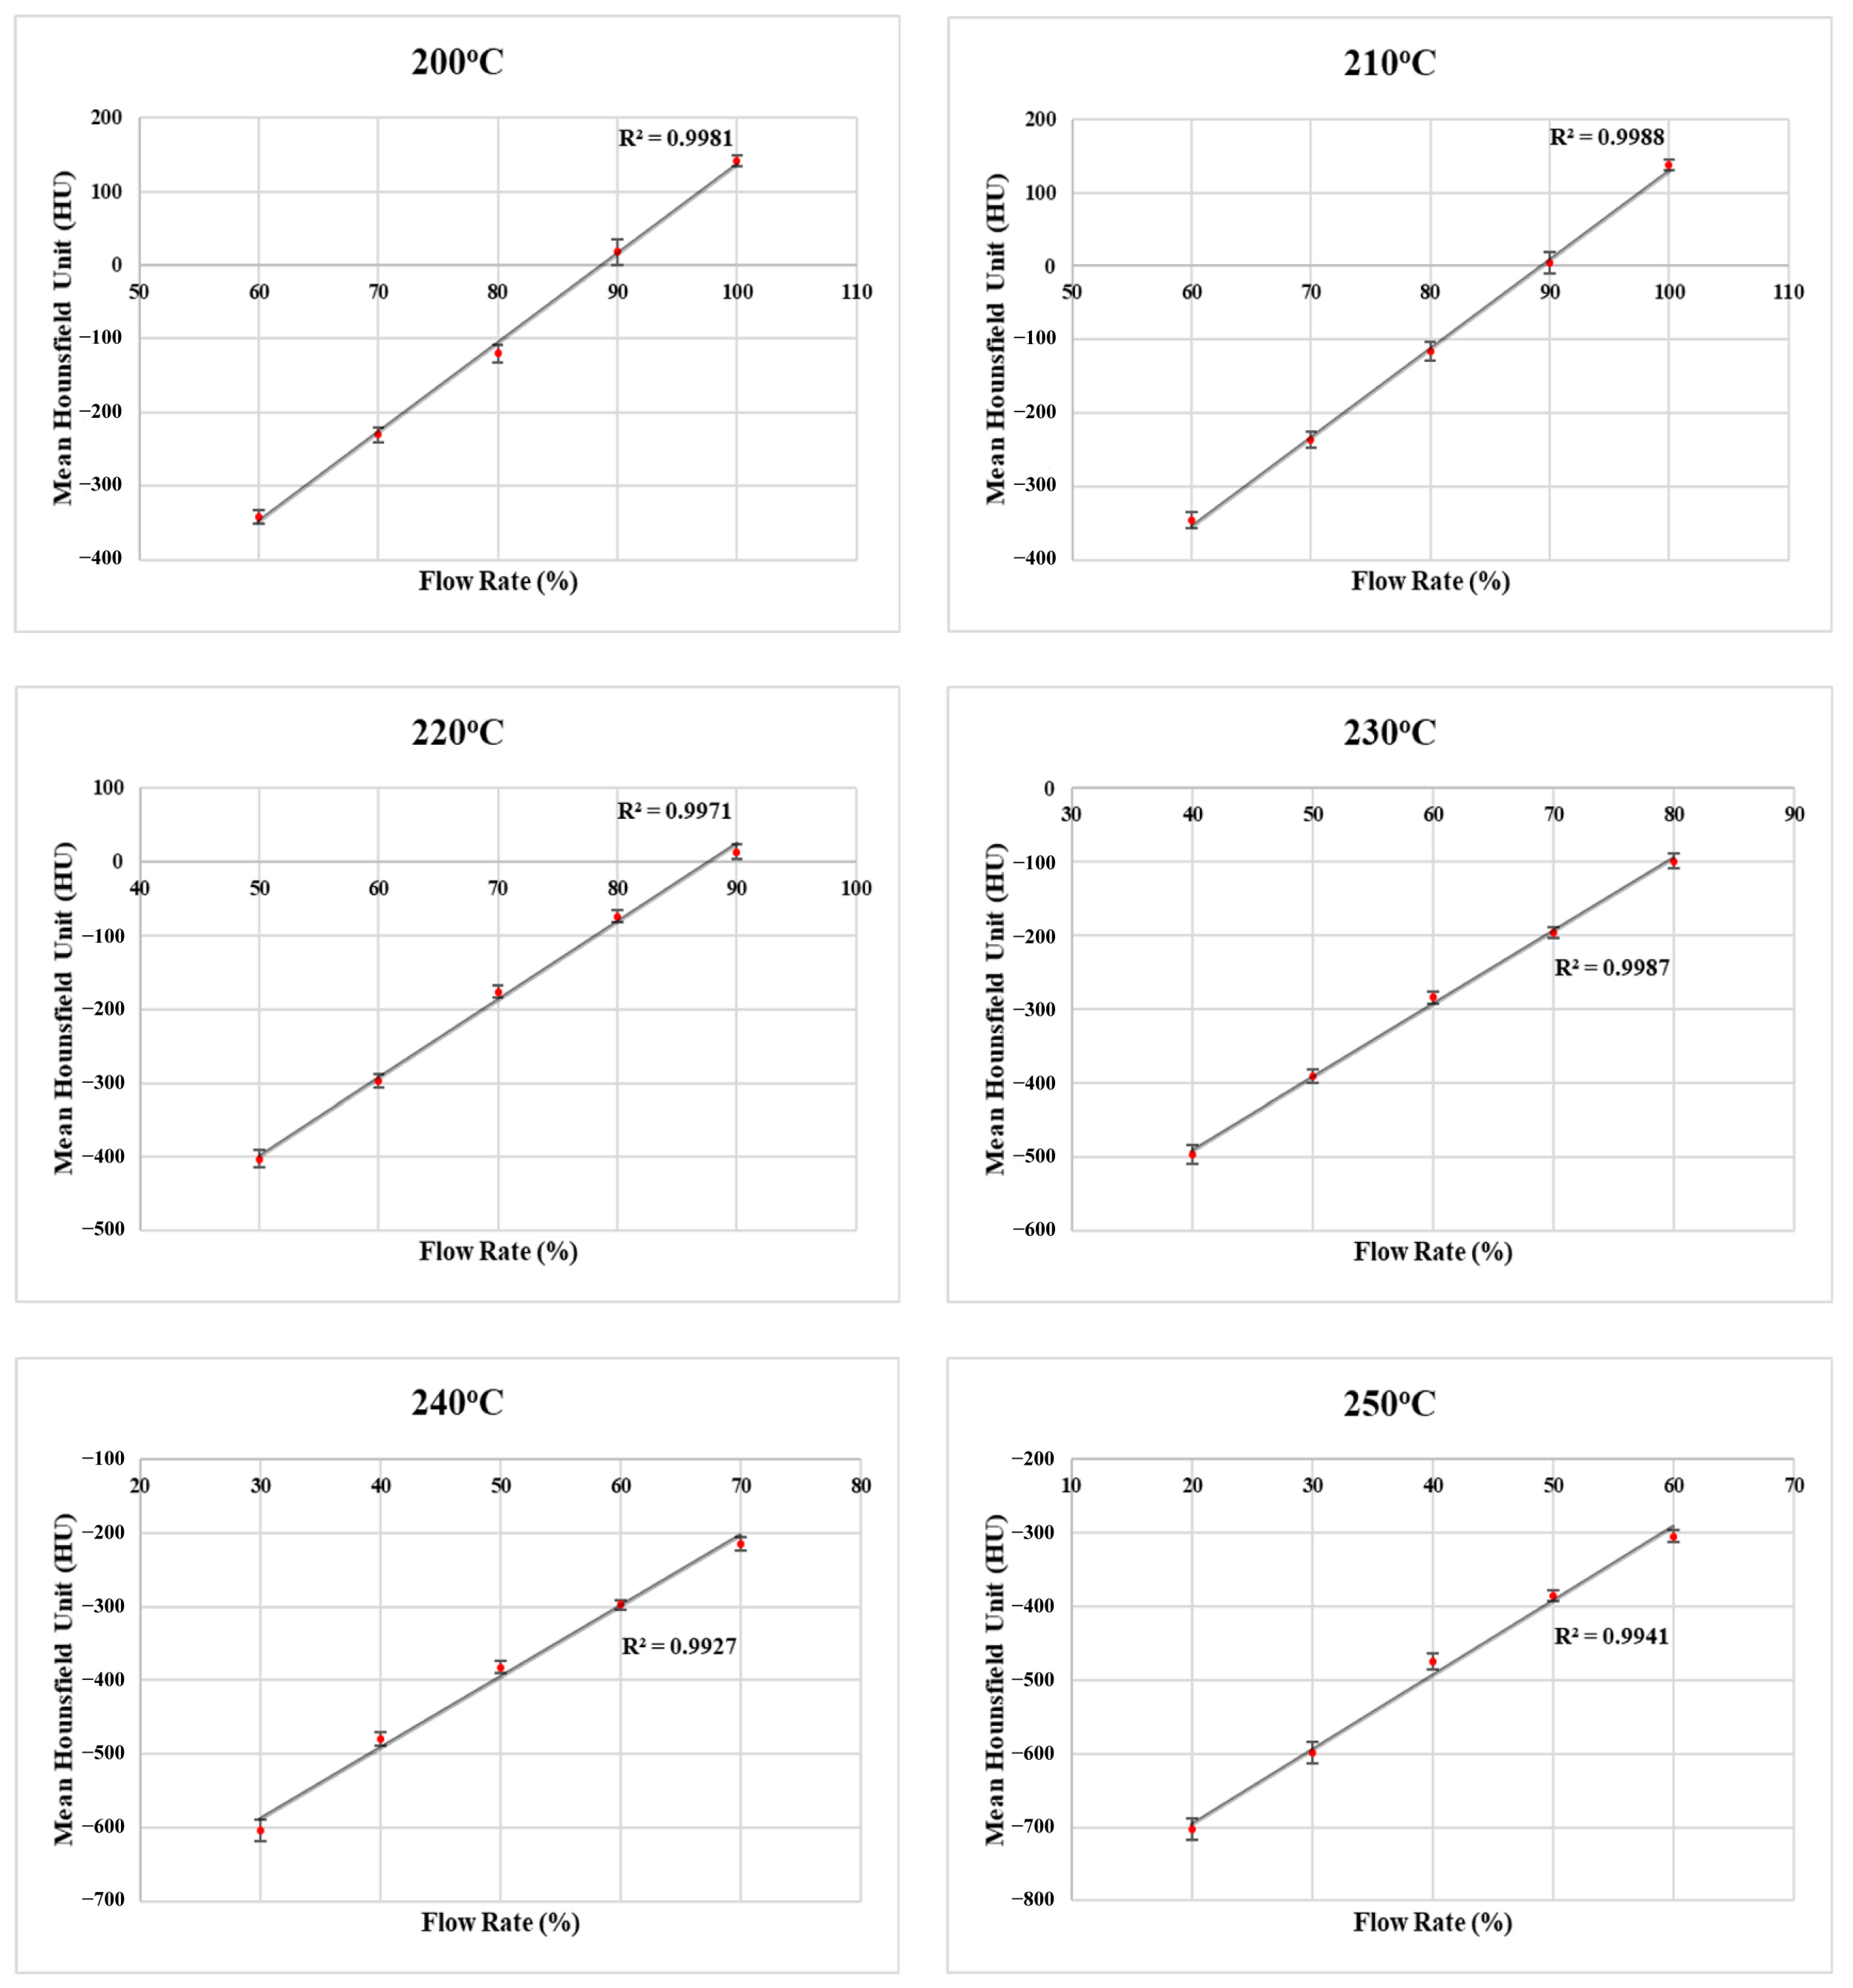
3.1. LW-PLA Samples
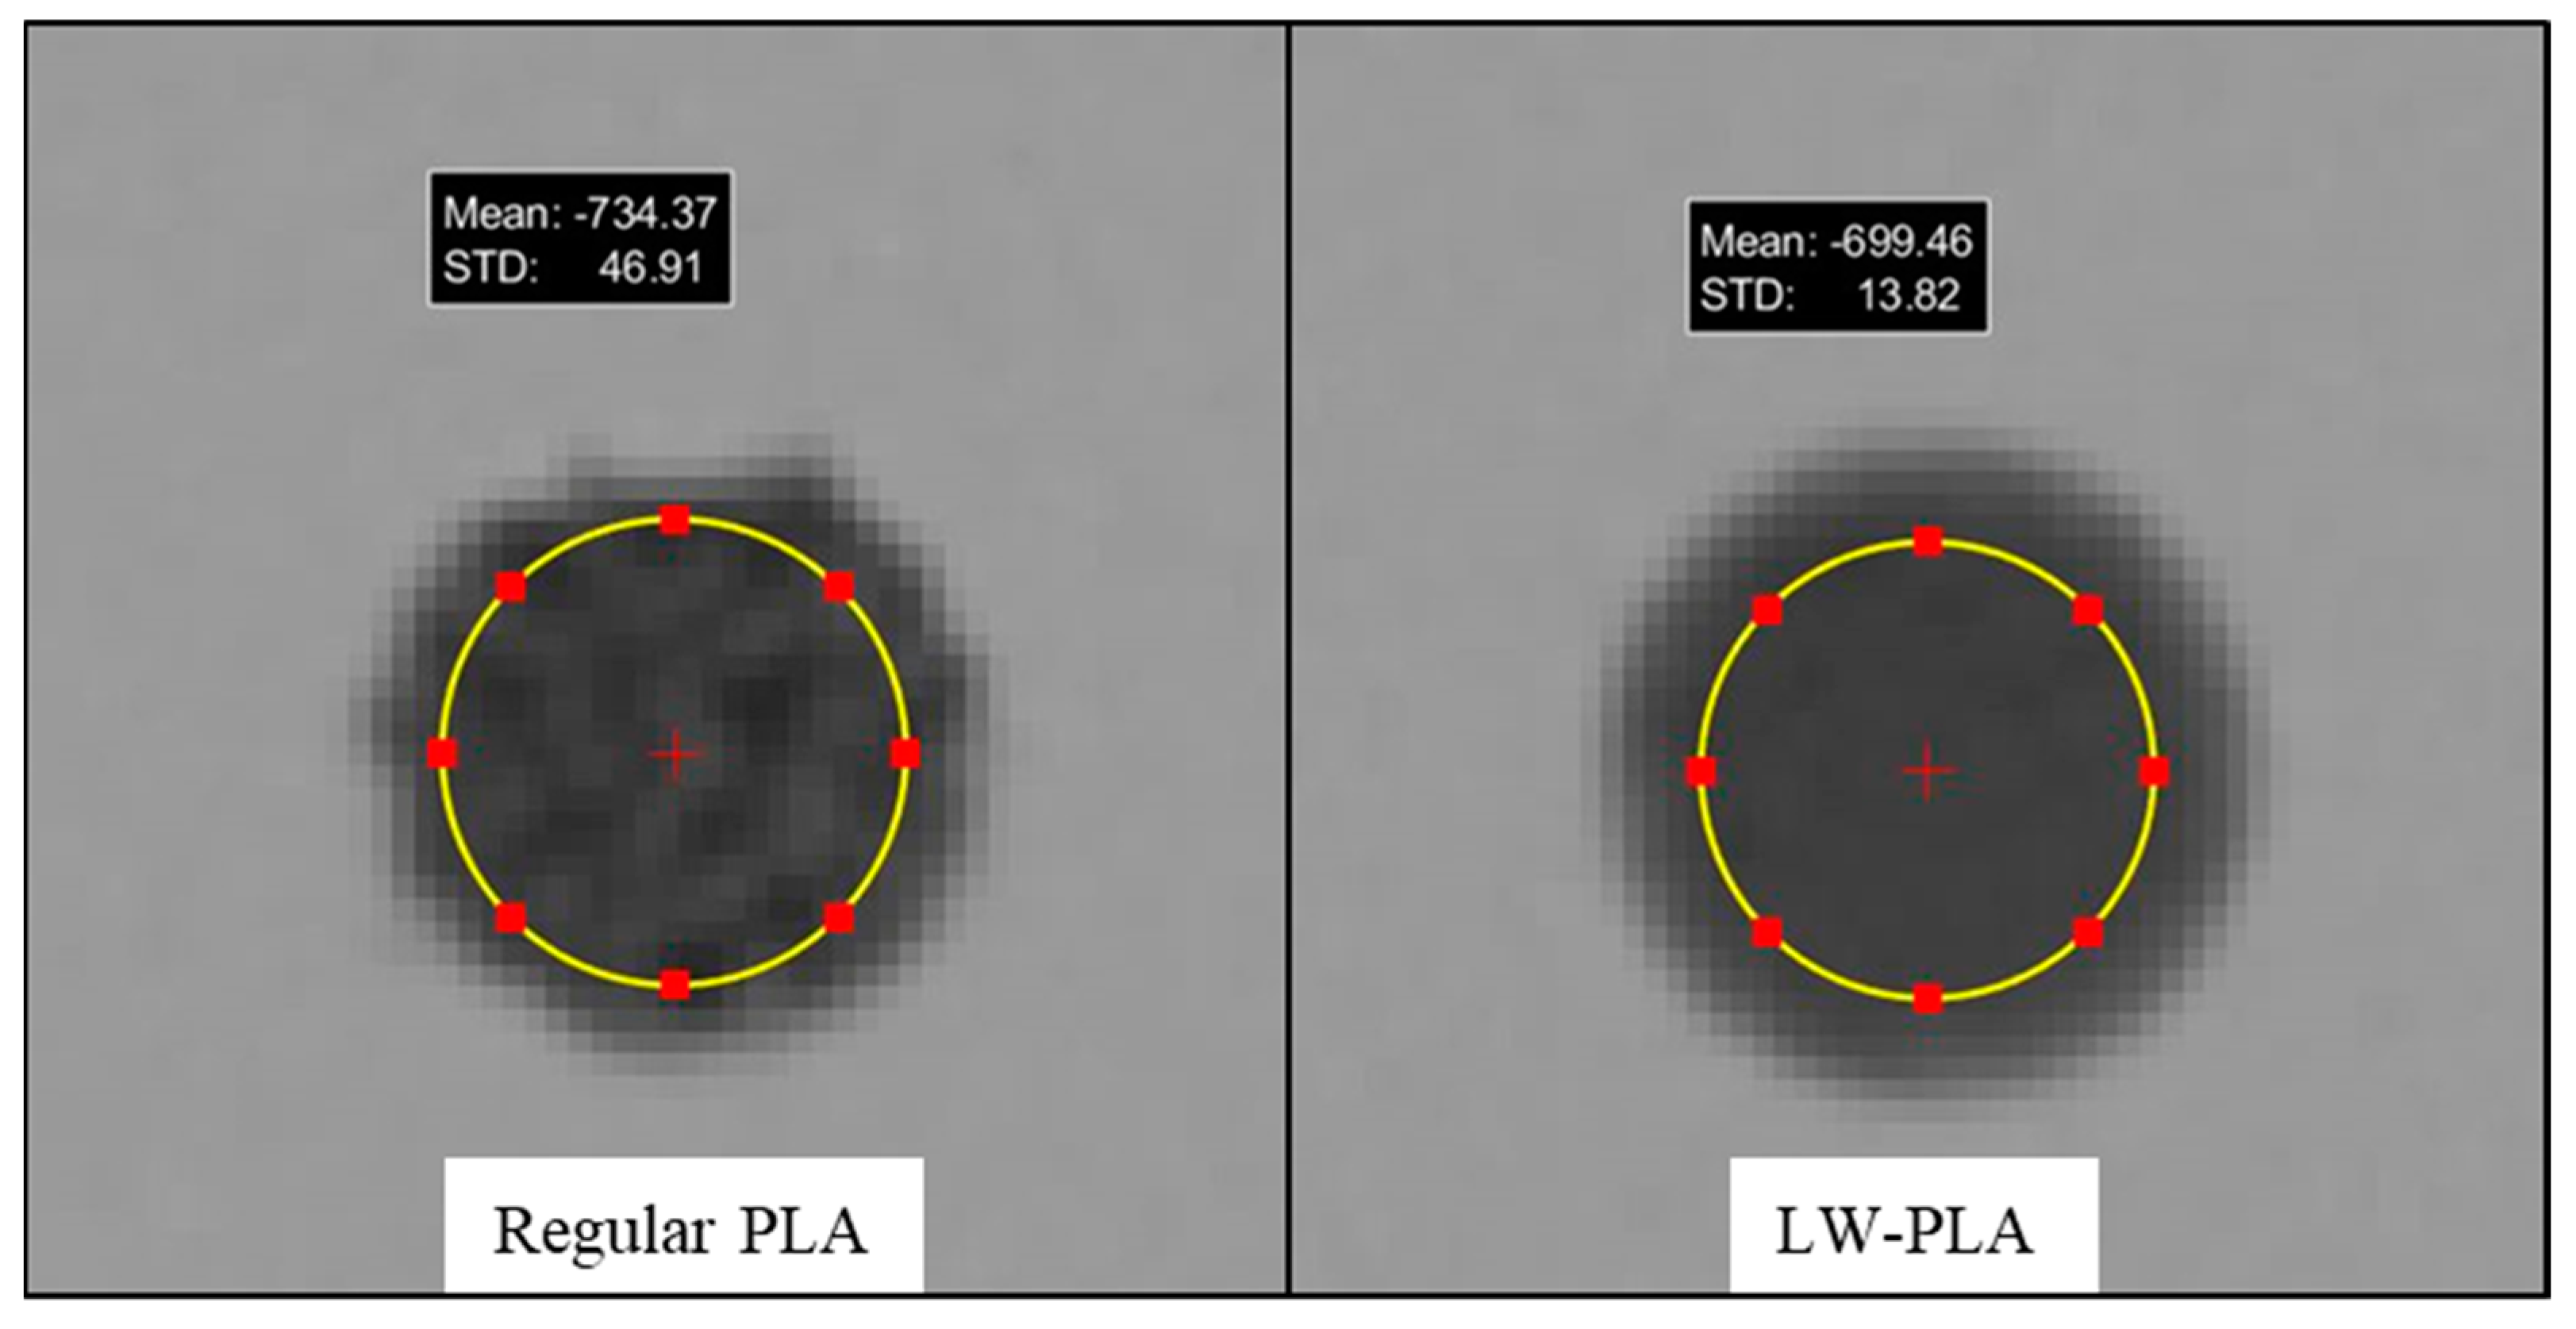
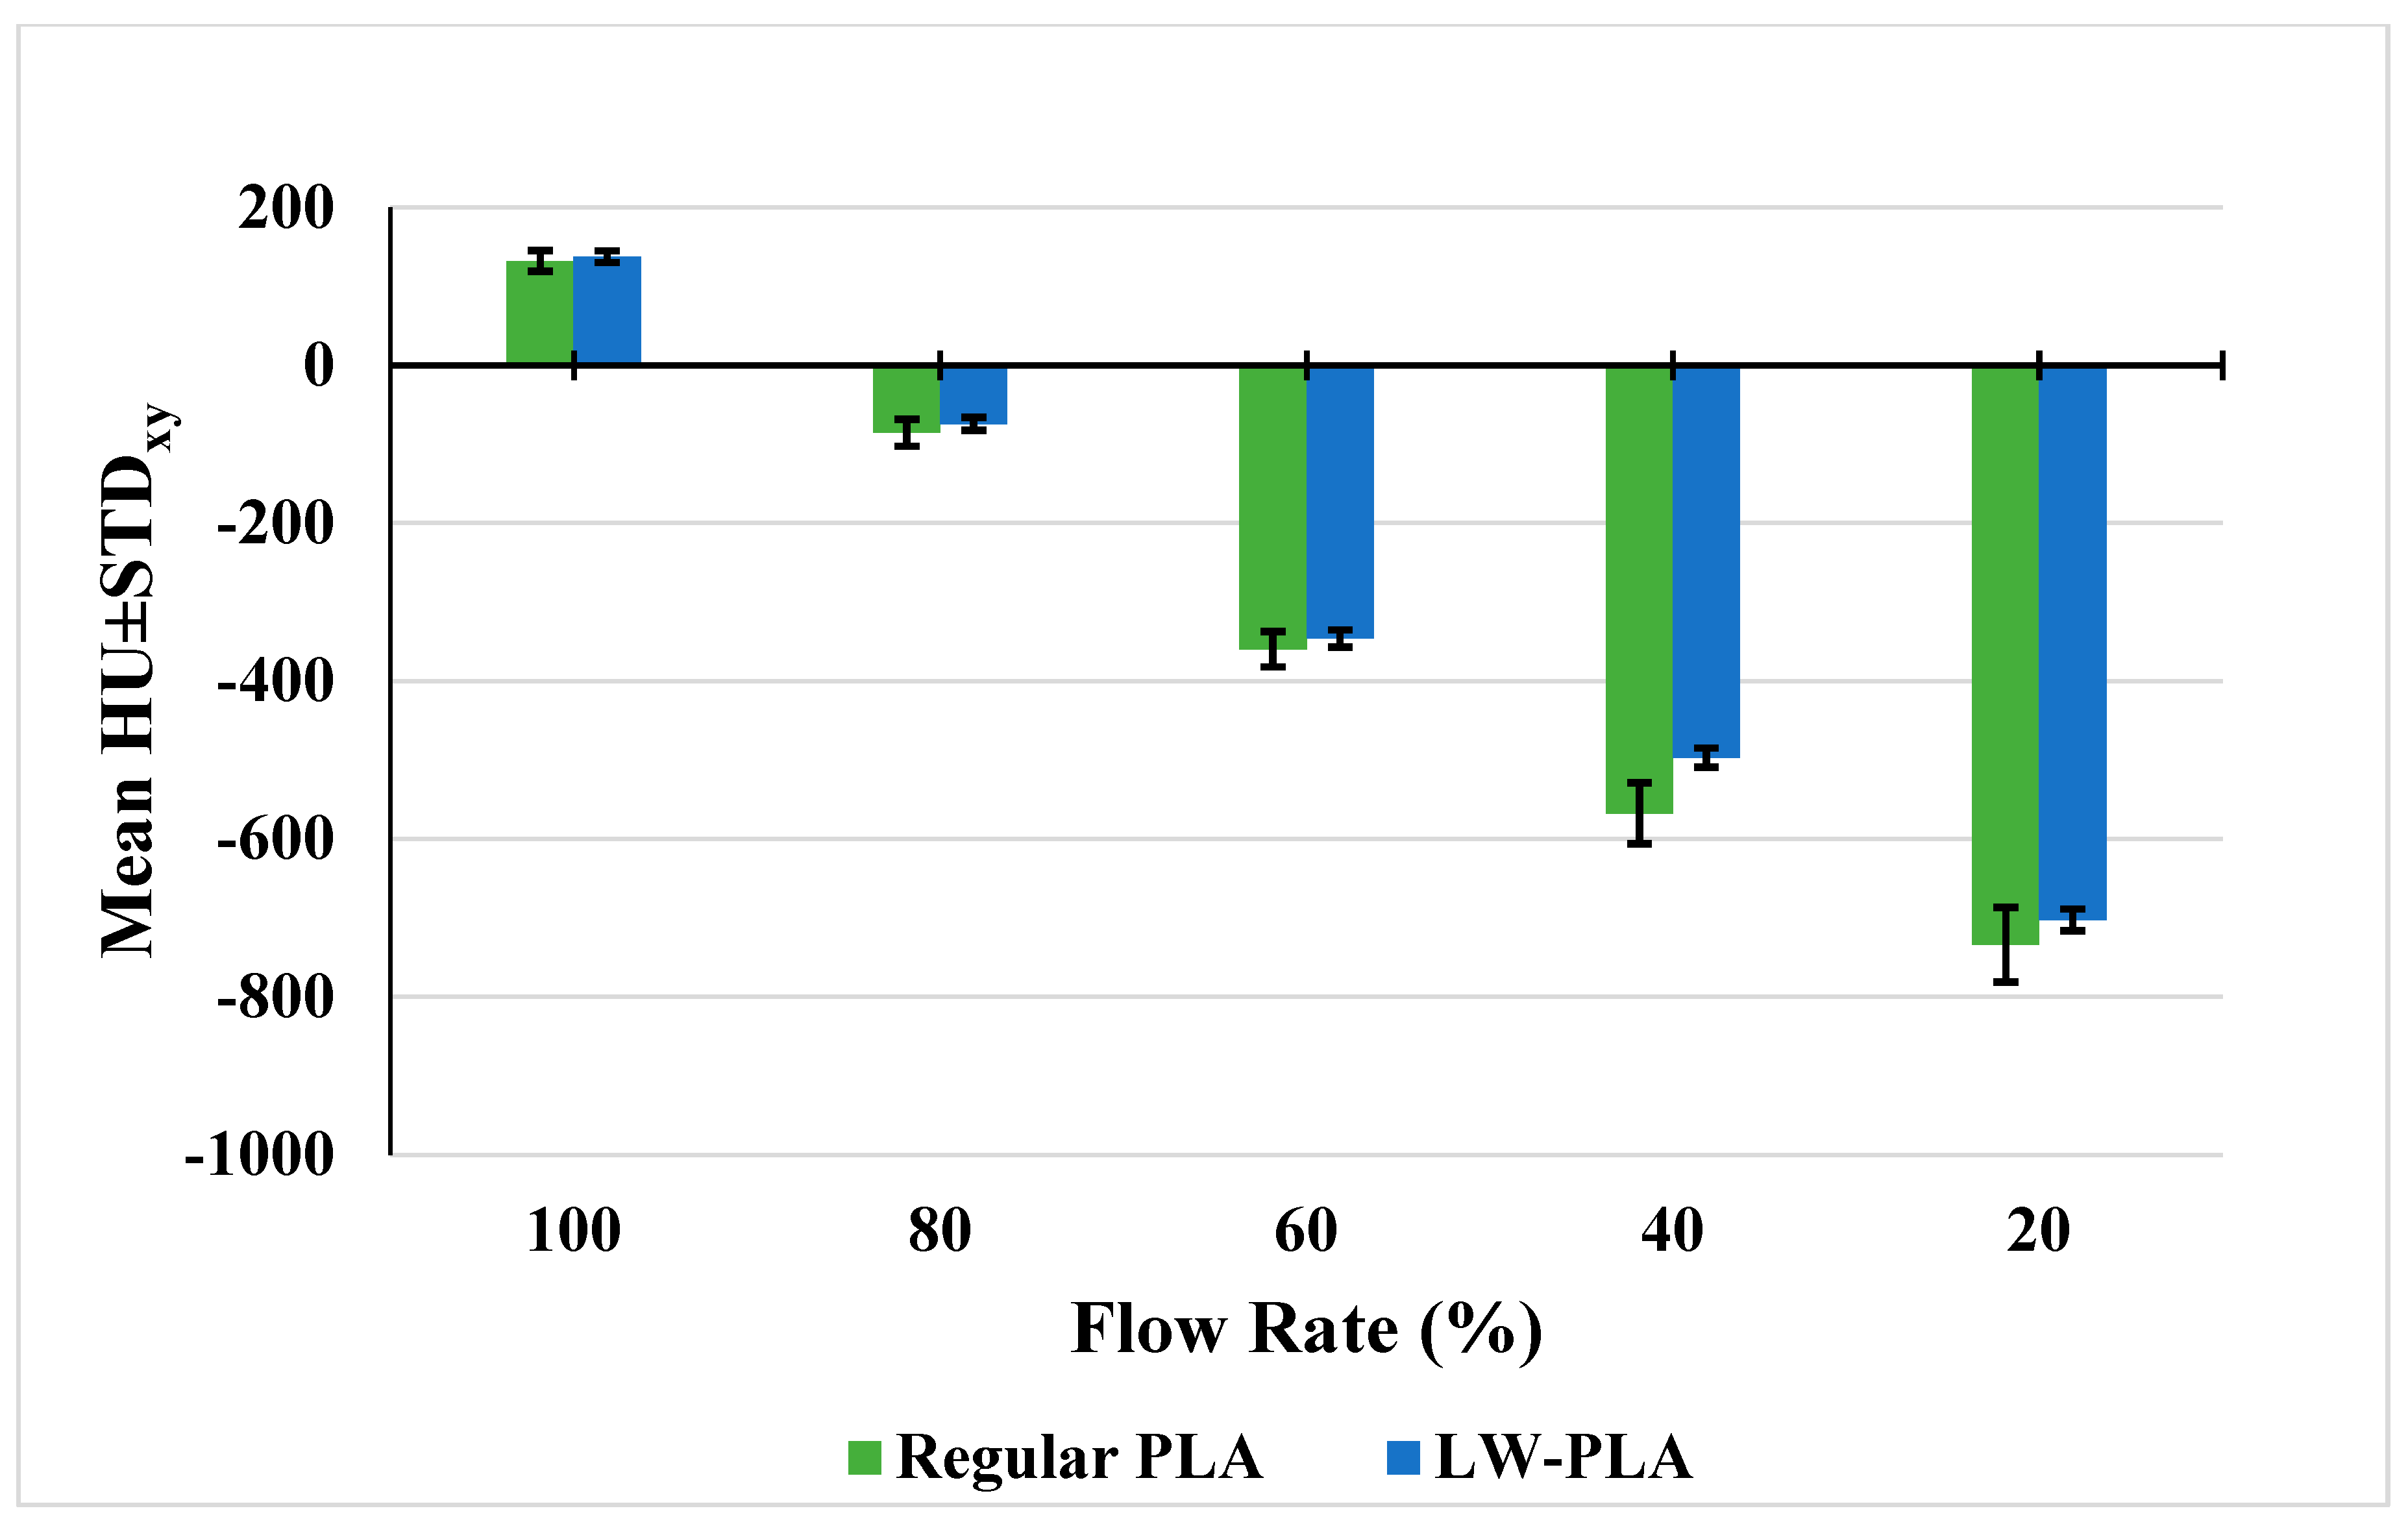
3.2. Regular PLA Samples
3.3. Reproducibility of the Print Job
3.4. LW-PLA Findings for Different Print Size and Print Speed
4. Discussion
5. Conclusions
Author Contributions
Funding
Institutional Review Board Statement
Informed Consent Statement
Data Availability Statement
Conflicts of Interest
References
- Haleem, A.; Javaid, M.; Suman, R.; Singh, R.P. 3D Printing Applications for Radiology: An Overview. Indian J. Radiol. Imaging 2021, 31, 10–17. Available online: http://www.ncbi.nlm.nih.gov/pubmed/34316106 (accessed on 20 November 2023). [PubMed]
- Tino, R.; Yeo, A.; Leary, M.; Brandt, M.; Kron, T. A systematic review on 3D-Printed imaging and dosimetry phantoms in radiation therapy. Technol. Cancer Res. Treat. 2019, 18, 1–14. [Google Scholar] [CrossRef] [PubMed]
- Filippou, V.; Tsoumpas, C. Recent advances on the development of phantoms using 3D printing for imaging with CT, MRI, PET, SPECT, and ultrasound. Med. Phys. 2018, 45, e740–e760. [Google Scholar] [CrossRef] [PubMed]
- McGarry, C.K.; Grattan, L.J.; Ivory, A.M.; Leek, F.; Liney, G.P.; Liu, Y.; Miloro, P.; Rai, R.; Robinson, A.P.; Shih, A.J.; et al. Tissue mimicking materials for imaging and therapy phantoms: A review. Phys. Med. Biol. 2020, 65, 23TR01. [Google Scholar] [CrossRef] [PubMed]
- Bibb, R.; Thompson, D.; Winder, J. Computed tomography characterisation of additive manufacturing materials. Med. Eng. Phys. 2011, 33, 590–596. [Google Scholar] [CrossRef]
- Shin, J.; Sandhu, R.S.; Shih, G. Imaging Properties of 3D Printed Materials: Multi-Energy CT of Filament Polymers. J. Digit. Imaging 2017, 30, 572–575. [Google Scholar] [CrossRef]
- Alssabbagh, M.; Tajuddin, A.A.; Manap, M.b.A.; Zainon, R. Evaluation of nine 3D printing materials as tissue equivalent materials in terms of mass attenuation coefficient and mass density. Int. J. Adv. Appl. Sci. 2017, 4, 168–173. Available online: http://www.science-gate.com/IJAAS/V4I9/Alssabbagh.html (accessed on 20 November 2023). [CrossRef]
- Solc, J.; Vrba, T.; Burianova, L. Tissue-equivalence of 3D-printed plastics for medical phantoms in radiology. J. Instrum. 2018, 13, P09018. [Google Scholar] [CrossRef]
- Ivanov, D.; Bliznakova, K.; Buliev, I.; Popov, P.; Mettivier, G.; Russo, P.; Di Lillo, F.; Sarno, A.; Vignero, J.; Bosmans, H.; et al. Suitability of low density materials for 3D printing of physical breast phantoms. Phys. Med. Biol. 2018, 63, 175020. [Google Scholar] [CrossRef]
- Assemany, L.P.F.; Rodrigues, O.; da Silva, E.; Potiens, M.d.P.A. Evaluation of 3D printing filaments for construction of a pediatric phantom for dosimetry in CBCT. Radiat. Phys. Chem. 2020, 167, 108227. [Google Scholar] [CrossRef]
- Kalender, W.A. Computed Tomography: Fundamentals, System Technology, Image Quality, Applications, 3rd ed.; Publicis: Paris, France, 2011. [Google Scholar]
- Ma, X.; Buschmann, M.; Unger, E.; Homolka, P. Classification of X-ray Attenuation Properties of Additive Manufacturing and 3D Printing Materials Using Computed Tomography from 70 to 140 kVp. Front. Bioeng. Biotechnol. 2021, 9, 763960. [Google Scholar] [CrossRef] [PubMed]
- Yeo, A.; Brandt, M.; Leary, M.; Kron, T.; Tino, R. The interlace deposition method of bone equivalent material extrusion 3D printing for imaging in radiotherapy. Mater. Des. 2021, 199, 109439. [Google Scholar] [CrossRef]
- Dancewicz, O.L.; Sylvander, S.R.; Markwell, T.S.; Crowe, S.B.; Trapp, J.V. Radiological properties of 3D printed materials in kilovoltage and megavoltage photon beams. Phys. Med. 2017, 38, 111–118. [Google Scholar] [CrossRef] [PubMed]
- Kozee, M.; Weygand, J.; Andreozzi, J.M.; Hunt, D.; Perez, B.A.; Graham, J.A.; Redler, G. Methodology for computed tomography characterization of commercially available 3D printing materials for use in radiology/radiation oncology. J. Appl. Clin. Med. Phys. 2023, 24, e13999. [Google Scholar] [CrossRef] [PubMed]
- Ceh, J.; Youd, T.; Mastrovich, Z.; Peterson, C.; Khan, S.; Sasser, T.A.; Sander, I.M.; Doney, J.; Turner, C.; Leevy, W.M. Bismuth infusion of ABS enables additive manufacturing of complex radiological phantoms and shielding equipmen. Sensors 2017, 17, 459. [Google Scholar] [CrossRef] [PubMed]
- Hamedani, B.A.; Melvin, A.; Vaheesan, K.; Gadani, S.; Pereira, K.; Hall, A.F. Three-dimensional printing CT-derived objects with controllable radiopacity. J. Appl. Clin. Med. Phys. 2018, 19, 317–328. [Google Scholar] [CrossRef] [PubMed]
- Kairn, T.; Crowe, S.B.; Markwell, T. Use of 3D printed materials as tissue-equivalent phantoms. In IFMBE Proceedings; Springer: New York, NY, USA, 2015; pp. 728–731. [Google Scholar]
- Madamesila, J.; McGeachy, P.; Villarreal Barajas, J.E.; Khan, R. Characterizing 3D printing in the fabrication of variable density phantoms for quality assurance of radiotherapy. Phys. Med. 2016, 32, 242–247. [Google Scholar] [CrossRef]
- Negus, I.S.; Holmes, R.B.; Jordan, K.C.; Nash, D.A.; Thorne, G.C.; Saunders, M. Technical Note: Development of a 3D printed subresolution sandwich phantom for validation of brain SPECT analysis. Med. Phys. 2016, 43, 5020–5027. [Google Scholar] [CrossRef]
- Mille, M.M.; Griffin, K.T.; Maass-Moreno, R.; Lee, C. Fabrication of a pediatric torso phantom with multiple tissues represented using a dual nozzle thermoplastic 3D printe. J. Appl. Clin. Med. Phys. 2020, 21, 226–236. [Google Scholar] [CrossRef]
- Hong, D.; Lee, S.; Kim, G.B.; Lee, S.M.; Kim, N.; Seo, J.B. Development of a CT imaging phantom of anthromorphic lung using fused deposition modeling 3D printing. Medicine 2020, 99, e18617. [Google Scholar] [CrossRef]
- Okkalidis, N.; Chatzigeorgiou, C.; Okkalides, D. Assessment of 11 Available Materials With Custom Three-Dimensional-Printing Patterns for the Simulation of Muscle, Fat, and Lung Hounsfield Units in Patient-Specific Phantoms. J. Eng. Sci. Med. Diagn. Ther. 2018, 1, 011003. [Google Scholar] [CrossRef]
- Cavaliere, C.; Baldi, D.; Brancato, V.; Aiello, M.; Salvatore, M. A customized anthropomorphic 3D-printed phantom to reproducibility assessment in computed tomography: An oncological case study. Front. Oncol. 2023, 13, 1123796. [Google Scholar] [CrossRef] [PubMed]
- Okkalidis, N. A novel 3D printing method for accurate anatomy replication in patient specific phantoms. Med. Phys. 2018, 45, 4600–4606. [Google Scholar] [CrossRef] [PubMed]
- Mei, K.; Geagan, M.; Roshkovan, L.; Litt, H.I.; Gang, G.J.; Shapira, N.; Stayman, J.W.; Noël, P.B. Three-dimensional printing of patient-specific lung phantoms for CT imaging: Emulating lung tissue with accurate attenuation profiles and textures. Med. Phys. 2022, 49, 825–835. [Google Scholar] [CrossRef] [PubMed]
- Available online: https://deckard.duhs.duke.edu/~samei/tg233.html (accessed on 18 November 2023).
- Ehler, E.; Craft, D.; Rong, Y. 3D printing technology will eventually eliminate the need of purchasing commercial phantoms for clinical medical physics QA procedures. J. Appl. Clin. Med. Phys. 2018, 19, 8–12. [Google Scholar] [CrossRef] [PubMed]
- Craft, D.F.; Howell, R.M. Preparation and fabrication of a full-scale, sagittal-sliced, 3D-printed, patient-specific radiotherapy phantom. J. Appl. Clin. Med. Phys. 2017, 18, 285–292. [Google Scholar] [CrossRef]
- Ma, X.; Figl, M.; Unger, E.; Buschmann, M.; Homolka, P. OPEN X-ray attenuation of bone, soft and adipose tissue in CT from 70 to 140 kV and comparison with 3D printable additive manufacturing materials. Sci. Rep. 2022, 12, 14580. [Google Scholar] [CrossRef]
- Mazzilli, A.; Fiorino, C.; Loria, A.; Mori, M.; Esposito, P.G.; Palumbo, D.; de Cobelli, F.; del Vecchio, A. An Automatic Approach for Individual HU-Based Characterization of Lungs in COVID-19 Patients. Appl. Sci. 2021, 11, 1238. [Google Scholar] [CrossRef]
- Tino, R.; Leary, M.; Yeo, A.; Brandt, M.; Kron, T. Gyroid structures for 3D-printed heterogeneous radiotherapy phantoms. Phys. Med. Biol. 2019, 64, 21NT05. [Google Scholar] [CrossRef]
- Leary, M.; Keller, C.; Yeo, A. Additive Manufacture of Lung Equivalent Anthropomorphic Phantoms: A Method to Control Hounsfield Number Utilizing Partial Volume Effect. J. Eng. Sci. Med. Diagn. Ther. 2020, 3, 011001. [Google Scholar] [CrossRef]


| Temperature (°C) | Flow Rate (%) | ||||
|---|---|---|---|---|---|
| 200 | 100 | 90 | 80 | 70 | 60 |
| 210 | 100 | 90 | 80 | 70 | 60 |
| 220 | 90 | 80 | 70 | 60 | 50 |
| 230 | 80 | 70 | 60 | 50 | 40 |
| 240 | 70 | 60 | 50 | 40 | 30 |
| 250 | 60 | 50 | 40 | 30 | 20 |
| Printing Temperature (°C) | Flow Rate (%) | Mass (g) | Density (g/cm3) | Mean HU | ±STDxy | ±STDz |
|---|---|---|---|---|---|---|
| 200 | 100 | 4.22 | 1.19 | +141.4 | 7.1 | 1.1 |
| 90 | 3.88 | 1.10 | +17.6 | 16.7 | 9.0 | |
| 80 | 3.52 | 1.00 | −119.6 | 11.9 | 5.1 | |
| 70 | 3.15 | 0.89 | −230.2 | 9.6 | 2.3 | |
| 60 | 2.79 | 0.79 | −340.7 | 9.1 | 3.4 | |
| 210 | 100 | 4.27 | 1.21 | +137.6 | 7.3 | 2.1 |
| 90 | 3.86 | 1.09 | +4.0 | 14.6 | 2.2 | |
| 80 | 3.49 | 0.99 | −116.3 | 12.5 | 8.9 | |
| 70 | 3.12 | 0.88 | −237.1 | 10.9 | 4.4 | |
| 60 | 2.77 | 0.78 | −346.1 | 10.8 | 6.9 | |
| 220 | 90 | 3.85 | 1.09 | +13.5 | 10.1 | 5.1 |
| 80 | 3.52 | 1.00 | −74.2 | 8.1 | 3.6 | |
| 70 | 3.13 | 0.89 | −176.1 | 7.6 | 7.4 | |
| 60 | 2.75 | 0.78 | −296.4 | 9.1 | 4.9 | |
| 50 | 2.38 | 0.67 | −402.6 | 11.8 | 4.9 | |
| 230 | 80 | 3.51 | 0.99 | −98.7 | 9.2 | 7.5 |
| 70 | 3.13 | 0.88 | −195.3 | 7.3 | 6.1 | |
| 60 | 2.77 | 0.78 | −284.2 | 7.6 | 3.6 | |
| 50 | 2.39 | 0.68 | −390.9 | 9.1 | 4.0 | |
| 40 | 2.00 | 0.57 | −497.1 | 12.3 | 5.5 | |
| 240 | 70 | 3.15 | 0.89 | −215.2 | 9.1 | 1.1 |
| 60 | 2.78 | 0.78 | −297.8 | 6.7 | 3.5 | |
| 50 | 2.42 | 0.68 | −382.5 | 7.9 | 4.3 | |
| 40 | 2.06 | 0.58 | −479.9 | 9.3 | 3.6 | |
| 30 | 1.67 | 0.47 | −602.9 | 14.8 | 3.2 | |
| 250 | 60 | 2.72 | 0.77 | −304.7 | 7.4 | 6.3 |
| 50 | 2.38 | 0.67 | −386.0 | 7.8 | 2.9 | |
| 40 | 2.02 | 0.57 | −475.8 | 10.9 | 4.7 | |
| 30 | 1.65 | 0.47 | −599.3 | 14.1 | 1.9 | |
| 20 | 1.27 | 0.36 | −702.7 | 13.9 | 2.2 |
| Printing Temperature (°C) | Flow Rate (%) | Mass (g) | Density (g/cm3) | Mean HU | ±STDxy | ±STDz |
|---|---|---|---|---|---|---|
| 230 | 100 | 4.30 | 1.21 | 132.2 | 13.3 | 7.2 |
| 80 | 3.46 | 0.98 | −106.6 | 41.0 | 10.3 | |
| 60 | 2.80 | 0.79 | −359.8 | 22.4 | 9.1 | |
| 40 | 2.08 | 0.59 | −567.6 | 38.8 | 8.4 | |
| 20 | 1.32 | 0.37 | −734.0 | 47.3 | 3.0 |
| Mean HU ± STDxy | |||||||
|---|---|---|---|---|---|---|---|
| Flow Rate (%) | 230 °C Regular PLA | 200 °C LW-PLA | 210 °C LW-PLA | 220 °C LW-PLA | 230 °C LW-PLA | 240 °C LW-PLA | 250 °C LW-PLA |
| 100 | +132.2 ± 13.3 | +141.4 ± 7.1 | +137.6 ± 7.3 | - | - | - | - |
| 80 | −85.5 ± 17.2 * | −119.6 ± 11.9 | −116.3 ± 12.5 | −74.2 ± 8.1 | −98.7 ± 9.2 | - | - |
| 60 | −359.8 ± 22.4 | −340.7 ± 9.1 | −346.1 ± 10.8 | −296.4 ± 9.1 | −284.2 ± 7.6 | −297.8 ± 6.7 | −304.7 ± 7.4 |
| 40 | −567.6 ± 38.8 | - | - | - | −497.1 ± 12.3 | −479.9 ± 9.3 | −475.8 ± 10.9 |
| 20 | −734.0 ± 47.3 | - | - | - | - | - | −702.7 ± 13.9 |
| Printing Temperature (°C) | Flow Rate (%) | HU1 | HU2 | HU3 | ±STD | |
|---|---|---|---|---|---|---|
| 210 | 100 | 138.9 | 137.6 | 136.7 | 137.7 | 1.1 |
| 90 | 7.7 | 4.0 | 5.7 | 5.8 | 1.8 | |
| 80 | −113.5 | −116.3 | −116.3 | −115.4 | 1.6 | |
| 70 | −228.6 | −237.1 | −235.4 | −233.7 | 4.5 | |
| 60 | −347.8 | −346.1 | −353.8 | −349.2 | 4.0 | |
| 230 | 80 | −98.7 | −103.3 | −99.8 | −100.6 | 2.4 |
| 70 | −195.3 | −205.2 | −197.5 | −199.3 | 5.2 | |
| 60 | −284.2 | −295.8 | −291.8 | −290.6 | 5.9 | |
| 50 | −390.9 | −390.1 | −387.9 | −389.6 | 1.6 | |
| 40 | −497.1 | −486.3 | −494.6 | −492.7 | 5.6 | |
| 250 | 60 | −304.7 | −301.2 | −295.7 | −300.5 | 4.5 |
| 50 | −386.0 | −391.8 | −384.0 | −387.3 | 4.1 | |
| 40 | −475.8 | −478.4 | −473.3 | −475.8 | 2.6 | |
| 30 | −599.3 | −602.2 | −598.7 | −600.1 | 1.8 | |
| 20 | −702.7 | −708.0 | −704.0 | −704.9 | 2.7 |
| Diameter (cm) | Mass (g) | Density (g/cm3) | Mean HU | STDxy | STDz |
|---|---|---|---|---|---|
| 1.5 | 1.53 | 0.43 | −589.1 | 9.2 | 2.5 |
| 3.5 | 8.33 | 0.43 | −587.4 | 7.3 | 3.7 |
| 5.5 | 20.6 | 0.43 | −581.4 | 6.1 | 2.7 |
Disclaimer/Publisher’s Note: The statements, opinions and data contained in all publications are solely those of the individual author(s) and contributor(s) and not of MDPI and/or the editor(s). MDPI and/or the editor(s) disclaim responsibility for any injury to people or property resulting from any ideas, methods, instructions or products referred to in the content. |
© 2024 by the authors. Licensee MDPI, Basel, Switzerland. This article is an open access article distributed under the terms and conditions of the Creative Commons Attribution (CC BY) license (https://creativecommons.org/licenses/by/4.0/).
Share and Cite
Ozsoykal, I.; Yurt, A. Introduction of a Novel Technique in Density-Adjusted 3D Printing for the Manufacture of Soft-Tissue-Equivalent Radiological Phantoms. Appl. Sci. 2024, 14, 509. https://doi.org/10.3390/app14020509
Ozsoykal I, Yurt A. Introduction of a Novel Technique in Density-Adjusted 3D Printing for the Manufacture of Soft-Tissue-Equivalent Radiological Phantoms. Applied Sciences. 2024; 14(2):509. https://doi.org/10.3390/app14020509
Chicago/Turabian StyleOzsoykal, Ismail, and Ayşegül Yurt. 2024. "Introduction of a Novel Technique in Density-Adjusted 3D Printing for the Manufacture of Soft-Tissue-Equivalent Radiological Phantoms" Applied Sciences 14, no. 2: 509. https://doi.org/10.3390/app14020509
APA StyleOzsoykal, I., & Yurt, A. (2024). Introduction of a Novel Technique in Density-Adjusted 3D Printing for the Manufacture of Soft-Tissue-Equivalent Radiological Phantoms. Applied Sciences, 14(2), 509. https://doi.org/10.3390/app14020509