1. Introduction
In the global supply chains of agricultural production, remote sensing technology has proven valuable in various applications, such as in vehicle and boat detection, which plays an essential role in this field. It can help farmers, agricultural experts, and government agencies to identify and monitor crop growth, the effects of pests and diseases [
1], soil moisture, and other important information about farmland management and agricultural production. By accurately locating and classifying agricultural objectives, these technologies can provide important decision support for agricultural production, helping farmers to optimize resource use, increase yields, and reduce environmental impacts [
2]. Ensuring the efficiency and reliability of the supply chain has become particularly important as the global demand for food grows. The accurate detection and analysis of targets in remotely sensed imagery can provide vital information about vehicles, ports, and buildings, thus helping to plan and optimize all aspects of the supply chain [
3,
4]. In addition, the technology can be used to monitor the transparency of the supply chain during food distribution. Potential safety issues and illegal activities, such as counterfeit food and other illegal additives, can be detected by analyzing remote sensing images of vehicles, logistics nodes, and trading places. This helps to protect consumer rights, maintain a level playing field in the agriculture market, and improve the supply sustainability of products [
5].
Taking the grain supply chain management system (GSMS) as an example, remote sensing images can monitor the entire processes from grain planting, production, storage, transportation, international trade, and consumption. With the strong support of remote sensing technology, the GSMS integrates various aspects of information, including traffic management [
6], road infrastructure, weather and land conditions [
7], and user consumption behavior, to achieve more intelligent and efficient management decision results. For example, by analyzing remote sensing images of a certain city, critical information such as the ocean transportation density, aircraft flight frequency, truck and high-speed rail capacity, and cold chain facilities’ distribution can be learned. This is of great significance in resource allocation and quality assurance reduction in international grain trade and provides an effective method to achieve transportation assurance and food quality safety [
8].
Remote sensing is a technology that collects electromagnetic radiation information from artificial satellites, airplanes, or other vehicles about physical targets to identify the Earth’s environment and resources. Any object has different electromagnetic wave reflection or radiation characteristics. Aerospace remote sensing technology uses remote sensors mounted on aircraft to sense the electromagnetic radiation characteristics of physical targets and record the characteristics for identification and judgment. Remote sensing images are acquired using imaging equipment on aircraft to capture ground objects. These images are valuable sources of dynamic and comprehensive data, which are crucial for land cover monitoring, urban information planning, and marine environment detection.
Currently, remote sensing technology is widely used in international agricultural trade, transportation supervision, supply chain monitoring, and other scenarios [
9]. For example, in a certain port, accurately identifying the number of ships, planes, trucks, and other transportation equipment from remote sensing images is essential in various practical applications of supply chain regulation. It can effectively analyze the trade situations of different agricultural productions by recognizing their types and estimating the total amount of goods in circulation as well as the operation situation of each supply chain [
10]. Thus, determining how to accurately distinguish the category, quantity, location, and other information of various transportation vehicles is vital for improving the supply ability in international trade. In addition, remote sensing images have long been plagued by some issues, such as large-scale ranging, low pixel quality, mutual occlusion, and a dense distribution of individual objects, making accurately identifying objects in remote sensing images a challenge; therefore, this topic has significant value and is worth studying to guarantee the efficiency of agricultural product circulation.
From a specific technical point of view, remote sensing target detection is a crucial aspect of computer vision research. It involves identifying and localizing specific targets in remote sensing images by determining their category and rectangular enclosing box coordinates. The detection process typically consists of three steps: selecting the region of interest, extracting features from the selected region, and detecting and classifying the extracted features. Remote sensing images differ from natural images in several ways. They are primarily captured from altitudes ranging from several thousand meters to tens of thousands of meters, resulting in significant variations in target scales and perspectives. Furthermore, remote sensing images are captured under different weather conditions and angles, leading to diverse factors such as lighting changes, seasonal variations, and varying imaging quality. As a result, target detection based on remote sensing images presents challenges that include complex background issues, dense small target problems, and multi-directional complexities [
11,
12]. These challenges necessitate innovative approaches to address them effectively.
Traditional methods for target detection in remote sensing images can be categorized into four types: those based on statistical features of gray-scale information, visual saliency, template matching, and classification learning [
13]. While these methods are computationally efficient, they often focus on specific scenes. In contrast, remote sensing photographs have a wide field of view, and high-resolution remote sensing photographs capture detailed surface features from multiple scenes. Traditional remote sensing image detection methods are insufficient for a fine-grained analysis of complex remote sensing scenes and lack robustness. Therefore, their applicability in target detection for high-resolution remote sensing photographs is limited [
14]. With the rapid advancement of deep learning technology, a large number of studies also have gradually been using deep learning networks to realize target detection in remote sensing images to complete different applications of practical scenarios. Those approaches enable the effective integration of multi-scale features extracted from different dimensionalities to improve detection accuracy. Moreover, they can incorporate various learning strategies and skills, including attention mechanisms, the weighted summation strategy, dynamic parameter fine-tuning, etc., to further improve the identification ability and localization accuracy of each small object in remote sensing images [
15]. Therefore, some deep neural network models designed for target detection in general image processing, such as the YOLO-serial and Faster-RCNN models, also migrate well to remote sensing applications.
However, the current state of deep learning-based algorithms reveals significant potential for advancements, specifically in detecting small targets within remote sensing images. Aerially captured imagery often portrays objects from an overhead shooting angle, highlighting unique top contour features that differentiate them from common objects. However, the high perspective of remote sensing images presents a notable hurdle, that is, different targets within these images tend to be small and densely arranged. Consequently, the process of extracting feature information for such minute targets becomes prone to loss during the model’s feature extraction phase, further exacerbating the detection challenges. Taking the cargo ship as an example, as one of the most important transport carriers in agricultural product supply, the number of pixels it occupies in large-scale remote sensing images is often very small [
16]. Moreover, many ship targets often present a dense aggregation distribution with obvious directionality, which means there is a lot of background information in the real area labeled by the horizontal box. There is a severe overlap and intersection phenomenon in different targets. Even the labeled boxes of a ship target contain more than one object, which brings a great deal of interference in the training process of the model, leading to a more serious misdetection and omission phenomenon in the model training process [
17].
These aforementioned problems are mixed together, so existing deep learning methods cannot accurately identify the transport carrier targets in remote sensing images, such as cargo ships, trucks, aircraft, etc. Thus, in the actual application of agricultural product supply, determining how to build a better intelligent method to directly process remote sensing data is a significant issue that needs to be solved urgently. This paper addresses the challenges associated with target detection in remote sensing images by proposing a novel rotating target detector named EYMR-Net, which builds upon the single-stage YOLOv7 detection framework. The primary contributions of this study encompass the following two aspects:
- (1)
To address the leakage detection issue of each small-scale target with dense distribution in remote sensing images, this study designed a feature extraction module on the backbone network of YOLOv7 by incorporating the Swin Transformer. The network’s perceptual ability is enhanced for multi-scale targets, enabling the extraction of more comprehensive feature information. Additionally, the CBAM (Convolutional Block Attention Module) is integrated into the neck module to augment the model’s capacity to analyze multi-scale targets, particularly capturing fine-grained details of dense small targets. These network enhancements contribute to improving the detection performance for dense small targets, which successfully suppresses the error of omissions and failures in detecting transport equipment from remote sensing images.
- (2)
To improve the position and orientation information of various objects, this study introduces rotating box annotations to the horizontal regression model of the YOLO framework. This modification effectively addresses two main issues. On one hand, it resolves the problem of ignoring the directionality of the YOLO algorithm when detecting targets such as ships and vehicles, ensuring accurate identification. On the other hand, it mitigates the issue of excessive redundant pixels in the detection box caused by objects with large aspect ratios detected using the horizontal box approach. By incorporating rotating box annotations, the proposed model can efficiently meet the demands of real-time monitoring applications of remote sensing in the field of agricultural supply.
This study is structured as follows:
Section 2 introduces the detection solutions in related works and their shortcomings. Then, we introduce the proposed EYMR-Net in
Section 3 and describe its principle and implementation process. Subsequently, experiments are conducted to validate the superiority of EYMR-Net, providing further evidence of the feasibility and effectiveness of the proposed method in this study. Finally, this study summarizes its contributions and outlines directions for future research.
2. Related Work
2.1. Traditional Remote Sensing Detection Methods
Traditional remote sensing image target detection involves conventional digital image processing and machine learning techniques to identify targets or regions of interest within remote sensing images. Its main processes include preprocessing, feature extraction, target detection, and post-processing [
18]. Firstly, the original remote sensing image is preprocessed, including operations such as correction, enhancement, and denoising to improve image quality and accuracy. Next, feature information in the image is extracted by applying traditional image processing algorithms. Commonly used features include color, texture, shape, edges, etc., which can be extracted using techniques such as filtering, segmentation, and edge detection. Then, machine learning methods are utilized for target detection, which can be categorized into classification-based methods and region-based methods. The former utilizes several classifiers like support vector machines or maximum likelihood methods to assign each pixel or region in an image to a specific target class [
19]. The difference is that region-based methods extract a set of candidate regions in the image and employ sliding window-based methods or region-growing algorithms to determine and refine these regions [
20]. Finally, post-processing techniques such as removing duplicate detections, boundary smoothing, and morphological operations are applied to enhance the accuracy and continuity of the detection results.
Throughout the history of traditional target detection algorithms, a common observation is that researchers have faced challenges in designing complex feature expressions due to the lack of effective image characterization. Furthermore, the limited computational power of computers has resulted in slow training speeds for these models [
21]. However, in 2001, Viola and Jones introduced the groundbreaking VJ detector [
22,
23], significantly improving the detection speed while maintaining high precision. The VJ detector employed sliding windows to exhaustively evaluate each candidate window for potential targets, although this approach was computationally intensive and exceeded the capabilities of computers at the time. Nevertheless, introducing the innovative integral graph computation method in the VJ detector addressed the computational quantity issue. Additionally, a balance between detection accuracy and speed was achieved by utilizing AdaBoost as a feature selector and implementing multi-stage classifiers with a cascade structure. Dalal et al. proposed the HOG (Histogram of Oriented Gradients) detector [
24]. This detector primarily aims to solve challenges related to feature invariance (e.g., scale, translation, and illumination) and nonlinearity (differentiating between target classes). The HOG detector laid a solid foundation for the development of numerous subsequent detectors, with its techniques being widely applied in various computer vision applications. Felzenszwalb introduced the Deformable Part-based Model (DPM), which is considered a pinnacle among traditional target detection algorithms. The DPM incorporates a root filter and multiple co-filters, where the model’s training process focuses on effectively decomposing the target. In contrast, the prediction process involves aggregating local parts of multiple targets. Girshick enhanced the DPM through techniques like Hard Negative Mining, Bounding Box Regression, and Context Priming. These improvements and the “compiling” of detection models have played significant roles in boosting detection accuracy and speed.
Traditional remote sensing image target detection has both advantages and disadvantages, creating opportunities for the development of deep learning techniques in this field. A key drawback of traditional methods is the reliance on manual feature extraction, which involves subjective selection and the extraction of visual features. This approach may be limited and fail to fully capture the complex characteristics of targets, particularly when dealing with large-scale remote sensing data. Furthermore, traditional methods heavily depend on high-quality images, making them susceptible to interference from atmospheric factors like clouds and haze. This can result in lower image quality and increased noise, thereby impacting the accuracy and stability of detection outcomes.
Additionally, traditional methods face challenges in processing large-scale data due to limitations in computing and storage resources. Since remote sensing images are often high-resolution and cover extensive areas, traditional approaches may struggle to handle such data demands efficiently. Deep learning-based remote sensing image target detection techniques have emerged to address these drawbacks. Deep learning models, built upon deep neural networks, can automatically learn and extract features from images without relying on manually designed features. This enables deep learning methods to better comprehend and represent complex features in remote sensing images, ultimately enhancing the accuracy and generalization capabilities of target detection.
2.2. Deep Learning Target Detection Methods
Deep learning theory and technology have experienced rapid development, revolutionizing the field of image processing. Unlike traditional methods, deep learning techniques eliminate the need for manually designed features and are not limited by specific scenes. As a result, deep learning-based target detection algorithms have surpassed conventional approaches in terms of performance. In the realm of deep learning-based target detection, there are two main categories: two-stage and single-stage algorithms. Two-stage algorithms undergo a sequential process of generating candidate regions, followed by the classification and localization of these regions. Although this approach achieves high detection accuracy, it tends to suffer from slower detection speeds. Noteworthy CNN (Convolutional Neural Network)-based algorithms within this category include R-CNN [
25], Fast R-CNN [
26], Faster R-CNN [
27], and Mask R-CNN [
28]. R-CNN stands as a pioneering work that introduced convolutional neural networks into target detection. It combines traditional image detection algorithms with deep learning technology. The algorithm starts by generating candidate boxes using the selective search algorithm. These candidates are then passed through a convolutional neural network for feature extraction. Finally, the targets are classified using support vector machines.
However, R-CNN is complex to operate, time-consuming, and requires significant computational resources. To address these limitations, GIRSHICK proposed Fast R-CNN. This algorithm integrates a region of interest pooling layer, adjusts the position of candidate regions to align with the feature map derived from the convolutional neural network, and achieves feature extraction across the entire image through feature sharing. These optimizations enable Fast R-CNN to achieve higher detection accuracy than R-CNN while alleviating the abovementioned problems. However, selecting candidate regions remains a time-consuming process in Fast R-CNN. To further improve Fast R-CNN, Faster R-CNN was introduced. It replaces the selective search algorithm with a candidate region network and introduces the concept of a priori frame. By generating multi-scale a priori frames that adapt to targets of different sizes, Faster R-CNN significantly improves the detection speed while maintaining accuracy. Mask R-CNN builds upon the foundation of Faster R-CNN and takes this approach further. It adds a branch that predicts segmentation masks for each region of interest, which enhances the detection accuracy even more. This branch is then merged with the existing branches responsible for classification and incorporating bounding box regression. Despite these optimizations, target detection algorithms that follow a two-stage approach still suffer from many parameters, leading to time-consuming detection processes.
Single-stage algorithms, such as SSD [
29], RetinaNet [
30], CenterNet [
31], EfficientDet [
32], and the YOLO family of algorithms, simplify the detection process and reduce computation by directly generating category probabilities and positional coordinates for objects. SSD employs a pyramid network structure for target detection. It uses strict coordinate and prediction boxes for non-maximum suppression to achieve accurate target detection and recognition. RetinaNet addresses the issue of class imbalance in dense object detection by introducing the Focal loss function. This loss function places greater emphasis on challenging examples by assigning them higher weights, improving the detection performance. CenterNet represents targets using center points and performs regression to estimate different attributes of the targets based on the specific task, resulting in accurate and effective detection. EfficientDet is based on a scalable neural model architecture and incorporates a novel two-way feature fusion network. This combination strikes a balance between the speed of detection and accuracy, resulting in highly efficient target detection. Algorithms belonging to the YOLO (You Only Look Once) family, like YOLOv7 [
33], introduce various strategies such as multi-branch stacking modules, innovative transition modules, and reparametrized structures. These enhancements improve feature extraction capabilities and semantic information expression, leading to optimized target detection performance. Overall, single-stage algorithms offer simplicity and computational efficiency advantages, making them suitable for real-time applications. Their contributions to the field of target detection have been substantial.
Over the past few years, deep learning-based image detection technology has held great potential in a variety of versatile visual scenarios, offering significant application value. Deep learning has witnessed important advancements in developing advanced detection algorithms for remote sensing image detection and recognition, significantly improving accuracy and efficiency. While these algorithms have demonstrated positive effects on model lightweighting and detection accuracy, there is still significant potential for improving target detection accuracy in real remote sensing scenarios.
2.3. Deep Learning Approaches in Remote Sensing Applications
Over the past few years, the detection application of remote sensing images has held immense value in the agricultural supply chain, accurately identifying various vehicle types and transportation directions. We can obtain large-scale ground transportation information by analyzing and processing remote sensing images, providing strong support for food logistics management and transportation planning. The development and progress of image detection technology have brought many innovations and challenges to food transportation. On the one hand, by utilizing the feature information in remote sensing images, we can effectively detect different types of vehicles, such as trucks, ships, planes, etc., thereby achieving accurate transportation frequency and position. On the other hand, remote sensing image object detection technology also provides a convenient and efficient means for food traffic monitoring and management, which can better grasp the logistics transportation situation and improve logistics efficiency and safety.
However, remote sensing image object detection still faces certain challenges and issues, including the low accuracy of object detection at various scales, the missed detection of dense small targets in complex backgrounds, and limitations of horizontal detection boxes. In response to the problem of low accuracy in object detection across different scales, Xu et al. [
34] improved the problem of insufficient information and small object detection by adding a Transformer structure to the two-level network. Similarly, Zhao et al. [
35] improved the detection ability of small targets by adding ECA attention to shallow convolutional layers. Although this algorithm effectively detects small targets, it still demonstrates inadequate detection results for object detection at various scales. It struggles to adapt to the diverse scale variations present in remote sensing image targets. Therefore, to boost object detection performance across different scales, Chen et al. [
36] combined the YOLOv7 algorithm with the gap space pyramid and attention to construct a feature fusion module, which improved the feature extraction capability for multi-scale objects.
In order to address the issue of poor detection performance for densely packed small targets, such as ships, in complex backgrounds of remote sensing images, Guo et al. [
37] designed an Enhanced Feature Pyramid Network (EFPN), which utilizes scale-sensitive relationships and adaptive balanced feature integration (ABFI) modules to improve the ability to recognize different sizes of ships. Zhu et al. [
38] used the repeated bilateral feature pyramid network (DB-FPN), which has shown promise in enhancing the recognition of dense targets in complex backgrounds, such as ships. Similarly, Liu et al. [
39] embedded the coordinate attention mechanism into the spatial pyramid structure to construct the optimized YOLOv7-Tiny model and optimized it by using the SIoU loss function. It made progress in model lightweighting and detection accuracy and could realize the accurate identification of transport vehicles such as ships.
Recently, more and more researchers have begun to study the problem of missing detection and inaccurate orientation in remote sensing images. For example, Baek et al. [
40] proposed a modeling method based on multi-modal remote sensing data fusion to monitor ship types and statuses, which contribute to the establishment of a novel maritime surveillance system. Different from other existing approaches focusing on the extraction of ship locations using either hull or wake information, Liu et al. [
41] proposed a detection method on the basis of a cascaded structure to locate the ship category using high-resolution satellite imagery. Through the phase spectrum of Fourier transform, ship classification was conducted using a fuzzy classifier combining both hull and wake information. The proposed approach achieved good performance for ship detection with a classification accuracy of up to 83.8%. Similarly, Reggiannini et al. [
42] proposed an improved version of the OSIRIS system, devoted to understanding maritime vessel traffic through the exploitation of optical and radar data captured by satellite imaging sensors. In the intelligent modeling process, the PRB-FPN method is designed to accurately identify various ship objects by integrating features at multiple scales, significantly improving the accuracy and stability of small-scale ship recognition.
In addition, some researchers are beginning to experiment with different approaches to modeling. Niu et al. [
43] employed hollow residual convolution technology to extract shallow features and integrated these with deep information, resulting in a significant enhancement in the accuracy of aircraft detection within remote sensing images. Liu et al. [
44] introduced a multi-stage cascaded algorithm based on the Swin Transformer for object detection in remote sensing imagery, which has advanced the precision of horizontal frame marking tasks. These methodologies enhance target detection accuracy by broadening the receptive field and merging shallow and deep features for multi-scale feature fusion, though this may come at the expense of real-time performance. However, in the domains of agricultural and food logistics, there remains a critical need for further research to adapt existing techniques and address the unique challenges associated with remote sensing image detection. Traditional horizontal bounding boxes for detection often overlook the directional information of various logistics vehicles. To mitigate this issue, the RRPN (Rotation Region Proposal Network) introduces a Rotation RoI Pooling (RRoI Pooling) layer, which refines the conventional horizontal bounding boxes into rotation-aware detection boxes. Despite the algorithm’s high accuracy, the use of an excessive number of anchor boxes can result in substantial computational overhead, adversely affecting the model’s processing speed.
There is significant potential for enhancing detection performance, particularly concerning multi-scale targets within complex background remote sensing images, with a special focus on small-scale targets. The primary challenge is effectively extracting semantic information from small targets while minimizing false positives and missed detections. Current object detection algorithms exhibit considerable potential for advancement in remote sensing image detection. Remote sensing images captured from aerial perspectives often display object contours from a top-down view, which markedly differs from typical object features. The elevated shooting angle causes targets to appear small and densely packed in the images, which can lead to substantial feature information loss during extraction and may complicate model detection.
Moreover, remote sensing images frequently feature multiple target types with varying aspect ratios, distinct orientations, and dense distributions. This results in rich background information within horizontal boundary areas, significant overlap and intersection among bounding boxes of different targets, and the presence of multiple object categories within a single bounding box. These factors considerably disrupt the model’s training process, leading to pronounced issues such as false positives, missed detections, and difficulties in accurately distinguishing between different targets. To address these challenges, our research explores the development of a rotating object detection algorithm, EMRY-Net, tailored for food logistics and transportation, which aims to optimize and enhance the resolution of these issues.
3. Materials and Methods
In this study, we propose an enhanced YOLO architecture detector called EYMR-Net to apply food transportation regulation. EYMR-Net is designed to detect multi-scale and rotated remote sensing objects. Firstly, we present the overall model framework of EYMR-Net and discuss the modifications we made to each module based on YOLOv7. Then, the details of the modifications made to each part of the overall network framework are elaborated on in
Section 3.2,
Section 3.3 and
Section 3.4.
3.1. Proposed Remote Sensing Detection Framework
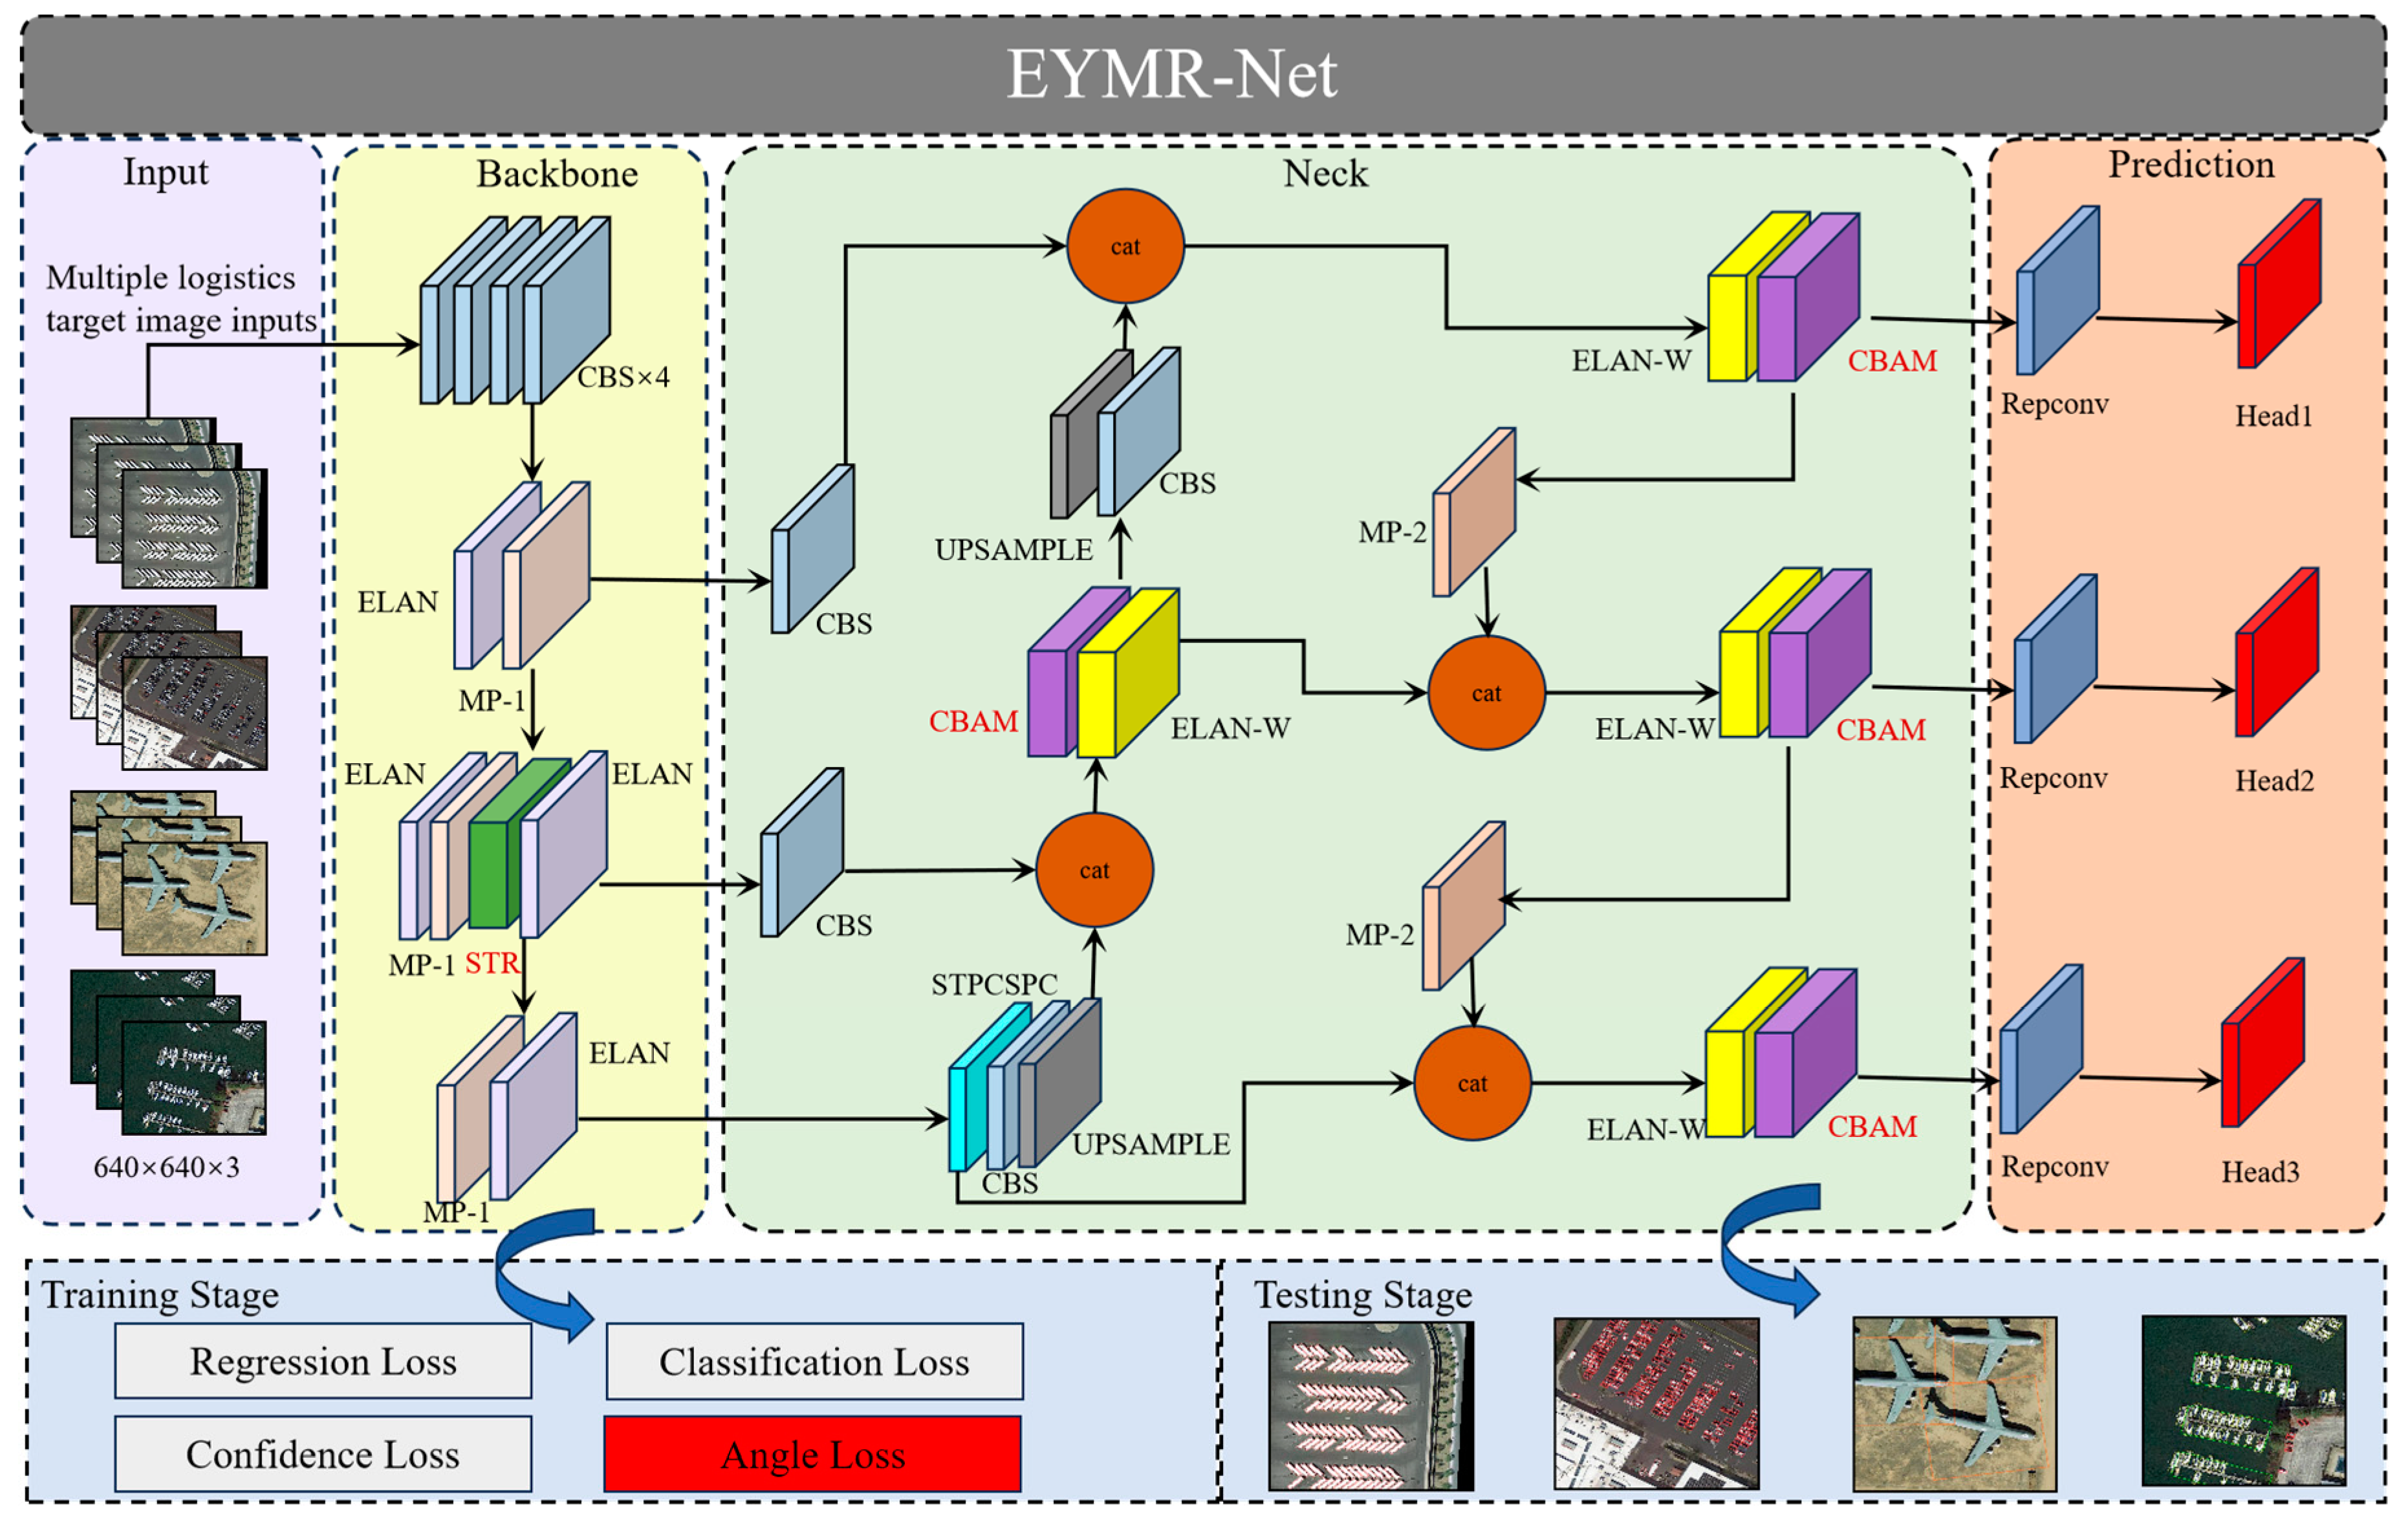
The EYMR-Net model in this paper mainly contains four parts, the input, backbone, neck, and prediction head, and its network structure is shown in
Figure 1. Firstly, the backbone network module consists of several layers, including the CBS layer, ELAN layer, MP-1 layer, and the Swin Transformer layer introduced in this paper. The CBS layer consists of a convolutional layer, a BN layer, and a LeakyReLU activation function for extracting image features at different scales. The ELAN layer in this paper is used to enhance the learning ability of the network by incorporating computational modules from different feature groups. This integration allows the layer to learn diverse feature information without compromising the original gradient path. The MP-1 layer uses a maximum pooling operation to expand the receptive field of the current feature layer, which is then fused with the feature information from normal convolutional processing to improve the feature extraction capability of the model. In this paper, we add the Swin Transformer [
44] module to the feature extraction backbone network, located behind the second and third ELAN modules, in order to enhance the network’s ability to collect fine-grained information about multi-scale targets and to obtain richer gradient fusion information, especially detailed information about small targets.
The neck module in this study adopts the structure of a Path Aggregation Feature Pyramid Network (PAFPN) [
45], which incorporates bottom-up paths to facilitate information flow from lower layers to higher layers, thus efficiently fusing features at different levels. To further enhance information fusion, we add the CBAM [
46] attention mechanism into the neck of YOLOv7. CBAM’s Channel Attention Module (CAM) strengthens channel-wise feature interactions, while the Spatial Attention Module (SAM) focuses on capturing target positions. By encoding feature map information along channel and spatial dimensions, CAM and SAM enable the output to be more focused on relevant details. In this paper, we replace the CBS module, originally present behind the four ELAN-W modules for feature analysis in the neck of YOLOv7, with the CBAM attention mechanism.
Furthermore, an angle classification prediction branch is added to the YOLOv7 prediction header. Hence, multi-task losses are calculated during training to optimize the angle loss, including classification loss, horizontal bounding box regression loss, confidence loss, and angle loss. In the testing phase, prediction boxes are generated by applying non-maximal suppression (NMS) after rotating them according to the predicted angles.
3.2. Swin Transformer Backbone for Feature Extraction
A Transformer network is a purely attentional mechanism network that has succeeded significantly in natural language processing tasks. The Transformer network consists of two parts: an encoder and a decoder. The Vision Transformer mainly utilizes the Transformer encoder for feature extraction. In image processing tasks, the image is first sliced into small chunks and then fed into the Transformer encoder, which is capable of outputting correlation information between image chunks. The multi-attention mechanism is the Transformer encoder’s core, which utilizes multiple self-attention computations to obtain the correlation information between different sequences. The Swin Transformer, in contrast to the Vision Transformer, considers the computational resources of the network and has shown remarkable performance in various computer vision tasks such as detection, segmentation, and classification. It adopts a layered structure similar to a CNN, dividing the network into four stages. Each stage contains a higher number of feature maps with a reduced size, allowing for the extraction of global features through self-attention and multi-headed attention mechanisms while preserving important features at each scale.
As shown in
Figure 2, a single STR block is concretely presented. Firstly, the W-MSA (Windows Multi-head Self-attention) module is introduced to restrict the self-attention computation inside a local window, and this local window restriction reduces the computation of the whole network with respect to the global attention computation. The W-MSA module performs the self-attention computation inside each window by dividing the window on the image, which allows the windowed positions to interact with each other for information and to capture local correlations. This localized intra-window attention computation preserves the details inside the window and provides a feature representation with local contextual information.
However, local window attention computation alone cannot capture the global information of the entire image. To compensate for this shortcoming, the Swin Transformer introduces the SW-MSA module. The SW-MSA module interacts with information between non-overlapping windows through window shift operations. It facilitates attention computation between different windows by cyclically shifting the original feature map so that the windows can be moved to different locations. This attention computation mechanism within moving windows allows for global information exchange between windows, capturing global correlations and dependencies across the image.
For example, the shift windows of the Swin Transformer in layer i + 1 comes from the same area of four windows in layer i. That means each window in layer i + 1 is equivalent to the information of four windows in layer i. This overcomes the problem that information cannot be exchanged between different windows. By using both i-th and i + 1th layers in conjunction, it reduces the number of parameters as required in the traditional self-attention mechanism. Also, it alleviates the problem of the reduced receptive field of the normal window self-attention mechanism. By using the i-th and i + 1th layers in conjunction, not only can the problem of an excessive number of parameters in the traditional self-attention mechanism be solved, but it also solves the problem of the receptive field of the normal window self-attention mechanism being reduced.
In remote sensing image target detection, due to the high image resolution and large differences in the target size and type, it is often difficult for the traditional backbone network to consider the detection effect of targets at different scales. In order to improve the performance of the model in the multi-scale feature extraction of remote sensing images, this study introduces the Swin Transformer structure. It integrates it into the feature extraction backbone network, which effectively enhances the model’s ability to perceive remote images, allowing it to capture the dependencies between different regions of the input image through its unique window segmentation strategy, thereby improving the whole accuracy and robustness to multi-scale targets.
3.3. Convolutional Block Attention Module
The attention mechanism fundamentally imitates humans’ visual processing of images by assigning weights to different positions on the feature map to represent varying levels of attention. Remote sensing images often contain complex backgrounds, and after feature extraction through convolutional layers, there is less information about the small targets to be detected, while more information exists about the background and undetectable objects within it. These non-interest regions can interfere with the detection of small targets, leading to missed detections or false positives.
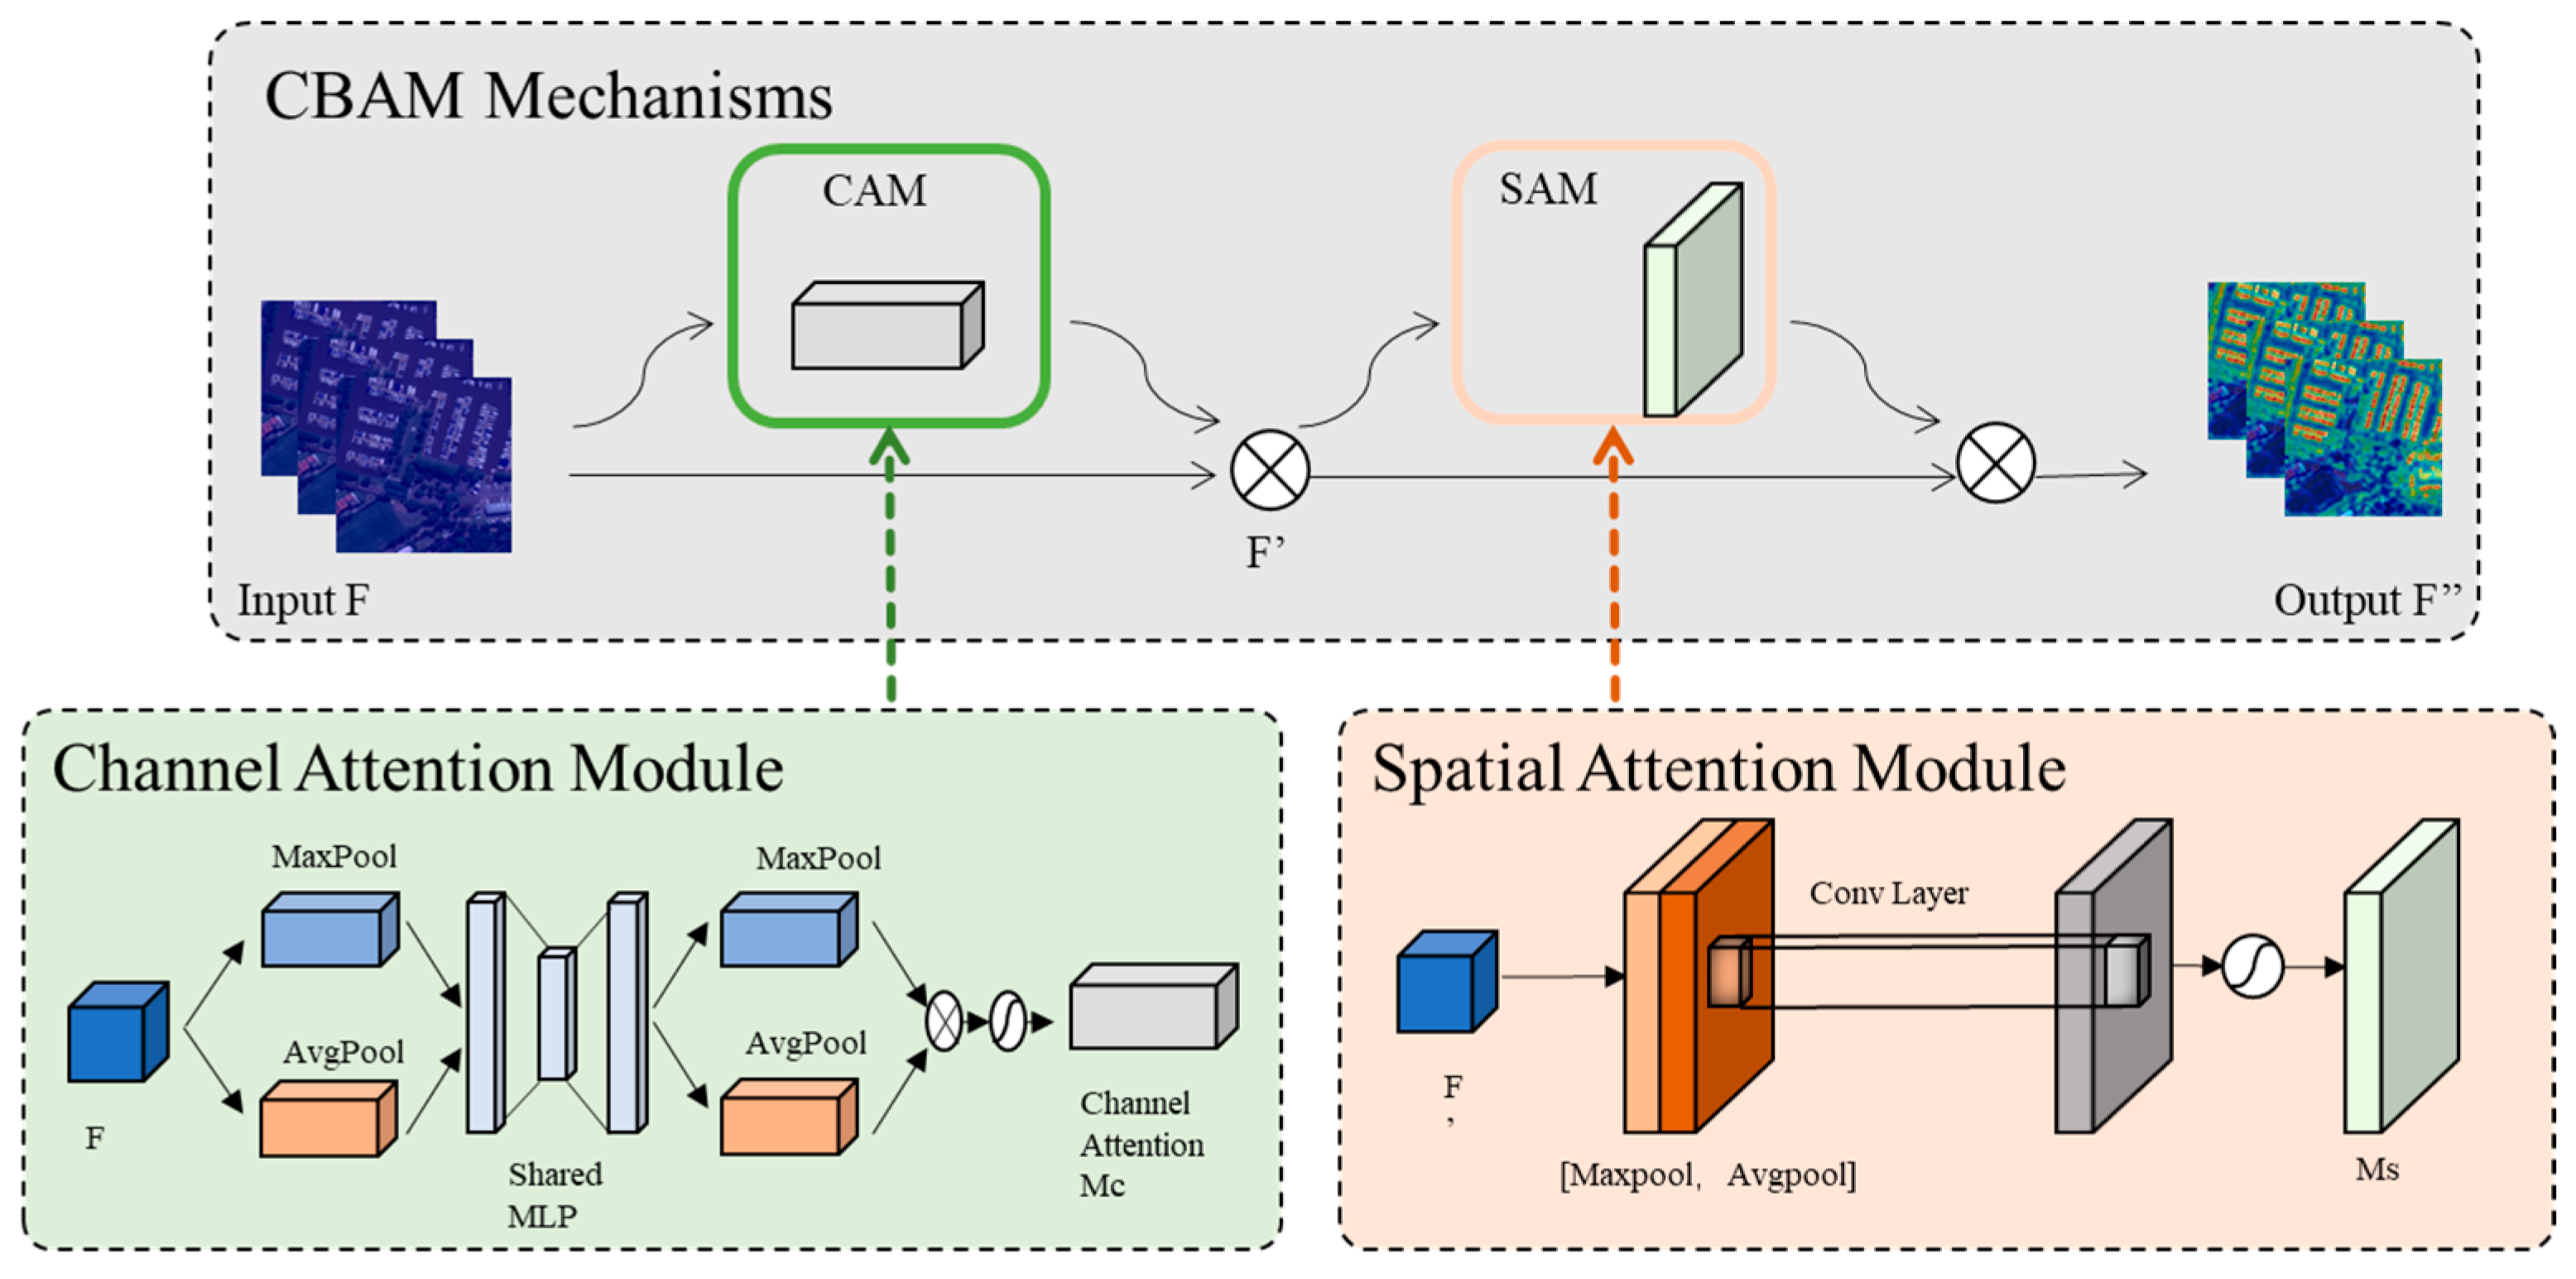
In this study, we introduce the CBAM, which addresses the challenges of false positives and missed detections for small targets in remote sensing images. The CBAM combines global average pooling (GAP) and global maximum pooling (GMP) strategies to prevent information loss. To preserve more relevant target information, we incorporate the CBAM attention mechanism into our proposed model.
The feature map dimensions contain different types of information; the channel dimension expresses abstract features, while the spatial dimension emphasizes object position information. The CBAM architecture comprises two primary components: the Channel Attention Module (CAM) and the Spatial Attention Module (SAM). These modules are combined sequentially to generate attention feature maps in both the channel and spatial dimensions. The architecture of the Channel Attention Module is depicted in
Figure 3.
As illustrated, we can outline the CBAM procedure as follows: First, the input feature map
F is subjected to adaptive feature refinement by leveraging the Channel Attention Module. This results in a modified feature map
. Then, the Spatial Attention Module corrects the feature map
F. This ultimately yields the refined feature map
after CBAM processing. The computational procedure can be mathematically represented using the following equation, where the symbol “⨂” denotes an element-wise product, the initial feature map is
, the channel-wise attention map is
, and the spatial-wise attention map is
:
In order to compute the channel attention features effectively, a fusion of GAP and Global Maximum Pooling is utilized to reduce the spatial dimensions of the feature map. This reduction leads to the generation of two C × 1 × 1 feature maps. These feature maps are passed through a common Multilayer Perceptron (MLP) for subsequent processing.
In this proposal, a two-layer artificial neural network is introduced. The first layer’s primary aim is to reduce dimensionality on the feature maps. The layer’s size, in terms of the number of neurons, is determined as
, where
represents the dimensionality reduction factor. Subsequently, the fusion of the two-channel attention vectors derived from the MLP takes place, followed by applying the Sigmoid activation function to obtain the final channel attention vector, denoted as
. Here,
and
, respectively, represent the features obtained after applying average and max pooling operations.
To complement the Channel Attention Module, the Spatial Attention Module operates on the input feature map
, which is obtained by the element-wise multiplication of the channel attention vector
and the input feature map
. In the Spatial Attention Module,
undergoes GAP and GMP operations along the channel dimension, resulting in two 1 × H × W feature maps. These maps are concatenated to generate a 2 × H × W feature map. Then, a 7 × 7 convolutional operation is applied to enlarge the receptive field while reducing the dimensionality to 1 × H × W. Lastly, the Sigmoid activation function obtains the spatial attention vector
. This methodology reduces repetition and enhances the overall understanding of the passage.
To enhance the detection performance of small objects while disregarding irrelevant background information in images, the CAM and SAM from CBAM were integrated into the Neck structure of YOLOv7 in this paper. The CAM enables the network to focus on important features by emphasizing relevant channels through channel-wise attention. On the other hand, the SAM enhances the network’s ability to capture spatial details by considering the relationships between different spatial locations using spatial attention. By integrating these attention mechanisms into the YOLOv7 framework, the network achieves improved detection performance for small objects.
3.4. Rotated Rectangular Box Optimization
- (1)
Rotated circular smoothing labels
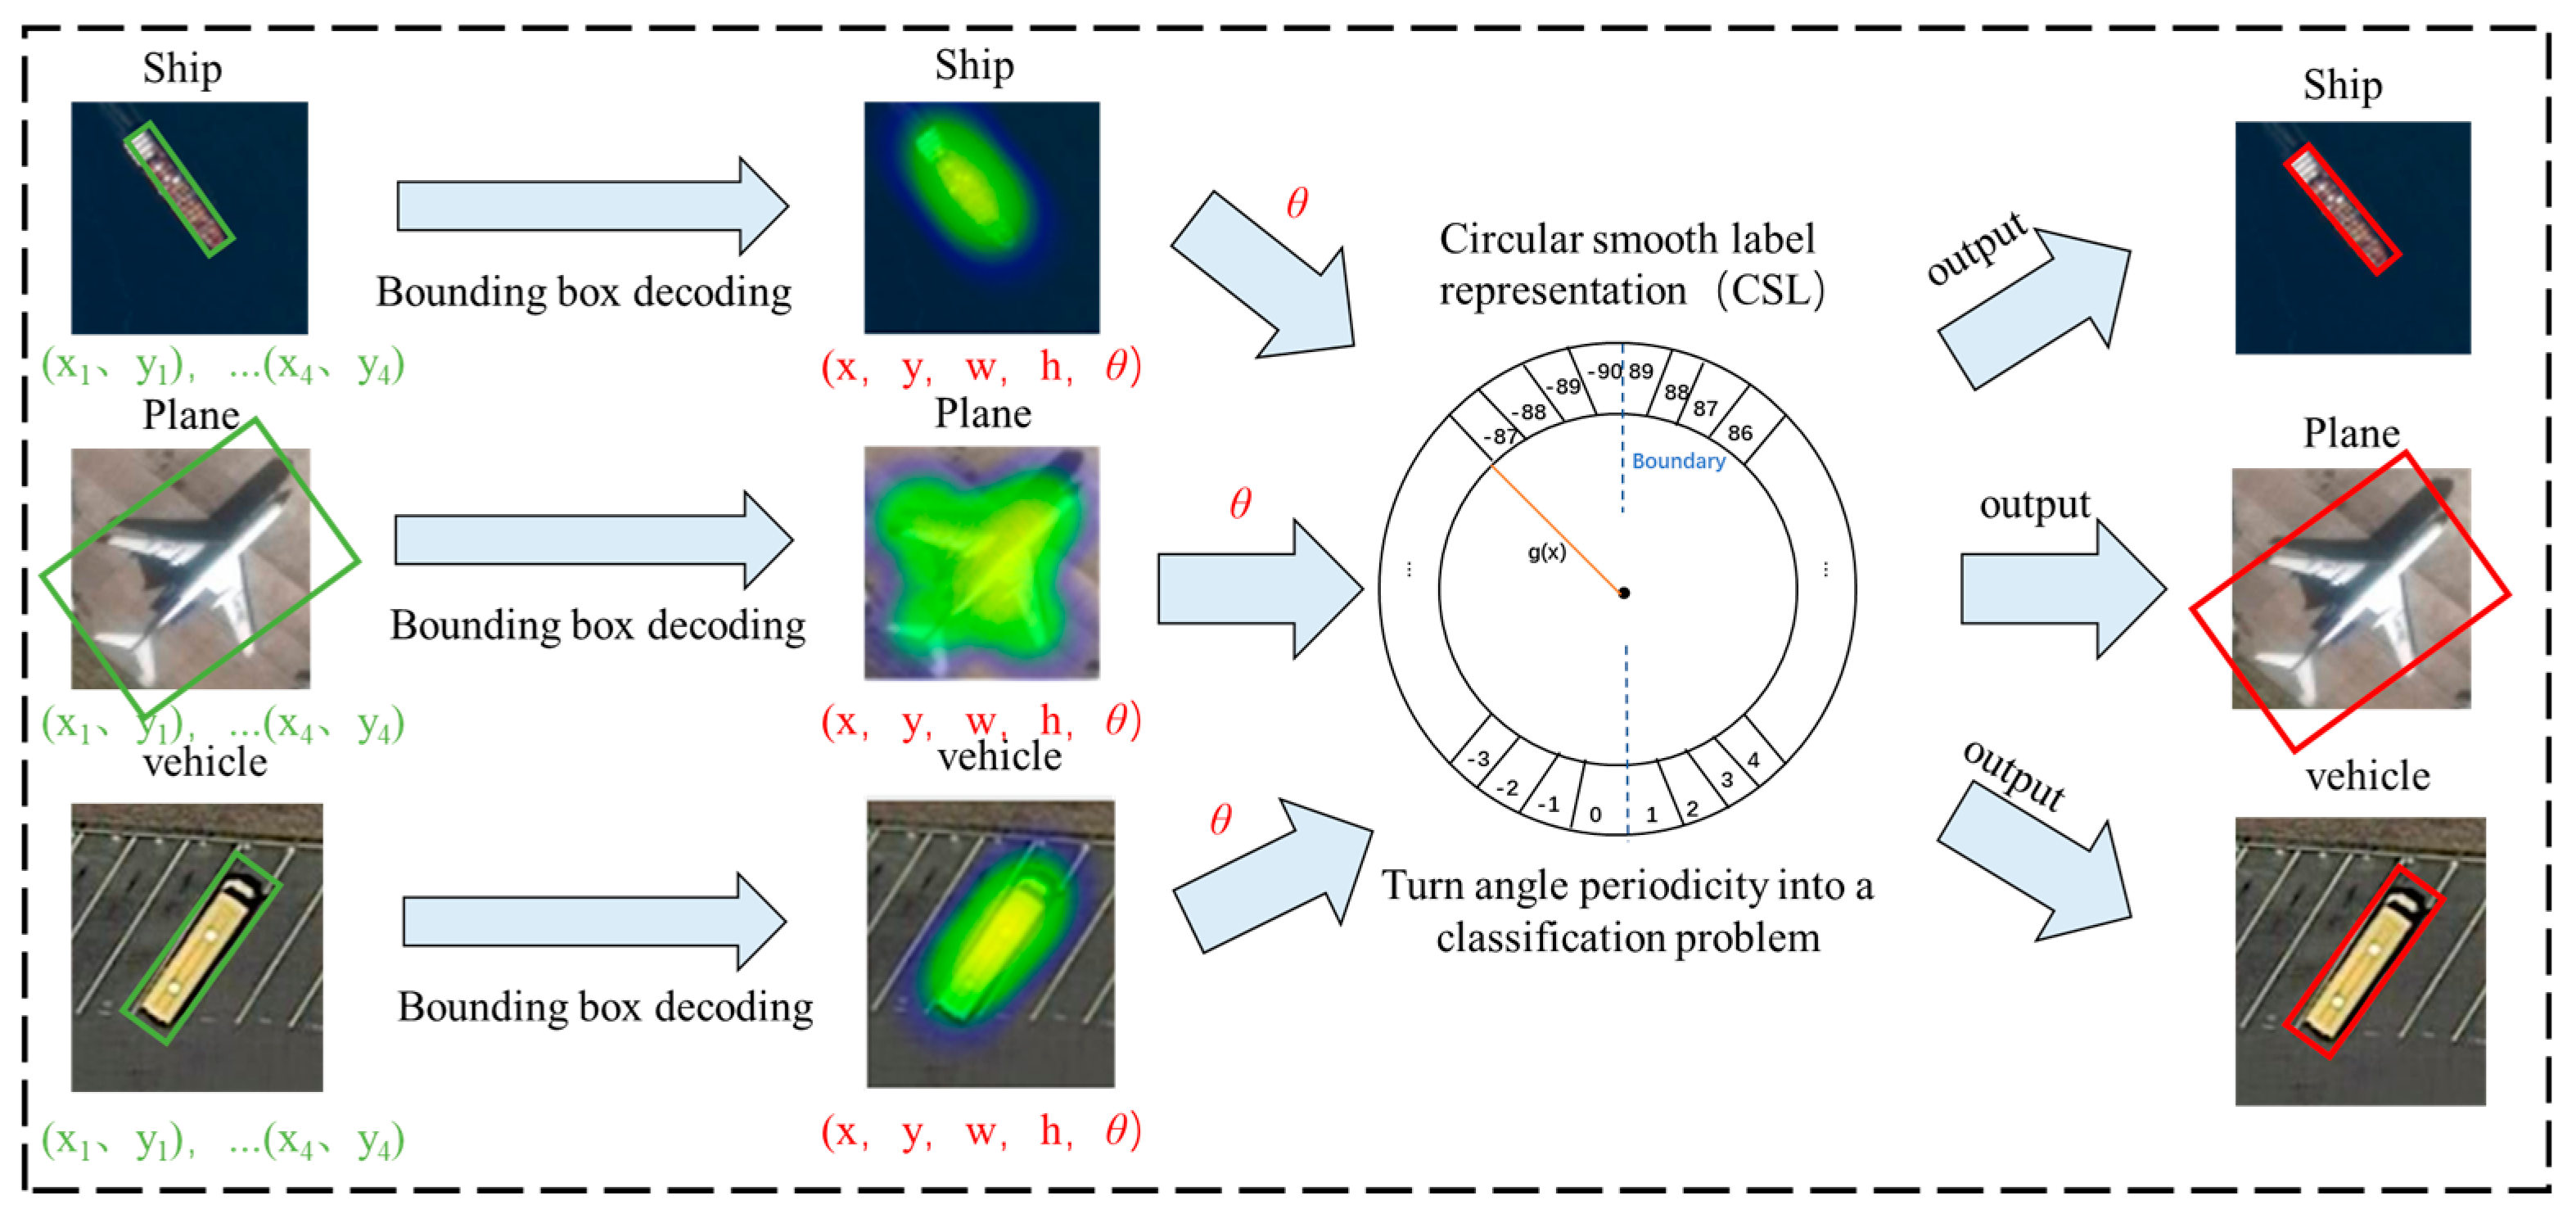
To account for the diverse orientations of objects in remote sensing images, the eight-parameter method is adopted to represent rotated bounding boxes (as RBO). This method represents a rotated rectangle with its four vertices, (x
1, y
1), (x
2, y
2), (x
3, y
3), and (x
4, y
4), in counterclockwise order, starting from the top-left corner. The input format for this model is in the form of eight-parameter annotations. These eight-parameter annotations are fed into the network, and the decoding process is performed to extract the rotation angle. The decoding process can be described as follows:
The decoding process transforms the bounding box annotation format to a representation based on the angle denoted by
. However, this introduces issues such as angle periodicity and boundary discontinuity. The angle regression approach is converted to a classification form to address angle periodicity, avoiding angles beyond their valid range. However, converting the regression problem to a classification problem results in a significant loss of accuracy. To measure the distance between angle labels, we introduce circular smooth labels (CSLs) in this study. CSLs mitigate the issue of boundary discontinuity by defining a window function g(x) to measure the angular distance between predicted and confidence labels. The prediction loss is smaller when the detection value is closer to the ground truth within a specific range. Compared to previous methods, CSLs exhibit higher tolerance to adjacent angles, alleviating the problem of unbalanced angles. The expression for CSLs is given as follows:
To increase the detection of rotated rectangular bounding boxes, we introduce the concept of circular smooth labels in this study. The original label is denoted by x, while the window function with a radius, r, is represented by g(x). The diameter extent of the window function determines the angle of the current bounding box. Using the window function, our model can calculate the angular distance between the predicted and ground truth labels. This approach enhances the original YOLOv7 model, allowing it to detect rotated rectangular bounding boxes more accurately. Consequently, as the predicted and true values become closer to a true range, the loss value decreases. We also address the issue of angular periodicity by incorporating periodicity, whereby angles like 89 degrees and −90 degrees are considered neighbors. The regression process for rotating bounding boxes with circular smooth labels is illustrated in
Figure 4. Through these improvements, we aim to achieve more accurate detection of rotated bounding boxes.
- (2)
Loss function design
For the new algorithm (EYMR-Net) proposed in this paper, since it supports the learning of rotating bounding boxes, we add the designed angle classification
to the original loss function, and the total loss function formula is as follows:
In this context,
denotes confidence loss,
indicates horizontal bounding box coordinate localization loss,
refers to target category loss, and
represents angle classification loss. For confidence loss, target category loss, and horizontal bounding box coordinate localization loss, no improvement is needed by using the same loss function as YOLOv7 because the
variable is not involved. The newly added angular categorization loss function formula is shown below:
To address the angle regression problem, we transform it into a classification problem using CSLs. We represent the angle classification loss function using binary cross-entropy. In this approach, we use the function CSL(x) to convert the original angle theta into CSLs, incorporating periodicity and symmetry. The input range for x is within [−90, 90), representing the angle values.
We can enhance angle classification by using CSL, considering their periodic characteristics. During training, the binary cross-entropy loss function is employed to optimize the angle classification task. This approach results in improved algorithm performance and more precise angle prediction.
4. Results and Discussion
4.1. Experimental Datasets and Settings
To evaluate the efficacy of our proposed image object detection algorithm, we utilized the DOTAv1.0 dataset of aerial remote sensing images, which was provided by Wuhan University. This dataset includes 15 categories, namely small vehicle (SV), baseball diamond (BD), plane (PL), basketball court (BC), ground track field (GTF), harbor (HA), swimming pool (SP), bridge (BR), roundabout (RA), large vehicle (LV), tennis court (TC), helicopter (HC), ship (SH), soccer ball field (SBF), and storage tank (ST), and contains a total of 188,282 objects.
The DOTA dataset is characterized by a significant number of small targets, with approximately 80,000 and 110,000 instances of small vehicles and ships, respectively. In general, the objects in this dataset are relatively small in size, accounting for less than 5% of the image area. The images in the DOTA dataset are high-resolution aerial photographs, with pixel dimensions ranging from 800 × 800 to 4000 × 4000. However, due to the large sizes of most images in the dataset, direct training with the model after uniform scaling would pose challenges in detecting numerous small objects. Therefore, we perform preprocessing on the training images.
To preprocess the images, we first crop the original images to a uniform size of 1024 × 1024. We ensure that a certain overlap is maintained between the cropped images to avoid losing object information at cut boundaries. After cropping, the resulting dataset comprises 21,046 images. We then divide the dataset into training, validation, and testing sets using a 3:1:1 ratio. We visualize the quantities of different target categories in the dataset by creating a bar graph, as shown in
Figure 5. In the graph, the labels are plotted on a graph, with the names of the labels displayed on the horizontal axis and the number of labels on the vertical axis. The unit is (number).
4.2. Evaluation Indicators
To validate the effectiveness of our model, we employed various evaluation metrics, including Precision, Recall, Average Precision (AP), and mean Average Precision (mAP). Precision is a measure of the proportion of predicted true positive samples over the entire sample of positive cases with positive predictions. It is calculated as follows:
The precision rate is calculated using the number of true cases, false positive cases, and false negative cases. It reflects the proportion of true cases among the predicted positive samples. On the other hand, the recall rate reflects the proportion of positive samples correctly predicted by the model to the total positive samples. Recall is another evaluation metric that we use to assess the performance of our model. It measures the proportion of predicted true positive samples over the entire sample of true cases with positive results. The P-R curve is a plot of the precision rate against the recall rate. For a particular category, the recall rate is set as the horizontal coordinate and the precision rate as the vertical coordinate. The area under this curve is the AP value of the category as follows:
The mean Average Precision (mAP) is a comprehensive evaluation metric for target detection algorithms on a particular dataset. It is calculated as the average of the AP values of all categories and is currently the most important metric for evaluating the performance of the model. The mAP is denoted as follows:
4.3. Comparative Experimental Results
To further validate the effectiveness of the enhanced EYMR-Net algorithm, we choose five classical target detection algorithms and this paper’s algorithm for comparison. As shown in
Table 1, a comparison of the experimental results of the proposed EYMR-Net with other state-of-the-art object detection models is presented with the DOTA dataset.
In the remote sensing image detection task, the evaluation metrics of AP 0.5(%) and mAP 0.5(%) are chosen to evaluate the recognition performance on the remote sensing targets of each model. It shows that the EYMR-Net obtains a higher mAP0.5, which proves that the optimization approaches are effective. In detail, the proposed EYMR-Net achieves an mAP0.5 of 74.30%, outperforming CenterNet, YOLOv5, RetinaNet, Faster R-CNN, and CornerNet. Among them, our model achieves the best accuracy of AP0.5 for ships (SHs), small vehicles (SVs), and large vehicles (LVs), which are small-scale dense targets with an optimal accuracy of AP0.5, reaching 89.9%, 69.0%, and 87.8%, respectively. This demonstrates that our detector, EYMR-Net, greatly improves the detection of small targets compared to classical target detectors in the complex context of remotely sensed images. It also achieves quite excellent detection metrics in several categories, such as airplanes (PLs) and harbors (HAs). In order to further illustrate the advantages, we draw the detection performance results of the proposed methods including CornerNet, YOLOv5, RetinaNet, Faster R-CNN, and CenterNet, as shown in
Figure 6.
At the same time, we conduct tests on different detectors: for group 1, we choose remote sensing images of large vehicles (LVs) and small vehicles (SVs) in a parking lot in a small-scale dense and oriented row; for group 2, we choose remote sensing images of a ship (SH), small vehicles (SVs), and a harbor (HA) in a complex background simultaneously; for group 3, we choose remote sensing images of small and large vehicles at the same time; for group 4, we select remote sensing images of helicopters (HCs) and passenger planes (PLs) in an airport scene; and for group 5, we select remote sensing images of harbors (HAs), ships (SHs), and vehicles on shore in a complex scene. The test samples are shown in
Figure 7. Faster R-CNN, SSD, RetinaNet, and YOLOv5 all have different degrees of small target leakage detection problems, such as large vehicles and small vehicles appearing at the same time in group 1 of images, and small vehicles (SVs) in the upper left corner of the image, and only our detector EYMR-Net detected five of them. The red circles in the figure represent the leakage detection areas of different models in small object detection.
By comparison, our rotating detection box greatly optimizes the problem of excessive redundant background pixels in the frame brought by the horizontal box of traditional target detectors, and it achieves the fine localization of slender targets. For group 2, regarding the small vehicles present in the upper-left corner, our detector EYMR-Net detects 11 vehicles, while the rest of the detectors still have a large number of leakage detection problems, and our detector improves the recognition ability of ports. Due to the complexity of the remote sensing marine scene, there are multiple ships sticking together in the port and ground, causing confusion; these problems make it relatively difficult for detectors, such as RetinaNet, to detect the port. Although the recognition ability of the ship is still good, it does not detect the port near the ship. For group 3 of remote sensing images after comparison, our EYMR-Net model has the lowest false detection rate for small targets, and the rest of the models have serious leakage detection problems. For group 4 of remote sensing pictures of airport scenes, SSD undergoes leakage detection for helicopters, while our detector, EYMR-Net, has no false detection, and relative to the other four detectors, our EYMR-Net generates the smallest IOU between the detected boxes and has the highest localization accuracy. Sample 5 in the group of remote sensing images also demonstrates the superiority of our detector in recognizing ports. A large number of examples of pictures from multiple categories in remote sensing scenarios show that our proposed EYMR-Net detector has superior detection performance.
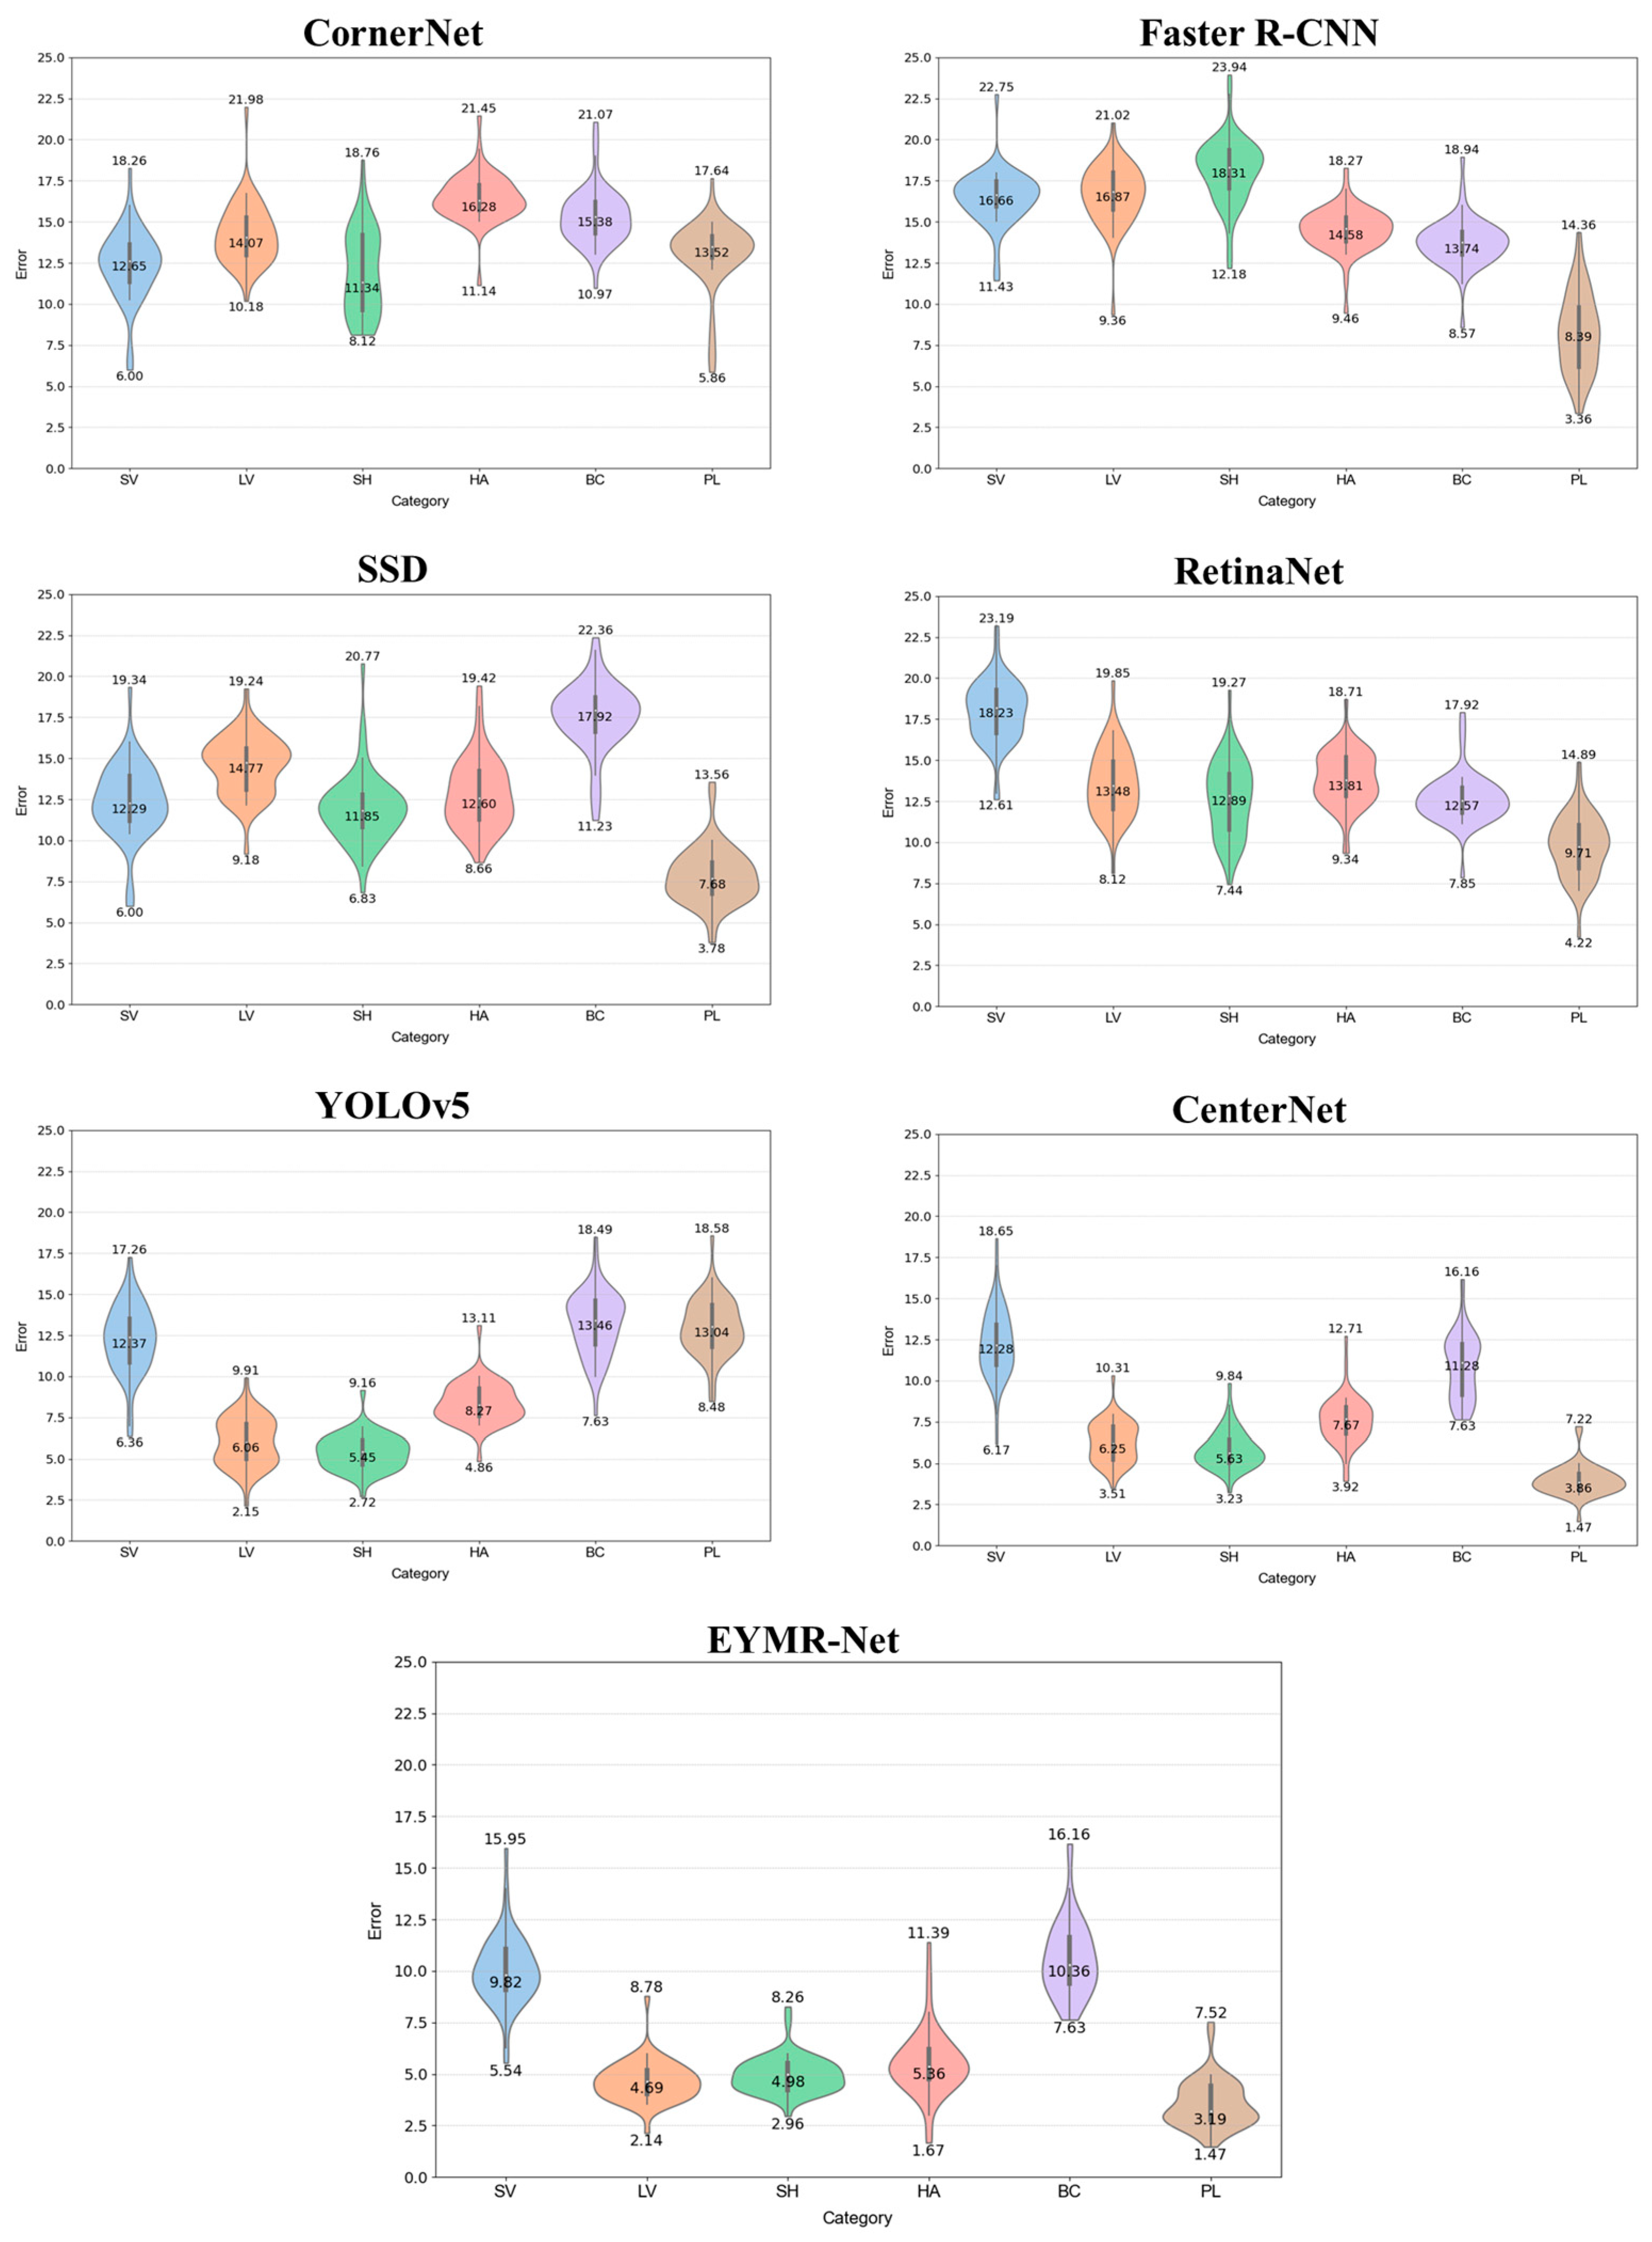
The detection effects of each model for different object types are shown in
Figure 8. We select six target types in violin plots, including small vehicles (SVs), large vehicles (LVs), ships (SHs), harbors (HAs), basketball courts (BCs), and airplanes (PLs). As shown in
Figure 8, we plotted the errors for the last 50 rounds of the training fit for six different image detectors. It can be concluded that taken together, our EYMR-Net exhibits the best performance with a relatively low error in all categories. For small-scale targets, such as vehicles and ships, the violin plots of the EYMR-Net model show a more concentrated distribution and a smaller error range. This indicates that our model can detect and localize targets more accurately in these categories with higher robustness and stability. It also shows less than five rubbing sweats on medium- and large-scale targets, including harbors (HAs) and basketball courts (BCs). This proves that our detector has a lower error rate and better performance on targets of different scales.
4.4. Ablation Experiment Results
We performed several ablation tests to comprehensively evaluate the enhanced EYMR-Net algorithm’s performance. During the training phase, we used the YOLOv7 model as the baseline. Throughout the process, each model was trained for 300 epochs using a batch size of 16. We introduced Swin Transformer (STR) modules and the CBAM attention mechanism to enhance the model’s performance. Furthermore, we improved the bounding box regression mechanism of YOLOv7 to handle rotated boxes based on circular smooth labels. To assess the combined effects of the EYMR-Net variants, we conducted corresponding ablation experiments, and the results are shown in
Table 2. It can be seen that the three proposed modules all play a role in detection accuracy and efficiency. The organic combination of STR, CBAM, and RBO makes the proposed EYMR-Net achieve better robustness to cope with remote sensing detection and identification tasks under multi-scale changes.
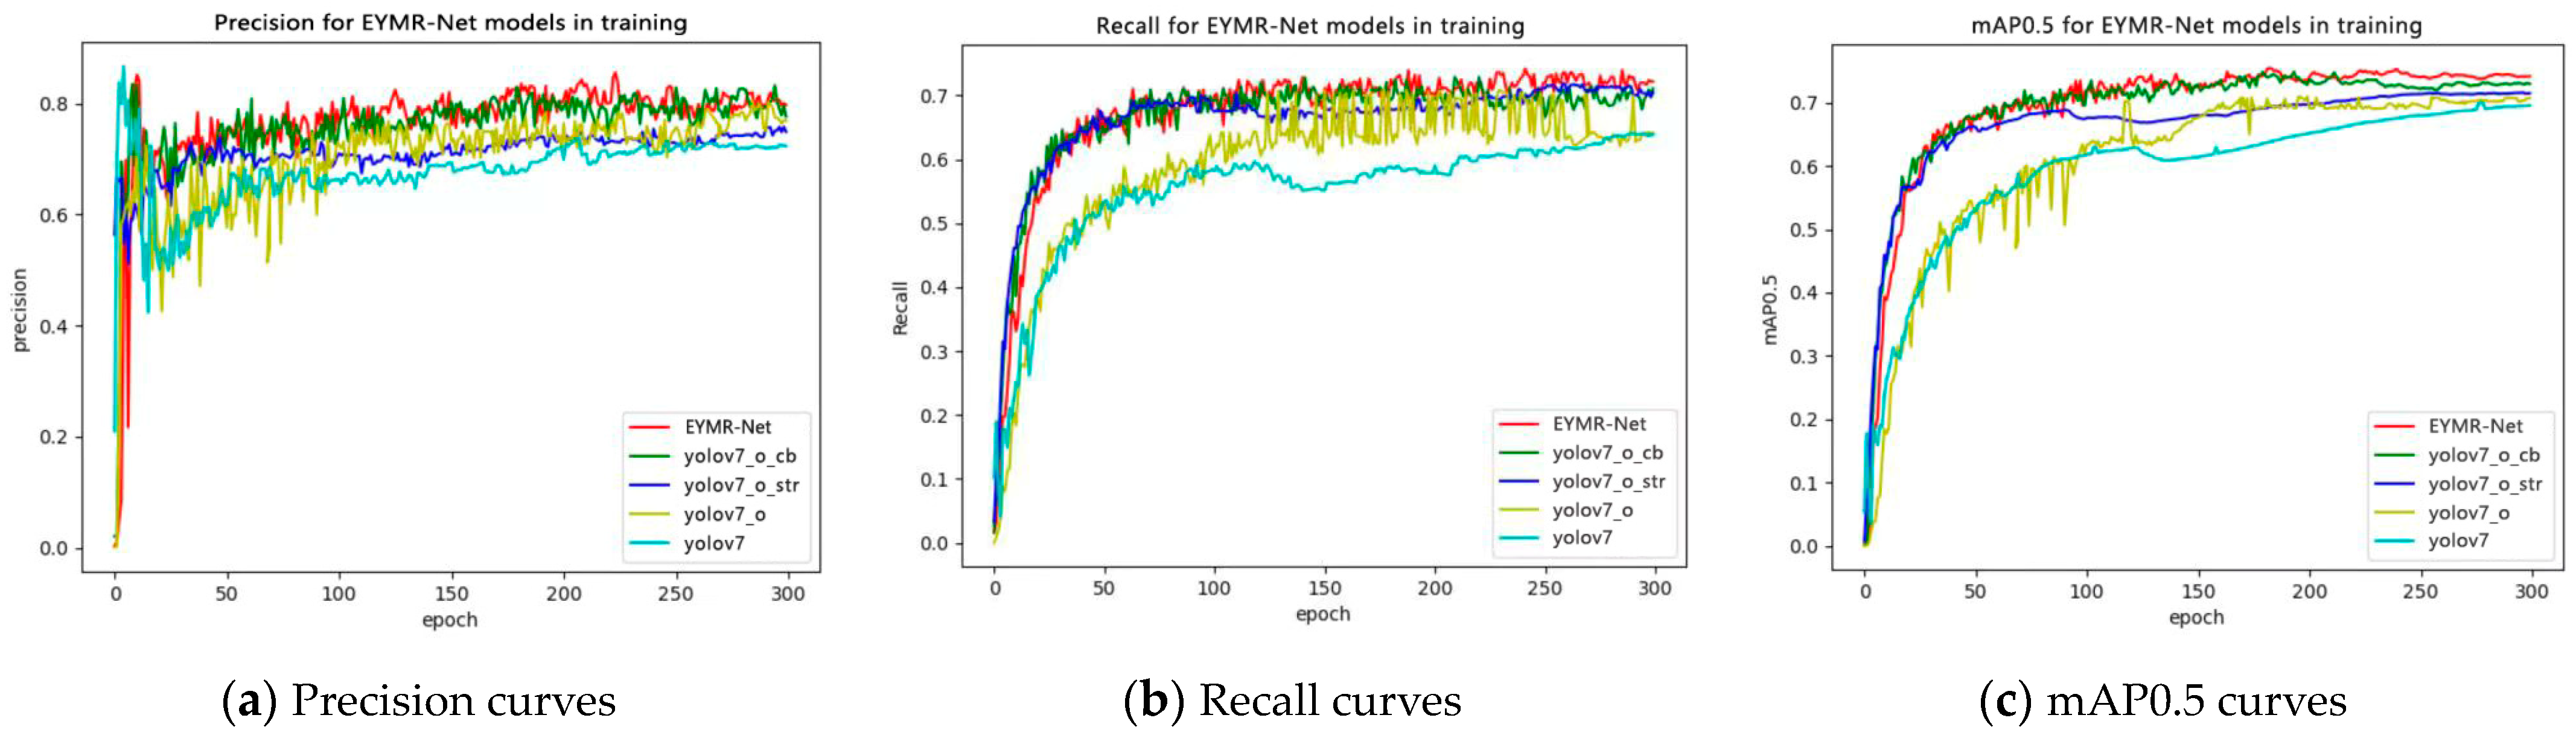
Considering that our method is optimized on the advanced YOLOv7, we drew precision, recall, and mAP0.5 curves to visually compare the changes in EYMR-Net compared to the YOLOv7 series. As shown in
Figure 9, the specific values of each item in the last round of the source code of YOLOv7 are 74.32%, 63.87%, and 70.72%, while the values indicating the performance of our EYMR-Net are 79.76%, 72.18%, and 74.30%. The comparison reveals that the EYMR-Net can reach the steady-state value faster during the entire learning process, with better convergence and accuracy, outperforming YOLOv7 series approaches.
To test the detection ability of EYMR-Net in real remote sensing scenes, five representative image samples are selected for visualization and comparison in this experiment: group 1 includes a dense and oriented large vehicle (LV) in a parking lot, group 2 comprises airplanes (PLs) and helicopters (HCs) in an airport scene, group 3 includes a small vehicle (SV) with small targets in a parking lot scene, group 4 comprises a coastal scene with multiple similar features of multiple ships (SHs) and harbors (HBs), and group 5 represents multiple categories simultaneously appearing in the remote sensing complex scene of tennis courts (TCs), basketball courts (BCs), and small vehicles (SVs). The confidence threshold is set to 0.25, and the detection results are shown in
Figure 10.
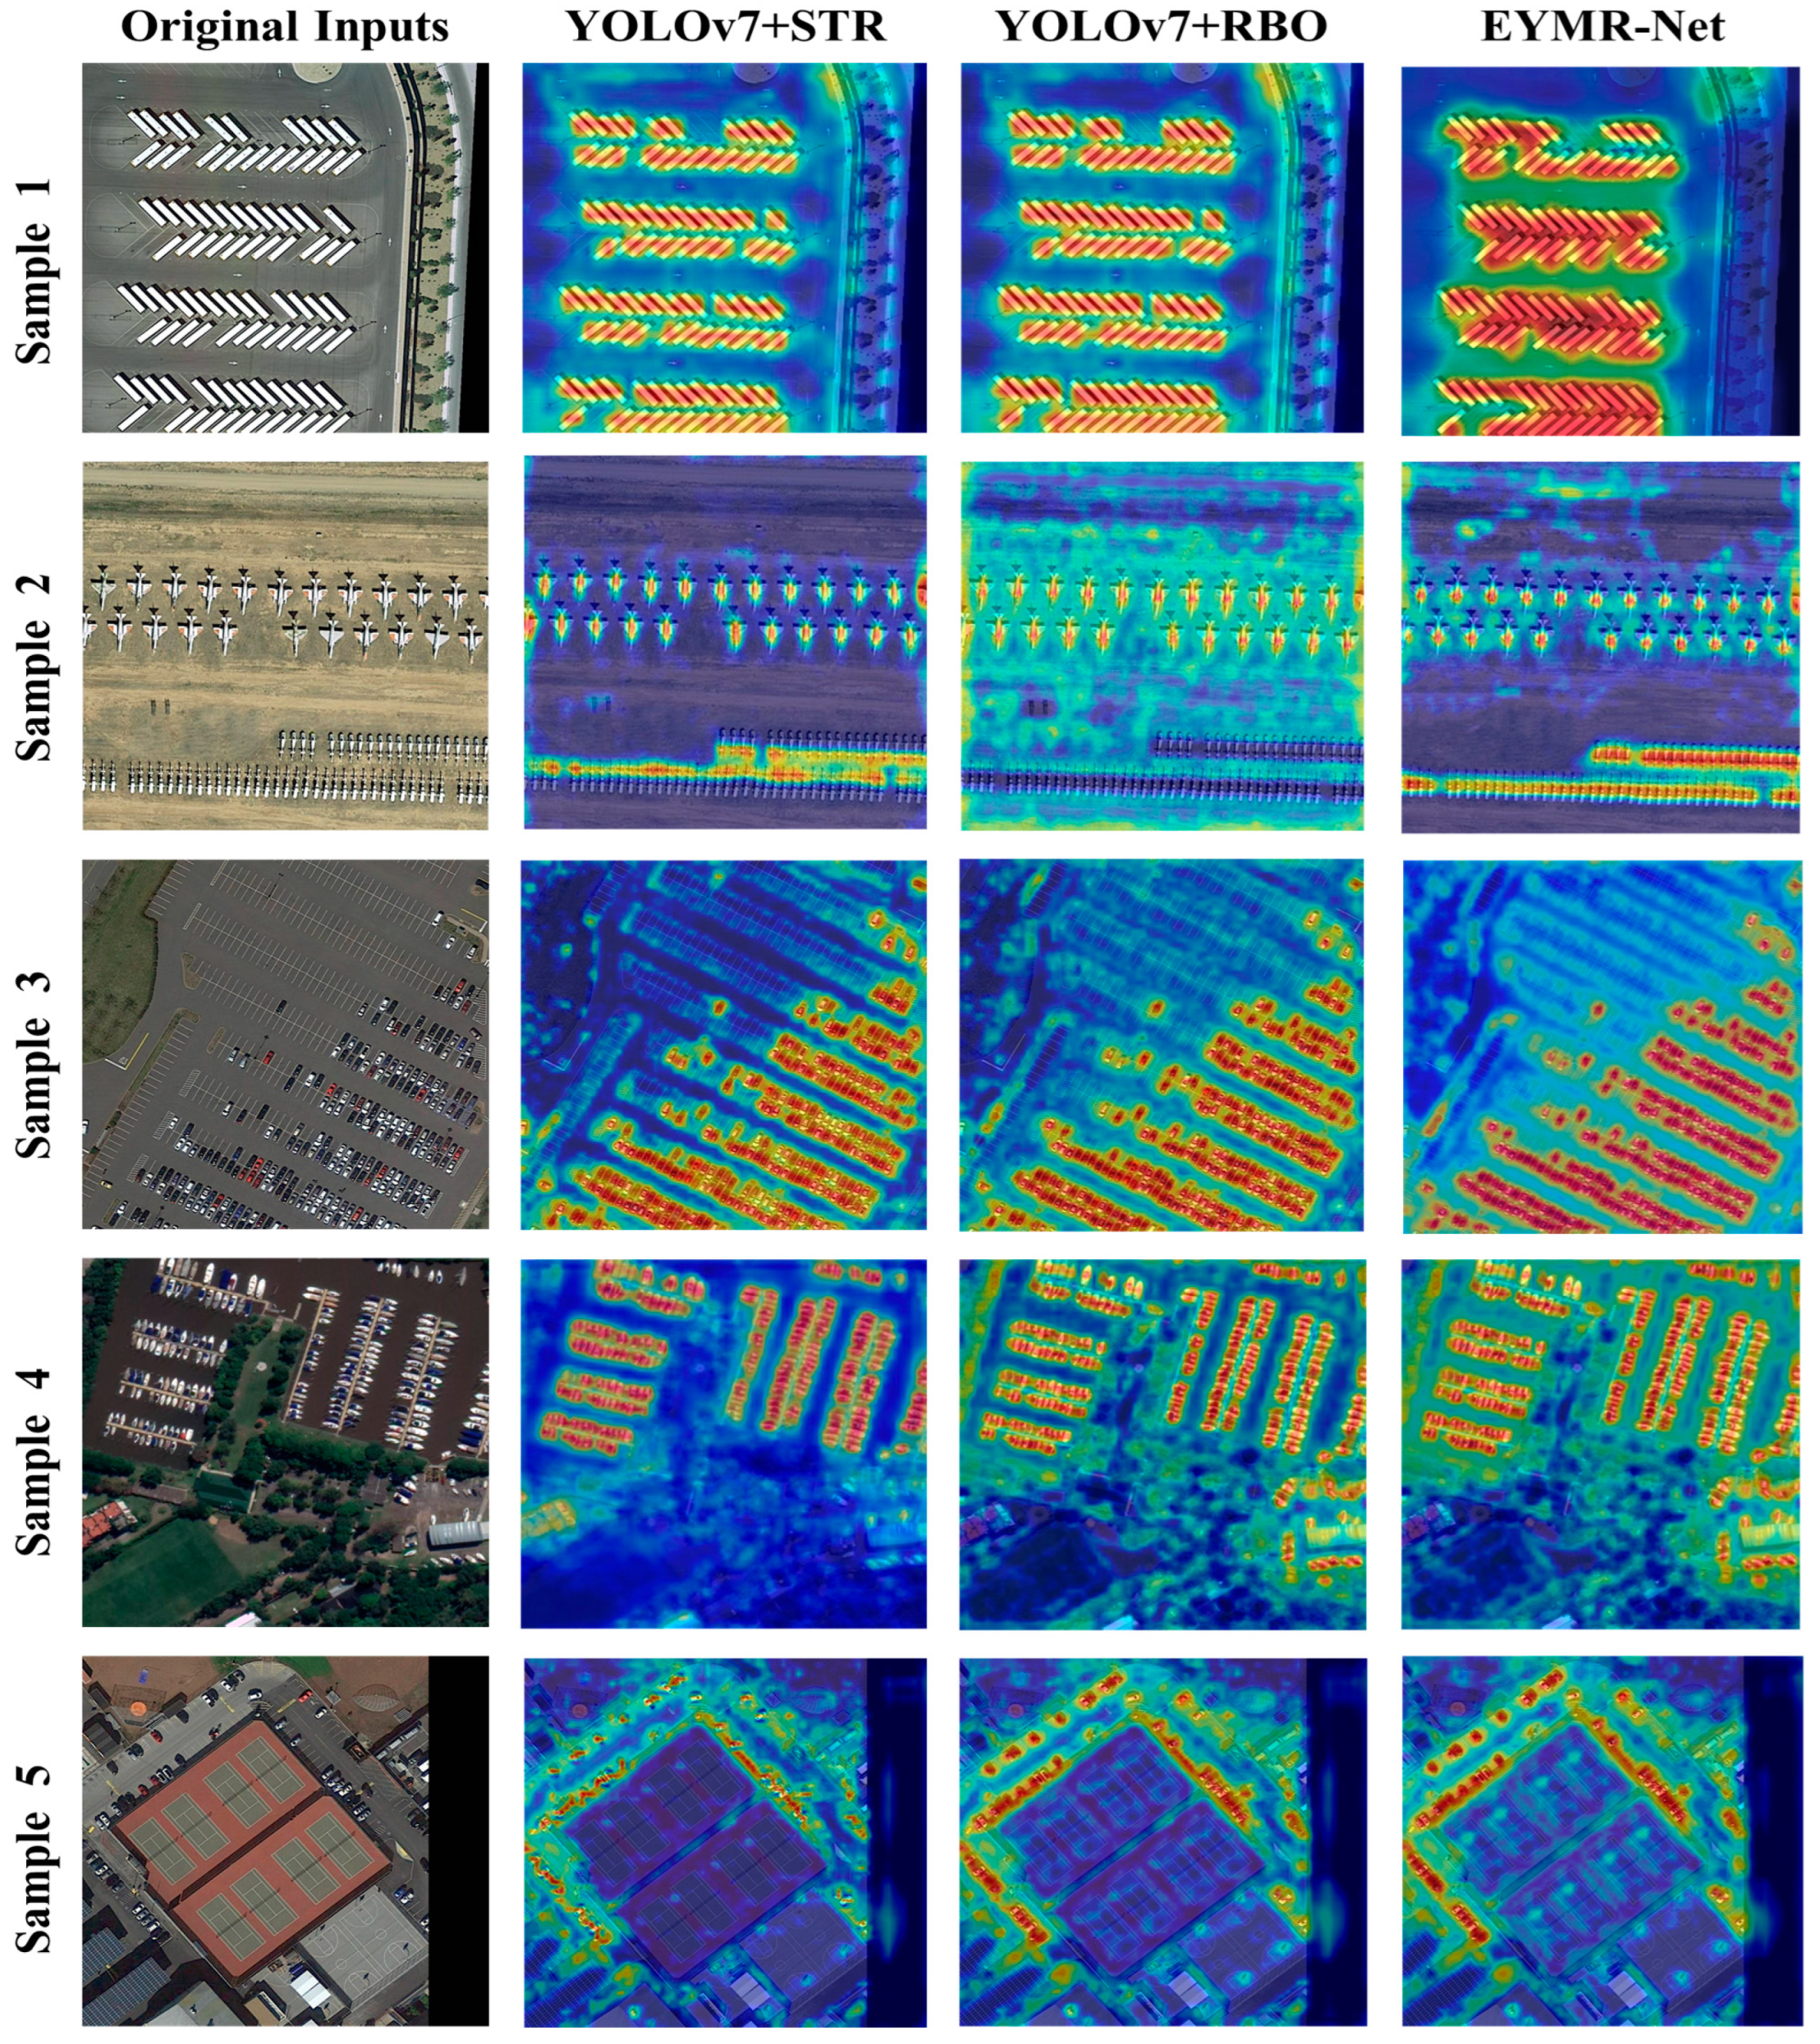
A thermal effect map is plotted based on Grad-cam to further reflect the feature information extraction capability of the detector, as shown in
Figure 11. In both figures, the first column comprises the original pictures, the second column lists the detection results of YOLOv7 after adding the Swin Transformer module (STR), and the third column lists the results of YOLOv7 after adding the Rotation Detection Frame (RBO). The last column presents the detection results obtained using our EYMR-Net.
Upon comparison, it was found that the improved algorithm in this paper dramatically improves the detection of multiple categories of targets in remote sensing scenes, such as large vehicles (LVs), airplanes (PLs), and helicopters (HCs), in the images of groups 1 and 2. If these categories were detected using the original algorithm, YOLOv7, they would contain a large number of redundant pixels of the background in the detection box, and the IOU between neighboring detection boxes would be too large, which would prevent the precise location of the position from being found and prevent the contour of a single target. On the contrary, EYMR-Net, presented in this paper, adopts a rotating box annotation that can perfectly fit the object’s shape, and the IOU between adjacent detection boxes is much lower than that of YOLOv7.
Densely arranged targets with considerable overlaps are best located using the rotating box. The improved multi-scale rotating target detector, EYMR-Net, presented in this paper solves the problem of excessive redundant pixels in the detection box brought about by detection with a horizontal box, which realizes target detection that better fits the shape of the object and improves the detection effect of the densely arranged targets in remote sensing scenes. For example, for the harbors (HAs) and ships (SHs) in the picture in group 4, the horizontal box of the original algorithm, YOLOv7, cannot accurately delineate the area of the ships moored near the harbor, which is not conducive to the detection of ship targets in marine remote sensing scenes. For the very small target ships moored on the shore in the lower-right bit of the picture, the improved algorithm presented this paper detects 16 ships, while the original algorithm YOLOv7 detects 14 ships, which proves that the new feature extraction networks backbone and neck, constructed using this paper’s algorithm based on the attention of the Swin Transformer and the CBAM, effectively optimizes the small-scale target leakage detection problem under complex remote sensing scenes.
For the remote sensing images in group 5, due to the overly complex background of urban remote sensing images, there are different categories of multiple scales: tennis courts (TCs), basketball courts (BCs), and small vehicles (SVs). The large-scale targets in the remote sensing scene, the tennis courts, and the basketball courts are in the form of angular rectangles. The original algorithm does not have a good detection effect for face-to-face directional alignment, there are too many redundant pixels in the background, the overlap of the neighboring frames is more than 50%, and the improved EYMR-Net improves the problem efficiently and superiorly differentiates the contour areas of different targets.
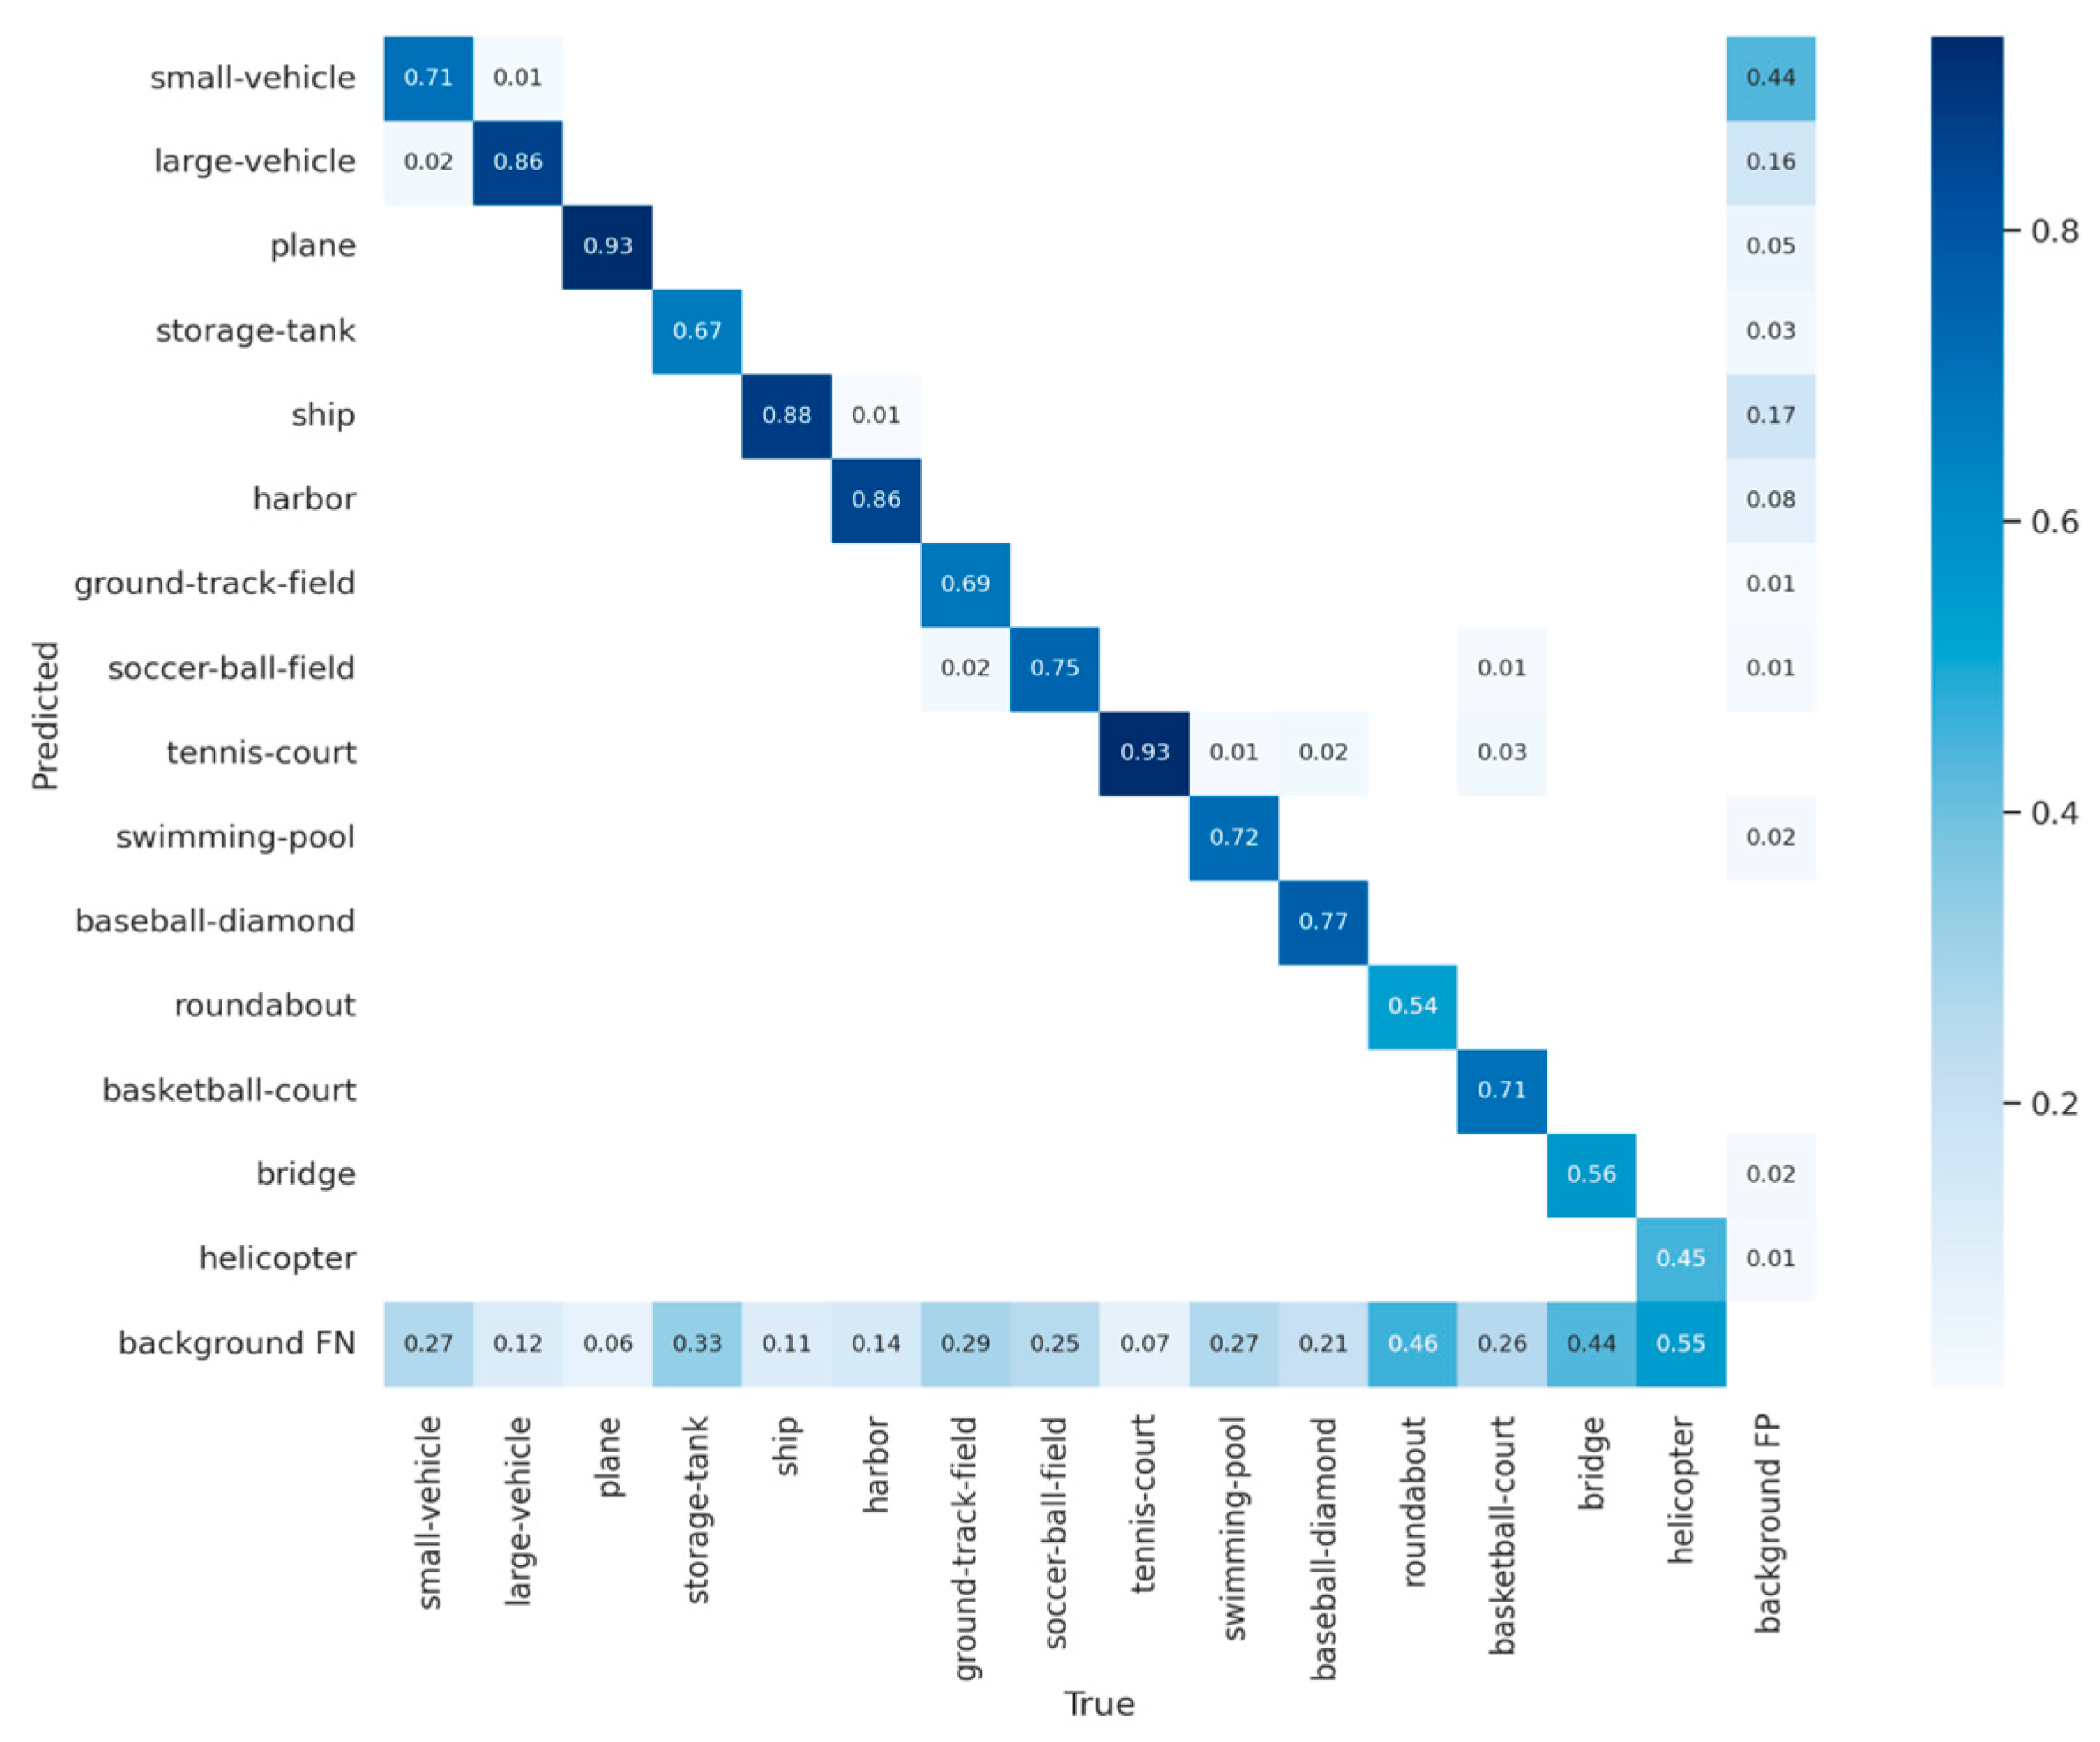
For further visual analysis, we utilized a confusion matrix to evaluate the accuracy of the EYMR-Net model’s predictions. This matrix’s vertical axis represents the actual target categories, while the horizontal axis represents the predicted categories.
Figure 12 provides a visual representation of this matrix. Our analysis of the confusion matrix revealed that the proposed EYMR-Net model achieved high accuracy rates for small vehicles, large vehicles, planes, ships, harbors, tennis courts, and basketball courts, with correct prediction rates of 71%, 86%, 93%, 88%, 86%, 93%, and 71%, respectively. These results demonstrate the model’s ability to detect targets of various scales accurately, with a particularly impressive performance in detecting small objects.
5. Conclusions
Sustainability in agricultural supply is crucial for ensuring food safety and improving people’s lives, and detecting various logistics targets through remote sensing imagery is meaningful for improving the efficiency of logistics supervision. However, traditional detection methods have problems with horizontal labels ignoring the multi-scale variation and dense distribution of transportation equipment in the detection process of remote sensing imagery. To address the identified issues, this paper proposes EYMR-Net, an enhanced YOLO architecture detector tailored for multi-scale rotating remote sensing objects. The EYMR-Net incorporates several key advancements. Firstly, it features a novel backbone based on the Swin Transformer, which captures richer gradient fusion information of multi-scale targets, with a particular emphasis on enhancing the detection of small targets. Additionally, the model integrates the Convolutional Block Attention Module (CBAM) within the neck component, thereby improving feature analysis capabilities and reducing missed detections and omissions of small targets. Moreover, EYMR-Net introduces an innovative rotating frame regression mechanism by utilizing circular smoothing labels, effectively addressing the limitations of traditional horizontal regression models that often overlook target directionality. Extensive comparative and ablation experiments conducted on the DOTA dataset demonstrate the superior performance of EYMR-Net over competing models, achieving Precision, Recall, and mAP0.5 scores of 79.76%, 72.18%, and 74.30%, respectively. These results highlight EYMR-Net’s innovative approach to multi-scale target detection, making it particularly well suited for practical monitoring applications of remote sensing technology.
In the future, we will further explore the potential of the EYMR-Net model in other research fields, such as agricultural or pharmaceutical logistics. Meanwhile, we can further optimize related technologies and modeling strategies to enhance their performance in different remote sensing scenarios.


