Abstract
The healthcare sector constantly investigates ways to improve patient outcomes and provide more patient-centered care. Delivering quality medical care involves ensuring that patients have a positive experience. Most healthcare organizations use patient survey feedback to measure patients’ experiences. However, the power of social media can be harnessed using artificial intelligence and machine learning techniques to provide researchers with valuable insights into understanding patient experience and care. Our primary research objective is to develop a social media analytics model to evaluate the maternal patient experience during the COVID-19 pandemic. We used the “COVID-19 Tweets” Dataset, which has over 28 million tweets, and extracted tweets from the US with words relevant to maternal patients. The maternal patient cohort was selected because the United States has the highest percentage of maternal mortality and morbidity rate among the developed countries in the world. We evaluated patient experience using natural language processing (NLP) techniques such as word clouds, word clustering, frequency analysis, and network analysis of words that relate to “pains” and “gains” regarding the maternal patient experience, which are expressed through social media. The pandemic showcased the worries of mothers and providers on the risks of COVID-19. However, many people also shared how they survived the pandemic. Both providers and maternal patients had concerns regarding the pregnancy risks due to COVID-19. This model will help process improvement experts without domain expertise to understand the various domain challenges efficiently. Such insights can help decision-makers improve the patient care system.
1. Introduction
As healthcare organizations focus on improving patient-centered care, patients play a more active role in the decision-making that prioritizes the patient’s needs, values, and preferences. Patient-centered care is defined by the Institute of Medicine (IOM) as offering treatment that considers and responds to each patient’s unique preferences, requirements, and values and ensures that the patient’s values direct all clinical judgments [1]. The organization suggests a total of six goals, which are safe, effective, patient-centered, timely, efficient, and equitable [1]. Research has shown that patient-centered care improves patient satisfaction, outcomes, communication, and collaboration between patients and healthcare providers [2]. This approach recognizes that patients are the key decision-makers in their care and aims to involve them as much as possible. As a result, the trend toward patient-centered care has been emphasized, as patients seek a more engaged experience with the use of health monitoring devices and a trusted relationship with their healthcare provider [3,4,5].
Patient experience is another significant quality index. There is a strong positive correlation between the outcome of a patient and their experience [6]. A patient’s experience relies on what happened to the patient and how the patient perceived that experience. This also highlights the subtle difference between “patient experience” and “patient satisfaction”, which are often used interchangeably. Moreover, the patient experience is related to their perception of care, and satisfaction accounts for their expectations of care. A vast amount of unstructured data regarding patients’ healthcare experiences is present on social media, which is usually posted by patients or their family members [7,8]. However, due to the ingrained complexity of processing and analyzing such data, this information is not systematically assessed and utilized to improve the healthcare system. Text analytics can play a more significant role in harnessing meaningful insights from social media; policymakers can obtain directions on improving and implementing better patient-centric care.
This study incorporates natural language processing (NLP) to efficiently capture the maternal patient experience from a large-scale social media dataset containing Twitter tweets. We selected maternal patients as one of the cohorts to analyze the use of NLP to measure patient experience. Moreover, maternal health is critical to women’s health and well-being, particularly in the United States (US), where maternal mortality rates are high. According to the Centers for Disease Control and Prevention (CDC), approximately 700 women die each year in the US due to pregnancy-related causes, and 60% of these deaths are preventable [9]. We analyze tweets to discover topics related to maternal health and their sentiments to understand the pains and gains expressed by patients, relatives, or friends. We used the IEEE coronavirus COVID-19 tweets dataset for our analysis [10]. We also examined the data within the healthcare disparity lens to find topics related to pregnancy, maternal care, and COVID-19.
In summary, the main research objectives of this article are as follows:
- Utilize the NLP algorithm to evaluate patient experience related to maternal health using social media data;
- Classify text data into various topics relevant to maternal health and conduct sentimental analysis.
2. Literature Review
We conducted a literature review to understand how patients’ experiences were captured and what tools and techniques are used to garner patients’ experiences. We also discuss studies focusing on NLP techniques, specifically topic modeling and sentiment analysis.
2.1. Research in Patient-Centered Care and Patient Experience Improvement
Numerous healthcare organizations have undertaken patient-centered care as part of their mission and strategy when IOM announced patient-centered care as one of its six objectives for improving healthcare [11]. Over the past decade, there has been a significant advancement in evaluating patients’ experiences, demonstrating the value of incorporating the patients’ insights and demands into the healthcare system [12]. Patient-centered care includes showing respect toward patients’ values and choices [13,14], integrating care coordination and improving access to care [15,16,17], educating patients on their clinical status, prognosis, and progress throughout their journey [17,18], providing physical comfort and emotional support [19,20,21], and ensuring patient care continuation and well-being during and after discharge [16,22]. A lack of patient-centered care will result in unmet patient needs, a waste of resources, and ineffective care [23]. Several researchers found that patient-centered care was associated with improved patient outcomes, which include improved quality of life [24,25].
Since the healthcare industry is becoming increasingly patient-centric, a need exists to quantify, record, and improve patients’ experiences under their care [26,27]. Patients’ experiences of the care and the feedback extracted from patients about those experiences are integrated to conceptualize patient experience and satisfaction, which are crucial for improving healthcare systems. According to [28], incorporating patients’ experiences and evaluating the patients’ nonclinical needs can improve healthcare systems and reduce malpractice claims. In the US, the federal government entities, the Centers for Medicare and Medicaid Services (CMS) and the Agency for Healthcare and Research Quality (AHRQ), developed a survey named Hospital Consumer Assessment of Healthcare Providers and Systems (HCAHPS) [29,30] to assess patient satisfaction. The patient satisfaction metrics should consider evaluating the cognitive and emotional aspects of patient satisfaction that impact the clinical outcomes [31,32]. Patient experience can be measured using journey mapping, qualitative and quantitative surveys [33,34], artificial intelligence techniques, technology, and digital tools [35,36,37].
The evaluation of patient experience helps healthcare organizations extract actionable insights to improve healthcare quality [38,39,40], increase engagement with the patient and their healthcare provider [41,42], improve care effectiveness, lower employee turnover, and enhance employee satisfaction [43,44,45,46]. Studies have also shown that patient experience can impact critical financial levels dependent on patient retention and medical malpractice claims [46,47,48].
2.2. Research in Text Analytics
Text analytics collects trends, insights, sentiments, and topics of interest using an automated process of drawing information from unstructured data and takes advantage of tools, methods, and mathematical algorithms to analyze and make computers understand text and speech [49]. It can differentiate between positive and negative emotions from the text [50], discussed topics [51], and the association between the keywords. Text analytics contains various applications, such as descriptive, prescriptive, or predictive analytics [52,53].
One of the most significant methodologies of text analytics is natural language processing (NLP). NLP, a branch of artificial intelligence (AI), essentially gives computers the power to understand human language from written text and spoken words, similar to how an ordinary person would understand [49,54]. It allows computers to perform a series of processes to disintegrate the human text and comprehend human language by consolidating computational linguistics and machine learning tools [55,56]. For instance, researchers have used NLP in various healthcare applications, including a large-scale analysis of counseling conversations to provide effective counseling to patients [57], the evaluation of health insurance claims to find fraud or abuse [58], the assessment and rehabilitation of patients during the COVID-19 pandemic, the digitization and classification of prescriptions [59], and the extraction of patient information from electronic healthcare records [60] and patients’ sentiments from healthcare surveys [38,61]. This review discusses topic modeling, sentimental analysis, and N-gram analysis.
2.2.1. Topic Modeling
Topic modeling is an effective and practical tool in NLP for analyzing large text documents [62]. Topic modeling automatically groups words into topics and identifies relationships between documents within a dataset. In other words, it aims to characterize a text (such as articles, social media postings, survey results, and interview responses) as a distribution over topics and the topics as a distribution over words. The number of topics and the words within each topic are measured using a coherence score, and the similarity of these words to each other is measured [63]. In some of the studies, perplexity is used to find the optimal number of topics [64,65]. The lower the value of perplexity, the more accurate it gets. In Pinto et al. (2021), the authors compared the perplexity-based model and the coherence-based model and concluded that although perplexity-based models produce simpler LDA models, the topic quality was poor.
Latent Dirichlet allocation (LDA) is one of the most widely used topic modeling algorithms [66,67,68,69,70] to represent a group of documents based on their underlying themes. It is an unsupervised learning method; i.e., the topics are identified without prior knowledge of their content [71]. LDA utilizes the score to measure the optimal number of topics that provide the maximum coherence value [72]. LDA aims to determine the range of issues in a specific document. LDA has been applied to a wide range of NLP tasks, which include topic classification from journals and newsgroups [69,73]. LDA has also been widely used in the medical and healthcare sectors to analyze and classify various types of healthcare data. Applications of LDA in healthcare include analyzing electronic health records (EHRs) and patient feedback responses to prioritize patient experience improvement initiatives. LDA can analyze EHRs that contain a wealth of information, including clinical notes, diagnosis codes, and laboratory results, to identify patterns in patient data, such as comorbidities, medication use, side effects, disease progression, and treatment outcomes [74,75,76,77]. Several researchers have used LDA to analyze patient feedback from hospital surveys and online reviews to identify factors influencing patient satisfaction. They found that topics such as communication, nursing care, staff attitude, care quality, waiting time, facility quality, and overall experience impact patient reviews of the hospital [78,79,80]. Improvements to various systems, such as appointment scheduling and billing, are crucial for improving the patient experience.
The use of social media analysis in evaluating patient experience utilizes LDA techniques. Okon et al. (2020) [71] used LDA to analyze over 176,000 Reddit threads that provided feedback about dermatology patients’ experiences. Ortega (2021) [22] utilized patient feedback from social media (Twitter and Reddit) and applied LDA to evaluate breast cancer patients’ experiences, find the latent topics shared by the patients, and evaluate the sentiments behind those topics. In addition to identifying topics related to patient experience, LDA can also be used to analyze changes in patient experience over time. Ao et al. (2020) [81] used LDA to analyze patient feedback over three years to identify changes in patient experience. They found that while topics related to communication and staff attitude remained consistent, topics related to waiting time and access to care became more prominent in later years.
Alongside LDA, there are other notable methods such as NMF (non-negative matrix factorization) [82], Top2Vec [83], and BERTopic [84], which are also used in different studies to model topics [85]. NMF is a kind of linear algebraic algorithm, which is decompositional, non-probabilistic, and uses matrix factorization [86]. Top2Vec is a fairly new algorithm which utilizes word embeddings and vectorization of text data to recognize semantics [83,85]. Lastly, BERTopic builds on top of Top2Vec and they are very similar, but the main difference is that it uses a class-based term frequency algorithm [87]. Sanchez-Franco et al. (2021) used BERTopic to find clusters of reviews from Airbnb and find highly relevant topics. In Egger et al. (2022), the authors compared all these topic modeling methods and evaluated their performance. According to this study, BERTopic and NMF produced better results compared to Top2Vec and LDA. Another study has shown that BERTopic showed better evaluation scores than LDA [88]. However, both of these studies were only confined to short text data and also the processing time was also higher and computationally expensive.
In this study, we have used the LDA method for topic modeling as among the other methods, this one is very efficient in large datasets and also this method is well-established in this field.
2.2.2. Sentiment Analysis
One of the most widely used tools to garner sentiment from text or voice messages is sentiment analysis, which classifies the underlying emotion as positive, negative, and neutral [89,90,91,92]. We discuss three sentimental analysis methods: machine learning algorithms, rule-based systems, and lexicon-based approaches. A lexicon-based approach uses dictionaries of sentiment-laden words to classify text based on the presence or absence of particular words or phrases and utilize the term phrases, sentimental idioms, and expressions. On the other hand, a machine learning-based approach uses a computer model to train an existing dataset with defined emotions and uses those trained models to predict the sentiment of new text data [93]. The rule-based systems use a set of predefined rules to classify text based on specific patterns.
The Valence Aware Dictionary and sEntiment Reasoner (VADER) is a sentiment analysis tool based on the rule-based system specifically designed to handle social media data, which often contains informal language (often used in social media texts), slang, and abbreviated words. It has gained significant attention recently due to its high accuracy and efficiency in analyzing sentiment in social media texts [94]. They showed that VADER’s accuracy in identifying neutral sentiments outperformed other sentiment analysis tools, such as TextBlob and the Stanford CoreNLP. Elbagir and Yang (2019) [95] used VADER and NLTK sentiment analysis tools to interpret sentiments in Twitter data. Here, also, VADER achieved higher accuracy and was more capable of handling contextual information than NLTK. A. Kumar et al. (2020) [96] showed that VADER performed better than SentiStrength and AFINN in analyzing sentiments, irony, and sarcasm in online product reviews. Our study used the VADER sentiment analysis to analyze the maternal patient experience from Twitter.
Different industries, such as tourism, politics, and marketing, extensively utilize the power of sentiment analysis [97] to discern and extract subjective insights from customer reviews and utilize those insights to improve their service [98]. Sentiment analysis is widely used in clinical research and health informatics to analyze patients’ sentiments regarding their care and identify areas to improve healthcare quality. Asghar et al. (2016) [99] have reviewed several use cases for sentimental analysis in healthcare.
Sentiment analysis gives decision-makers insights into how patients feel toward caregivers and treatment systems [100]. Greaves et al. (2014) [101] presented a mixed-method study to evaluate the patient experience and hospital quality from a small number of tweets. Hawkins et al. (2016) [102] utilized a machine learning approach to analyze data from 2349 US hospitals over one year to determine the patient’s experience, including their care, experience from hospital administration, and interaction with healthcare professionals. Crannell et al. (2016) [103] presented a study that analyzed emotions from the tweets of various cancer patients for unique cancer diagnostics. Similarly, Rodrigues et al. (2016) [104] have introduced a tool called SentiHealth-Cancer (SHC-pt) to identify the mental condition of cancer patients from social media. While surveys and patient feedback are commonly used to measure patient experience, patient journey mapping can capture it more comprehensively. Ortega (2021) [22] utilized sentimental analysis to provide valuable insights for improving empathetic and respectful care in clinical systems and enhancing patient-centered care.
Polarity and subjectivity are the two most popular measures of sentiment analysis [105,106,107]. Subjective texts often have more complex and nuanced meanings than objective ones [108,109]. For instance, a positive review of a restaurant may contain various subjective expressions such as “the food was amazing”, “the ambiance was fantastic”, or “the service was outstanding”. Subjectivity in sentiment analysis refers to the extent to which a text expresses personal opinions, feelings, or attitudes [108]. Polarity scores help to identify the text’s mood (positive, neutral, or negative sentiments). There are different approaches to detecting subjectivity and polarity in sentiment analysis. One common practice is to use lexicons or dictionaries that contain words with positive or negative connotations. This method involves assigning a sentiment score to each word in the text based on its polarity and then combining these scores to obtain an overall sentiment score. Another approach is to use machine learning algorithms, such as support vector machines or neural networks, that are trained on a dataset of annotated texts to predict the sentiments of new texts.
After the sentiment analysis, the N-gram analysis was conducted for every topic depending on the polarity. N-gram analysis is a text mining technique used to analyze the structure and content of written language [110,111,112]. An N-gram is a contiguous sequence of n items from a given text sample, where n is an integer representing the number of items in the sequence [112].
Table 1 summarizes the literature review based on the tools, techniques, and applications for sentimental analysis and LDA. From the discussion of the relevant literature, we find that there appears to be a research gap in evaluating efficient patient experience using social media analytics. Although several studies have focused on data collected from social media, they always needed a more efficient and effective way of sentiment analysis.

Table 1.
Summary of the literature review.
This study aims to evaluate the maternal patient experience during the COVID-19 pandemic from social media. To achieve this objective, we formulated an NLP algorithm to discover the dominant topics patients express on Twitter and the sentiment behind them and measure patient experience.
3. Methodology
To evaluate the patient experience from Twitter, the study follows a properly defined series of steps to extract the common topics maternal patients talk about and then assess the sentiment behind them. We used Python 3.5 in Jupyter Notebook and relevant packages for our analysis. At first, data preprocessing was performed to make the data ready for natural language processing algorithms.
In this study, we utilized the tweets published in an IEEE source [10] that were collected using several COVID-19-related keywords. A subset of the dataset of 28,087,954 tweets was used in this study. These tweets are specifically from the users who posted regarding the COVID-19 pandemic. Figure 1 shows a high-level overview of the study.
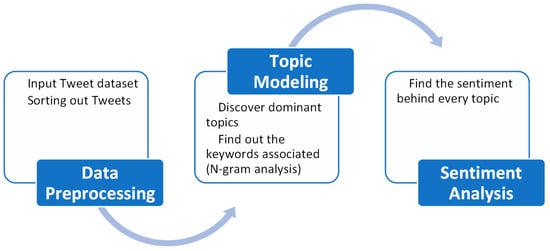
Figure 1.
High-level overview of the framework.
3.1. Data Preprocessing
First, the tweets were preprocessed using R programming, which filters out the tweets posted only from the USA. Several R packages, such as lubridate, dplyr, plyr, and tidyr, were used. Then, several relevant keywords identified for maternal patients [22,117,118,119], such as “maternal”, “nursing”, “maternal_health”, “pregnancy”, “preeclampsia”, ”pre-eclampsia”, “infant”, “motherhood”, “gynecology”, “postpartum”, “maternalmentalhealth”, “maternal_mortality”, “obstetrical”, “womenshealth”, “doula”, ”obstet”, “pregnancyrelated”, “gynecology”, “cesarean”, “preterm”, “gynecol”, “perinatal”, “blackmaternalhealth”, “childbirth”, “pregnant”, “mentalhealth”, “breastfeeding”, “momlife”, “birth”, “baby”, “blackmamasmatter”, “healthcare”, “newmom”, “newborn”, “fourthtrimester”, “maternalhealthmatters”, “birthworker”, “postnatal”, “postpartumjourney”, “midwife”, “maternitycare”, “midwives”, “mother”, “holisticpregnancy”, “maternal”, “breastfeedingmom”, “reclaimlabor”, “charlestonsc”, “healthypregnancy”, “educateyourself”, “reclaimbirth”, “postpartumsupport”, “informeddecisions”, “intentionalbirth”, “reclaimourbodies”, “perinatalmentalhealth”, “birthinpower”, “birthsupport”, “selfcare”, “antenatal”, “antenatal care”, were used to further filter out the tweets.
3.2. NLP Pipeline
After preprocessing the dataset, selected tweets were isolated and fed into the NLP pipeline. There are several steps for the NLP, which are described in a flowchart in Figure 2.
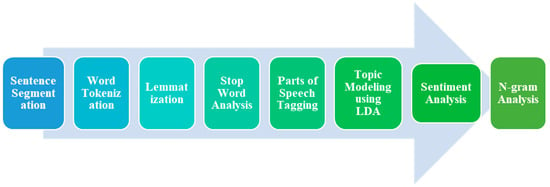
Figure 2.
Flowchart of NLP pipeline.
The further processing uses the NLTK package to remove unnecessary stop words, emoji, and punctuations from the raw tweets that do not convey any meaning for the topic modeling. Then, the words are tokenized, and then lemmatization is performed using Python’s NLTK library stemming. In lemmatization, words are converted into their base form for efficient analysis. This is useful for normalizing words and reducing inflected forms to a common base, thus aiding in text analysis and comparison. For instance, if the original word is “running”, after lemmatization it would be “run”. Each word was tagged with its respective part of speech. Parts of speech tagging are fundamental tasks in natural language processing (NLP). It involves assigning each word in a sentence with its corresponding grammatical category or part of speech (e.g., noun, verb, adjective, etc.). This process helps to extract meaningful information and understand the syntactic structure of a sentence. After this step, the dataset is ready for the topic modeling algorithm.
3.2.1. Topic Modeling
Since the inputs to the topic modeling are tweets, the model characterizes tweets as a distribution over topics and topics as a distribution over words. Essentially, this means that a tweet is assigned a probability for each topic, and each topic is assigned a probability for each word. In this study, we utilized LDA to determine the likelihood of a given string, whether a sentence or a document, using the likelihood of the string within the domain. Blei et al. (2003) [69] explained the following generative process for LDA:
- Randomly select a distribution over topics for every tweet;
- For every word in the tweet, carry out the following steps:
- Randomly select a topic from a distribution over topics in step 1;
- From the corresponding distribution over the vocabulary, randomly select a word.
In this study, LDA was implemented using Python’s genism package. Python’s NLTK and genism packages used processed tweets to identify the specified topics. We select the optimal number of topics based on the coherence score for each topic that provides the maximum coherence value. An inter-topic distribution mapping is used to visualize the topics.
3.2.2. Sentiment Analysis
We reiterate that the primary objective of sentiment analysis is to categorize a specific sentence or block of text as positive, negative, or neutral. We used the TextBlob and VaderSentiment packages of Python to perform sentimental analysis on the Twitter data after we classified them into specific dominant topics. We used polarity and subjectivity to quantify sentiment analysis [105,106,107].
We used the VADER tool for analyzing sentiments that follow a set of rules. The analysis classifies the text’s tone as positive, negative, or neutral. The overall sentiment score produced by VADER is a continuous value that ranges from −1 to 1, where −1 indicates highly negative sentiment, 0 indicates a neutral sentiment, and 1 shows an extremely positive sentiment. VADER also generates scores for the three sentiment categories (positive, negative, and neutral) and a compound score. This normalized weighted composite score represents the overall sentiment of the text on a scale from −1 to 1. In this study, we utilized the lexicon-based approach to quantify the subjectivity of every tweet using Python’s TextBlob package. After the sentiment analysis, the final output contains every tweet classified into a topic along with the sentiment behind that topic.
3.2.3. N-Gram Analysis
The sample text is divided into N-grams in the N-gram analysis, which are then counted and analyzed to determine their frequency and distribution. The most common form of the N-gram analysis is the bigram (n = 2), which considers pairs of adjacent words in the text. This type of analysis helps identify patterns and relationships between words in the text, such as common collocations or idiomatic expressions. Trigram (n = 3) analysis considers three adjacent words, and higher-order N-grams consider even more words. N-gram analysis is widely used in various applications, such as natural language processing, information retrieval, and machine learning. For instance, it can be used to identify the most frequently occurring words in a given text, to identify patterns in the usage of certain words or phrases, or to develop language models that can predict the next word in a sentence based on the preceding N-grams.
4. Results
At the first stage of data preprocessing from 28 million tweets, around 31,438 tweets were extracted about maternal healthcare from the USA. After the stop word removal and lemmatization, the processed tweets were transferred to the next step, topic modeling.
From the LDA topic evaluation that uses different values of “number of topics”, we find the optimal number of topics to be three. The LDA model coherence values are shown below in Figure 3. In this figure, we can see that for the number of topics 3, the model generated the maximum coherence score of 0.3466. After that, the coherence score decreases as the number of topics increases.
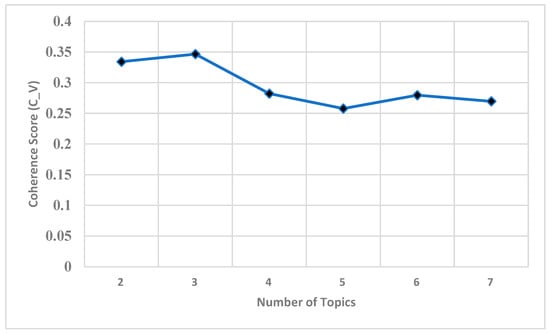
Figure 3.
Coherence score of LDA model for different numbers of topics.
Hence, the number of topics for the LDA model was set to three and are visualized in different ways. At first, a word cloud was drawn for every topic depicted in Figure 4. The keywords inside these word clouds represent each topic.
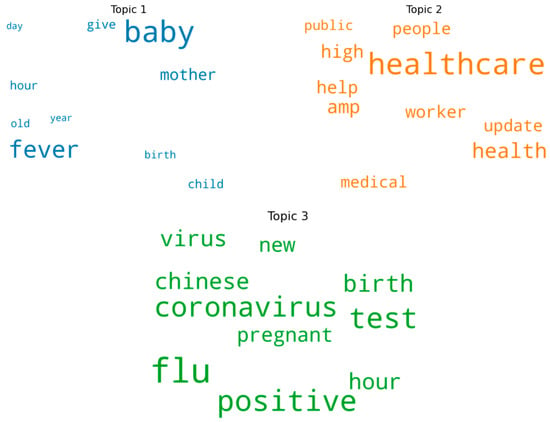
Figure 4.
Word cloud of three topics.
Therefore, the frequency of the most represented keywords in each topic is depicted in the following bar charts in Figure 5. It is evident that in Topic 1, “fever, baby, mother, birth” are the most frequent. In contrast, Topic 2 has “healthcare, high, help, worker, public, health medical” most frequently. In Topic 3, “coronavirus, positive, flu, birth, pregnant, test” are the most frequent.
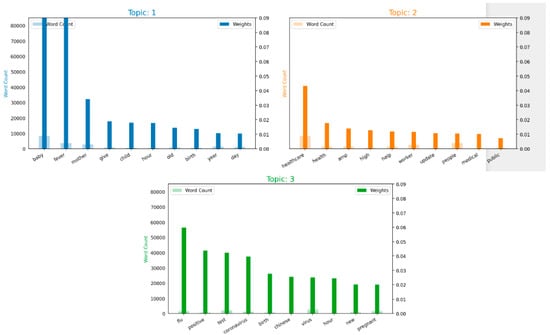
Figure 5.
Word count and importance of topic keywords for each topic.
From the above analysis, labels can be assigned to every topic. Depending on the keyword frequency in Topic 1, users talking about pregnant mothers and newborn baby’s mothers are worried about fever; in Topic 2, the impact on healthcare facilities and workers and consequences on expectant mothers; and in Topic 3, the tweets are concerned about the rising flu, which could be coronavirus-positive cases, COVID-19 testing, the rapidly spreading virus, and its effect on pregnant mothers.
Depending on these keyword frequencies, every tweet is classified into different topics, shown in three colors in Figure 6. Here, orange, green, and blue tweets represent the three topics based on their keywords. Blue represents Topic 1, orange corresponds to Topic 2, and green represents Topic 3.

Figure 6.
Tweets classified into three topics.
Next, the distribution of each topic in the dataset is shown in Figure 7. Here, it is evident that most of the tweets fall under Topic 2 and Topic 1.
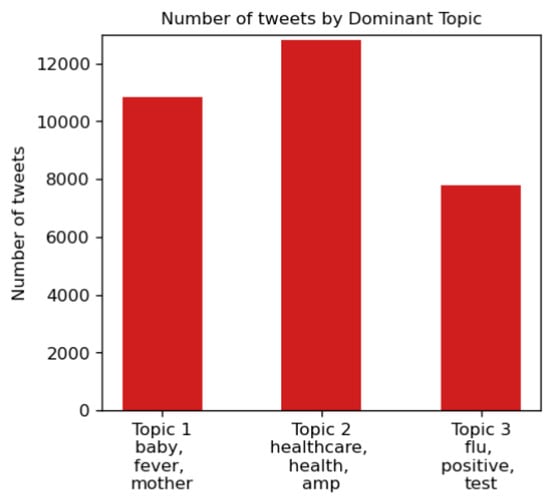
Figure 7.
Distribution of three topics.
Furthermore, all the dominant topics were shown in an inter-topic distance map to visualize better how topics are classified. This is illustrated in Figure 8.
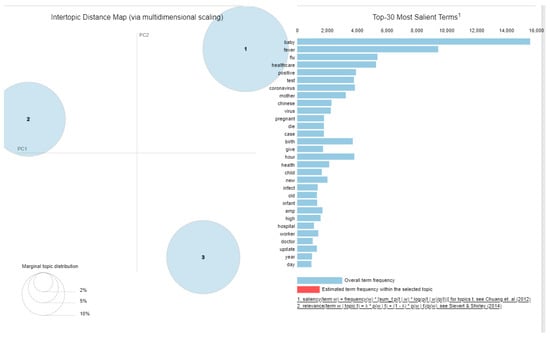
Figure 8.
Inter-topic distance map [120,121].
Furthermore, the three topics were again visualized using t-SNE, shown in Figure 9. Each dot represents a tweet, and the three colors indicate different topics. In the t-SNE graph, the n-dimensional data are described in two-dimensional space. It is clear from the figure that there is little overlap between topics.
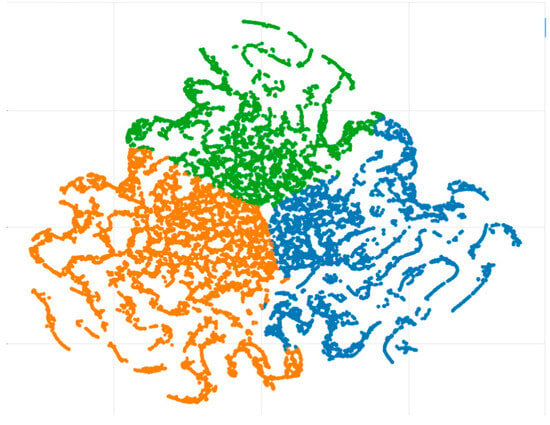
Figure 9.
Clustering of tweets.
After classifying the tweets, the sentiment behind each tweet was measured concerning polarity and subjectivity, as in Table 2. The value of polarity ranges from −1 to 1. A value of −1 represents a highly negative experience, 1 represents a good experience, and 0 represents a neutral experience. For subjectivity, the value ranged from 0 to 1. If a tweet contains a more significant amount of personal opinion, the subjectivity value would be close to 1. The value would be close to 0 if it contains factual information.

Table 2.
Sentiment analysis.
In Table 3 below, the mean polarity and subjectivity values are calculated. The mean polarity of Topics 1 and 3 conveys negative emotion, and the other topic has fairly positive emotion. However, as the negative and positive polarity tweets negated each other, each topic must be studied separately according to sentiments.

Table 3.
Average polarity and subjectivity depending on topics.
First, sorting the dataset for only Topic 1 with negative polarity, which essentially means negative sentiment, and running an N-gram analysis presents the following results, as shown in Figure 10. The N-gram analysis shows that mothers worry about their babies catching a fever and how pregnant mothers are severely affected by COVID-19. On the other hand, tweets on the same topic that express positive sentiment mostly talk about how pregnant mothers are surviving the coronavirus. Even during the COVID pandemic, they are optimistic about safe childbirth and express hope for healthy newborns. The N-gram analysis of that portion is shown in Figure 11.
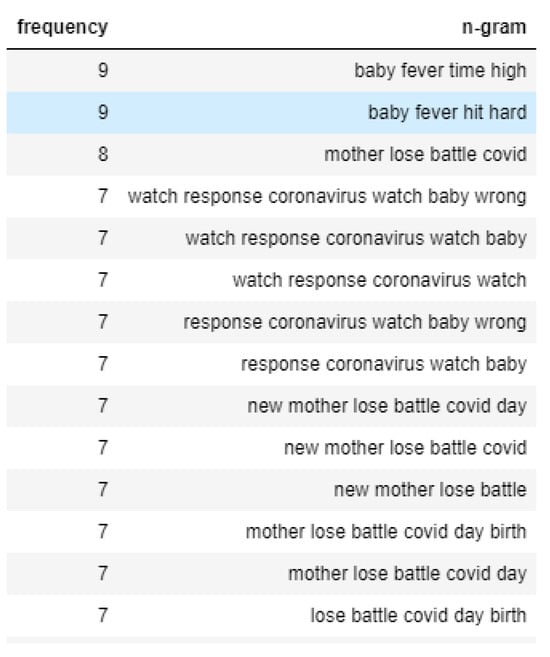
Figure 10.
N-gram analysis of negative sentiment tweets of Topic 1.
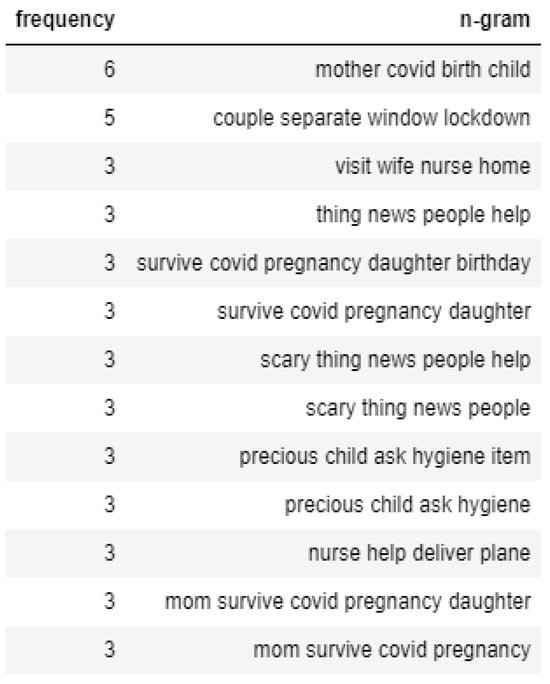
Figure 11.
N-gram analysis of positive sentiment tweets of Topic 1.
In the case of Topic 2, tweets that convey negative emotion talk mainly about how healthcare providers are having a tough time due to the risks and a considerable number of patients, as shown in Figure 12. However, the tweets with positive sentiment talk about helping healthcare agencies tackle the spread of the virus, as shown in Figure 13.
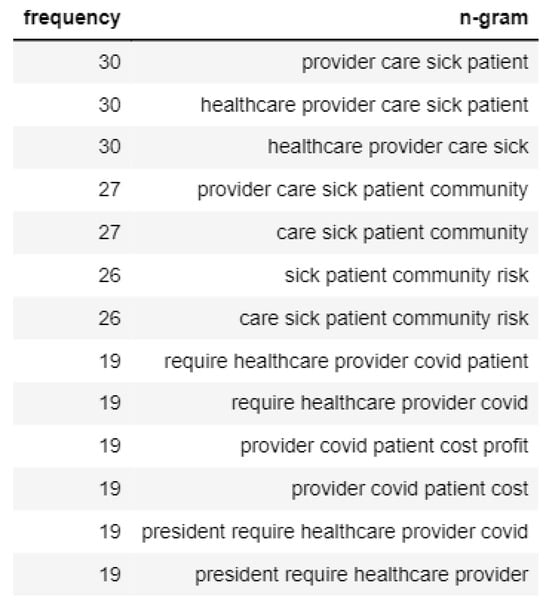
Figure 12.
N-gram analysis of negative sentiment tweets of Topic 2.
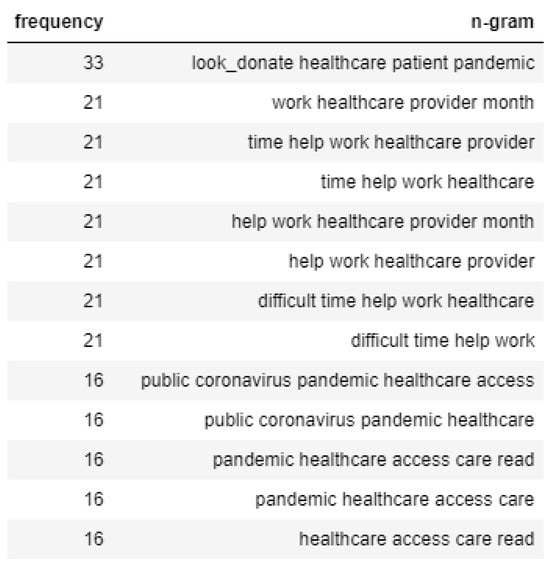
Figure 13.
N-gram analysis of positive sentiment tweets of Topic 2.
If focused on the N-gram analysis of the negative emotions tweets of Topic 3, we found that the mothers are worried about their babies testing positive for coronavirus, as shown in Figure 14. On the contrary, the positive tweets of Topic 3 usually talk about how mothers are getting care from healthcare workers, and the prevention strategy of widespread testing taken by the healthcare facilities is depicted in Figure 15.
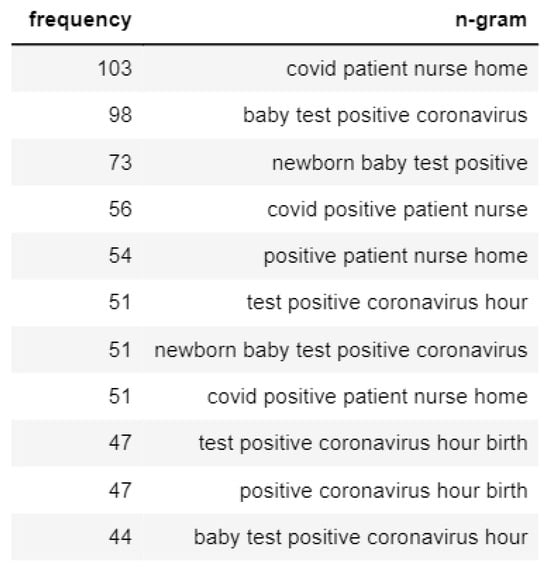
Figure 14.
N-gram analysis of negative sentiment tweets of Topic 3.
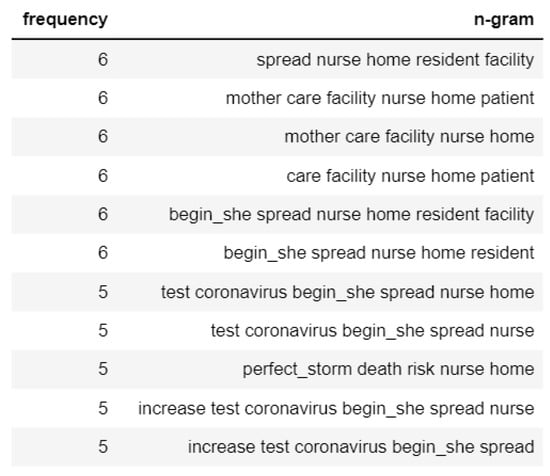
Figure 15.
N-gram analysis of positive sentiment tweets of Topic 3.
4.1. Preliminary Analysis of Disparity
We also utilized this study to conduct a preliminary analysis of the use of social media analysis to capture healthcare disparities. Upon careful examination of the tweets with a specified list of keywords regarding healthcare inequality, we found that most tweets focused mainly on racial disparities in healthcare. A word cloud is depicted in Figure 16 to show the racial disparity-related tweets. Topics such as minority, race, and distrust are frequent in these tweets.
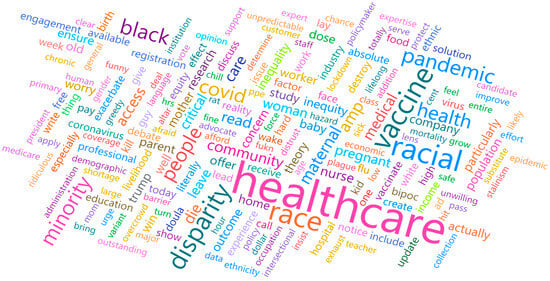
Figure 16.
Word cloud of the tweets about racial inequality in healthcare.
An N-gram analysis of the following tweets found that African American mothers are worried about not getting proper healthcare services. The N-gram analysis is shown in Figure 17.
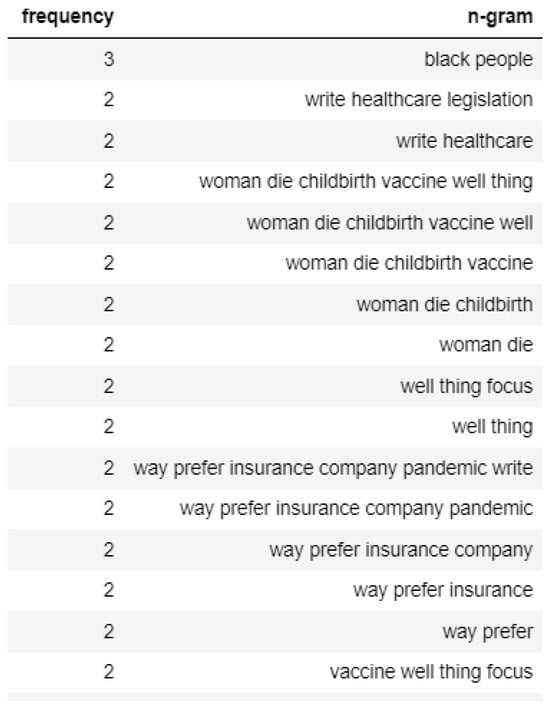
Figure 17.
N-gram analysis of racial inequality tweets.
Some of the actual tweets posted by the users are depicted in Figure 18. These representative tweets say a great deal about the racial injustice in healthcare in the USA, which was especially aggravated during the COVID-19 pandemic.
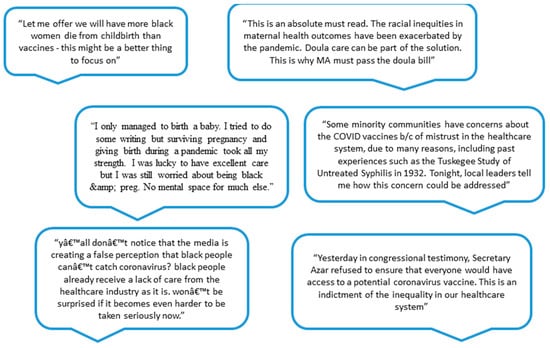
Figure 18.
Tweets regarding maternal healthcare inequality.
4.2. Limitations of This Study
However, there are a few limitations associated with analyzing Twitter data. For instance, users often use non-standard text, incorrect English, multilingual content, and emojis to express their opinions, which makes it incredibly challenging for NLP to classify some of the tweets and calculate the sentiment accurately. Also, users use sarcasm to express their views, which is very complex for the program to understand. There are also spelling mistakes or incomplete sentences, which makes it difficult for the model to understand the underlying sentiment. It is essential to preprocess the data to ensure that these algorithms provide valuable information. However, computers may not be able to distinguish between similar words such as “doctor” and “physician” or identify that “meal” and “meals” convey the same information. Additionally, spelling errors may create further complications because a minor modification in a word can make the computer perceive it as entirely different. These constraints are solved by using stemming or lemmatizing to reduce words to their base form, utilizing NLP libraries to correct spelling errors, manually analyzing comments to identify context-specific words, and replacing them with common words. Preprocessing patient-derived data may be more complex because respondents may need more healthcare literacy, make spelling mistakes, or use texting language outside the NLP library used for processing. In addition, sometimes tweets contain phrases that need to convey the words’ literal meaning, making it difficult for the program to understand. For instance, users who use the phrase “baby fever” usually express the longing that some people experience that relates to their desire to have a child. Additionally, isolating unique tweets from millions of tweets is challenging as there are several occasions of retweeting or quoting another person’s tweet. However, the computer program interprets the literal meaning of the phrase, so the program fails to extract the proper sentiment from tweets.
Future research should compare the evaluation score between the more advanced topic modeling approaches such as BERTopic, NFM, and Top2Vec and find out which one is performing better in certain cases. Additionally, studies should further explore different approaches to find the optimal number of topics, such as perplexity with better quality topics. A temporal analysis of topic distribution to demonstrate how it evolved over time would be a significant contribution and also very beneficial to the healthcare policymakers.
Nevertheless, despite all these limitations, the model produces an initial insight that gives policymakers a way to capture patient experience to improve healthcare systems and understand system-level concerns for the under-represented communities.
5. Conclusions
In this study, we have analyzed the tweets to extract the maternal patient experience and classified the different topics patients are talking about and the sentiment behind each of them. As we can see, topics have distinct levels of sentiment associated with them, which shows the diversity of the patient experience. Another aspect to note is that on social media, patients and their relatives post their experiences, giving various perspectives on medical care. The observed result from the LDA model classifies tweets into different topics, which helps to narrow down the patient’s experience. The sentiment analysis also provides meaningful information regarding the maternal patient experience. Moreover, through the N-gram analysis, we delivered what is discussed in each topic and critical insights regarding racial inequity in healthcare systems.
The analysis of this study would work as a guideline for policymakers inside a healthcare system. Among the developed countries in the world, the US has the highest rate of maternal mortality or morbidity; the analysis of patient experience can provide valuable insights regarding patients’ expectations of care and the original quality of care that they received. Utilizing the topics identified using topic modeling, policymakers and community organizations can understand the patients’ negative and positive experiences and develop policies accordingly. For example, from the results of this study, the policymakers know they need to spread awareness for the symptoms of COVID-19 and also implement widespread testing. The mothers needed more knowledge regarding this disease and from the preliminary analysis of the racial disparity in healthcare, it is also clear that the African American population needs more access to vaccines and testing. Moreover, social media analytics provides an initial insight into the healthcare disparities from the system-level point of view that should be captured in patient experience surveys or other tools. One recommendation for future work is to include other social media data and data from different languages. Because there are many multilingual users in social media, the model would be able to capture more information. Another important addition can be to use process mining techniques to explore the patient journey map and take the necessary actions to improve the quality of care. Suppose policymakers have access to the surveys of the patients’ experiences collected through interviews. In that case, these data can be incorporated into the model to obtain much more insights that improve healthcare quality. Typical conditions such as postpartum blues and physician burnout may have caused the negative patient experience; COVID-19 might have added to the negativity of experiences during these times.
Author Contributions
Conceptualization, S.C.M., A.J.L., S.A.L.F. and S.K.M.; Methodology, D.B. and S.A.L.F.; Validation, S.C.M. and A.J.L.; Formal analysis, D.B. and S.A.L.F.; Writing—original draft, D.B.; Writing—review & editing, S.C.M., A.J.L. and S.K.M.; Supervision, S.C.M., A.J.L., S.A.L.F. and S.K.M. All authors have read and agreed to the published version of the manuscript.
Funding
This research received no external funding.
Institutional Review Board Statement
Not applicable.
Informed Consent Statement
Not applicable.
Data Availability Statement
The data presented in this study are openly available in https://ieee-dataport.org/open-access/coronavirus-covid-19-tweets-dataset.
Conflicts of Interest
The authors declare no conflict of interest.
References
- Wolfe, A. Institute of medicine report: Crossing the quality chasm: A new health care system for the 21st century. Policy Politi- Nurs. Pr. 2001, 2, 233–235. [Google Scholar] [CrossRef]
- Wolf, D.M.; Lehman, L.; Quinlin, R.; Zullo, T.; Hoffman, L. Effect of patient-centered care on patient satisfaction and quality of care. J. Nurs. Care Qual. 2008, 23, 316–321. [Google Scholar] [CrossRef] [PubMed]
- Peters, V.J.T.; Meijboom, B.R.; Bunt, J.E.H.; Bok, L.A.; van Steenbergen, M.W.; de Winter, J.P.; de Vries, E. Providing person-centered care for patients with complex healthcare needs: A qualitative study. PLoS ONE 2020, 15, e0242418. [Google Scholar] [CrossRef] [PubMed]
- El Kefi, S.; Asan, O. How technology impacts communication between cancer patients and their health care providers: A systematic literature review. Int. J. Med. Inform. 2021, 149, 104430. [Google Scholar] [CrossRef] [PubMed]
- Kumar, P.; Dwivedi, Y.K.; Anand, A. Responsible artificial intelligence (AI) for value formation and market performance in healthcare: The mediating role of patient’s cognitive engagement. Inf. Syst. Front. 2021, 25, 2197–2220. [Google Scholar] [CrossRef]
- Black, N.; Varaganum, M.; Hutchings, A. Relationship between patient reported experience (PREMs) and patient reported outcomes (PROMs) in elective surgery. BMJ Qual. Saf. 2014, 23, 534–542. [Google Scholar] [CrossRef]
- Greaves, F.; Ramirez-Cano, D.; Millett, C.; Darzi, A.; Donaldson, L. Use of sentiment analysis for capturing patient experience from free-text comments posted online. J. Med. Internet Res. 2013, 15, e2721. [Google Scholar] [CrossRef] [PubMed]
- Greaves, F.; Ramirez-Cano, D.; Millett, C.; Darzi, A.; Donaldson, L. Harnessing the cloud of patient experience: Using social media to detect poor quality healthcare. BMJ Qual. Saf. 2013, 22, 251–255. [Google Scholar] [CrossRef]
- Dyer, O. Most pregnancy related deaths in US are preventable, says CDC. BMJ Br. Med. J. 2019, 365, l2169. [Google Scholar] [CrossRef]
- Lamsal, R. Coronavirus (COVID-19) Tweets Dataset. IEEE Dataport 2020. [Google Scholar] [CrossRef]
- Collins, K.M.T.; Onwuegbuzie, A.J.; Jiao, Q.G. A mixed methods investigation of mixed methods sampling designs in social and health science research. J. Mix. Methods Res. 2007, 1, 267–294. [Google Scholar] [CrossRef]
- Coulter, A.; Fitzpatrick, R.; Cornwell, J. Measures of Patients’ Experience in Hospital: Purpose, Methods and Uses; King’s Fund: London, UK, 2009; pp. 7–9. [Google Scholar]
- Meyer, M.A. Mapping the patient journey across the continuum: Lessons learned from one patient’s experience. J. Patient Exp. 2019, 6, 103–107. [Google Scholar] [CrossRef] [PubMed]
- Selwood, A.; Senthuran, S.; Blakely, B.; Lane, P.; North, J.; Clay-Williams, R. Improving outcomes from high-risk surgery: A multimethod evaluation of a patient-centred advanced care planning intervention. BMJ Open 2017, 7, e014906. [Google Scholar] [CrossRef] [PubMed]
- Davis, K.; Schoenbaum, S.C.; Audet, A.-M. A 2020 vision of patient-centered primary care. J. Gen. Intern. Med. 2005, 20, 953–957. [Google Scholar] [CrossRef] [PubMed]
- Zinckernagel, L.; Schneekloth, N.; Zwisler, A.-D.O.; Ersbøll, A.K.; Rod, M.H.; Jensen, P.D.; Timm, H.; Holmberg, T. How to measure experiences of healthcare quality in Denmark among patients with heart disease? The development and psychometric evaluation of a patient-reported instrument. BMJ Open 2017, 7, e016234. [Google Scholar] [CrossRef]
- Gualandi, R.; Masella, C.; Viglione, D.; Tartaglini, D. Exploring the hospital patient journey: What does the patient experience? PLoS ONE 2019, 14, e0224899. [Google Scholar] [CrossRef]
- Schildmeijer, K.; Frykholm, O.; Kneck, A.; Ekstedt, M. Not a straight line—Patients’ experiences of prostate cancer and their journey through the healthcare system. Cancer Nurs. 2019, 42, E36–E43. [Google Scholar] [CrossRef] [PubMed]
- Deacon, K.S. Re-building life after ICU: A qualitative study of the patients’ perspective. Intensiv. Crit. Care Nurs. 2012, 28, 114–122. [Google Scholar] [CrossRef]
- Beattie, M.; Murphy, D.J.; Atherton, I.; Lauder, W. Instruments to measure patient experience of healthcare quality in hospitals: A systematic review. Syst. Rev. 2015, 4, 97. [Google Scholar] [CrossRef]
- Kinnear, N.; Herath, M.; Jolly, S.; Han, J.; Tran, M.; Parker, D.; O’Callaghan, M.; Hennessey, D.; Dobbins, C.; Sammour, T.; et al. Patient satisfaction in emergency general surgery: A prospective cross-sectional study. World J. Surg. 2020, 44, 2950–2958. [Google Scholar] [CrossRef]
- Ortega, S.V. Evaluation of Patient Experience Using Natural Language Processing Algorithms; The University of Texas at El Paso: El Paso, TX, USA, 2021. [Google Scholar]
- Weiss, J.; Sos, M.L.; Seidel, D.; Peifer, M.; Zander, T.; Heuckmann, J.M.; Ullrich, R.T.; Menon, R.; Maier, S.; Soltermann, A.; et al. Frequent and focal FGFR1 amplification associates with therapeutically tractable FGFR1 dependency in squamous cell lung cancer. Sci. Transl. Med. 2010, 2, 62ra93. [Google Scholar] [CrossRef] [PubMed]
- Schuttner, L.; Reddy, A.; Rosland, A.-M.; Nelson, K.; Wong, E.S. Association of the implementation of the patient-centered medical home with quality of life in patients with multimorbidity. J. Gen. Intern. Med. 2020, 35, 119–125. [Google Scholar] [CrossRef] [PubMed]
- Sum, G.; Ho, S.H.; Lim, Z.Z.B.; Chay, J.; Ginting, M.L.; Tsao, M.A.; Wong, C.H. Impact of a patient-centered medical home demonstration on quality of life and patient activation for older adults with complex needs in Singapore. BMC Geriatr. 2021, 21, 435. [Google Scholar] [CrossRef]
- Bretthauer, K.M.; Savin, S. Introduction to the Special Issue on Patient-Centric Healthcare Management in the Age of Analytics; Wiley Online Library: Hoboken, NJ, USA, 2018. [Google Scholar]
- Esmaeilzadeh, P.; Dharanikota, S.; Mirzaei, T. The role of patient engagement in patient-centric health information ex-change (HIE) initiatives: An empirical study in the United States. Inf. Technol. People 2021, 37, 521–552. [Google Scholar] [CrossRef]
- Press, I. Concern for the patient’s experience comes of age. Patient Exp. J. 2014, 1, 4–6. [Google Scholar] [CrossRef]
- Nawab, K.; Ramsey, G.; Schreiber, R. Natural language processing to extract meaningful information from patient expe-rience feedback. Appl. Clin. Inform. 2020, 11, 242–252. [Google Scholar]
- Wei, H.; Oehlert, J.K.; Hofler, L.; Hill, K.N. Connecting patients’ perceptions of nurses’ daily care actions, organizational human caring culture, and overall hospital rating in hospital consumer assessment of healthcare providers and systems surveys. JONA J. Nurs. Adm. 2020, 50, 474–480. [Google Scholar] [CrossRef]
- Hermann, H.; Trachsel, M.; Elger, B.S.; Biller-Andorno, N. Emotion and value in the evaluation of medical decision-making capacity: A narrative review of arguments. Front. Psychol. 2016, 7, 765. [Google Scholar] [CrossRef]
- Vinagre, M.H.; Neves, J. The influence of service quality and patients’ emotions on satisfaction. Int. J. Health Care Qual. Assur. 2008, 21, 87–103. [Google Scholar] [CrossRef]
- Steine, S.; Finset, A.; Laerum, E. A new, brief questionnaire (PEQ) developed in primary health care for measuring patients’ experience of interaction, emotion and consultation outcome. Fam. Pract. 2001, 18, 410–418. [Google Scholar] [CrossRef]
- Swallmeh, E.; Byers, V.; Arisha, A. Informing quality in emergency care: Understanding patient experiences. Int. J. Health Care Qual. Assur. 2018, 31, 704–717. [Google Scholar] [CrossRef] [PubMed]
- Boissy, A. Getting to patient-centered care in a post–COVID-19 digital world: A proposal for novel surveys, methodology, and patient experience maturity assessment. NEJM Catal. Innov. Care Deliv. 2020, 1, 4. [Google Scholar]
- Azimi, K.; Honaker, M.D.; Madathil, S.C.; Khasawneh, M.T. Post-Operative Infection Prediction and Risk Factor Analysis in Colorectal Surgery Using Data Mining Techniques: A Pilot Study. Surg. Infect. 2020, 21, 784–792. [Google Scholar] [CrossRef]
- Visconti, R.M.; Martiniello, L. Smart hospitals and patient-centered governance. Corp. Ownersh. Control. 2019, 16, 2. [Google Scholar] [CrossRef]
- Abualigah, L.; Alfar, H.E.; Shehab, M.; Hussein, A.M.A. Sentiment analysis in healthcare: A brief review. Recent Adv. NLP Case Arab. Lang. 2020, 5, 129–141. [Google Scholar]
- Annapurani, K.; Poovammal, E.; Ruvinga, C.; Venkat, I. Healthcare Data Analytics Using Business Intelligence Tool. In Machine Learning and Analytics in Healthcare Systems; CRC Press: Boca Raton, FL, USA, 2021; pp. 191–212. [Google Scholar]
- LaVela, S.L.; Gallan, A. Evaluation and measurement of patient experience. Patient Exp. J. 2014, 1, 28–36. [Google Scholar]
- Rastegar-Mojarad, M.; Ye, Z.; Wall, D.; Murali, N.; Lin, S. Collecting and analyzing patient experiences of health care from social media. JMIR Res. Protoc. 2015, 4, e78. [Google Scholar] [CrossRef]
- Hughes, T.M.; Merath, K.; Chen, Q.; Sun, S.; Palmer, E.; Idrees, J.J.; Okunrintemi, V.; Squires, M.; Beal, E.W.; Pawlik, T.M. Association of shared decision-making on patient-reported health outcomes and healthcare utilization. Am. J. Surg. 2018, 216, 7–12. [Google Scholar] [CrossRef]
- Beckman, H.B.; Markakis, K.M.; Suchman, A.L.; Frankel, R.M. The doctor-patient relationship and malpractice. Lessons Plaintiff Depos. 1994, 154, 1365–1370. [Google Scholar] [CrossRef]
- Bilimoria, K.Y.; Chung, J.W.; Minami, C.A.; Sohn, M.-W.; Pavey, E.S.; Holl, J.L.; Mello, M.M. Relationship between state malpractice environment and quality of health care in the United States. Jt. Comm. J. Qual. Patient Saf. 2017, 43, 241–250. [Google Scholar] [CrossRef]
- Charmel, P.A.; Frampton, S.B. Building the business case for patient-centered care: Patient-centered care has the potential to reduce adverse events, malpractice claims, and operating costs while improving market share. Healthc. Financ. Manag. 2008, 62, 80–86. [Google Scholar]
- Safran, D.G.; Montgomery, J.E.; Chang, H.; Murphy, J.; Rogers, W.H. Switching doctors: Predictors of voluntary disenrollment from a primary physician’s practice. J. Fam. Pract. 2001, 50, 130. [Google Scholar]
- Cochrane, B.S.; Hagins, M., Jr.; King, J.A.; Picciano, G.; McCafferty, M.M.; Nelson, B. Back to the future: Patient experience and the link to quality, safety, and financial performance. In Healthcare Management Forum; SAGE Publications Sage CA: Los Angeles, CA, USA, 2015; pp. 47–58. [Google Scholar]
- Lee, T.H. Financial versus non-financial incentives for improving patient experience. J. Patient Exp. 2015, 2, 4–6. [Google Scholar] [CrossRef]
- Chowdhary, K. Natural language processing. In Fundamentals of Artificial Intelligence; Springer: Berlin/Heidelberg, Germany, 2020; pp. 603–649. [Google Scholar]
- Hasan, M.R.; Maliha, M.; Arifuzzaman, M. Sentiment analysis with NLP on Twitter data. In Proceedings of the 2019 International Conference on Computer, Communication, Chemical, Materials and Electronic Engineering (IC4ME2), Rajshahi, Bangladesh, 11–12 July 2019; pp. 1–4. [Google Scholar]
- Hagen, L.; Uzuner, O.; Kotfila, C.; Harrison, T.M.; Lamanna, D. Understanding citizens’ direct policy suggestions to the federal government: A natural language processing and topic modeling approach. In Proceedings of the 2015 48th Hawaii International Conference on System Sciences, Washington, DC, USA, 5–8 January 2015; pp. 2134–2143. [Google Scholar]
- Gallagher, C.; Furey, E.; Curran, K. The application of sentiment analysis and text analytics to customer experience reviews to understand what customers are really saying. Int. J. Data Warehous. Min. (IJDWM) 2019, 15, 21–47. [Google Scholar] [CrossRef]
- Ranaei, S.; Suominen, A.; Porter, A.; Kässi, T. Application of Text-Analytics in Quantitative Study of Science and Technology; Springer Handbook of Science and Technology Indicators: Berlin/Heidelberg, Germany, 2019; pp. 957–982. [Google Scholar]
- Hirschberg, J.; Manning, C.D. Advances in natural language processing. Science 2015, 349, 261–266. [Google Scholar] [CrossRef]
- Kanakaraj, M.; Guddeti, R.M.R. Performance analysis of Ensemble methods on Twitter sentiment analysis using NLP techniques. In Proceedings of the 2015 IEEE 9th International Conference on Semantic Computing (IEEE ICSC 2015), Anaheim, CA, USA, 7–9 February 2015; pp. 169–170. [Google Scholar]
- Zhou, B.; Yang, G.; Shi, Z.; Ma, S. Natural language processing for smart healthcare. IEEE Rev. Biomed. Eng. 2022, 17, 4–18. [Google Scholar] [CrossRef]
- Althoff, T.; Clark, K.; Leskovec, J. Large-scale analysis of counseling conversations: An application of natural language processing to mental health. Trans. Assoc. Comput. Linguist. 2016, 4, 463–476. [Google Scholar] [CrossRef]
- Popowich, F. Using text mining and natural language processing for health care claims processing. ACM SIGKDD Explor. Newsl. 2005, 7, 59–66. [Google Scholar] [CrossRef]
- Carchiolo, V.; Longheu, A.; Reitano, G.; Zagarella, L. Medical prescription classification: A NLP-based approach. In Proceedings of the 2019 Federated Conference on Computer Science and Information Systems (FedCSIS), Leipzig, Germany, 1–4 September 2019; pp. 605–609. [Google Scholar]
- Braun, M.; Aslan, A.; Diesterhöft, T.O.; Greve, M.; Brendel, A.B.; Kolbe, L.M. Just What the Doctor Ordered–Towards Design Principles for NLP-Based Systems in Healthcare. In International Conference on Design Science Research in Information Systems and Technology; Springer: Berlin/Heidelberg, Germany, 2022; pp. 183–194. [Google Scholar]
- Abirami, A.M.; Askarunisa, A. Sentiment Analysis Model to Emphasize the Impact of Online Reviews in Healthcare Industry. Online Inf. Rev. 2017, 41, 471–486. [Google Scholar] [CrossRef]
- Sandhiya, R.; Boopika, A.M.; Akshatha, M.; Swetha, S.V.; Hariharan, N.M. A Review of Topic Modeling and Its Application. In Handbook of Intelligent Computing and Optimization for Sustainable Development; Wiley: Hoboken, NJ, USA, 2022; pp. 305–322. [Google Scholar]
- Syed, S.; Spruit, M. Selecting priors for latent Dirichlet allocation. In Proceedings of the 2018 IEEE 12th International Conference on Semantic Computing (ICSC), Laguna Hills, CA, USA, 31 January–2 February 2018; pp. 194–202. [Google Scholar]
- Hasan, M.; Rahman, A.; Karim, M.R.; Khan, M.S.I.; Islam, M.J. Normalized approach to find optimal number of topics in Latent Dirichlet Allocation (LDA). In Proceedings of International Conference on Trends in Computational and Cognitive Engineering: Proceedings of TCCE 2020; Springer: Berlin/Heidelberg, Germany, 2021; pp. 341–354. [Google Scholar]
- Gurdiel, L.P.; Mediano, J.M.; Quintero, J.A.C. A Comparison Study between Coherence and Perplexity for Determining the Number of Topics in Practitioners Interviews Analysis. 2021. Available online: https://repositorio.comillas.edu/xmlui/bitstream/handle/11531/67714/2021%20-%20Pinto%20et%20al.%20-%20A%20COMPARISON%20STUDY%20BETWEEN%20COHERECE%20AND%20PERPLEXITY.pdf?sequence=1 (accessed on 20 August 2024).
- Gross, A.; Murthy, D. Modeling virtual organizations with Latent Dirichlet Allocation: A case for natural language processing. Neural Netw. 2014, 58, 38–49. [Google Scholar] [CrossRef]
- Chary, M.; Parikh, S.; Manini, A.F.; Boyer, E.W.; Radeous, M. A review of natural language processing in medical education. West. J. Emerg. Med. 2019, 20, 78–86. [Google Scholar] [CrossRef]
- Harrison, C.J.; Sidey-Gibbons, C.J. Machine learning in medicine: A practical introduction to natural language processing. BMC Med. Res. Methodol. 2021, 21, 158. [Google Scholar] [CrossRef]
- Blei, D.M.; Ng, A.Y.; Jordan, M.I. Latent dirichlet allocation. J. Mach. Learn. Res. 2003, 3, 993–1022. [Google Scholar]
- Blei, D.M. Probabilistic topic models. Commun. ACM 2012, 55, 77–84. [Google Scholar] [CrossRef]
- Okon, E.; Rachakonda, V.; Hong, H.J.; Callison-Burch, C.; Lipoff, J.B. Natural language processing of Reddit data to evaluate dermatology patient experiences and therapeutics. J. Am. Acad. Dermatol. 2020, 83, 803–808. [Google Scholar] [CrossRef]
- Syed, S.; Spruit, M. Exploring symmetrical and asymmetrical Dirichlet priors for latent Dirichlet allocation. Int. J. Semant. Comput. 2018, 12, 399–423. [Google Scholar] [CrossRef]
- Wang, X.; McCallum, A. Topics over time: A non-markov continuous-time model of topical trends. In Proceedings of the 12th ACM SIGKDD International Conference on Knowledge Discovery and Data Mining, Philadelphia, PA, USA, 20–23 August 2006; pp. 424–433. [Google Scholar]
- Patra, B.G.; Sharma, M.M.; Vekaria, V.; Adekkanattu, P.; Patterson, O.V.; Glicksberg, B.; Lepow, L.A.; Ryu, E.; Biernacka, J.M.; Furmanchuk, A.; et al. Extracting social determinants of health from electronic health records using natural language processing: A systematic review. J. Am. Med. Inform. Assoc. 2021, 28, 2716–2727. [Google Scholar] [CrossRef]
- Li, I.; Pan, J.; Goldwasser, J.; Verma, N.; Wong, W.P.; Nuzumlalı, M.Y.; Rosand, B.; Li, Y.; Zhang, M.; Chang, D.; et al. Neural Natural Language Processing for unstructured data in electronic health records: A review. Comput. Sci. Rev. 2022, 46, 100511. [Google Scholar] [CrossRef]
- Xue, J.; Chen, J.; Chen, C.; Zheng, C.; Li, S.; Zhu, T. Public discourse and sentiment during the COVID 19 pandemic: Using Latent Dirichlet Allocation for topic modeling on Twitter. PLoS ONE 2020, 15, e0239441. [Google Scholar] [CrossRef]
- Chiu, C.-C.; Wu, C.-M.; Chien, T.-N.; Kao, L.-J.; Li, C.; Chu, C.-M. Integrating Structured and Unstructured EHR Data for Predicting Mortality by Machine Learning and Latent Dirichlet Allocation Method. Int. J. Environ. Res. Public Health 2023, 20, 4340. [Google Scholar] [CrossRef]
- Fairie, P.; Zhang, Z.; D’Souza, A.G.; Walsh, T.; Quan, H.; Santana, M.J. Categorising patient concerns using natural language processing techniques. BMJ Health Care Inf. 2021, 28. [Google Scholar] [CrossRef] [PubMed]
- Hao, H.; Zhang, K.; Wang, W.; Gao, G. A tale of two countries: International comparison of online doctor reviews between China and the United States. Int. J. Med. Inform. 2017, 99, 37–44. [Google Scholar] [CrossRef] [PubMed]
- Ji, X.; Wang, Y.; Ma, Y.; Hu, Z.; Man, S.; Zhang, Y.; Li, K.; Yang, J.; Zhu, J.; Zhang, J.; et al. Improvement of disease management and cost effectiveness in chinese patients with ankylosing spondylitis using a smart-phone management system: A prospective cohort study. BioMed Res. Int. 2019, 2019, 1–11. [Google Scholar] [CrossRef]
- Ao, Y.; Zhu, H.; Meng, F.; Wang, Y.; Ye, G.; Yang, L.; Dong, N.; Martek, I. The impact of social support on public anxiety amidst the COVID-19 pandemic in China. Int. J. Environ. Res. Public Health 2020, 17, 9097. [Google Scholar] [CrossRef]
- Kuang, D.; Choo, J.; Park, H. Nonnegative matrix factorization for interactive topic modeling and document clustering. In Partitional Clustering Algorithms; Springer: Berlin/Heidelberg, Germany, 2015; pp. 215–243. [Google Scholar]
- Angelov, D. Top2vec: Distributed representations of topics. arXiv 2020, arXiv:2008.09470. [Google Scholar]
- Grootendorst, M. BERTopic: Leveraging BERT and c-TF-IDF to create easily interpretable topics. Zenodo Version V0 2020, 9, 5281. [Google Scholar]
- Egger, R.; Yu, J. A topic modeling comparison between lda, nmf, top2vec, and bertopic to demystify twitter posts. Front. Sociol. 2022, 7, 886498. [Google Scholar] [CrossRef] [PubMed]
- Egger, R. Topic modelling: Modelling hidden semantic structures in textual data. In Applied Data Science in Tourism: Inter-Disciplinary Approaches, Methodologies, and Applications; Springer: Berlin/Heidelberg, Germany, 2022; pp. 375–403. [Google Scholar]
- Sánchez-Franco, M.J.; Rey-Moreno, M. Do travelers’ reviews depend on the destination? An analysis in coastal and urban peer-to-peer lodgings. Psychol Mark 2022, 39, 441–459. [Google Scholar] [CrossRef]
- Hendry, D.; Darari, F.; Nurfadillah, R.; Khanna, G.; Sun, M.; Condylis, P.C.; Taufik, N. Topic modeling for customer service chats. In Proceedings of the 2021 International Conference on Advanced Computer Science and Information Systems (ICACSIS), Virtual, 23–25 October 2021; pp. 1–6. [Google Scholar]
- Nasukawa, T.; Yi, J. Sentiment analysis: Capturing favorability using natural language processing. In Proceedings of the 2nd International Conference on Knowledge Capture, Pensacola, FL, USA, 23–25 October 2003; pp. 70–77. [Google Scholar]
- Rajput, A. Natural language processing, sentiment analysis, and clinical analytics. In Innovation in Health Informatics; Elsevier: Amsterdam, The Netherlands, 2020; pp. 79–97. [Google Scholar]
- Georgiou, D.; MacFarlane, A.; Russell-Rose, T. Extracting sentiment from healthcare survey data: An evaluation of sentiment analysis tools. In Proceedings of the 2015 Science and Information Conference (SAI), London, UK, 28–30 July 2015; pp. 352–361. [Google Scholar]
- Chintalapudi, N.; Battineni, G.; Di Canio, M.; Sagaro, G.G.; Amenta, F. Text mining with sentiment analysis on seafarers’ medical documents. Int. J. Inf. Manag. Data Insights 2021, 1, 100005. [Google Scholar] [CrossRef]
- Mouthami, K.; Devi, K.N.; Bhaskaran, V.M. Sentiment analysis and classification based on textual reviews. In Proceedings of the 2013 International Conference on Information Communication and Embedded Systems (ICICES), Chennai, Tamilnadu, 21–22 February 2013; pp. 271–276. [Google Scholar]
- Hutto, C.; Gilbert, E. Vader: A parsimonious rule-based model for sentiment analysis of social media text. Proc. Int. AAAI Conf. Web Soc. Media 2014, 8, 216–225. [Google Scholar] [CrossRef]
- Elbagir, S.; Yang, J. Twitter sentiment analysis using natural language toolkit and VADER sentiment. In Proceedings of the International Multiconference of Engineers and Computer Scientists, Hong Kong, China, 13–15 March 2019; p. 16. [Google Scholar]
- Kumar, A.; Srinivasan, K.; Cheng, W.-H.; Zomaya, A.Y. Hybrid context enriched deep learning model for fine-grained sentiment analysis in textual and visual semiotic modality social data. Inf. Process. Manag. 2020, 57, 102141. [Google Scholar] [CrossRef]
- Fernández-Gavilanes, M.; Álvarez-López, T.; Juncal-Martínez, J.; Costa-Montenegro, E.; González-Castaño, F.J. Unsuper-vised method for sentiment analysis in online texts. Expert. Syst. Appl. 2016, 58, 57–75. [Google Scholar] [CrossRef]
- Jagdale, R.S.; Shirsat, V.S.; Deshmukh, S.N. Sentiment analysis on product reviews using machine learning techniques. In Cognitive Informatics and Soft Computing; Springer: Berlin/Heidelberg, Germany, 2019; pp. 639–647. [Google Scholar]
- Asghar, M.Z.; Ahmad, S.; Qasim, M.; Zahra, S.R.; Kundi, F.M. SentiHealth: Creating health-related sentiment lexicon using hybrid approach. SpringerPlus 2016, 5, 1139. [Google Scholar] [CrossRef] [PubMed]
- Ramírez-Tinoco, F.J.; Alor-Hernández, G.; Sánchez-Cervantes, J.L.; Salas-Zárate, M.D.P.; Valencia-García, R. Use of sentiment analysis techniques in healthcare domain. In Current Trends in Semantic Web Technologies: Theory and Practice; Springer: Berlin/Heidelberg, Germany, 2019; pp. 189–212. [Google Scholar]
- Greaves, F.; Laverty, A.A.; Cano, D.R.; Moilanen, K.; Pulman, S.; Darzi, A.; Millett, C. Tweets about hospital quality: A mixed methods study. BMJ Qual. Saf. 2014, 23, 838–846. [Google Scholar] [CrossRef] [PubMed]
- Hawkins, J.B.; Brownstein, J.S.; Tuli, G.; Runels, T.; Broecker, K.; Nsoesie, E.O.; McIver, D.J.; Rozenblum, R.; Wright, A.; Bourgeois, F.T.; et al. Measuring patient-perceived quality of care in US hospitals using Twitter. BMJ Qual. Saf. 2016, 25, 404–413. [Google Scholar] [CrossRef]
- Crannell, W.C.; Clark, E.; Jones, C.; James, T.A.; Moore, J. A pattern-matched Twitter analysis of US cancer-patient sentiments. J. Surg. Res. 2016, 206, 536–542. [Google Scholar] [CrossRef]
- Rodrigues, R.G.; das Dores, R.M.; Camilo-Junior, C.G.; Rosa, T.C. SentiHealth-Cancer: A sentiment analysis tool to help detecting mood of patients in online social networks. Int. J. Med. Inform. 2016, 85, 80–95. [Google Scholar] [CrossRef]
- Ahuja, S.; Dubey, G. Clustering and sentiment analysis on Twitter data. In Proceedings of the 2017 2nd International Conference on Telecommunication and Networks (TEL-NET), Noida, India, 10–11 August 2017; pp. 1–5. [Google Scholar]
- Cobos, R.; Jurado, F.; Blazquez-Herranz, A. A content analysis system that supports sentiment analysis for subjectivity and polarity detection in online courses. IEEE Rev. Iberoam. Tecnol. Aprendiz. 2019, 14, 177–187. [Google Scholar] [CrossRef]
- Gujjar, J.P.; Kumar, H.P. Sentiment analysis: Textblob for decision making. Int. J. Sci. Res. Eng. Trends 2021, 7, 1097–1099. [Google Scholar]
- Montoyo, A.; Martínez-Barco, P.; Balahur, A. Subjectivity and sentiment analysis: An overview of the current state of the area and envisaged developments. Decis. Support Syst. 2012, 53, 675–679. [Google Scholar] [CrossRef]
- Lee, H.; Vlaev, I.; King, D.; Mayer, E.; Darzi, A.; Dolan, P. Subjective well-being and the measurement of quality in healthcare. Soc. Sci. Med. 2013, 99, 27–34. [Google Scholar] [CrossRef] [PubMed]
- Ahmed, H.; Traore, I.; Saad, S. Detection of online fake news using n-gram analysis and machine learning techniques. In Proceedings of the Intelligent, Secure, and Dependable Systems in Distributed and Cloud Environments: First International Conference, ISDDC 2017, Vancouver, BC, Canada, 26–28 October 2017; Proceedings 1. Springer: Berlin/Heidelberg, Germany, 2017; pp. 127–138. [Google Scholar]
- Lavanya, P.; Sasikala, E. Deep learning techniques on text classification using Natural language processing (NLP) in social healthcare network: A comprehensive survey. In Proceedings of the 2021 3rd International Conference on Signal Processing and Communication (ICPSC), Coimbatore, India, 13–14 May 2021; pp. 603–609. [Google Scholar]
- Sidorov, G.; Velasquez, F.; Stamatatos, E.; Gelbukh, A.; Chanona-Hernández, L. Syntactic N-grams as machine learning features for natural language processing. Expert Syst. Appl. 2014, 41, 853–860. [Google Scholar] [CrossRef]
- Torres-Silva, E.A.; Rúa, S.; Giraldo-Forero, A.F.; Durango, M.C.; Flórez-Arango, J.F.; Orozco-Duque, A. Classification of Severe Maternal Morbidity from Electronic Health Records Written in Spanish Using Natural Language Processing. Appl. Sci. 2023, 13, 10725. [Google Scholar] [CrossRef]
- Zhong, Q.Y.; Mittal, L.P.; Nathan, M.D.; Brown, K.M.; Knudson González, D.; Cai, T.; Finan, S.; Gelaye, B.; Avillach, P.; Smoller, J.W.; et al. Use of natural language processing in electronic medical records to identify pregnant women with suicidal behavior: Towards a solution to the complex classification problem. Eur. J. Epidemiol. 2019, 34, 153–162. [Google Scholar] [CrossRef]
- Bartal, A.; Jagodnik, K.M.; Chan, S.J.; Babu, M.S.; Dekel, S. Identifying women with postdelivery posttraumatic stress disorder using natural language processing of personal childbirth narratives. Am. J. Obstet. Gynecol. MFM 2023, 5, 100834. [Google Scholar] [CrossRef] [PubMed]
- Clapp, M.A.; Kim, E.; James, K.E.; Perlis, R.H.; Kaimal, A.J.; McCoy, T.H., Jr. Natural language processing of admission notes to predict severe maternal morbidity during the delivery encounter. Am. J. Obstet. Gynecol. 2022, 227, 511-e1. [Google Scholar] [CrossRef]
- Gingrey, J.P. Maternal Mortality: A US Public Health Crisis, American Public Health Association: Washington, DC, USA, 2020.
- Hoyert, D.L. Maternal Mortality Rates in the United States, 2020. 2022. Available online: https://stacks.cdc.gov/view/cdc/152992 (accessed on 20 August 2024).
- Thoma, M.E.; Declercq, E.R. All-cause maternal mortality in the US before vs during the COVID-19 pandemic. JAMA Netw. Open 2022, 5, e2219133. [Google Scholar] [CrossRef]
- Chuang, J.; Manning, C.D.; Heer, J. Termite: Visualization techniques for assessing textual topic models. In Proceedings of the International Working Conference on Advanced Visual Interfaces, Naples, Italy, 22–25 May 2012; pp. 74–77. [Google Scholar]
- Sievert, C.; Shirley, K. LDAvis: A method for visualizing and interpreting topics. In Proceedings of the Workshop on Interactive Language Learning, Visualization, and Interfaces, Baltimore, MD, USA, 27 June 2014; pp. 63–70. [Google Scholar]
Disclaimer/Publisher’s Note: The statements, opinions and data contained in all publications are solely those of the individual author(s) and contributor(s) and not of MDPI and/or the editor(s). MDPI and/or the editor(s) disclaim responsibility for any injury to people or property resulting from any ideas, methods, instructions or products referred to in the content. |
© 2024 by the authors. Licensee MDPI, Basel, Switzerland. This article is an open access article distributed under the terms and conditions of the Creative Commons Attribution (CC BY) license (https://creativecommons.org/licenses/by/4.0/).