
Thermography, Temperature, Pressure Force Distribution and Physical Activity in Diabetic Foot: A Systematic Review
 ,
,  ,
,
Abstract
Featured Application
Abstract
1. Introduction
- The presence of diabetic neuropathy and its associated complications in the foot;
- The magnitude of the forces exerted upon the foot;
- The distance walked that results in the onset of tissue inflammation.
2. Materials and Methods
2.1. Protocol and Identification of the Problem
2.2. Research Question
2.3. Literature Search Strategy
2.4. Eligibility and Selection Criteria
2.5. Data Collection
2.6. Assessment of Study Methodology and Quality
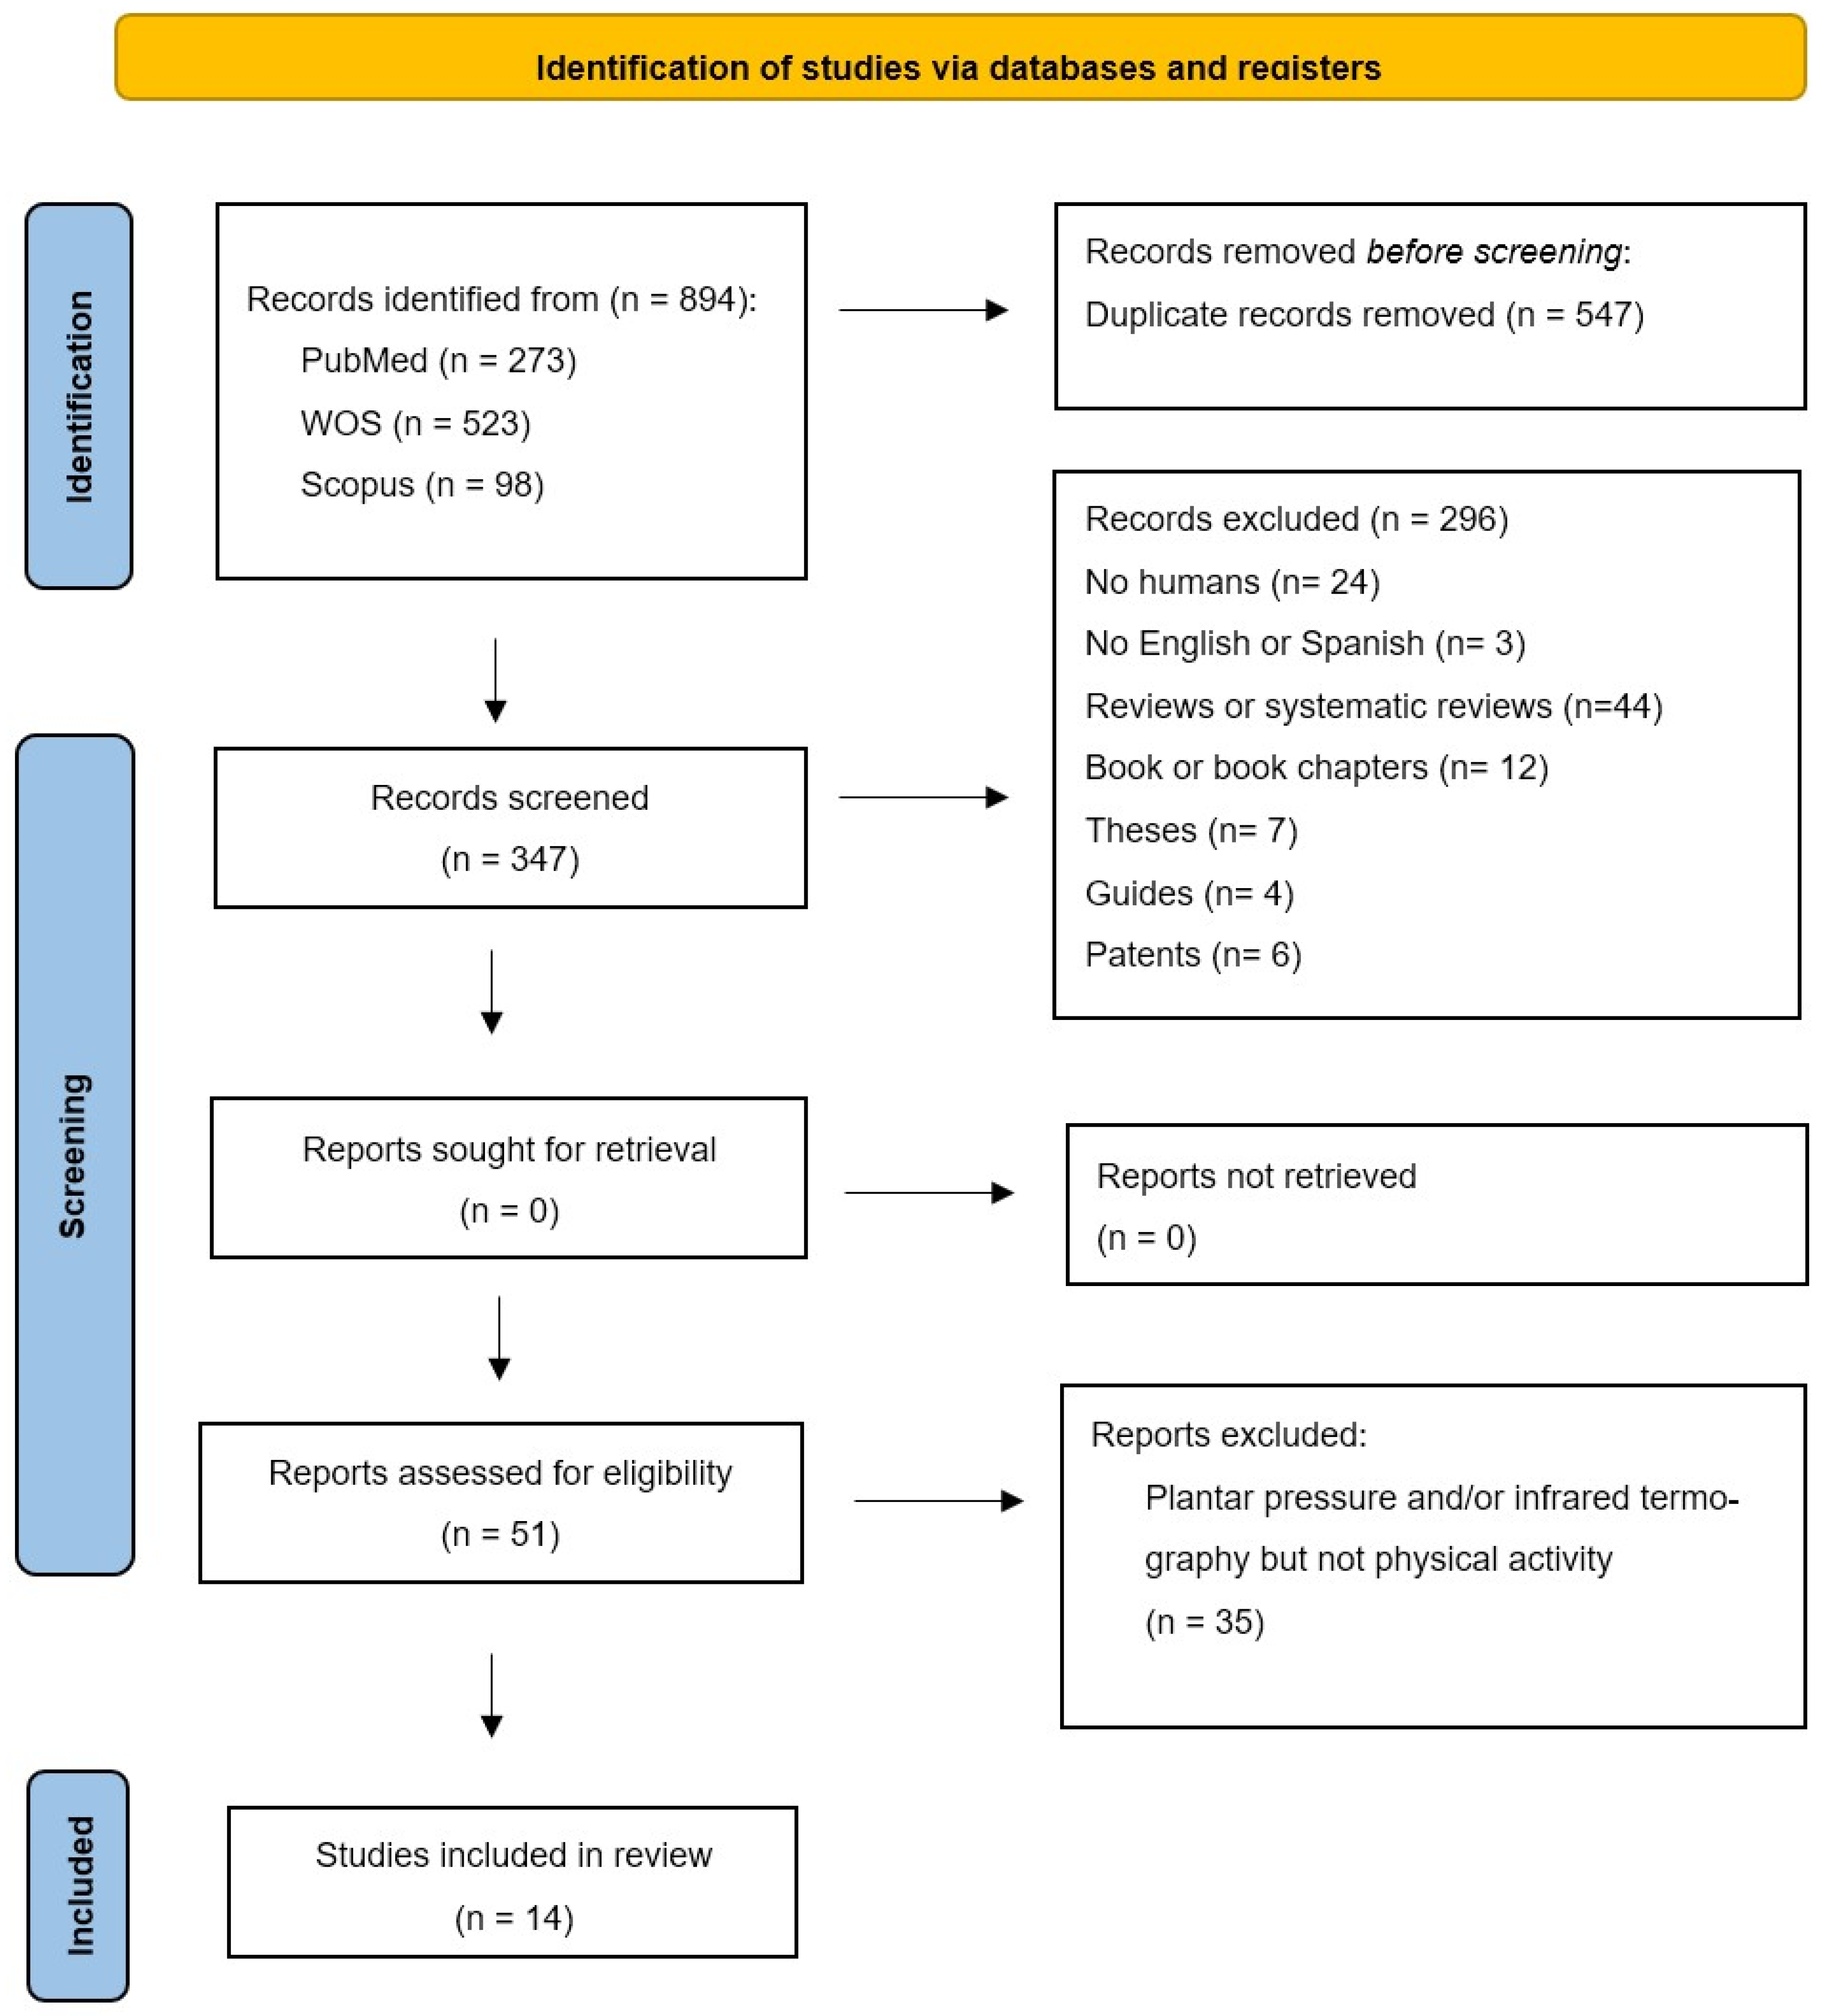
3. Results
4. Discussion
Limitations and Future Research Lines
5. Conclusions
Author Contributions
Funding
Institutional Review Board Statement
Informed Consent Statement
Data Availability Statement
Conflicts of Interest
References
- Monteiro-Soares, M.; Hamilton, E.J.; Russell, D.A.; Srisawasdi, G.; Boyko, E.J.; Mills, J.L.; Jeffcoate, W.; Game, F. Guidelines on the classification of foot ulcers in people with diabetes (IWGDF 2023 update). Diabetes Metab. Res. Rev. 2024, 40, e3648. [Google Scholar] [CrossRef] [PubMed]
- GBD 2021 Diabetes Collaborators. Global, regional, and national burden of diabetes from 1990 to 2021, with projections of prevalence to 2050: A systematic analysis for the Global Burden of Disease Study 2021. Lancet Lond. Engl. 2023, 402, 203–234. [Google Scholar] [CrossRef] [PubMed]
- Fitridge, R.; Chuter, V.; Mills, J.; Hinchliffe, R.; Azuma, N.; Behrendt, C.; Boyko, E.J.; Conte, M.S.; Humphries, M.; Kirksey, L.; et al. The intersocietal IWGDF, ESVS, SVS guidelines on peripheral artery disease in people with diabetes and a foot ulcer. Diabetes Metab. Res. Rev. 2024, 40, e3686. [Google Scholar] [CrossRef] [PubMed]
- Atmaca, A.; Ketenci, A.; Sahin, I.; Sengun, I.S.; Oner, R.I.; Tilki, H.E.; Adas, M.; Soyleli, H.; Demir, T. Expert opinion on screening, diagnosis and management of diabetic peripheral neuropathy: A multidisciplinary approach. Front. Endocrinol. 2024, 15, 1380929. [Google Scholar] [CrossRef] [PubMed]
- Gallagher, K.A.; Mills, J.L.; Armstrong, D.G.; Conte, M.S.; Kirsner, R.S.; Minc, S.D.; Plutzky, J.; Southerland, K.W.; Tomic-Canic, M.; on behalf of the American Heart Association Council on Peripheral Vascular Disease; et al. Current Status and Principles for the Treatment and Prevention of Diabetic Foot Ulcers in the Cardiovascular Patient Population: A Scientific Statement from the American Heart Association. Circulation 2024, 149, e232–e253. [Google Scholar] [CrossRef]
- Brand, P.W. Tenderizing the foot. Foot Ankle Int. 2003, 24, 457–461. [Google Scholar] [CrossRef]
- Lavery, L.A.; Armstrong, D.G.; Wunderlich, R.P.; Tredwell, J.; Boulton, A.J. Predictive value of foot pressure assessment as part of a population-based diabetes disease management program. Diabetes Care 2003, 26, 1069–1073. [Google Scholar] [CrossRef]
- Yavuz, M. American Society of Biomechanics Clinical Biomechanics Award 2012: Plantar shear stress distributions in diabetic patients with and without neuropathy. Clin. Biomech. 2014, 29, 223–229. [Google Scholar] [CrossRef]
- Yavuz, M.; Botek, G.; Davis, B.L. Plantar shear stress distributions: Comparing actual and predicted frictional forces at the foot–ground interface. J. Biomech. 2007, 40, 3045–3049. [Google Scholar] [CrossRef]
- Macdonald, A.; Petrova, N.; Ainarkar, S.; Allen, J.; Plassmann, P.; Whittam, A.; Bevans, J.; Ring, F.; Kluwe, B.; Simpson, R.; et al. Thermal symmetry of healthy feet: A precursor to a thermal study of diabetic feet prior to skin breakdown. Physiol. Meas. 2016, 38, 33–44. [Google Scholar] [CrossRef]
- Hernández-Contreras, D.; Peregrina-Barreto, H.; Rangel-Magdaleno, J.; González-Bernal, J.A.; Altamirano-Robles, L. A quantitative index for classification of plantar thermal changes in the diabetic foot. Infrared Phys. Technol. 2017, 81, 242–249. [Google Scholar] [CrossRef]
- Armstrong, D.G.; Holtz-Neiderer, K.; Wendel, C.; Mohler, M.J.; Kimbriel, H.R.; Lavery, L.A. Skin temperature monitoring reduces the risk for diabetic foot ulceration in high-risk patients. Am. J. Med. 2007, 120, 1042–1046. [Google Scholar] [CrossRef] [PubMed]
- Thakku Sivakumar, D.; Murray, B.; Moore, Z.; Patton, D.; O’Connor, T.; Avsar, P. Can thermography predict diabetic foot ulcer risk in patients with diabetes mellitus? A systematic review. J. Tissue Viability 2024. [CrossRef]
- Aune, D.; Norat, T.; Leitzmann, M.; Tonstad, S.; Vatten, L.J. Physical activity and the risk of type 2 diabetes: A systematic review and dose-response meta-analysis. Eur. J. Epidemiol. 2015, 30, 529–542. [Google Scholar] [CrossRef] [PubMed]
- Crawford, F.; Nicolson, D.J.; Amanna, A.E.; Smith, M. Reliability of the evidence to guide decision-making in foot ulcer prevention in diabetes: An overview of systematic reviews. BMC Med. Res. Methodol. 2022, 22, 274. [Google Scholar] [CrossRef] [PubMed]
- Rietz, M.; Lehr, A.; Mino, E.; Lang, A.; Szczerba, E.; Schiemann, T.; Herder, C.; Saatmann, N.; Geidl, W.; Barbaresko, J.; et al. Physical Activity and Risk of Major Diabetes-Related Complications in Individuals with Diabetes: A Systematic Review and Meta-Analysis of Observational Studies. Diabetes Care 2022, 45, 3101–3111. [Google Scholar] [CrossRef]
- Lung, C.W.; Wu, F.L.; Liao, F.; Pu, F.; Fan, Y.; Jan, Y.K. Emerging technologies for the prevention and management of diabetic foot ulcers. J. Tissue Viability 2020, 29, 61–68. [Google Scholar] [CrossRef]
- Bus, S.A.; Sacco, I.C.N.; Monteiro-Soares, M.; Raspovic, A.; Paton, J.; Rasmussen, A.; Lavery, L.A.; van Netten, J.J. Guidelines on the prevention of foot ulcers in persons with diabetes (IWGDF 2023 up-date). Diabetes Metab. Res. Rev. 2024, 40, e3651. [Google Scholar] [CrossRef]
- Jayedi, A.; Zargar, M.S.; Emadi, A.; Aune, D. Walking speed and the risk of type 2 diabetes: A systematic review and meta-analysis. Br. J. Sports Med. 2024, 58, 334–342. [Google Scholar] [CrossRef]
- Hall, M.; Shurr, D.G.; Zimmerman, M.B.; Saltzman, C.L. Plantar foot surface temperatures with use of insoles. Iowa Orthop. J. 2004, 24, 72–75. [Google Scholar]
- Burnfield, J.M.; Few, C.D.; Mohamed, O.S.; Perry, J. The influence of walking speed and footwear on plantar pressures in older adults. Clin. Biomech. 2004, 19, 78–84. [Google Scholar] [CrossRef] [PubMed]
- Weatherall, T.; Avsar, P.; Nugent, L.; Moore, Z.; McDermott, J.H.; Sreenan, S.; Wilson, H.; McEvoy, N.L.; Derwin, R.; Chadwick, P.; et al. The impact of machine learning on the prediction of diabetic foot ulcers—A systematic review. J. Tissue Viability 2024. [CrossRef] [PubMed]
- Page, M.J.; McKenzie, J.E.; Bossuyt, P.M.; Boutron, I.; Hoffmann, T.C.; Mulrow, C.D.; Moher, D.; Shamseer, L.; Tetzlaff, J.; Akl, E.A.; et al. PRISMA 2020 statement: An updated guide for the publication of systematic reviews. Span. J. Cardiol. 2021, 74, 790–799. [Google Scholar] [CrossRef]
- Verhagen, A.P.; De Vet, H.C.; De Bie, R.A.; Kessels, A.G.; Boers, M.; Bouter, L.M.; Knipschild, P.G. The Deplphilist: A criteria list for quality assessment of randomized clinical trials for conducting systematic reviews developed by Delphi consensus. J. Clin. Epidemiol. 1998, 51, 1235–1241. [Google Scholar] [CrossRef]
- Albanese, E.; Bütikofer, L.; Armijo-Olivo, S.; Ha, C.; Egger, M. Construct validity of the Physiotherapy Evidence Database (PEDro) quality scale for randomized trials: Item response theory and factor analyses. Res. Synth. Methods 2020, 11, 227–236. [Google Scholar] [CrossRef]
- Escala PEDro—PEDro. Available online: https://pedro.org.au/spanish/resources/pedro-scale/ (accessed on 12 April 2023).
- Di Benedetto, M.; Huston, C.W.; Sharp, M.W.; Jones, B. Regional hypothermia in response to minor injury. Am. J. Phys. Med. Rehabil. 1996, 75, 270–277. [Google Scholar] [CrossRef]
- Di Benedetto, M.; Yoshida, M.; Sharp, M.; Jones, B. Foot evaluation by infrared imaging. Mil. Med. 2002, 167, 384–392. [Google Scholar] [CrossRef]
- Cuaderes, E.; DeShea, L.; Lamb, W.L. Weight-Bearing Exercise and Foot Health in Native Americans. Care Manag. J. 2014, 15, 184–195. [Google Scholar] [CrossRef]
- Maluf, K.S.; Morley, R.E., Jr.; Richter, E.J.; Klaesner, J.W.; Mueller, M.J. Monitoring in-shoe plantar pressures, temperature, and humidity: Reliability and validity of measures from a portable device. Arch. Phys. Med. Rehabil. 2001, 82, 1119–1127. [Google Scholar] [CrossRef]
- Reddy, P.N.; Cooper, G.; Weightman, A.; Hodson-Tole, E.; Reeves, N.D. Walking cadence affects rate of plantar foot temperature change but not final temperature in younger and older adults. Gait Posture 2017, 52, 272–279. [Google Scholar] [CrossRef]
- Li, P.L.; Yick, K.L.; Yip, J.; Ng, S.P. Influence of Upper Footwear Material Properties on Foot Skin Temperature, Humidity and Perceived Comfort of Older Individuals. Int. J. Environ. Res. Public Health 2022, 19, 10861. [Google Scholar] [CrossRef] [PubMed]
- Nemati, H.; Naemi, R. An Analytical Model to Predict Foot Sole Temperature: Implications to Insole Design for Physical Activity in Sport and Exercise. Appl. Sci. 2022, 12, 6806. [Google Scholar] [CrossRef]
- Niemann, U.; Spiliopoulou, M.; Malanowski, J.; Kellersmann, J.; Szczepanski, T.; Klose, S.; Dedonaki, E.; Walter, I.; Ming, A.; Mertens, P.R. Plantar temperatures in stance position: Comparative study with healthy volunteers and diabetes patients diagnosed with sensoric neuropathy. EBioMedicine 2020, 54, 102712. [Google Scholar] [CrossRef] [PubMed]
- Carbonell, L.; Quesada, J.I.P.; Retorta, P.; Benimeli, M.; M, R.; De Anda, C.O.; Palmer, R.S.; Macián-Romero, C. Thermographic quantitative variables for diabetic foot assessment: Preliminary results. Comput. Methods Biomech. Biomed. Eng. Imaging Vis. 2018, 7, 660–666. [Google Scholar] [CrossRef]
- Yavuz, M.; Brem, R.W.; Davis, B.L.; Patel, J.; Osbourne, A.; Matassini, M.R.; Wood, D.A.; Nwokolo, I.O. Temperature as a predictive tool for planting triaxial loading. J. Biomech. 2014, 47, 3767–3770. [Google Scholar] [CrossRef]
- Priego Quesada, J.I.P.; Gil-Calvo, M.; Jimenez-Perez, I.; Lucas-Cuevas, Á.G.; Pérez-Soriano, P. Relationship between foot eversion and thermographic foot skin temperature after running. Appl. Opt. 2017, 56, 5559–5565. [Google Scholar] [CrossRef]
- Catalá-Vilaplana, I.; García-Domínguez, E.; Aparicio, I.; Ortega-Benavent, N.; Marzano Felisatti, J.M.; Sanchis-Sanchis, R. Effect of unstable sports footwear on acceleration impacts and plantar surface temperature during walking: A pilot study. Retos 2023, 49, 1004–1010. [Google Scholar] [CrossRef]
- Perren, S.; Formosa, C.; Camilleri, L.; Chockalingam, N.; Gatt, A. The Thermo-Pressure Concept: A New Model in Diabetic Foot Risk Stratification. Appl. Sci. 2021, 11, 7473. [Google Scholar] [CrossRef]
- Jimenez, I.; Gil, M.; Salvador, R.; de Anda, R.M.C.O.; Pérez, P.; Priego, J.I. Footwear outsole temperature may be more related to plantar pressure during a prolonged run than foot temperature. Physiol. Meas. 2021, 42, 074004. [Google Scholar] [CrossRef]
- Schaper, N.C.; van Netten, J.J.; Apelqvist, J.; Bus, S.A.; Fitridge, R.; Game, F.; Monteiro-Soares, M.; Senneville, E.; the IWGDF Editorial Board. Practical guidelines on the prevention and management of diabetes-related foot disease (IWGDF 2023 update). Diabetes Metab. Res. Rev. 2024, 40, e3657. [Google Scholar] [CrossRef]
- Haug, C.J.; Drazen, J.M. Artificial Intelligence and Machine Learning in Clinical Medicine, 2023. N. Engl. J. Med. 2023, 388, 1201–1208. [Google Scholar] [CrossRef] [PubMed]
- Guan, H.; Wang, Y.; Niu, P.; Zhang, Y.; Zhang, Y.; Miao, R.; Fang, X.; Yin, R.; Zhao, S.; Liu, J.; et al. The role of machine learning in advancing diabetic foot: A review. Front. Endocrinol. 2024, 15, 1325434. [Google Scholar] [CrossRef] [PubMed]

| PICO Format | |
|---|---|
| P (patient) | Healthy or diabetic subjects |
| I (intervention) | Measure plantar pressure and temperature and physical activity |
| C (control) | Healthy or diabetic patients |
| O (outcomes) | Changes in plantar temperature and pressure cause different plantar skin reactions during daily physical activity. |
| Inclusion and Source | Random Assignment | Hidden Assignment | Baseline Comparability | Blinded Subjects | Blinded Therapists | Blinded Raters | Results above 85% | Analysis by “Intention to Treat” | Statiscal Comparisons between Groups | Measurement and Variability Data | Score | |
|---|---|---|---|---|---|---|---|---|---|---|---|---|
| Di Benetto et al., 1996 [27] | ✓ | ✓ | ✓ | ✓ | ✓ | ✗ | ✓ | ✓ | ✓ | ✓ | ✓ | 9 |
| Di Benedetto et al., 2002 [28] | ✓ | ✓ | ✓ | ✓ | ✓ | ✗ | ✓ | ✓ | ✓ | ✓ | ✓ | 9 |
| Cuaderes et al., 2014 [29] | ✓ | ✗ | ✗ | ✓ | ✗ | ✗ | ✗ | ✓ | ✓ | ✓ | ✓ | 5 |
| Maluf et al., 2001 [30] | ✓ | ✗ | ✗ | ✓ | ✗ | ✗ | ✗ | ✓ | ✓ | ✓ | ✓ | 5 |
| Reddy et al., 2017 [31] | ✓ | ✓ | ✗ | ✓ | ✗ | ✗ | ✗ | ✓ | ✓ | ✓ | ✓ | 6 |
| Li et al., 2022 [32] | ✓ | ✓ | ✗ | ✓ | ✗ | ✗ | ✗ | ✓ | ✓ | ✓ | ✓ | 6 |
| Nemati et al., 2022 [33] | ✓ | ✓ | ✗ | ✓ | ✗ | ✗ | ✗ | ✓ | ✓ | ✓ | ✓ | 6 |
| Niemann et al., 2020 [34] | ✓ | ✓ | ✗ | ✓ | ✗ | ✗ | ✗ | ✓ | ✓ | ✓ | ✓ | 6 |
| Cabonell et al., 2019 [35] | ✓ | ✓ | ✗ | ✓ | ✗ | ✗ | ✗ | ✓ | ✓ | ✓ | ✓ | 6 |
| Yavuz et al., 2014 [36] | ✓ | ✓ | ✗ | ✓ | ✗ | ✗ | ✓ | ✓ | ✓ | ✓ | ✓ | 7 |
| Priego Quesada et al., 2017 [37] | ✓ | ✓ | ✗ | ✓ | ✗ | ✗ | ✗ | ✓ | ✓ | ✓ | ✓ | 6 |
| CataláVilaplana et al., 2023 [38] | ✓ | ✓ | ✗ | ✓ | ✗ | ✗ | ✗ | ✓ | ✓ | ✓ | ✓ | 6 |
| Perren et al., 2021 [39] | ✓ | ✓ | ✗ | ✓ | ✗ | ✗ | ✗ | ✓ | ✓ | ✓ | ✓ | 6 |
| Jimenez et al., 2021 [40] | ✓ | ✗ | ✗ | ✓ | ✗ | ✗ | ✗ | ✓ | ✓ | ✓ | ✓ | 5 |
| Author (Year) | Aim | Participants/Methodology | Intervention | Results |
|---|---|---|---|---|
| Di Benedetto et al. [27] (1996) | To examine the regional effects of hypothermia in response to minor injuries. | A total of 1000 new male army recruits, aged between 17 and 21 years old, were divided into four groups. Group 1 comprised individuals with unilateral stress fractures and regional hypothermia, group 2 with unilateral stress fractures without regional hypothermia, group 3 with bilateral stress fractures without hypothermia and group 4 (controls) without musculoskeletal discomfort. AGEMA 870 thermographs were conducted. | Infrared imaging was conducted prior to and following the training period. In the event of pain and suspected stress fracture, a bone scan was conducted. | The sensitivity of the thermograms for detecting anomalies was high, but their specificity for basic diagnosis was low. It is possible that pain or injury to the lower extremities could cause an acute hypothermic response. However, hypothermia was not observed in recruits in the absence of significant pain. It can be hypothesised that therapeutic or self-imposed immobilisation could lead to hypothermia. |
| Di Benedetto et al. [28] (2002) | Thermography should be employed as a diagnostic tool in cases of stress fractures that occur during military physical training. | New male army recruits aged 18 to 22 years, divided into three groups of 30 soldiers each. Group 1 (subjects with stress fractures), Group 2 (subjects with neuromuscular system problems but no fractures) and Group 3 (control subjects). AGEMA 870 thermographs were conducted using CATSE software. | Infrared images were obtained and plantar thermograms were analysed prior to the commencement of basic training, with subsequent assessments conducted whenever a subject exhibited neuromuscular or skeletal discomfort. In the event of suspected stress fracture, a bone scan was conducted. | The mean temperature was found to be 6 °C higher in cases of metatarsal stress fractures. The presence of hot spots was noted even in the absence of any discernible discomfort. Moreover, the aforementioned hot spots did not reappear in subsequent thermograms as the feet became acclimated to the novel stress. The incidence of stress fractures, particularly affecting the metatarsals, manifested in the third week as the intensity and duration of training increased. The aforementioned hot spots dissipated as the injuries underwent a process of healing. A correlation of 66% was observed between pain, bone scan results and the findings of thermograms. Soft tissue injuries manifested in regions exhibiting higher temperatures than those affected by bone injuries. |
| Cuaderes et al. [29] (2014) | To assess diabetic sensory neuropathy and the plantar characteristics of pressure and temperature, among others, in adults after performing moderate-intensity weight-bearing activities. | A convenience sample of 148 individuals with diabetes was recruited for this study. Of these, 57 were athletes and 28 were non-athletes. The remaining 63 individuals were non-athletic and did not participate in sports. The gender distribution within each group was as follows: 57 female athletes, 36 male athletes, 27 female non-athletes, and 28 male non-athletes. The data set comprised measurements of plantar skin hardness (using a hand-held durometer), pressure in the sports shoes (scan in-shoe pressure) and plantar temperature (using an infrared dermal thermometer). | The volunteers were instructed to walk 30 paces at a self-selected pace. Following the completion of the test, data pertaining to temperature and plantar pressure were duly recorded. | The plantar pressure was observed to be higher in athletes, particularly women. The data indicated that the values were higher, particularly in the right midfoot locations (exercisers 1.79 ± 0.65; non-exercisers 1.61 ± 0.51, p = 0.03) and the region of the fourth and fifth toes of the left foot (exercisers 2.41 ± 1.51; non-exercisers 1.93 ± 1.13, p = 0.02). A comparison of the mean values for the two groups revealed that the left fourth metatarsal head exhibited a lower mean for the exercisers (2.64 ± 0.90) than for the non-exercisers (3.04 ± 1.47). A greater temperature gradient was observed in the plantar surface of the first metatarsal head in the athletes (exercisers 1.66 ± 1.31 and non-exercisers 1.20 ± 1.20, p = 0.02). The sole significant linear correlation between weight-bearing physical activity and plantar pressure was identified at the second metatarsal of the right head (r = 0.237, p = 0.02) and the third metatarsal of the head (r = 0.264, p = 0.01). |
| Maluf et al. [30] (2001) | To validate a portable electronic device used to observe plantar pressures and temperatures, as well as the humidity of the foot inside shoes during prolonged activity. | Four healthy participants were equipped with shoe-mounted sensors to monitor pressure, humidity, and temperature. The data for pressure were collected in an uncontrolled outdoor environment, while the data for step count were gathered in an inner level walkaway and the data for humidity and temperature were obtained from a closed environmental control chamber. | The data were collected during a series of activities, including sitting down and rising from a chair, bending down to retrieve an object weighing 6 kg from a shelf at a height above the shoulders, traversing the stairs, walking on a level concrete surface, performing hip strategy walks and a pivot walk. | The combination of increased pressure, temperature and moisture inside the shoe could be a contributory factor in the development of plantar tissue injury. The inability of the researchers to identify individuals at risk of ulceration based on a predetermined pressure threshold may be attributed to the activity-related variations in foot pressure. It seems probable that the cumulative stress on the plantar tissues differed considerably between individuals, reflecting the variations in the quantity and nature of their daily activities. The environmental conditions within the shoe may influence the response of the plantar tissues to mechanical stress. |
| Reddy et al. [31] (2017) | To examine the relationship between foot temperature and walking cadence and to determine how this affects the vertical pressures exerted on the foot. | Eighteen healthy volunteers were recruited for the study, divided into two age groups: one between 30 and 40 years old and the other over 40 years old. The insoles were constructed using canvas shoes (mod. 246,033 Slazenger) and incorporated temperature sensors (TMP35) in direct contact with the foot, along with a sock and pressure system (F-Scan, Model 3000E, Tek Scan Inc. Norwood, MA, USA). | Temperature, pressure and acceleration data were recorded with the patient sitting for 10 min, standing for 15 min, walking on a monitored treadmill (Ergo ELG 70, Woodway GmbH, Weil am Rhein, Germany) for 45 min and then sitting again for 20 min. Studies were performed at three different cadences (80, 100 and 120 steps/min). | Foot temperature increased by 5 °C during walking in both age groups and was greater with increased walking speed. Walking speed was found to be proportional to the increase in temperature, but the final temperatures recorded after walking did not differ. A maximum plateau value was observed, above which the foot temperature did not increase. There was an inversely proportional correlation between foot temperature during walking and before exercise, which was stronger in the older group. In both age groups, the increase in temperature did not correlate with the time integrals of the normal pressure exerted by the foot. |
| Li et al. [32] (2022) | To examine the effects of shoe upper materials on foot relative humidity and temperature in older individuals. To examine the influence of the thermal environment of the footwear on the subjective sensation experienced while performing walking and sitting activities. | A total of 40 older individuals (25 female and 15 male) participated in the study, which involved walking and sitting in four different conditions: barefoot (Group A), wearing leather trainer shoes with an ethyl vinyl acetate sole (Group B), wearing mesh trainer shoes with an ethyl vinyl acetate sole (Group C) and wearing closed-toe trainer shoes with a rubber sole (Group D). An infrared camera (FLIR T420bx, Systems, Inc., Wilsonville, OR, USA) was employed to record skin temperature. | Following a 30 min period of foot conditioning while seated, the participants were required to complete two tests: a 20 min seated test and a 30 min treadmill walking test at a speed of 3 km/h. The mean recovery interval between the two tests was 15–30 min. Thermal images of the feet were obtained prior to and following each test. Three assessment scales were employed to measure thermal comfort and perceived humidity. | The temperature of the feet increased during the sitting position, with the greatest discrepancy observed between the barefoot condition (A) and the three shoe conditions (B, C, D, Y) on the dorsal aspect of the toes (2.8 °C, 1.2 °C and 1.8 °C, respectively) and on the heel (3.1 °C, 2.3 °C and 2.5 °C, respectively). In comparison to the barefoot condition, temperatures were observed to be higher for all shoe conditions during the walking phase of the trial. The highest temperature was recorded in group D. The greatest difference between the barefoot condition (A) and the three shoe conditions (B, C, Y D) was observed on the dorsal aspect of the toes, with a mean temperature of 2.3 °C, 1.4 °C and 2.4 °C, respectively. The temperature was higher for all shoe conditions at all regions of interest (ROIs) on the foot sole, with the exception of group C. The greatest difference in average temperature between groups A and B (2.4 °C) was observed in the toes. In comparison to the barefoot condition, groups C and D exhibited the most notable differences in the plantar arch, with a relative humidity increase of 2 °C and 2.5 °C, respectively. During the seated position, the greatest relative humidity increase was observed on the foot sole in shod conditions (B and D) and on the dorsal aspect of the foot in shod condition B. During ambulation, the relative humidity demonstrated a tendency to decrease with shoes, particularly in condition C, within the plantar arch. An increase was observed in the rear aspect of the foot in the B condition. Therefore, the degree of foot sweating was found to be greater in group B in comparison to groups C and D, both during periods of walking and sitting. |
| Nemati et al. [33] (2022) | To develop a temperature-prediction model for the metatarsal area and plantar arch. To assess the precision of the model in forecasting the temperature of the foot sole. | Seven healthy adult males who were asked to wear running shoes without socks. The temperature of the feet was recorded at various points and at regular intervals using thermocouples. | Following a 10 min recovery period, participants engaged in a 30 min running exercise at speeds of 3, 6 and 9 km/h, respectively. | The maximum increase in plantar temperature was observed to be 6 °C, 8 °C and 11.5 °C for speeds of 3, 6 and 9 km/h, respectively. The cooling of the foot ‘by sweating’, as a thermoregulatory mechanism, was observed to be minimal at 3 km/h, with the first indications emerging after 15 min in the area of the plantar arch. At 9 km/h, this occurred after 20 min, while at 6 km/h, the onset was even later, occurring after 30 min. The role of sweating in the thermal regulation of the plantar arch was found to be fundamental, whereas in the metatarsal area, it was found to be insignificant. |
| Niemann et al. [34] (2020) | To analyse the differences in plantar temperature changes during prolonged standing between healthy volunteers and diabetic patients with polyneuropathy. | A total of 31 healthy volunteers and 30 diabetic patients with polyneuropathy were included in the study. An insole equipped with eight pressure sensors (TTForce A01) and a temperature sensor (NTC 805) was developed for use in footwear worn by individuals with diabetes. Additionally, the temperature within the shoe was recorded without contact with the foot. | Pressure and temperature data were recorded during six episodes of standing, each lasting 5, 10 and 20 min, with a 5 min period of sitting between each episode. | The reduction in plantar temperature was significantly greater in the standing position compared to the seated position in both healthy and diabetic patients with polyneuropathy. However, the magnitude of the reduction in peak temperature did not differ between the two groups, reaching −1 °C for a period of 20 min and subsequently decreasing by a smaller magnitude throughout the remainder of the test. The healthy volunteers experienced discomfort in their feet during prolonged periods of standing, which necessitated brief episodes of pressure relief. This was not observed in patients with diabetes and polyneuropathy. A transient decrease in plantar temperature may precipitate injury during prolonged periods of standing. |
| Carbonell et al. [35] (2019) | The objective is to evaluate the thermographic images in order to ascertain the effects of thermal and mechanical stress. | Thermal images of the feet of two groups of participants (15 diabetic patients and 7 healthy controls) were recorded with a termography camera (FLIR E-60, Flir Systems Inc., Wilsonville, OR, USA) at a distance of one metre. The ROIs were as follows: big toe, forefoot, midfoot and rearfoot. | Thermographic images were obtained prior to and following a 100 m treadmill walk, undertaken either barefoot or at a self-selected pace. Subsequently, a thermal stress (gel refrigerated at 0 °C) was applied to the soles of the feet, followed by thermographic video analysis of the basal thermal recovery rate over a 10 min period. | A greater reduction in temperature was observed in all ROIs in the diabetic patients following mechanical stress when compared to the control group. The greatest temperature differences between the groups were observed in the rearfoot and the forefoot, with a difference of −1 °C. The recovery of 90% of the basal temperature after thermal stress was observed to occur at a slower rate in diabetic patients. |
| Yavuz et al. [36] (2014) | To analyse the relationship between plantar triaxial loading and post-excersice plantar temperature increase. | A total of 13 healthy volunteers participated in the study. An infrared camera (TiR2FT, Fluke Corporation, Everett, WA, USA) was utilised without the necessity for contact. A bespoke pressure shear plate had been constructed. | Participants walked on the shear plate at self-selected speeds using the two-steps method while the shear stress data were collected. Subsequently, the participants walked barefoot on a treadmill at a speed of 3.2 km/h for a period of 10 min, after which they returned to the shear plate to collect data pertaining to post-exercise shear stress. In the majority of cases, data from four trials were utilised. Temperature data were recorded at both the pre- and post-exercise stages. | The following variables were calculated: maximum shear stress (PSS), maximum resultant stress (PRS) and maximum temperature increase (AT). A moderate linear relationship was observed between PSS and AT. The post-exercise correlation between PSR and AT was found to be statistically significant (p = 0.002). Nevertheless, the location of the peak AT was unable to successfully predict the location of PSS in 23% of the volunteers. No statistically significant correlation was observed between AT and PRS. Moreover, in 39% of the subjects, the maximum temperature increase coincided with the peak observed in the study. |
| Priego Quesada et al. [37] (2017) | To ascertain the relationship between the temperature of the sole of the foot (as determined by infrared thermography) and the occurrence of foot eversion during running (as observed through motion analysis). | A total of 22 runners (17 male and 5 female) completed a pre-test and a main test on different days, with a one-week interval between the two tests. The pre-test phase was conducted as follows: a maximal effort run of five minutes on a 400 m track was conducted to determine the maximal aerobic speed (MAS) of the subjects. The main test was conducted on a treadmill with an incline of 1% (Technogym SpA, Gambettola, Italy). The participants engaged in a 10 min warm-up at 60% of their maximal aerobic speed (MAS) before proceeding to run for 20 min at 80% of their MAS. The temperature of the feet was gauged with the aid of a thermal imaging camera (FLIR E-60, Flir Systems Inc., Wilsonville, OR, USA) prior to and following the test, while the occurrence of foot eversion was monitored throughout the test. ROIs were defined as follows: the rearfoot (with a defining length of 31% of the entire plantar surface of the foot) and the medial and lateral ROIs (defined as 50% of the maximum foot width). | Thermal images were obtained from each participant at three distinct time points: prior to, immediately following and 10 min following the completion of the running test. During the running test, the participants were barefoot, wearing only their running shoes. | A weak negative correlation was observed between contact-time eversion values and rearfoot thermal symmetry immediately following the running session, while a weak positive correlation was evident between these variables and rearfoot thermal asymmetry at the final temperature. The maximum eversion values exhibited during the stance phase demonstrated a weak negative correlation with foot thermal symmetry, as assessed immediately following the running session, and a weak positive correlation with foot thermal asymmetry at the final temperature. |
| Catalá-Vilaplana et al. [38] (2023) | To analyse the impact of different types of sports footwear (traditional stable shoes vs. unstable shoes) on acceleration impacts on the tibia and forehead, as well as the variation in plantar surface temperature. | Six athletes (four female and two male) were assessed on two separate occasions, with a one-week interval between each assessment. On the initial assessment day, anthropometric variables (height and body weight) were recorded, and the foot typology was characterised using the Foot Posture Index. On the second day, the treadmill walking test was conducted under two footwear conditions: stable shoes (Adidas Galaxy Elite Noir) and unstable shoes (Skechers Shape Ups). Two triaxial accelerometers with a frequency of 420 Hz were used, one on the distal tibia of the dominant leg and another on the forehead (MMA7261QT, Free-scale Semiconductor©, Munich, Germany). The surface temperature of the feet’s soles was determined through the utilisation of a thermal imaging camera (FLIR E60bx, Wilsonville, OR, USA). The ROIs were evaluated for each of the three anatomical areas: the forefoot, midfoot and rearfoot. | The participants walked for a period of ten minutes with each type of footwear at a speed of 1.44 metres per second, with a two-hour period of rest between each test. The spatiotemporal and acceleration variables were obtained from the three eight-second recordings taken at minutes 2, 5 and 9 of each test. Thermal records were obtained at three distinct time points: prior to the test, immediately following the test and five minutes after the conclusion of the test. | No statistically significant differences were identified in any of the accelerometry variables. Significant differences were observed in the thermographic images between the pretest and post-five time points, particularly in the midfoot region (p = 0.004, ES = 1.2). |
| Perren et al. [39] (2021) | To determine whether there was a correlation between pressure and temperature in different regions of the foot across different categories of participants after a 15 min walk. | The study population comprised four groups of 12 individuals (a total of 42 males and 6 females), as follows: healthy patients (Group A), patients with diabetes (Group B), diabetics with peripheral arterial disease (Group C) and diabetics with neuropathy (Group D). A Tekscan high-resolution (HR) treadmill (Tekscan, Boston, MA, USA) was utilised to collect plantar pressure data. The following ROIs were evaluated: the hallux, the first metatarsophalangeal joint (MPJ), the second to fourth MPJs, the fifth MPJ and the heel. Thermal imaging was conducted using a thermal camera (T630C FLIR, Wilsonville, OR, USA). | The results of three pressure tests were recorded for each participant while they were walking at their preferred speed. Subsequently, the participants were positioned in a supine position on the examination table for a period of 15 min. Subsequently, the participants were required to walk for a period of fifteen minutes on a treadmill. One minute after cessation of ambulation, thermograms were obtained of the plantar surface of the feet. | In the preliminary statistical analysis, the four groups were consolidated into two categories: a control cohort comprising groups A and B and a complication cohort comprising groups C and D. In the groups exhibiting complications, a positive correlation was observed between temperature and pressure in the hallux and the second to fifth metatarsophalangeal joints (MPJs) as well as in the heel ROIs. This correlation was exclusive to the fifth metatarsophalangeal joint in the healthy cohort. In the second statistical test, the two groups were divided into a healthy cohort (Group A) and a diabetes cohort (Groups B, C and D). A positive correlation was observed between temperature and pressure for all ROIs in the diabetes group, whereas in the healthy group, this correlation was evident only for the 2nd–5th MPJs. In individuals without complications (groups A and B), there was a tendency for pressure areas to become warmer, although this was less significant than in individuals with complications (groups C and D). |
| Jiménez et al. [40] (2021) | To establish a correlation between plantar pressures during prolonged running and plantar temperature, whether in the sole of the foot or the sole of the shoe. | A total of 30 recreational runners (15 males and 15 females) were recruited to perform a 30 min running test on a treadmill (Excite Run 900, Technogym Spa, Gambetta, Italy). Thermographic images were obtained of the sole of the feet and the sole of the shoes using an infrared camera (Flir E60bx, Flir Systems Inc., Wilsonville, OR, USA) at two time points: immediately prior to the commencement of the test and at its conclusion. Subsequently, dynamic plantar pressure was quantified at 200 Hz using an F-Scan® in-shoe pressure measurement system (v.50, Tekscan Inc., Boston, MA, USA). | The participants engaged in a six-minute treadmill running session, which was followed by a 30 min treadmill running session with a 1% slope. This was done in order to simulate the duration and intensity of regular training. Two thermographic images were obtained of the soles of the dominant feet and the soles of the sports shoes in a seated position. The initial image was captured one minute prior to the commencement of the 30 min trial, with the subsequent image obtained one minute thereafter. At the conclusion of the trial, dynamic plantar pressure was assessed. | A moderate correlation was observed between plantar pressure and plantar temperature, both in the soles of the feet and in the soles of the shoes, particularly in the forefoot regions. The correlation between plantar pressure and plantar temperature was more pronounced in the shoe soles than in the foot soles. Following the running exercise, the temperature of the shoe soles was observed to be lower in the female participants than in the male participants. |
Disclaimer/Publisher’s Note: The statements, opinions and data contained in all publications are solely those of the individual author(s) and contributor(s) and not of MDPI and/or the editor(s). MDPI and/or the editor(s) disclaim responsibility for any injury to people or property resulting from any ideas, methods, instructions or products referred to in the content. |
© 2024 by the authors. Licensee MDPI, Basel, Switzerland. This article is an open access article distributed under the terms and conditions of the Creative Commons Attribution (CC BY) license (https://creativecommons.org/licenses/by/4.0/).
Share and Cite
Rosell-Diago, M.P.; Izquierdo-Renau, M.; Julian-Rochina, I.; Arrébola, M.; Miralles, M. Thermography, Temperature, Pressure Force Distribution and Physical Activity in Diabetic Foot: A Systematic Review. Appl. Sci. 2024, 14, 8726. https://doi.org/10.3390/app14198726
Rosell-Diago MP, Izquierdo-Renau M, Julian-Rochina I, Arrébola M, Miralles M. Thermography, Temperature, Pressure Force Distribution and Physical Activity in Diabetic Foot: A Systematic Review. Applied Sciences. 2024; 14(19):8726. https://doi.org/10.3390/app14198726
Chicago/Turabian StyleRosell-Diago, Maria P., Marta Izquierdo-Renau, Iván Julian-Rochina, Manel Arrébola, and Manuel Miralles. 2024. "Thermography, Temperature, Pressure Force Distribution and Physical Activity in Diabetic Foot: A Systematic Review" Applied Sciences 14, no. 19: 8726. https://doi.org/10.3390/app14198726
APA StyleRosell-Diago, M. P., Izquierdo-Renau, M., Julian-Rochina, I., Arrébola, M., & Miralles, M. (2024). Thermography, Temperature, Pressure Force Distribution and Physical Activity in Diabetic Foot: A Systematic Review. Applied Sciences, 14(19), 8726. https://doi.org/10.3390/app14198726