Article

Combining CBAM and Iterative Shrinkage-Thresholding Algorithm for Compressive Sensing of Bird Images

1
College of Big Data and Intelligent Engineering, Southwest Forestry University, Kunming 650224, China
2
College of Science, Southwest Forestry University, Kunming 650224, China
*
Author to whom correspondence should be addressed.
Appl. Sci. 2024, 14(19), 8680; https://doi.org/10.3390/app14198680
Submission received: 16 July 2024 / Revised: 12 September 2024 / Accepted: 17 September 2024 / Published: 26 September 2024

Abstract

:
Bird research contributes to understanding species diversity, ecosystem functions, and the maintenance of biodiversity. By analyzing bird images and the audio of birds, we can monitor bird distribution, abundance, and behavior to better understand the health of ecosystems. However, bird images and audio involve a vast amount of data. To improve the efficiency of data transmission and storage efficiency and save bandwidth, compressive sensing can overcome this challenge. Compressive sensing is a technique that uses the sparsity of signals to recover original data from a small number of linear measurements. This paper introduces a deep neural network based on the Iterative Shrinkage Thresholding Algorithm (ISTA) and a Convolutional Block Attention Module (CBAM), CBAM_ISTA-Net+, for the compressive reconstruction of bird images, audio Mel spectrograms and wavelet transform spectrograms. Using 45 bird species as research subjects, including 20 bird images, 15 audio-generated Mel spectrograms, and 10 audio wavelet transform (WT) spectrograms, the experimental results show that CBAM_ISTA-Net+ achieves a higher peak signal-to-noise ratio (PSNR) at different compression ratios. At a compression ratio of 50%, the average PSNR of the three datasets reaches 33.62 dB, 55.76 dB, and 38.59 dB, while both the Mel spectrogram and wavelet transform spectrogram achieve more than 30 dB at compression ratios of 25–50%. These results highlight the effectiveness of CBAM_ISTA-Net+ in maintaining high reconstruction quality even under significant compression, demonstrating its potential as a valuable tool for efficient data management in ecological research.

1. Introduction

Birds are one of the most diverse and abundant animals on Earth, known not only for their striking appearances but also for their beautiful sounds. Bird images and sounds are valuable data sources for biological analysis and conservation [1]. Different bird species vary greatly in appearance and sound, and each bird has its own unique characteristics. By extracting, classifying, and recognizing features from bird images and audio recording, we can gain insights into species identification, population numbers, distribution, and behaviors. This information serves as a scientific foundation for bird conservation efforts [2].
Field observations of birds are often challenging due to their preference for wild habitats. The emergence of automatic recording devices for capturing images and sounds provides convenience for wild bird observation and makes it possible to monitor biodiversity on large spatiotemporal scales [3]. The analysis of bird images and sounds through feature extraction can significantly enhance our understanding of ecosystem biodiversity and the impact of human activities on the environment [4]. However, automatic recording devices often collect vast amounts of complex bird data, and directly storing or transmitting these data can be resource-intensive and time-consuming.
Compressive sensing (CS) theory [5,6] shows that when the signal presents sparsity in the transformation domain, the limitations of the Nyquist sampling theorem can be overcome, enabling high-precision image reconstruction with fewer sampled data. In the context of bird data collection, the transmission and storage of sampled signal face significant challenges. CS addresses these by reducing the sampling rate, thereby shortening the total sampling time, and by reducing the amount of information transmitted data, which helps alleviate bandwidth constraints in communication. Image reconstruction is one of the key issues in CS theory.
Traditional CS-based methods usually describe image reconstruction as a convex sparse learning problem. The reconstruction algorithms mainly include non-convex optimization algorithms [7,8], greedy matching pursuit algorithms [9,10,11], and convex optimization algorithms [12,13]. While all three types of algorithms rely on signal sparsity, their reconstruction performance is often suboptimal. The model-based reconstruction method studies the prior information of the signal, that is, different prior information is used to build different reconstruction models, and its reconstruction effect is superior to the other three types of algorithms. However, these algorithms suffer from high computational complexity, making them time-consuming, and inefficient.
In recent years, deep learning (DL) methods have been widely used in image classification [14], object detection [15], and compressive sensing (CS) image reconstruction. Due to the strong learning ability and fast operation speed of deep neural network, several image compressive sensing methods based on deep neural networks have been developed [16,17,18,19,20]. Kulkarni et al. [19] introduced ReconNet, a CNN for inverse mapping from CS measurements to images, but there are problems with texture preservation. Yao et al. [20] built on ReconNet with DR2-Net, adding residual networks [21] to improve image quality, though high-resolution detail recovery is still a challenge. YANG et al. [22] embedded the ADMM algorithm into a deep network and improved performance through end-to-end training, but the generalization of different image types is limited. Zhang et al. [23] proposed ISTA-Net, which improves reconstruction while maintaining interpretability, but its computational complexity is high, particularly with large datasets. SHI et al. [24] introduced CSNet, which enhances sampling efficiency, but lost details at very low sampling rates. AMP-net [25] extends the AMP algorithm to deep learning and achieves good reconstruction, but its lengthy training limits real-time applications. CASNet [26] performs adaptive sampling and high-quality reconstruction. However, there is a robustness problem in different types of images. Sun et al. [27] developed a dual-path attention network for compressive sensing image reconstruction, which enhances texture recovery effect, but increases the complexity of the model. Song et al. [28] proposed OCTUF, which uses a cross-attention transformer to improve reconstruction quality, but its efficiency decreases when dealing large-scale data. Geng et al. [29] introduced HFIST-Net to combine traditional CS with deep learning for MR image reconstruction, but its reliance on domain-specific data restricts its wider applicability. CSCNet [30] proposed by Cui et al., uses local structure sampling to enhance measurement correlations, which is difficult to capture global information in complex scenes. DMFNet [31] integrates detailed texture and global structure to achieve better reconstruction, although its high computational requirements pose challenges, especially for high-resolution images.
Despite the significant advance in these deep learning-based methods, challenges remain in balancing reconstruction quality, computational efficiency, and generalization across different image types. To address these limitations, this study proposes a new deep network model, CBAM_ISTA-Net+, which integrates a dual-attention mechanism and compressive sensing mechanism to improve compressive reconstruction of bird images and audio spectrograms. The model is designed to enhance the peak signal-to-noise ratio (PSNR). The main contributions of this paper are as follows:
(1) Introduce the attention module CBAM to the ISTA-Net+ framework to enhance the quality of compressed reconstruction.
(2) Apply the CBAM_ISTA-Net+ model for compressive reconstruction of bird images and audio data (Mel spectrograms and wavelet transform spectrograms), which significantly improve the peak signal-to-noise ratio (PSNR) under different compression ratios.
(3) The classification results of reconstructed bird images verify the effectiveness of this method in maintaining the integrity of image features and demonstrate the potential application in practical ecological monitoring.

2. Dataset

The dataset used in this study mainly comes from online resources https://www.kaggle.com/ and https://xeno-canto.org/ (accessed on 18 April 2023). The image dataset contains 87,050 images of 510 bird species, from which we selected twenty species from eight orders, eighteen families, and twenty genera, for a total of 3254 images. The bird song data included six orders, ten families, twenty genera, and twenty-five species. In this experiment, the audio was transformed to generate 15 kinds of Mel spectrograms and 10 kinds of wavelet transform spectrograms of the audio. Some of the bird images, along with the Mel spectrograms and WT spectrograms, are presented in Figure 1.

3. Research Method

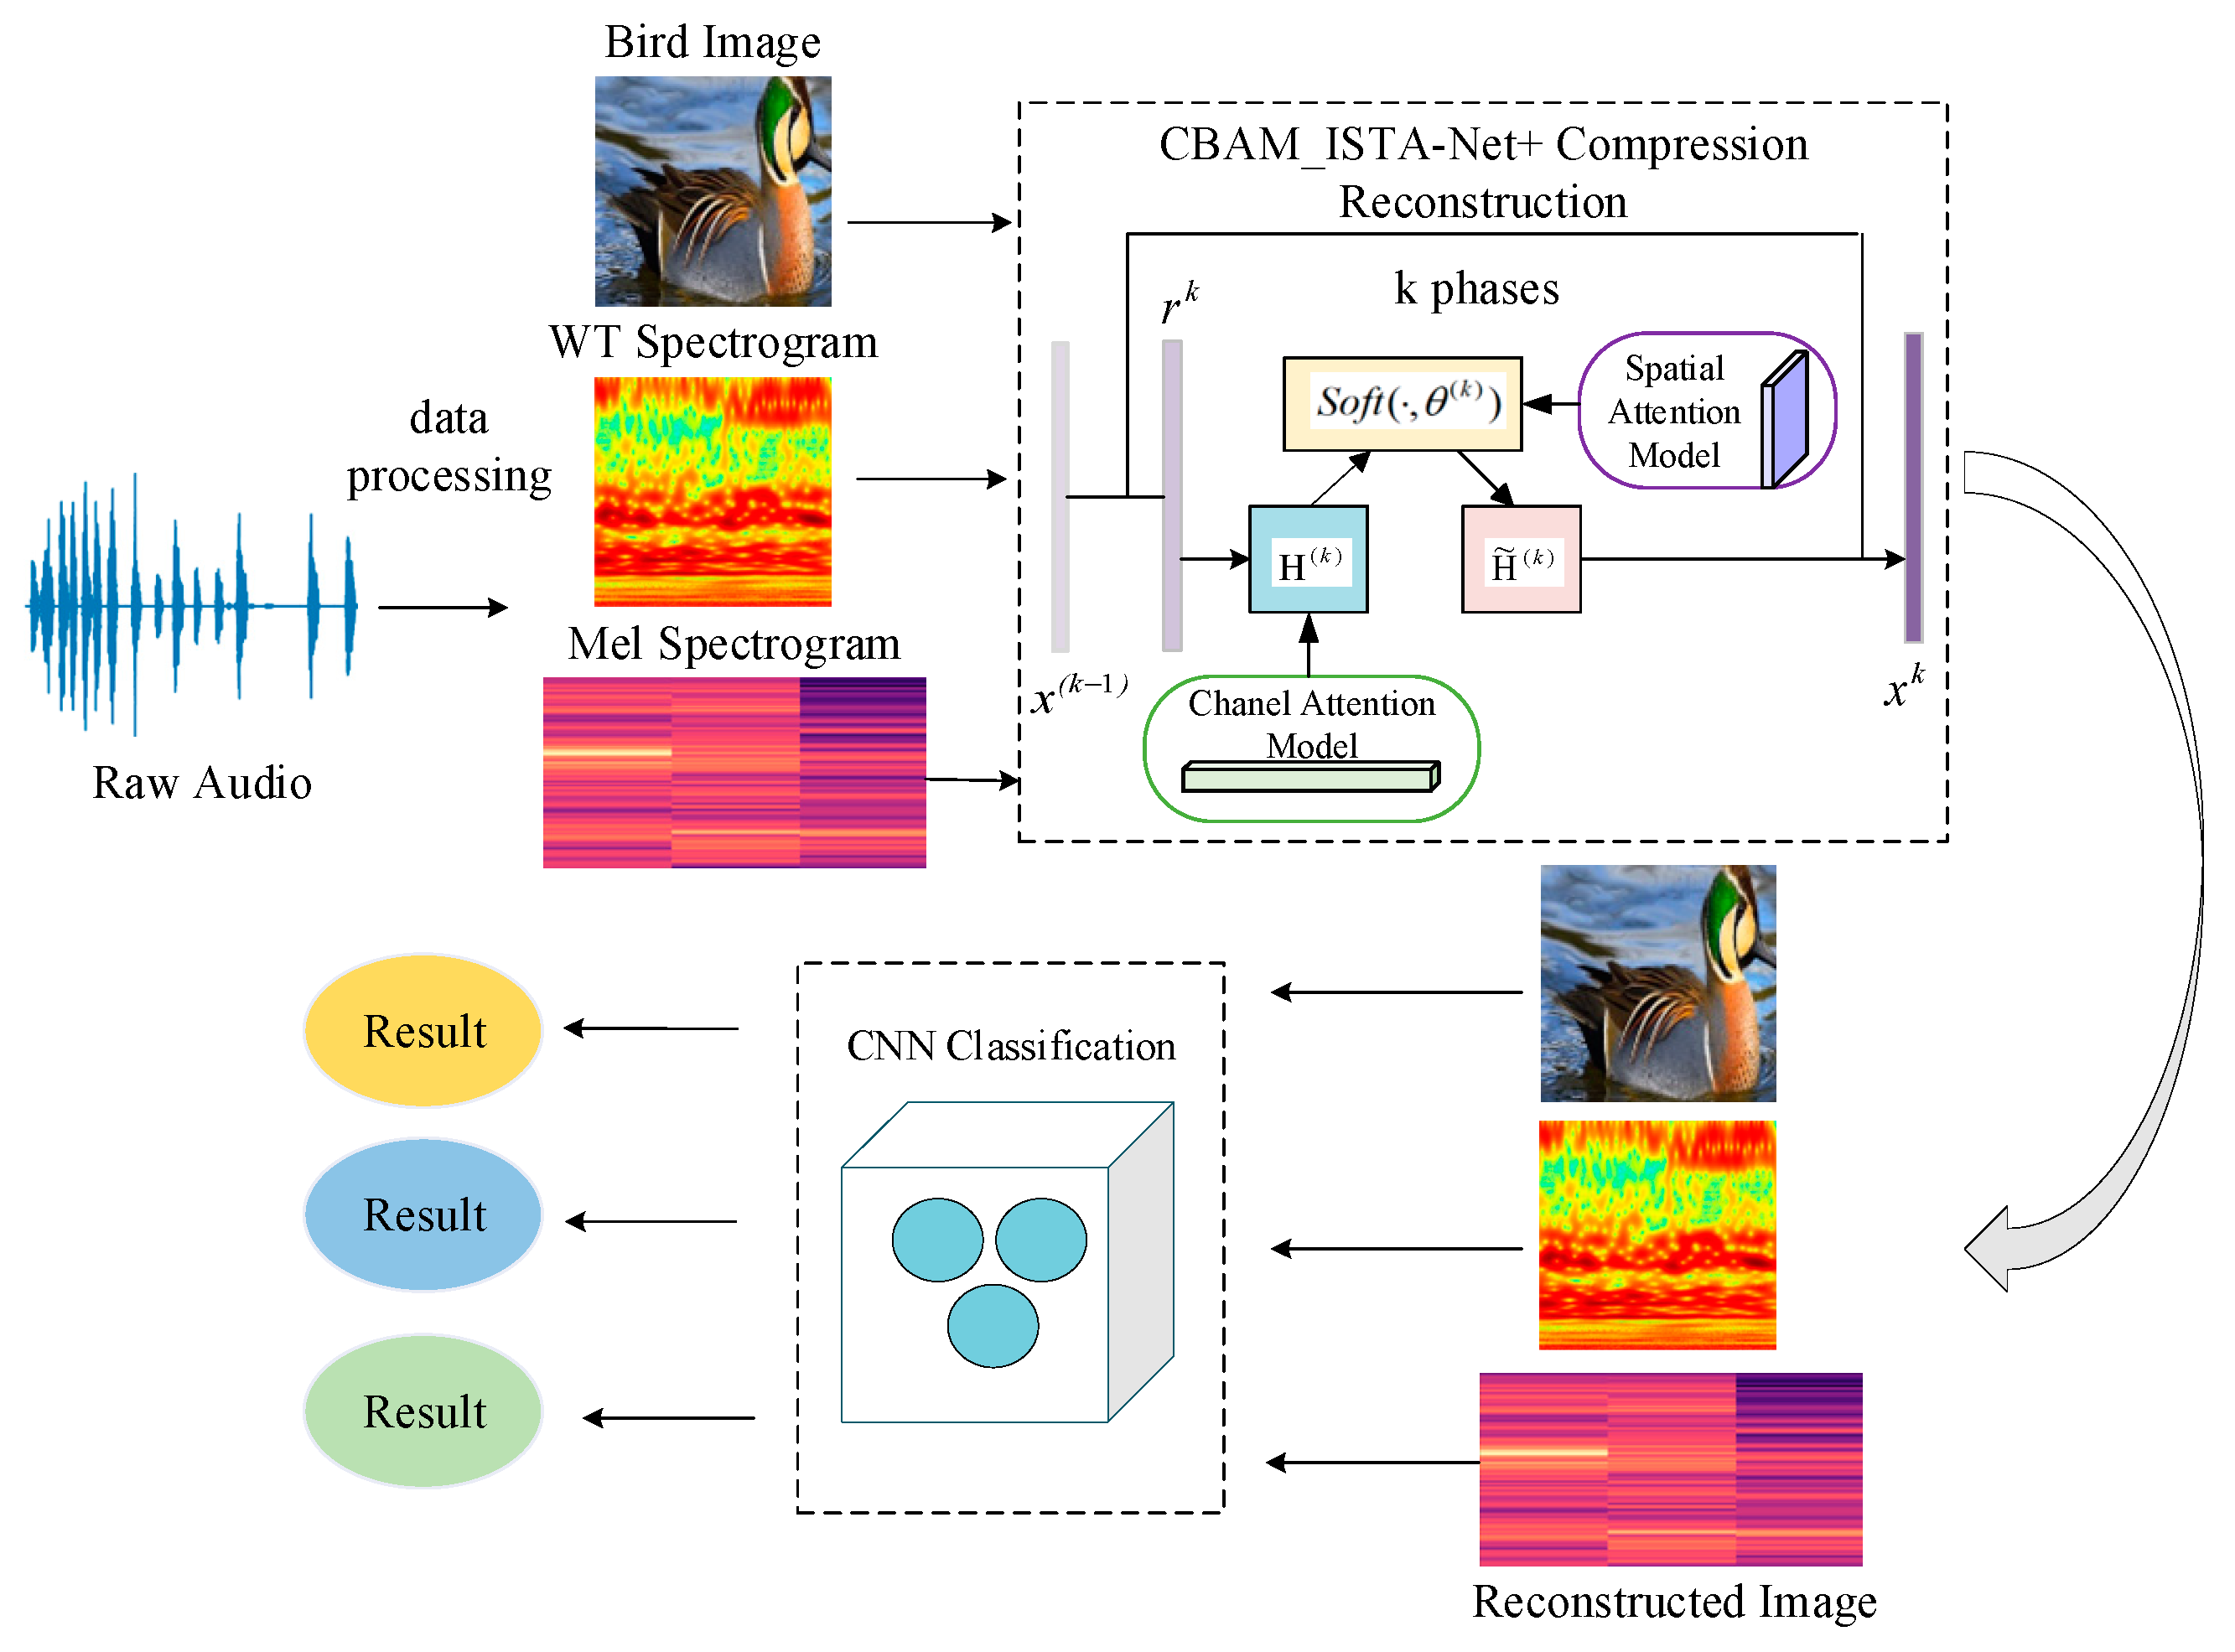
In this paper, CBAM_ISTA-Net+ is proposed to achieve high-quality compressive reconstruction of bird images and spectrograms, focusing on the details and important features of the images. The specific steps are as follows:
Step 1: Preprocess the original audio signal, including format conversion, denoising, and endpoint detection.
Step 2: Convert the audio to Mel spectrograms and wavelet transform spectrograms.
The audio signal is converted to the frequency domain by the Fast Fourier Transform and then processed by a Mel filter bank, which ultimately generates a Mel spectrogram reflecting time, frequency, and energy distribution.
The time–frequency localization analysis is achieved by convolving the signal with wavelet functions of different scales and positions, providing a multi-resolution time–frequency representation to obtain a WT spectrogram.
Step 3: Apply CBAM_ISTA-Net+ for Compression and reconstruction.
CBAM_ISTA-Net+ applies compressive sensing to Mel spectrograms and WT spectrograms, extracted from bird images and audio signals, at varying compression ratios. The model first compresses these spectrograms, effectively reducing data redundancy, and then utilizes a dual-attention mechanism to focus on both channel and spatial features during reconstruction. This enables the network to recover sparse signals more efficiently and output high-quality reconstructed images data.
The specific framework is shown in Figure 2.

3.1. Data Preprocessing

To obtain high-quality audio, the sound data needs to be preprocessed before feature extraction. Data preprocessing mainly includes audio format conversion, denoising, and endpoint detection. The format conversion unifies the birdsong file format as “.wav”, and monophonic, and the sampling frequency is unified as 16 kHz. The wavelet threshold denoising is used to remove the noise, and the endpoint detection removes the silent part of the sound data. The data preprocessing process is shown in Figure 3:

3.2. Generation of Audio Spectrograms

The audio is transformed to convert the original audio signal into Mel spectrograms and WT spectrograms.

3.2.1. Mel Spectrograms

The Mel spectrogram is a visual representation that captures how the frequency and amplitude of an audio signal change over time and is designed to reflect the human ear’s perception of sound. The audio signal is divided into overlapping frames, each containing a certain number of sampling points. Fast Fourier Transform (FFT) is applied to each frame, converting the signal from the time domain to the frequency domain, revealing the amplitude of each frequency component. The frequency axis is then converted to the Mel scale, a non-linear scale that reflects the different sensitivities of the human ear to low and high frequencies. The Mel scale can be obtained from the Hertz scale using the following formula:
m = 2595 log 10 ( 1 + f 700 )
where f represents the frequency in Hertz and m is the corresponding frequency in Mel.
The frequencies on the Mel scale are segmented into several triangular filters, each covering a certain frequency range. Each frame is multiplied with the filter bank in the frequency domain to obtain the energy output of each filter. These energy values form a column of the Mel spectrogram, and this process is repeated to obtain all columns of the Mel spectrogram.

3.2.2. Wavelet Transform

The wavelet transform (WT) is an advanced time–frequency analysis tool that employs the idea of multiresolution analysis to obtain proper resolution in different time–frequency regions by non-uniformly dividing the time–frequency space. It uses finitely attenuated wavelet basis functions, consisting of scaled and shifted versions of the parent wavelet and the parent wavelet, to better localize signals in the time and frequency domains. This property makes the wavelet transform particularly suitable for audio signal processing, providing better time resolution in the high-frequency part to detect transient changes and higher frequency resolution in the low-frequency part to accurately track slowly changing features. The continuous WT of the signal s(t) is as follows:
W ( a , b ) = 1 a x t ψ a , b * ( t b a ) d t
where x t is the original signal, ψ * is the complex conjugate of the wavelet function, a is the scale parameter, and b is the translation parameter.
Choosing the appropriate mother wavelet is the key to improve the efficiency and accuracy of wavelet transform analysis. The continuous WT of structural vibration response signals using complex Morlet wavelets can realize arbitrary time–frequency resolution. Therefore, in this paper, the complex Morlet wavelet is selected as the mother wavelet, and the mathematical expressions of its mother wavelet and sub-wavelet are as follows:
ψ ( t ) = 1 π f b e j 2 π f c t e t 2 f b
ψ a , b ( t ) = 1 a ψ t b a
where f c is the WT center frequency and f b is the WT bandwidth frequency.

3.3. CBAM_ISTA-Net+ Compression and Reconstruction

To achieve the compression and reconstruction of images and spectrograms, we proposed the CBAM_ISTA-Net+. It is an Iterative Shrinkage-Thresholding Algorithm (ISTA) network based on attention mechanisms, which can optimize the general L1 regularized compressive sensing model. A total of 20 types of bird images, 15 kinds of Mel spectrograms, and 10 kinds of wavelet transform spectrograms are input, and CBAM_ISTA-Net+ is used to compress and reconstruct the images and spectrograms.

3.3.1. Iterative Shrinkage-Thresholding Algorithm Network (ISTA-Net+)

The optimization problem of compressive sensing usually involves finding a sparse signal close to the original signal under a certain transform. It is shown as follows:
min x 1 2 Φ x y 2 2 + λ Ψ x 1
where y is the measured value, Φ is the measurement matrix, x is the original signal, Ψ is the sparse transform, and λ is the regularization parameter. . 2 and . 1 represent the Euclidean norm (also known as the L2 norm) and the L1 norm, respectively.
The traditional ISTA solves the aforementioned problem through iterative updates, with each step consisting of two main operations of gradient descent and proximal mapping. The formula is as follows:
r ( k ) = x ( k 1 ) ρ Φ T Φ x k 1 y
x ( k ) = a rgmin x 1 2 x r ( k ) 2 2 + λ Ψ x 1
where, r ( k ) is the residual of the kth iteration, x ( k 1 ) is the solution from the previous iteration, ρ is the step size, and x ( k ) in Equation (7) is the solution after the kth iteration.
ISTA-Net is a deep neural network based on Iterative Shrinkage-Thresholding Algorithm (ISTA), which maps each iteration of ISTA to a layer of the network and learns the network parameters through end-to-end training. A non-linear transform F ( · ) is introduced to replace the traditional linear sparse transform Ψ, which is learned by the convolutional neural network. Therefore, the above proximal mapping formula can be further written as follows:
x ( k ) = a rgmin x 1 2 F x F r k 2 2 + θ F x 1
where λ and α are merged into one parameter, i.e., θ = λ α , and α is a scalar.
Finally, the soft thresholding function is used to solve F r k , that is
F ( x ( k ) ) = soft ( F ( r ( k ) ) , θ )
where soft (⋅, θ) is the soft thresholding function used to achieve sparsity.
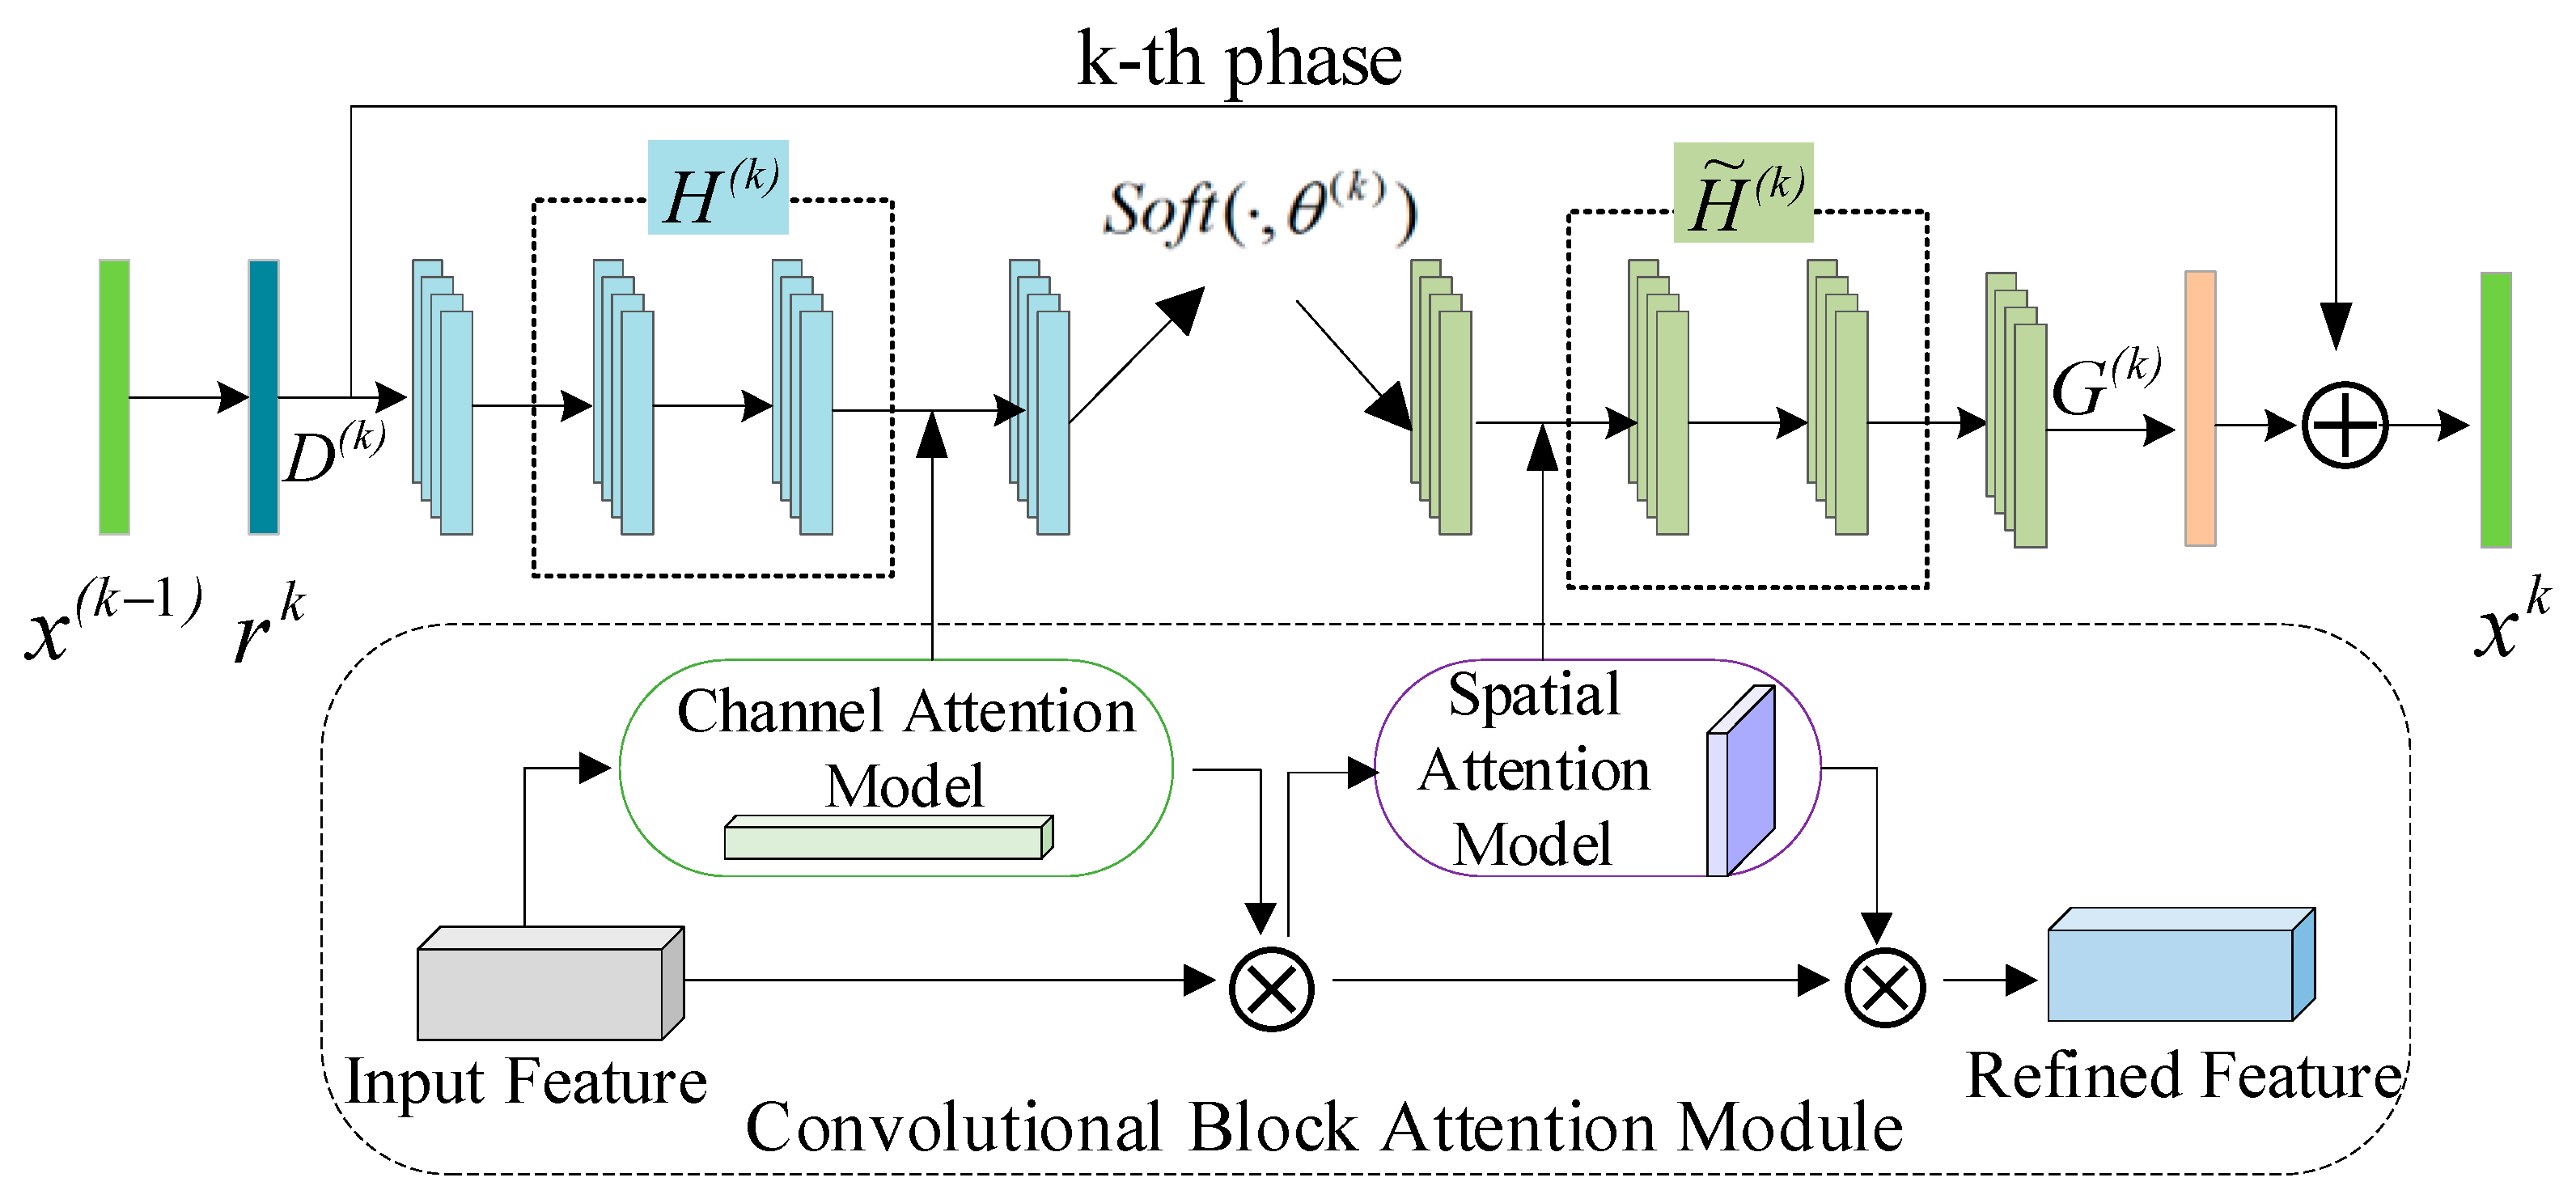
ISTA-Net+ is an enhanced version of ISTA-Net, and its structure is shown in Figure 4. In the figure, D ( k ) , G ( k ) , H ( k ) , and H ~ ( k ) are learnable linear convolutional operators. Replacing Equation (8) with H D results in the following:
m i n x 1 2 H D ( x ) H D ( r k ) 2 2 + θ H D ( x ) 1  
Following the same strategy as in ISTA-Net, the left inverse of H is defined as H ~ , which has the same structure as the symmetry, and satisfies the symmetry constraint H H ~ = I . For ISTA-Net+, x ( k ) is updated as follows:
x ( k ) = r ( k ) + G ( H ~ ( s o f t ( H ( D ( r k ) ) , θ ) ) )
It is sparse in the residual domain rather than the original image domain. Residual images are easier to compress and improve the quality of CS reconstruction. Furthermore, ISTA-Net+ introduces a skip connection, which adds the input and output of each stage together, thus speeding up the training and convergence of the network.

3.3.2. Improved CBAM_ISTA-Net+ Algorithm

The proposed method combines spatial and channel block attention module CBAM (Convolutional Block Attention Module) based on ISTA-Net+, and its formula is as follows:
x ( k ) = r ( k ) + G ( H ~ ( M s ( s o f t ( M c ( H ( D ( r k ) ) ) , θ ) ) ) )  
A channel attention mechanism (Channel Attention, CA) is added behind the second convolutional layer, and a spatial attention mechanism (Spatial Attention, SA) is incorporated after the soft thresholding operation, as shown in Figure 5. Together, they enhance the sensitivity and discriminative ability of the network to important features.
  • Channel Attention
Channel attention focuses on the importance of features, and the structure is shown in Figure 6.
After the forward transform module of CBAM_ISTA-Net+, the maximum pooling and the average pooling are first used for the features F H , and then the multilayer perceptron (MLP) layer is used to obtain the transform results. Finally, they are applied to two channels separately, and the attention results of the channels are obtained by using sigmoid function. The importance of different channels is used to weight the feature mapping of each channel, emphasizing the important channel features and suppressing the unimportant channel features. The formula is shown below:
M c ( F H ) = σ ( M L P ( A v g P o o l ( F H ) ) + M L P ( M a x P o o l ( F H ) ) )
where M c ( F H ) is the weighted result after forward propagation.
  • Spatial Attention
The spatial attention focuses on the importance of spatial positions, and its structure is shown in Figure 7.
With the soft thresholding operation, a channel-based global max pooling and global average pooling are first performed to obtain two feature maps, Then, they are concatenated into a feature map. It focuses on different spatial locations of the feature map and weights the feature map by learning the importance of each location, making the network pay more attention to the important spatial regions of the image. The formula is shown below:
M s ( F S o f t ) = σ ( f 7 * 7 ( [ A v g P o o l ( F S o f t ) ) ; A v g P o o l ( F S o f t ) ] ) )
where M s ( F S o f t ) is the weighted result after soft thresholding iterations. F S o f t is the feature after the soft thresholding operation.
The major steps of the proposed CBAM_ISTA+ are summarized in Algorithm 1.
Algorithm 1: The procedure of CBAM_ISTA+
Input:   Training   dataset   X ,   sampling   matrix   Φ ,   number   of   network   layers   L ,   initialization   matrix   Q i n i t
Output:   Reconstruction   result   Y ^
1 .   Compute   the   initial   matrix   Φ T Φ   a n d   v e c t o r   Φ X ;
2 .   Initialize   reconstruction   result   x 0 = X Φ i n i t T ;
3. for k = 1; k ≤ L do
4 .   Updating   the   estimates   x k   by Formulas (6) and (7);
5 .   Reshape   x k   to   the   image   format   x i n p u t   and   apply   C o n v D   to   obtain   the   feature   map   x D ;
6. Forward propagation convolution to extract deep features
     x = R e L U ( C o n v 1 ( x D ) ) , x f o r w a r d = C o n v 2 ( x ) ;
7 .   Compute   the   channel   attention   weight   M c ( x f o r w a r d )   weighted   the   feature   map   x f o r w a r d ;
8 .   x = S o f t θ ( x f o r w a r d , θ k ) ;
9 .   Compute   the   spatial   attention   weight   M s ( x )   weighted   feature   map   x ;
10. Backward propagation convolution
     x = R e L U ( C o n v 3 ( x ) ) , x b a c k w a r d = C o n v 4 ( x ) ;
11 .   Reconstruction   updates :   x p r e d = x i n p u t + x G ,   x G = C o n v G ( x b a c k w a r d ) , and flattened
  to vector form: x k = F l a t t e n ( x p r e d ) ,   and   calculate   the   symmetric   loss   S y m L o s s k ;
12. end;
13. Obtaining reconstruction results Y ^ = x k .

4. Experiment and Result Analysis

4.1. Experimental Design and Environment

The hardware platform used in this experiment is a desktop computer with 128 GB of memory, a 16-core, 32-thread CPU with a frequency of 3.40 GHz, and an NVIDIA (Santa Clara, CA, USA) A6000 GPU with 48 GB of VRAM. The operating system is Windows 10 64-bit Professional. Anaconda3, PyCharm 2020, and Python 3.8 are used as the data processing and deep learning platforms.
The compression ratios of the model were set as 1%, 4%, 10%, 25%, 30%, 40%, and 50%, and the sum of reconstruction error and constraint loss were taken as the loss function. The Adam optimizer updated the network parameters, and the learning rate was set to 0.0001. The parameters of the CBAM_ISTA+ are quoted from the paper published by Zhang et al. [23]. The peak signal-to-noise ratio (PSNR) was used as the evaluation metric to measure the quality of image reconstruction, defined as the inverse of the Mean Squared Error (MSE) between the original and reconstructed images. The formula is as follows:
MSE = 1 m n i = 0 m 1 j = 0 n 1 [ I ( i , j ) K ( i , j ) ] 2
PSNR = 10   × log 10 MAX I 2 MSE
where M A X I is the maximum possible pixel value of the image.

4.1.1. CAE Comparison Experiment

A convolutional autoencoder (CAE) is also constructed for comparative experiments. A convolutional autoencoder is an autoencoder (AE) implemented using a convolutional neural network (CNN). An autoencoder is an unsupervised learning model designed to reconstruct input data through an encoder and a decoder and to learn the hidden features of the data.
The difference between a convolutional autoencoder and a traditional autoencoder is that it replaces the fully connected layer with a convolutional layer and a pooling layer (Pooling Layer), which allows it to better process two-dimensional data such as images. The convolutional layer can extract local features, and the pooling layers can reduce dimensions and increase invariance. The network structure of the convolutional autoencoder is shown in Figure 8.
The network consists of an encoder and a decoder. The encoder is composed of five convolutional layers and max pooling layers. The convolutional layers are used to extract features from the input image, and the max pooling layers are used to reduce the spatial dimensions of the features. The decoder consists of five deconvolutional layers, which are used to recover the features of the input image and up-sampling to increase the spatial dimensions of the features, resulting in the final reconstructed image.

4.1.2. CNN Classification Model Settings

To verify the reconstruction ability of the model, a pre-trained model is built using a custom CNN, and the original and reconstructed images are classified. The parameters of the CNN structure are listed in Table 1. The learning rate is set to 0.01, the optimization function is SGD, the activation function is ReLU, and max pooling is chosen for pooling. After convolution and pooling, the fully connected layer makes the feature map into vectorization. The classification accuracy rate (ACC) is used as the evaluation index.
In this network, two convolutional and pooling layers are designed to extract the features. After the convolutional pooling, the data enters into a fully connected layer and the final features are extracted for image classification tasks.

4.2. Result Analysis

In the experiments, all the results are taken from five independent trainings. For bird images and spectrograms, the reconstruction performance of CAE, ISTA-Net, ISTA-Net+, and CBAM_ISTA-Net+ were compared under different compression ratios. Table 2 lists the average reconstruction time of each image. It can be observed that the CBAM_ISTA-Net+ outperforms the other networks at all compression ratios, indicating that CBAM_ISTA-Net+ can better preserve the detailed information in images and spectrograms, thus improving the quality of reconstruction. At a compression ratio of 50%, the average PSNR of CBAM_ISTA-Net+ for bird images, Mel spectrograms, and WT spectrograms reached 33.62 dB, 55.76 dB, and 38.59 dB, respectively, while the average PSNR of the convolutional autoencoder are only 21.58 dB, 23.13 dB, and 21.82 dB, respectively. The average reconstruction time for each image is less than 1 s, and when reconstructing the Mel spectrum, the reconstruction time is less than that of ISTA_Net+.
Figure 9 shows the PSNR of the three datasets with the four different methods under different compression ratios. It is evident that CBAM_ISTA-Net+ achieves the best reconstruction results under any of the compression ratios.
To verify the performance of CBAM_ISTA-Net+, the experiments are carried on datasets of the Set11 and BSD68 mentioned in [23]. Table 3 lists the average PSNR reconstruction performance for seven CS ratios on Set11 and BSD68. The results show that CBAM_ISTA-Net+ achieves better reconstruction results, and is an improvement over the previous methods in almost all cases.
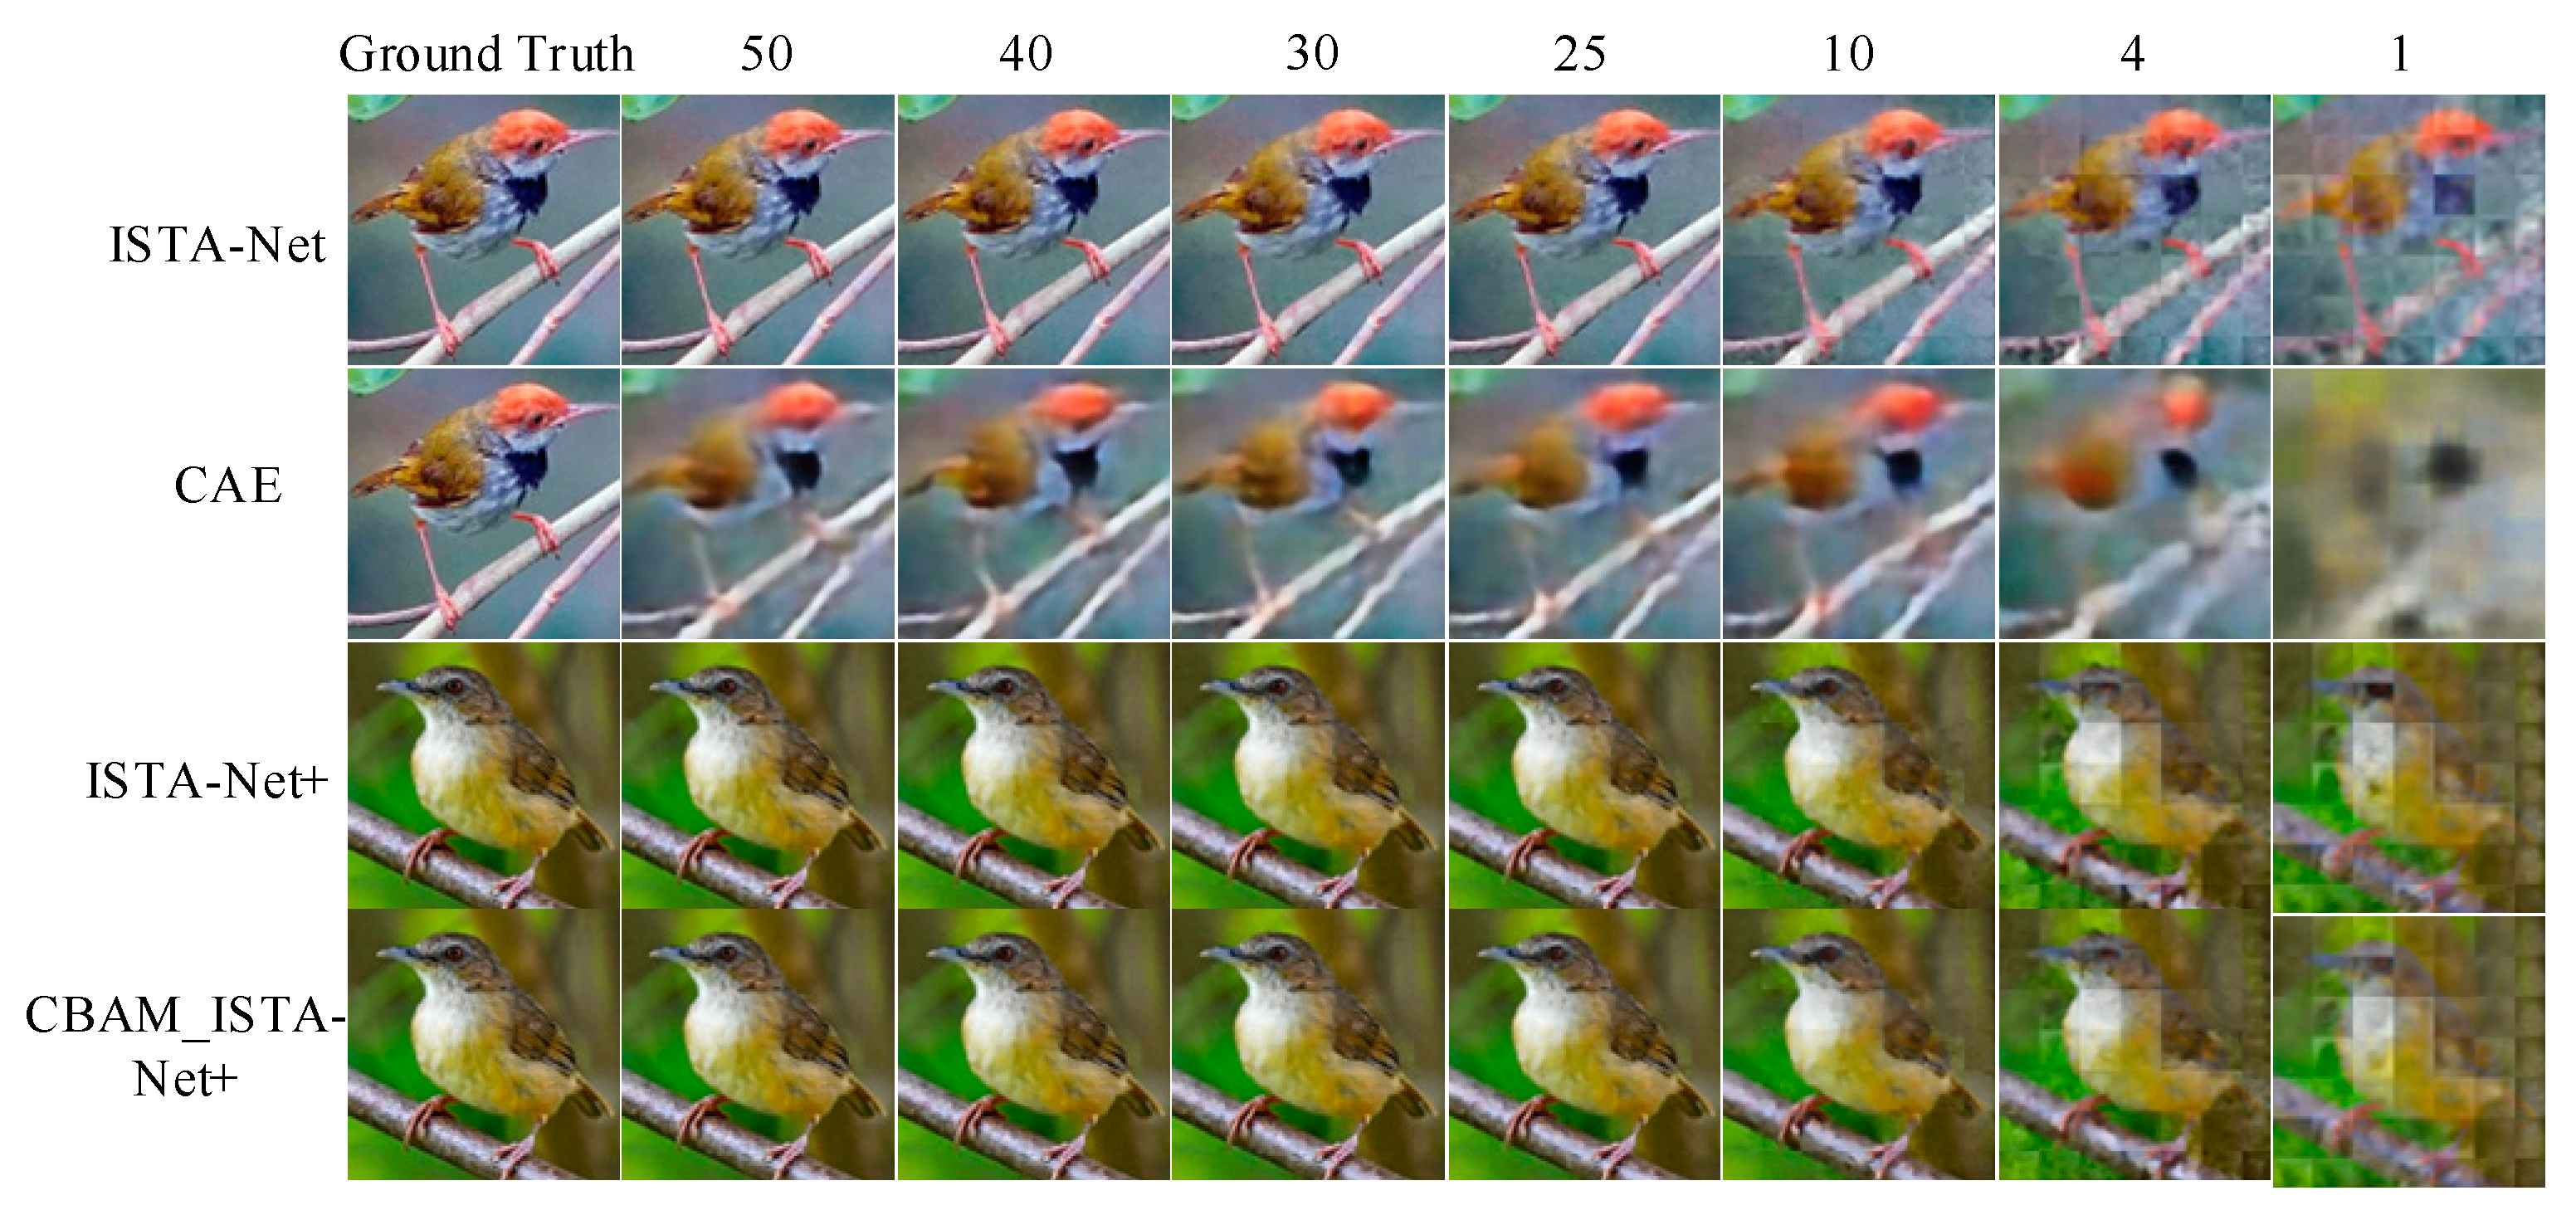
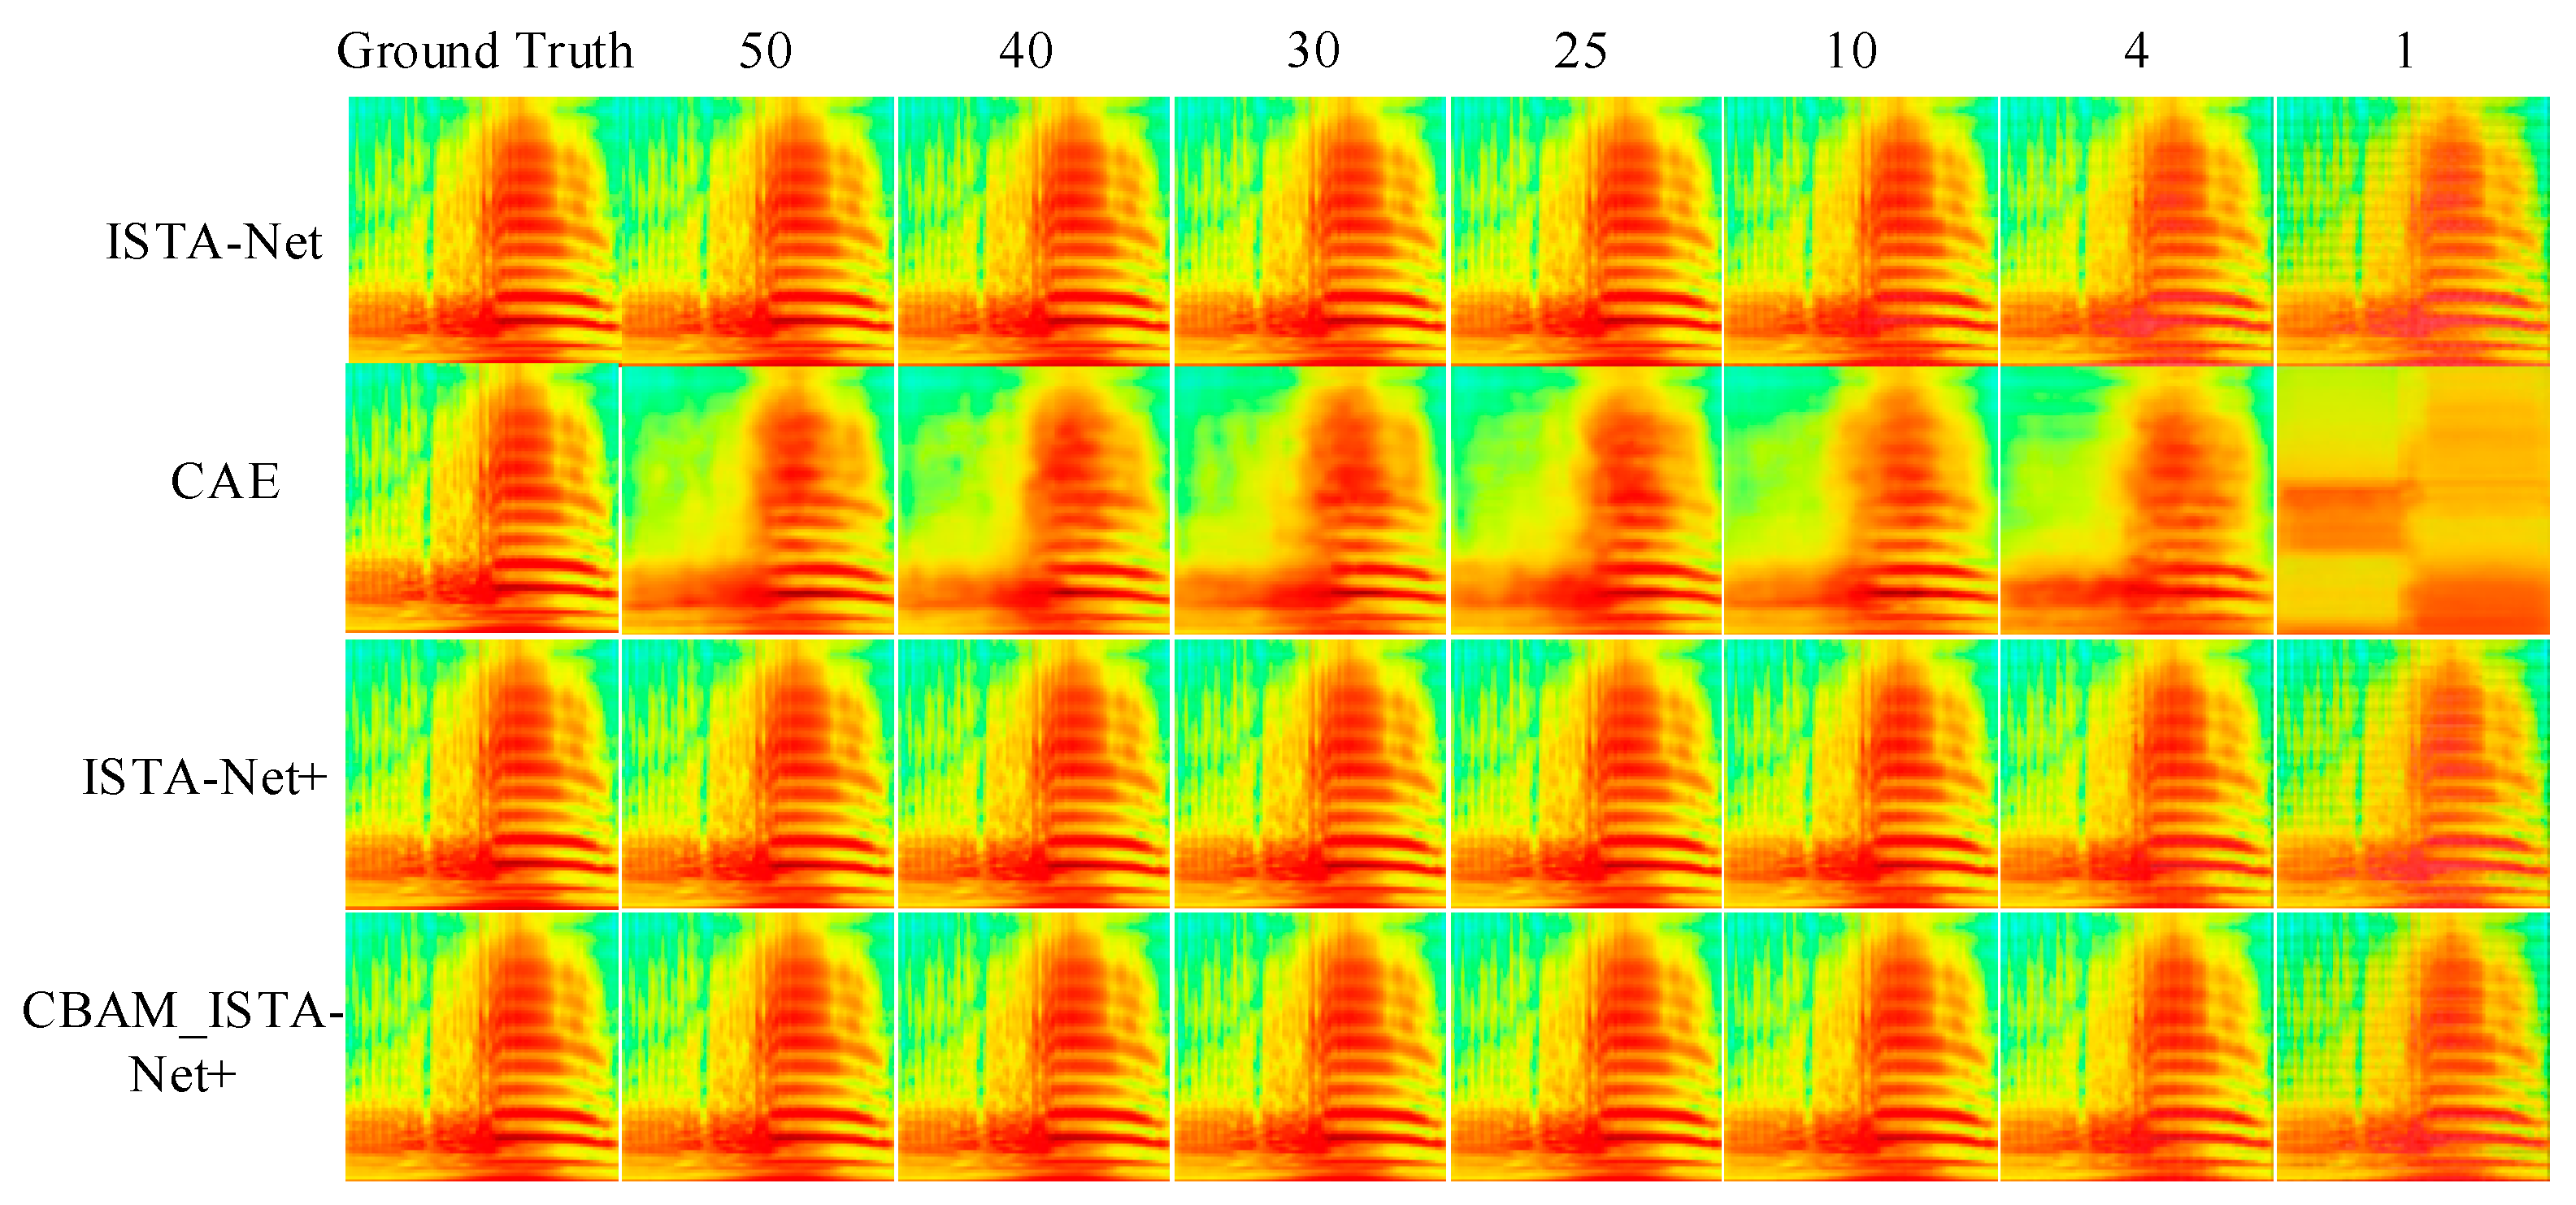
The reconstructed images of bird images and audio wavelet transform spectrograms at different CS ratios are shown in Figure 10 and Figure 11. From the figures, it can be seen that the ISTA-Net reconstructed images are clearer and more realistic, while the CAE reconstructed images are more blurred and distorted. In addition, the CAE reconstructed image becomes indistinguishable at 1%. CBAM_ISTA-Net+ enhances the ability of network to accurately recover important features of the image during reconstruction process, resulting in more details and sharper edges. This confirms the excellent performance of CBAM_ISTA-Net+ in the field of image compressive sensing and reconstruction.
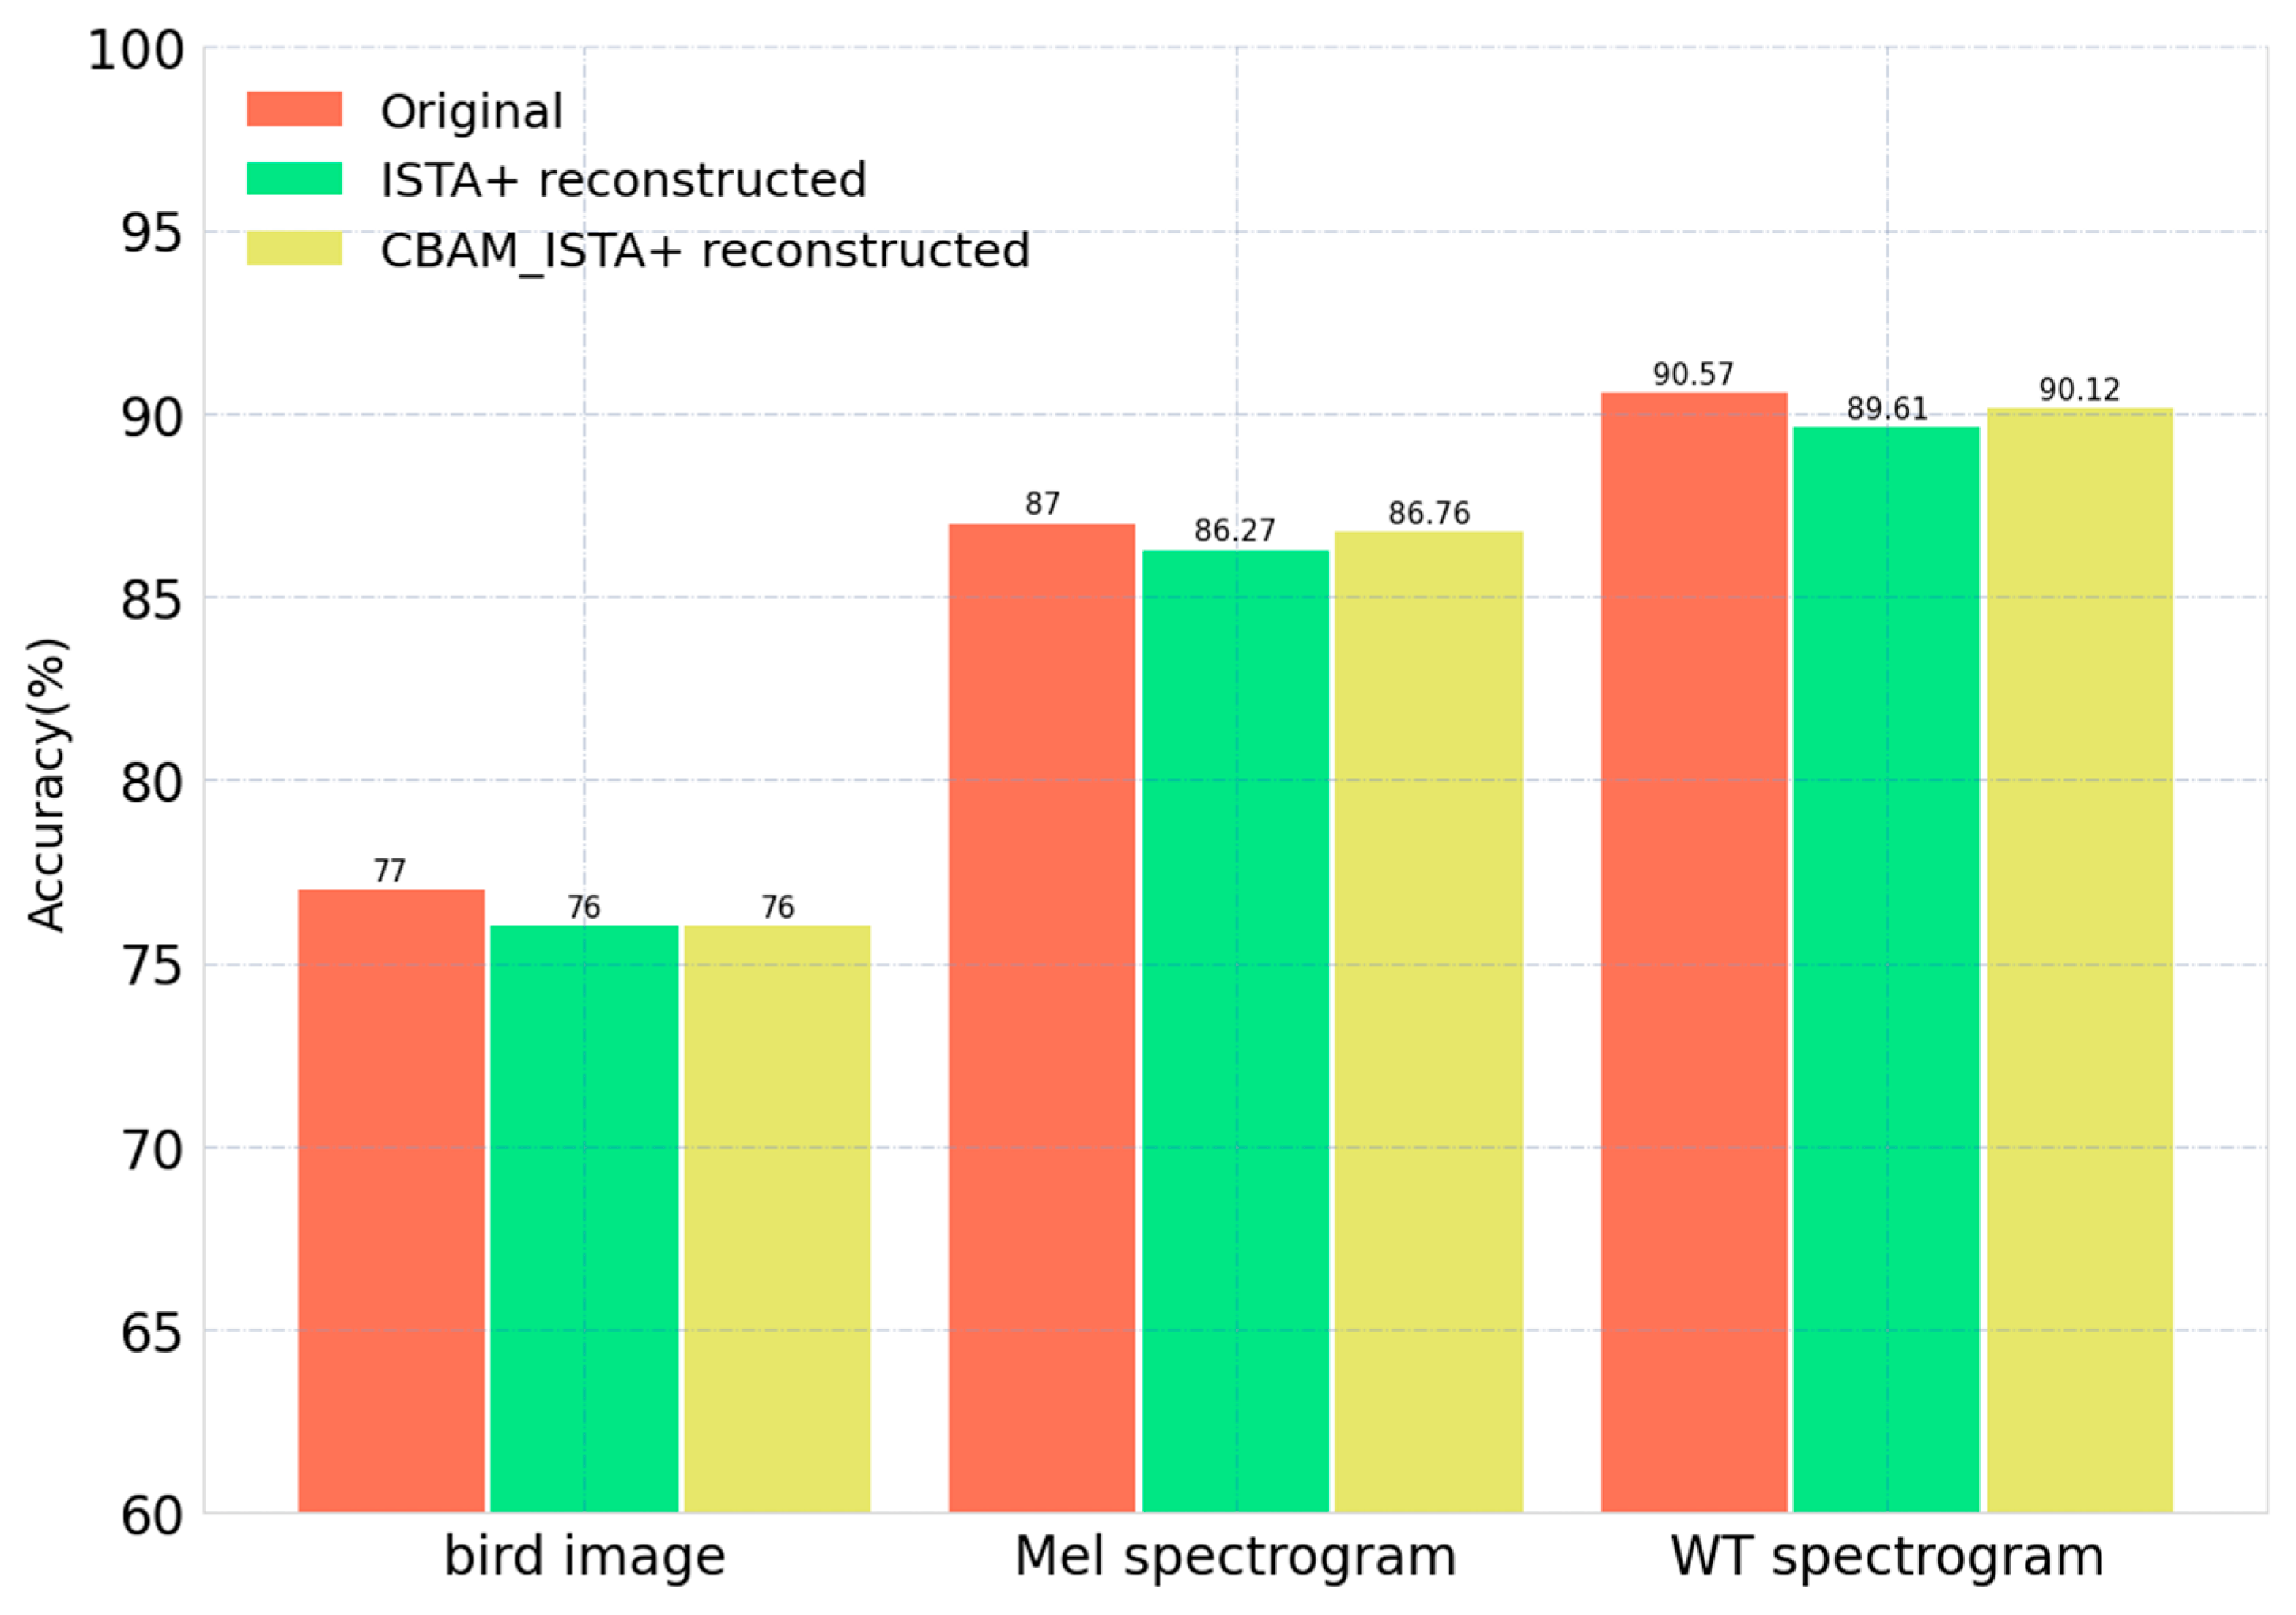
To verify the reconstruction performance of CBAM_ISTA-Net+, Figure 12 shows the classification accuracy of the bird images and spectrograms reconstructed by CBAM_ISTA-Net+ and ISTA_Net+, as well as the classification accuracy of the original image and spectrograms versus the reconstructed images and spectrograms. It can be seen that there is no particular difference in the classification accuracy between the original and reconstructed images. The classification accuracy of the CBAM_ISTA-Net+- and ISTA_Net+-reconstructed bird images is 76%, which is lower than that of original image. Similarly, the classification accuracy of the CBAM_ISTA-Net+-reconstructed Mel spectrograms and WT spectrograms reaches 86.76% and 90.12%, which are only 0.73% and 0.45% lower than those of the original spectrograms, and 0.49% and 0.51% higher than the reconstructed spectrograms of ISTA_Net+. This shows that the CBAM_ISTA-Net+ method not only achieves high-quality compressive reconstruction, but also preserves the semantic information of image and spectrogram. The results of CBAM_ISTA-Net+ show that it can perform pre-tasks for further classification tasks.

5. Conclusions

In this paper, the compression and reconstruction of bird images and audio are studied. Based on ISTA-Net, a dual attention mechanism is introduced and CBAM_ISTA-Net+ is proposed. By adding the attention module, the model can capture spatial and channel features more efficiently and improve the reconstruction accuracy of compressed signals. The CBAM_ISTA-Net+ compression reconstruction experiments are carried out on image and audio spectrogram data of birds. The performance of CBAM_ISTA-Net+ was compared with ISTA-Net, ISTA-Net+, and CAE. The experimental results show that CBAM_ISTA-Net+ achieves a higher PSNR under different compression ratios. In addition, the convolutional neural network (CNN) model is used to classify the original image and the reconstructed image. In the experiments, the classification accuracy of both the original and reconstructed images is high, and that of the reconstructed image is only slightly lower than the original images. This demonstrates that CBAM_ISTA-Net+ can not only achieve high-quality compressive reconstruction but also preserve the semantic information of images and spectrograms. The original images can be restored with a small amount of sparse signals, thus reducing the cost of data acquisition and storage.
While CBAM_ISTA-Net+ has demonstrated a significantly improved performance in compressive reconstruction, it still has some limitations. First, the high computational complexity and time cost of the method in dealing with larger datasets may limit its efficiency in practical applications. Second, although CBAM_ISTA-Net+ can retain the semantic information of images well, the reconstruction quality may be degraded when dealing with noisy data or high compression rates.
In the future works, the model structure needs to be further optimized to reduce the computational complexity and improve the efficiency of processing large-scale datasets. Additionally, the research work can be extended to explore methods for compressive sensing in video or other bioacoustic data.

Author Contributions

Conceptualization, D.L. (Dan Lv) and J.L.; Data curation, D.L. (Dan Lv) and Y.F.; Funding acquisition, Y.Z. and D.L. (Danjv Lv); Investigation, D.L. (Dan Lv) and J.L.; Methodology, D.L. (Dan Lv), Z.L., and Y.Z.; Supervision, Y.Z. and D.L. (Danjv Lv); Validation, Y.F. and D.L. (Danjv Lv); Writing—original draft, D.L. (Dan Lv); Writing—review and editing, Y.Z. and D.L. (Danjv Lv). All authors have read and agreed to the published version of the manuscript.

Funding

This study was supported by the National Natural Science Foundation of China (Grant No.: 32360388, Grant No.31860332, Grant No.31960142).

Institutional Review Board Statement

Not applicable.

Informed Consent Statement

Not applicable.

Data Availability Statement

All data included in this study are available upon request by contact with the corresponding author.

Conflicts of Interest

The authors declare no conflicts of interest. The funders had no role in the design of the study; in the collection, analyses, or interpretation of data; in the writing of the manuscript, or in the decision to publish the results.

References

  1. Cui, J.; Xiao, Z. Progress in bioacoustics monitoring and research of wild vertebrates in China. Biodivers. Sci. 2023, 31, 23023. [Google Scholar] [CrossRef]
  2. Kahl, S.; Wood, C.M.; Eibl, M.; Klinck, H. BirdNET: A deep learning solution for avian diversity monitoring. Ecol. Inform. 2021, 61, 101236. [Google Scholar] [CrossRef]
  3. Shonfield, J.; Bayne, E.M. Autonomous recording units in avian ecological research: Current use and future applications. Avian Conserv. Ecol. 2017, 12, 14. [Google Scholar] [CrossRef]
  4. Hong, Y.; Lu, X.; Zhao, H. Bird diversity and interannual dynamics in different habitats of agricultural landscape in Huanghuai Plain. Acta Ecol. Sin. 2021, 41, 2045–2055. [Google Scholar]
  5. Candès, E.J.; Wakin, M.B. An introduction to compressive sampling. IEEE Signal Process. Mag. 2008, 25, 21–30. [Google Scholar] [CrossRef]
  6. Donoho, D.L. Compressed sensing. IEEE Trans. Inf. Theory 2006, 52, 1289–1306. [Google Scholar] [CrossRef]
  7. Deng, J.; Ren, G.; Jin, Y.; Ning, W. Iterative weighted gradient projection for sparse reconstruction. Inf. Technol. J. 2011, 10, 1409–1414. [Google Scholar] [CrossRef]
  8. Ji, S.; Xue, Y.; Carin, L. Bayesian compressive sensing. IEEE Trans. Signal Process. 2008, 56, 2346–2356. [Google Scholar] [CrossRef]
  9. Mallat, S.G.; Zhang, Z. Matching pursuits with time-frequency dictionaries. IEEE Trans. Signal Process. 1993, 41, 3397–3415. [Google Scholar] [CrossRef]
  10. Qin, J.; Li, S.; Needell, D.; Ma, A.; Grotheer, R.; Huang, C.; Durgin, N. Stochastic greedy algorithms for multiple measurement vectors. arXiv 2017, arXiv:1711.01521. [Google Scholar] [CrossRef]
  11. Liu, J.; Wu, Q.; Amin, M.G. Multi-Task Bayesian compressive sensing exploiting signal structures. Signal Process. 2021, 178, 107804. [Google Scholar] [CrossRef]
  12. Abdelhay, M.A.; Korany, N.O.; El-Khamy, S.E. Synthesis of uniformly weighted sparse concentric ring arrays based on off-grid compressive sensing framework. IEEE Antennas Wirel. Propag. Lett. 2021, 20, 448–452. [Google Scholar] [CrossRef]
  13. Gong, Y.; Shaoqiu, X.; Zheng, Y.; Wang, B. Synthesis of multiple-pattern planar arrays by the multitask Bayesian compressive sensing. IEEE Antennas Wirel. Propag. Lett. 2021, 20, 1587–1591. [Google Scholar] [CrossRef]
  14. Fang, L.; Wang, C.; Li, S.; Rabbani, H.; Chen, X.; Liu, Z. Attention to lesion: Lesion-aware convolutional neural network for retinal optical coherence tomography image classification. IEEE Trans. Med. Imaging 2019, 38, 1959–1970. [Google Scholar] [CrossRef] [PubMed]
  15. Li, Z.; Peng, C.; Yu, G.; Zhang, X.; Deng, Y.; Sun, J. Detnet: A backbone network for object detection. arXiv 2018, arXiv:1804.06215. [Google Scholar]
  16. Pan, Z.; Qin, Y.; Zheng, H.; Hou, L.; Ren, H.; Hu, Y. Block compressed sensing image reconstruction via deep learning with smoothed projected Landweber. J. Electron. Imaging 2021, 30, 041402. [Google Scholar] [CrossRef]
  17. Zhou, S.; He, Y.; Liu, Y.; Li, C.; Zhang, J. Multi-channel deep networks for block-based image compressive sensing. IEEE Trans. Multimed. 2020, 23, 2627–2640. [Google Scholar] [CrossRef]
  18. Zhang, X.; Lian, Q.; Yang, Y.; Su, Y. A deep unrolling network inspired by total variation for compressed sensing MRI. Digit. Signal Process. 2020, 107, 102856. [Google Scholar] [CrossRef]
  19. Kulkarni, K.; Lohit, S.; Turaga, P.; Kerviche, R.; Ashok, A. Reconnet: Non-iterative reconstruction of images from compressively sensed measurements. In Proceedings of the IEEE Conference on Computer Vision and Pattern Recognition, Las Vegas, NV, USA, 27–30 June 2016; pp. 449–458. [Google Scholar]
  20. Yao, H.; Dai, F.; Zhang, S.; Zhang, Y.; Tian, Q.; Xu, C. Dr2-net: Deep residual reconstruction network for image compressive sensing. Neurocomputing 2019, 359, 483–493. [Google Scholar] [CrossRef]
  21. He, K.; Zhang, X.; Ren, S.; Sun, J. Deep residual learning for image recognition. In Proceedings of the IEEE Conference on Computer Vision and Pattern Recognition, Las Vegas, NV, USA, 27–30 June 2016; pp. 770–778. [Google Scholar]
  22. Yang, Y.; Sun, J.; Li, H.; Xu, Z. ADMM-Net: A deep learning approach for compressive sensing MRI. arXiv 2017, arXiv:1705.06869. [Google Scholar]
  23. Zhang, J.; Ghanem, B. ISTA-Net: Interpretable optimization-inspired deep network for image compressive sensing. In Proceedings of the IEEE Conference on Computer Vision and Pattern Recognition, Salt Lake City, UT, USA, 18–22 June 2018; pp. 1828–1837. [Google Scholar]
  24. Shi, W.; Jiang, F.; Liu, S.; Zhao, D. Image compressed sensing using convolutional neural network. IEEE Trans. Image Process. 2019, 29, 375–388. [Google Scholar] [CrossRef] [PubMed]
  25. Zhang, Z.; Liu, Y.; Liu, J.; Wen, F.; Zhu, C. AMP-Net: Denoising-based deep unfolding for compressive image sensing. IEEE Trans. Image Process. 2020, 30, 1487–1500. [Google Scholar] [CrossRef] [PubMed]
  26. Chen, B.; Zhang, J. Content-aware scalable deep compressed sensing. IEEE Trans. Image Process. 2022, 31, 5412–5426. [Google Scholar] [CrossRef] [PubMed]
  27. Sun, Y.; Chen, J.; Liu, Q.; Liu, B.; Guo, G. Dual-path attention network for compressed sensing image reconstruction. IEEE Trans. Image Process. 2020, 29, 9482–9495. [Google Scholar] [CrossRef] [PubMed]
  28. Song, J.; Mou, C.; Wang, S.; Ma, S.; Zhang, J. Optimization-inspired cross-attention transformer for compressive sensing. In Proceedings of the IEEE/CVF Conference on Computer Vision and Pattern Recognition, Vancouver, BC, Canada, 18–22 June 2023; pp. 6174–6184. [Google Scholar]
  29. Geng, C.; Jiang, M.; Fang, X.; Li, Y.; Jin, G.; Chen, A.; Liu, F. HFIST-Net: High-throughput fast iterative shrinkage thresholding network for accelerating MR image reconstruction. Comput. Methods Programs Biomed. 2023, 232, 107440. [Google Scholar] [CrossRef]
  30. Cui, W.; Wang, X.; Fan, X.; Liu, S.; Gao, X.; Zhao, D. Deep Network for Image Compressed Sensing Coding Using Local Structural Sampling. ACM Trans. Multimed. Comput. Commun. Appl. 2024, 20, 1–22. [Google Scholar] [CrossRef]
  31. Wang, H.; Li, H.; Jiang, X. DMFNet: Deep matrix factorization network for image compressed sensing. Multimed. Syst. 2024, 30, 191. [Google Scholar] [CrossRef]
Figure 1. Some bird images, Mel spectrograms, and WT spectrograms.
Applsci 14 08680 g001
Figure 2. Framework diagram of this paper.
Applsci 14 08680 g002
Figure 3. Data preprocessing process.
Applsci 14 08680 g003
Figure 4. ISTA-Net+ framework.
Applsci 14 08680 g004
Figure 5. Schematic diagram of the kth stage of CBAM_ISTA-Net+.
Applsci 14 08680 g005
Figure 6. Channel attention model.
Applsci 14 08680 g006
Figure 7. Spatial attention model.
Applsci 14 08680 g007
Figure 8. CAE network structure.
Applsci 14 08680 g008
Figure 9. PSNR of the three datasets in CAE, ISTA-Net, ISTA-Net+, and CBAM_ISTA-Net+.
Applsci 14 08680 g009
Figure 10. Reconstruction of four reconstruction methods on bird images.
Applsci 14 08680 g010
Figure 11. Reconstruction of four reconstruction methods on WT spectrograms.
Applsci 14 08680 g011
Figure 12. Comparison of classification performance before and after reconstruction.
Applsci 14 08680 g012
Table 1. CNN model structural parameters.
LayerNameTypeKernel SizeStrideInput Size
1Conv InputInput Layer--224 × 224 × 3
2Conv1Convolution2D3 × 31224 × 224 × 3
3Pool1MaxPool2D2 × 22112 × 112 × 64
4Conv2Convoltion2D3 × 31112 × 112 × 64
5Pool2MaxPool2D2 × 2256 × 56 × 128
6-Flatten--56 × 56 × 128
7Fc1Linear--128 × 56 × 56
8Fc2Linear--256
9-Output--
Table 2. Comparison of the average PSNR (dB) performance of various networks on bird images and spectrograms.
DatasetMethodsCS RatioTime
50%40%30%25%10%4%1%GPU
Bird imageCAE21.5821.3721.3121.1520.6319.8016.360.0039 s
ISTA-Net32.3630.2728.2027.5822.7420.6517.150.054 s
ISTA-Net+33.3131.4829.5428.4223.9320.0716.990.058 s
CBAM_ISTA-Net+33.6231.7729.8028.6824.1220.4417.310.061 s
Mel
spectrogram
CAE23.1322.9222.5122.4121.6420.6517.290.0137 s
ISTA-Net38.6837.1835.8834.2229.7024.8519.470.1046 s
ISTA-Net+47.0041.1539.8937.7629.1424.2019.690.1104 s
CBAM_ISTA-Net+55.7653.5846.2740.4029.6724.6819.840.079 s
WT
spectrogram
CAE21.8221.7021.6821.6121.3720.3616.460.0216 s
ISTA-Net35.0034.1332.5131.4426.7224.3419.330.1072 s
ISTA-Net+38.3136.2933.6632.4427.3023.9219.840.1119 s
CBAM_ISTA-Net+38.5936.4133.8932.6328.7024.0920.510.1185 s
Table 3. Comparison of the average PSNR (dB) performance on Set11 and BSD68 datasets.
DatasetAlgorithmCS Ratio
50%40%30%25%10%4%1%
Set11ISTA-Net [23]37.4335.3632.9131.5325.8021.2317.30
ISTA-Net+38.0136.0433.7332.4026.5121.5717.21
CBAM_ISTA-Net+38.1336.0833.8332.5726.7521.6917.32
BSD68ISTA-Net [23]33.6031.8529.9329.0725.0222.1219.11
ISTA-Net+34.0132.1730.3429.2925.3222.3819.03
CBAM_ISTA-Net+34.1232.2730.3929.3625.4522.4219.09
Disclaimer/Publisher’s Note: The statements, opinions and data contained in all publications are solely those of the individual author(s) and contributor(s) and not of MDPI and/or the editor(s). MDPI and/or the editor(s) disclaim responsibility for any injury to people or property resulting from any ideas, methods, instructions or products referred to in the content.