1. Introduction
With the rapid development of electric technology and the increase in environmental awareness, electric vehicles (EVs), as an advanced transportation tool with environmental and energy benefits, have been adopted worldwide. Recognizing these advantages, many local governments have strongly encouraged the adoption of electric taxis [
1]. To further accelerate the adoption of EVs, they have implemented them in bus transit and taxi areas. According to Shanghai Municipal Development & Reform Commission, the taxi industry cumulatively updated over 22,000 electric taxis by the end of 2022 [
2]. Similar adjustments and the optimization of the transportation energy structure have also been adopted in cities across China and Europe [
3,
4].
Numerous constraints have hindered the widespread adoption of EVs, one of which is the inability to meet charging requirements [
5]. Despite advancements in battery efficiency, it is unlikely that electric taxis will only require a single recharge outside of working hours in the foreseeable future due to their long travel distances and limited battery capacities [
6]. In contrast to traditional taxis, which can be refueled within minutes, the recharging process for electric taxis can extend to as long as an hour. Although a battery exchange takes approximately 20 min, this is not widely adopted [
7,
8]. This prolonged cycle underscores the importance of prudent charging station deployment. To address spatial and temporal charging demands, the deployment of a charging infrastructure at an appropriate scale and with an appropriate spatial distribution has garnered attention [
9,
10,
11]. A large number of studies have focused on the deployment of charging stations for EVs in general, not specifically related to electric taxis [
12,
13]. Acknowledging both the similarities and differences in various EV uses, the core research processes employed in the field of charging station deployment can indeed be borrowed and adapted. Researchers have dedicated efforts to developing methodologies for EV charging station deployment through the optimization or data-driven approaches [
10,
14].
In recent decades, optimization has been the predominant approach to EV charging station deployment [
11,
15,
16,
17]. Given that optimizing the location and scale of EV charging stations inherently poses a non-convex problem formulation, the Genetic Algorithm (GA) has emerged as a prevalent tool in optimizing charging station deployment with the aim of minimizing total costs or maximizing the covered demand [
18,
19,
20,
21,
22]. Huang and Kockelman [
23] incorporated factors such as charging price elasticity, travel times, and on-site charging queues into their GA framework to maximize profit. Furthermore, Zhang et al. [
24] optimized expressway charging stations with a bilevel model and GA, minimizing costs and fostering the adoption of battery electric vehicles. Dandan et al. [
25] developed heuristic algorithms using two types of greedy algorithm for multi-period deployment optimization. In addition to GA, other optimization algorithms have also been explored and various Machine Learning (ML) algorithms have also been widely used in the charging station deployment problem [
26]. Zhao et al. [
27] formulated this problem as a finite Markov decision process in a reinforcement learning framework, employing a recurrent neural network. Several studies have applied the Particle Swarm Optimization (PSO) algorithm to minimize total costs while considering both energy grid loss and charging service coverage [
15,
16,
28,
29]. Moreover, Payam et al. [
30], Qiang et al. [
31], and Xu and Meng [
32] developed Integer Linear Program (ILP)-solvers to address various optimization objectives, including minimizing energy and customer losses, and maximizing path flow coverage.
Numerous studies have focused on utilizing data-driven approaches to find the optimal deployment of charging stations. To maximize realism and streamline research, the queuing theory has been introduced into such investigations. Specifically, queuing models are frequently employed to analyze delay performance [
33,
34,
35]. The standard queuing system is typically represented by A/B/C/K/N/D, where A denotes the arrival time distribution, B represents the service time distribution, C indicates the number of servers, K signifies queue capacity (sometimes considered to be infinite), N represents the population of customers (often assumed to be infinite), and D signifies the service discipline, typically First Come First Served (FCFS) [
9,
14,
36]. One of the most commonly used queuing models is the M/M/s/N model, which uses a finite queuing length constraint with an equal amount of charging piles in each station, where both the arrival rate and the service rate are assumed to have a Poisson distribution [
31]. Furthermore, Jie et al. [
10] determined the charging demand and charging station candidates for queuing simulation by using regression and logarithmic transformation. An alternative path to enhance realism and optimize research efficiency involves gridding the map [
11,
37]. Payam et al. [
30] aimed to reduce energy loss for EVs and the grid by determining the optimal location and size of the charging stations. Meanwhile, Tao et al. [
38] conducted an empirical study that combines charging convenience, charging cost, and charging time into a simplified single-objective optimization framework with limited deployment options.
In summary, a notable limitation of the current methodologies lies in their reliance on the assumption of an infinite supply of charging piles, neglecting the potential impact of waiting delays. Thus, the optimization of charging station deployment for electric taxis, with a focus on service quality, has been insufficiently addressed [
17]. Most research endeavors have centered on maximizing either total costs or demand coverage, with service-related factors, such as customer loss, often being marginalized and monetized for optimization purposes. To meet future electric taxi charging demands, this empirical study aims to optimize the deployment of charging stations to enhance service quality by reducing waiting times and the potential number of unserved taxis. A heuristic algorithm known as Improved K-means iterated with Queuing Theory (IKQT) is proposed for the charging deployment planning process. Trajectory data from Shanghai Qiangsheng Taxi’s GPS tracking from April 2018 are utilized for model validation.
2. Methodology
To properly implement charging infrastructures that meet the charging demands of electric taxis, this paper proposes a heuristic algorithm, IKQT, to optimize the deployment plan. The IKQT algorithm initiates the deployment plan using a K-means algorithm considering the taxi travel demand [
39]. Based on this initial plan, the waiting time before charging at each charging station is calculated utilizing the M/M/s queuing model. Subsequently, this waiting time is converted into extra weights for the K-means estimation, aiming to refine the deployment plan through iterations. The IKQT processing steps are illustrated in
Figure 1. The detailed steps and instructions for the IKQT are indicated as follows.
2.1. Initialization and Demand Classification
The maximum number of iterations n, the number of charging stations, and the number of chargers at each station are predetermined. The travel demand is classified into distinct categories to estimate the charging demand. In this algorithm, the charging demand is categorized based on the taxi’s total daily travel distance, dividing taxis into four groups: those with a travel distance less than 200 km, those with a travel distance ranging from 200 to 300 km, those with a travel distance ranging from 300 to 400 km, and those with a travel distance of more than 400 km. Taxis traveling over 200 km are regarded as the potential users of the charging stations. Then, a list of IDs is generated, with each ID being randomly sampled according to the charging demands. Based on this list of IDs, demand data are extracted randomly from all taxi services. The latitudes and longitudes of the destinations in the demand data serve as the input demand points for the IKQT algorithm.
2.2. Generate Initial Deployment Plan via K-Means Method (i = 0)
The initial deployment locations for charging stations are generated utilizing the K-means algorithm, based on the input demand points. K-means is a mature clustering algorithm that is used to locate the k centroids among a large number of random points using Euclidean distance. The identified centroids from the K-means algorithm subsequently serve as the candidate locations for the charging stations.
For this particular study, each candidate location was allocated a fixed number of chargers, specifically 20 charging piles. This provisioning ensures that each charging station has the capacity to meet the anticipated charging demands of the surrounding area. Additionally, each charging station was associated with a corresponding set of charging demand points, tailored to meet the anticipated charging demands.
2.3. Calculate Charging Waiting Time for Each Charging Station via Queuing Theory
Given the initial charging station deployment plan, the K-means clustering results were directly translated into the electric taxi charging selection plan of the charging stations. The charging demand for each of these charging stations was determined by the centroid label assigned to each demand point. To assess the performance of these charging stations, an M/M/s queueing model was employed to calculate the estimated charging waiting time for each station. In this context, the arrival rate of electric taxis seeking to charge was modeled using a Poisson distribution, with the mean number of arrivals in a 12-h daytime interval based on the number of demand points covered by each station. When taxis arrive at a charging station, they are assumed to choose to enter the shortest queue.
Based on the fact that direct current fast chargers take up to one hour to fully charge electric taxis, the service rate was set to a normal distribution with a range from 30 to 60 min, reflecting the variability in charging times due to factors such as battery condition and charger efficiency. Taxi drivers were assumed to charge their vehicles when there are no customers nearby and the battery power falls below 50%. The queueing model also assumed an infinite queue capacity and an infinite population of customers (electric taxis) and followed the FCFS service discipline.
The simulation process, implemented using a queueing tool in Python, considered the fact that each charging station is equipped with 20 chargers (s = 20). The output of the queuing model simulation included two key pieces of information: whether each simulated charging demand was fulfilled, and the waiting time for each vehicle.
2.4. Estimate the Service Quality Weights for Each Charging Station
Due to the limited number of charging piles at each station and the uneven distribution of charging demand, waiting times at different charging stations may vary. In order to incorporate charging waiting time into the deployment optimization plan, a weight calculation method is proposed in Equation (1). The major indicators considered are charging service waiting time and the number of unserved taxis, which implies that taxis cannot commence charging during daytime queuing simulations. The weight assigned to each charging station was designed to have a minimum value of 1.
where
i is the
ith charging station;
Weighti is the weight of
ith charging station;
wi is the average waiting time of charging service in ith charging station;
nsi is the total number of unserved taxis in
ith charging station;
α and
β are empirical parameters;
α represents the relative importance of average waiting time in determining the overall service quality of a charging station. A higher value of
α indicates that reducing the waiting time is more important to drivers;
β represents the relative importance of the total number of unserved taxis in determining the overall service quality. A higher value of
β indicates that minimizing the number of unserved taxis is more important to drivers.
2.5. Update Charging Station Deployment Plan via Weighted K-Means Method (i < n)
In this step, the iteration number for the IKQT was set to n. The calculated weights were assigned back to the corresponding charging station candidates. The improved K-means algorithm begins with centroids from the previous K-means iteration or improved K-means iteration, and weighted distance was determined by multiplying the Euclidean distance by the weight of each corresponding charging station. The improved K-means loop for clustering demand points to the location of new centroids; this continues until the stopping requirement of the improved K-means algorithm is met. The same set of demand points was input into the improved K-means algorithm, and updated charging station locations associated with the corresponding set of charging demand points were generated. If i < n, step 2 was repeated; otherwise, the IKQT process was terminated.
The final results contained two main components: firstly, a compilation of the results from each iteration of the queuing model simulation; secondly, the deployment of charging station candidates as determined by the last iteration of the improved K-means algorithm.
3. Case Study
Data Source and Preparation
To validate the proposed IKQT algorithm, the Shanghai Qiangsheng Taxi GPS tracking trajectory data acquired during April 2018 were used in this case study. The Shanghai Qiangsheng Taxi Company in China, a major public transit provider, operated approximately 11,000 taxis, which constituted 25% of the total taxi fleet in Shanghai. The data were collected through the GPS installed in each Qiangsheng taxi. The GPS trajectory data, with a sampling interval of approximately 10 s, included detailed information such as taxi ID, vehicle service status, timestamps, and vehicle latitude and longitude.
Data preprocessing was conducted to extract demand data for further analysis. This involved removing abnormal data caused by either human error (e.g., accidental start or end button presses) or technical errors resulting in incomplete or inaccurate service data. The filtering criteria included no missing items in the data, a minimum of four GPS satellites available at any given time, and an average speed between two consecutive track points not exceeding 140 km/h. Approximately 4.9% of the trajectory data was filtered out based on these criteria, resulting in a remaining service quantity of 6,770,383.
Another aspect of data preprocessing involved identifying each taxi’s charging demands by calculating their maximum daily travel distance. According to the information provided by the Shanghai electric taxi company in 2020, electric taxis can travel approximately 350 to 400 km on a full battery charge. However, taxi drivers had flexibility in choosing their charging times based on remaining battery power and the availability of nearby passengers. This study focused on daytime charging demands, assuming one night-time charge after work hours as the default behavior.
Taxis IDs were then grouped based on their maximum daily travel distance, which leads to different charging demands: Group 1 comprised taxi IDs with distances ranging from 200 to 300 km and had a 25% probability of requiring charging; Group 2 consisted of taxi IDs with distances from 300 to 400 km and had a 50% probability of needing charging; and Group 3 included taxi IDs with distances exceeding 400 km, requiring one daytime charge.
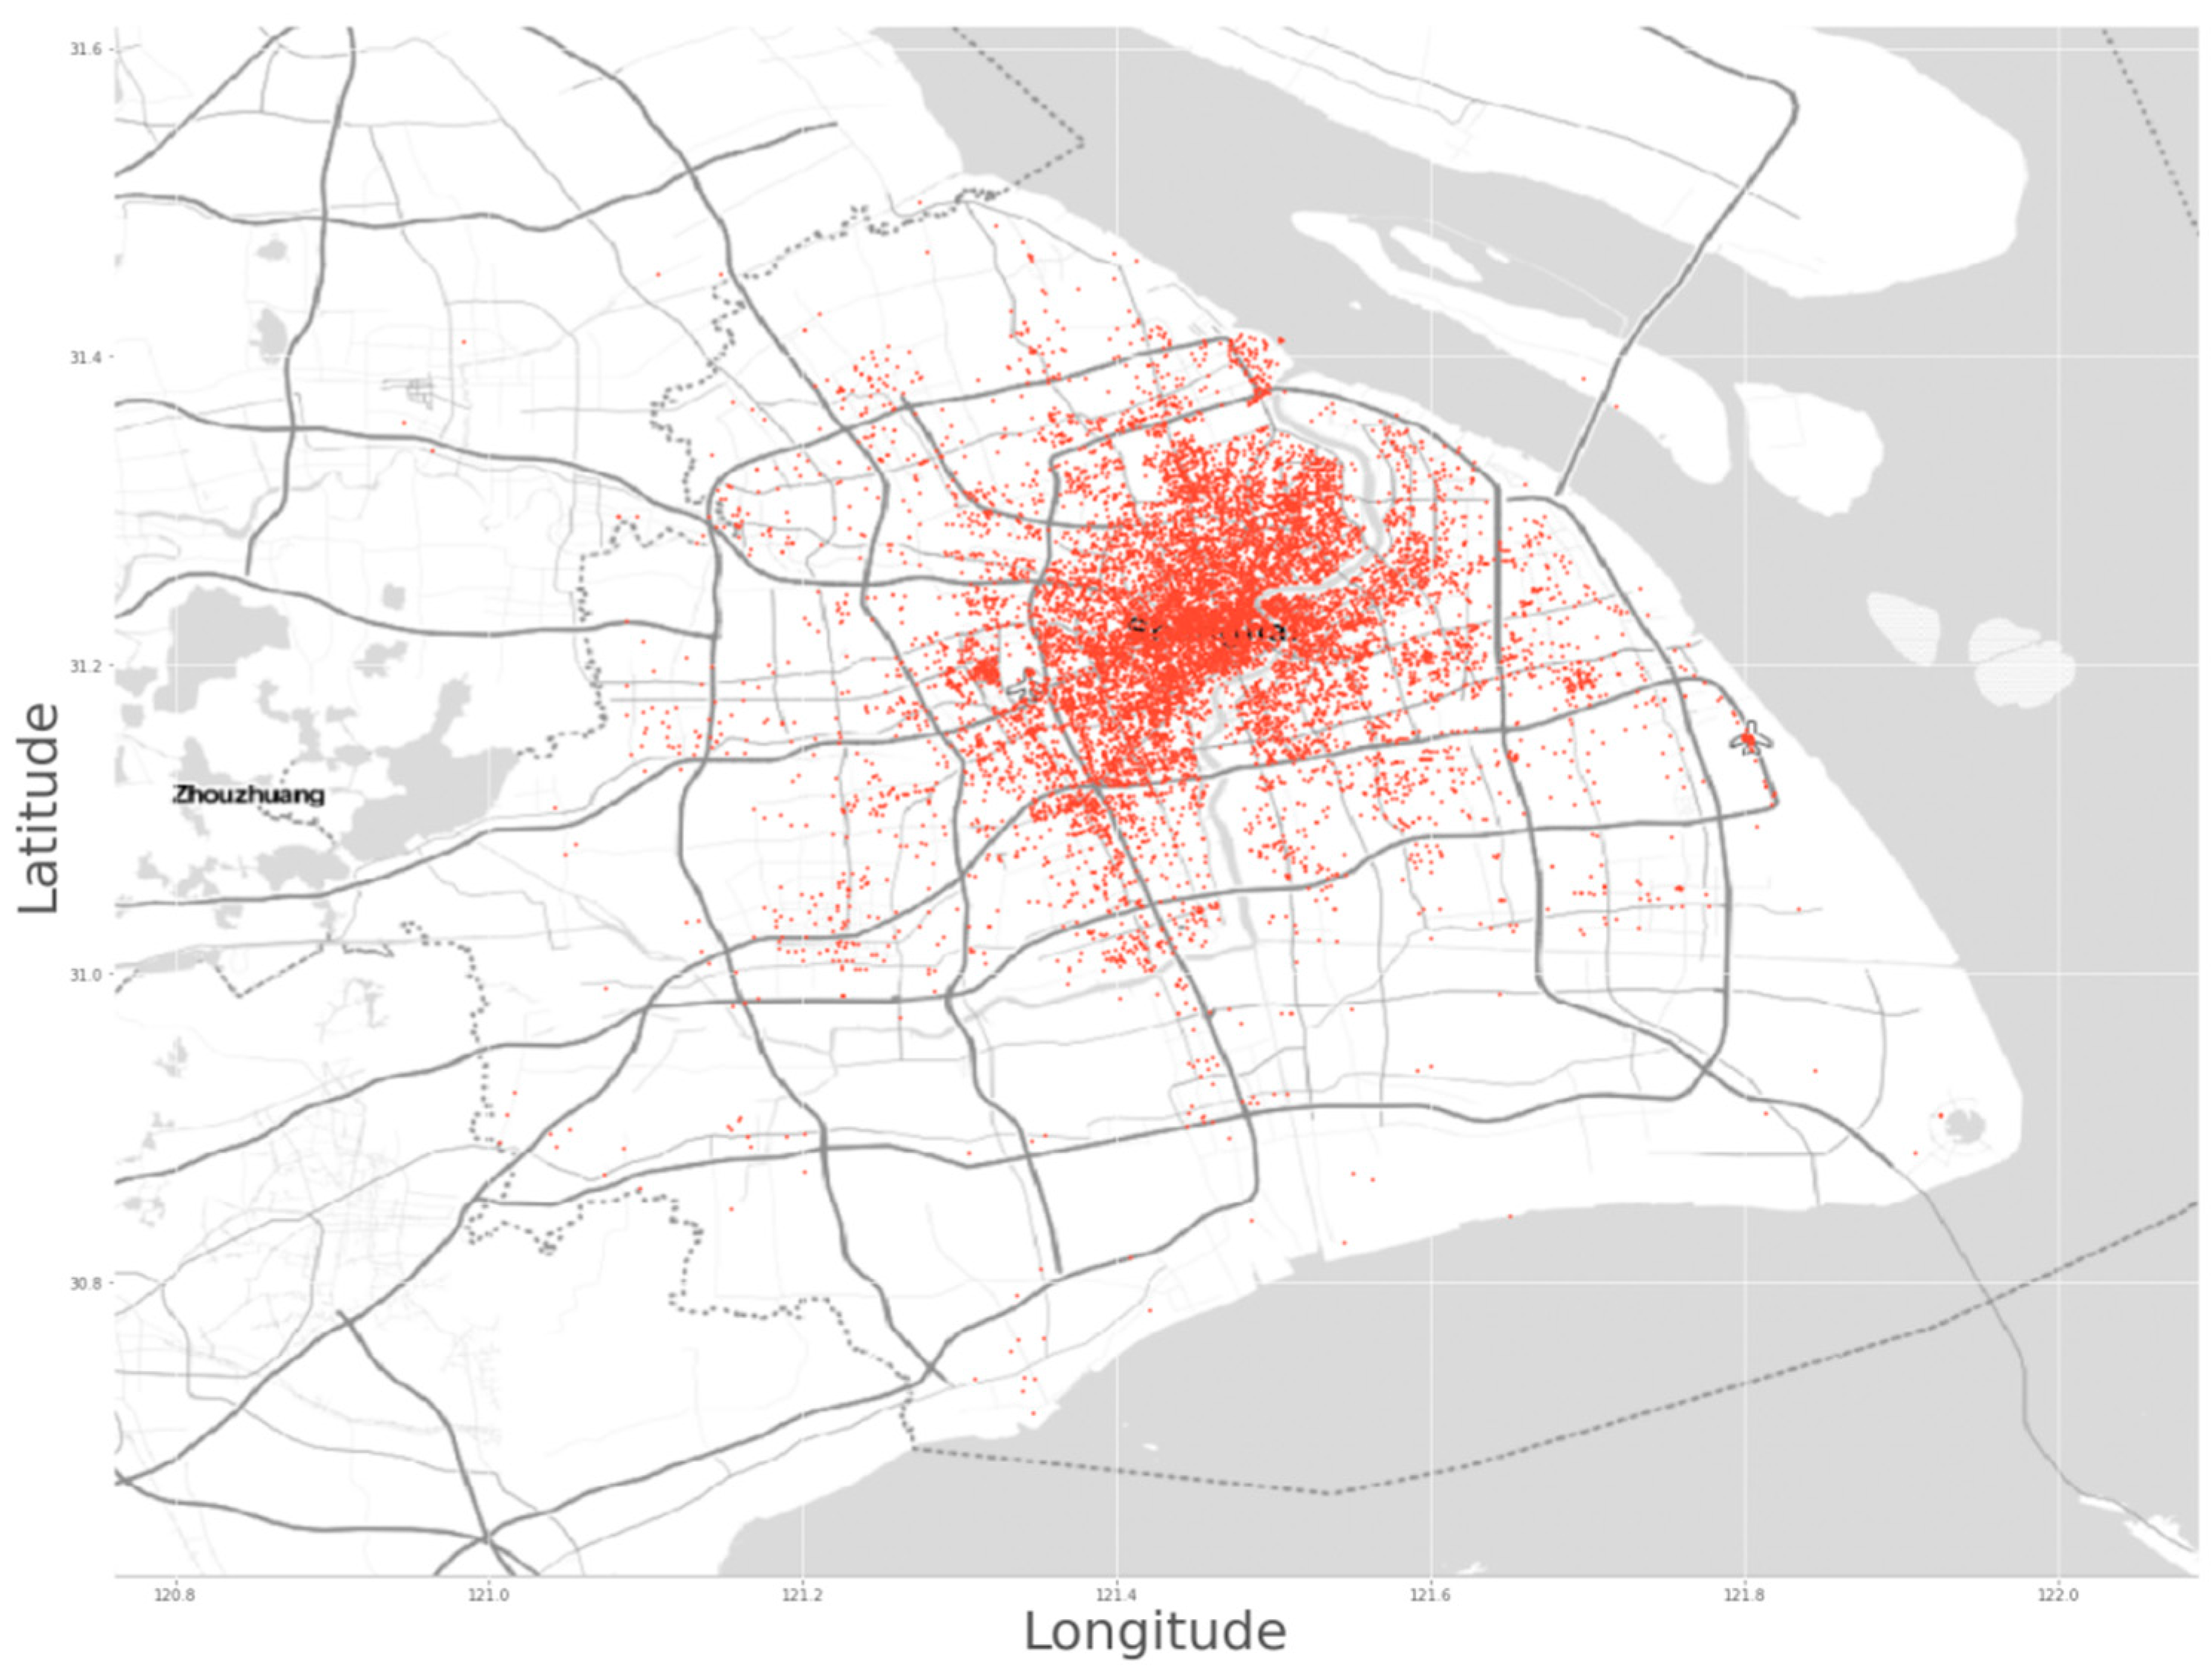
The next step was converting the taxi IDs into the charging demand points. A list of taxi IDs was randomly extracted from the total travel demand, with sampling probabilities tailored to each group: 25% for Group 1, 50% for Group 2, and 100% for Group 3. This resulted in a sample of 15,760 services, reflecting the anticipated daytime charging demands.
Following this, charging demand points were randomly sampled among all services based on the list of taxi IDs. The latitudes and longitudes of the service destinations in the service data served as the input charging demand points for the IKQT and are presented in
Figure 2. The background of Shanghai map in
Figure 2 was captured from an online Geographic Information System (GIS) platform, utilizing the tool’s ability to retrieve and visualize geospatial data based on specific latitude and longitude coordinates.
4. Results and Analysis
The processing and analysis of the charging demand data, as well as the selection of charging station candidates, were conducted using Python. As the total number of charging demand points was 15,760 and the model settings allowed a maximum of 20 chargers per charging station, with a service rate uniformly distributed between 30 and 60 min, the number of charging station candidates was strategically designed to be 80. These 80 stations, in theory, have the capacity to serve up to about 25,600 charging demands (considering 20 chargers per station, times 80 stations, times a conservative estimate of 12 h during daytime, and assuming an average service time of 45 min).
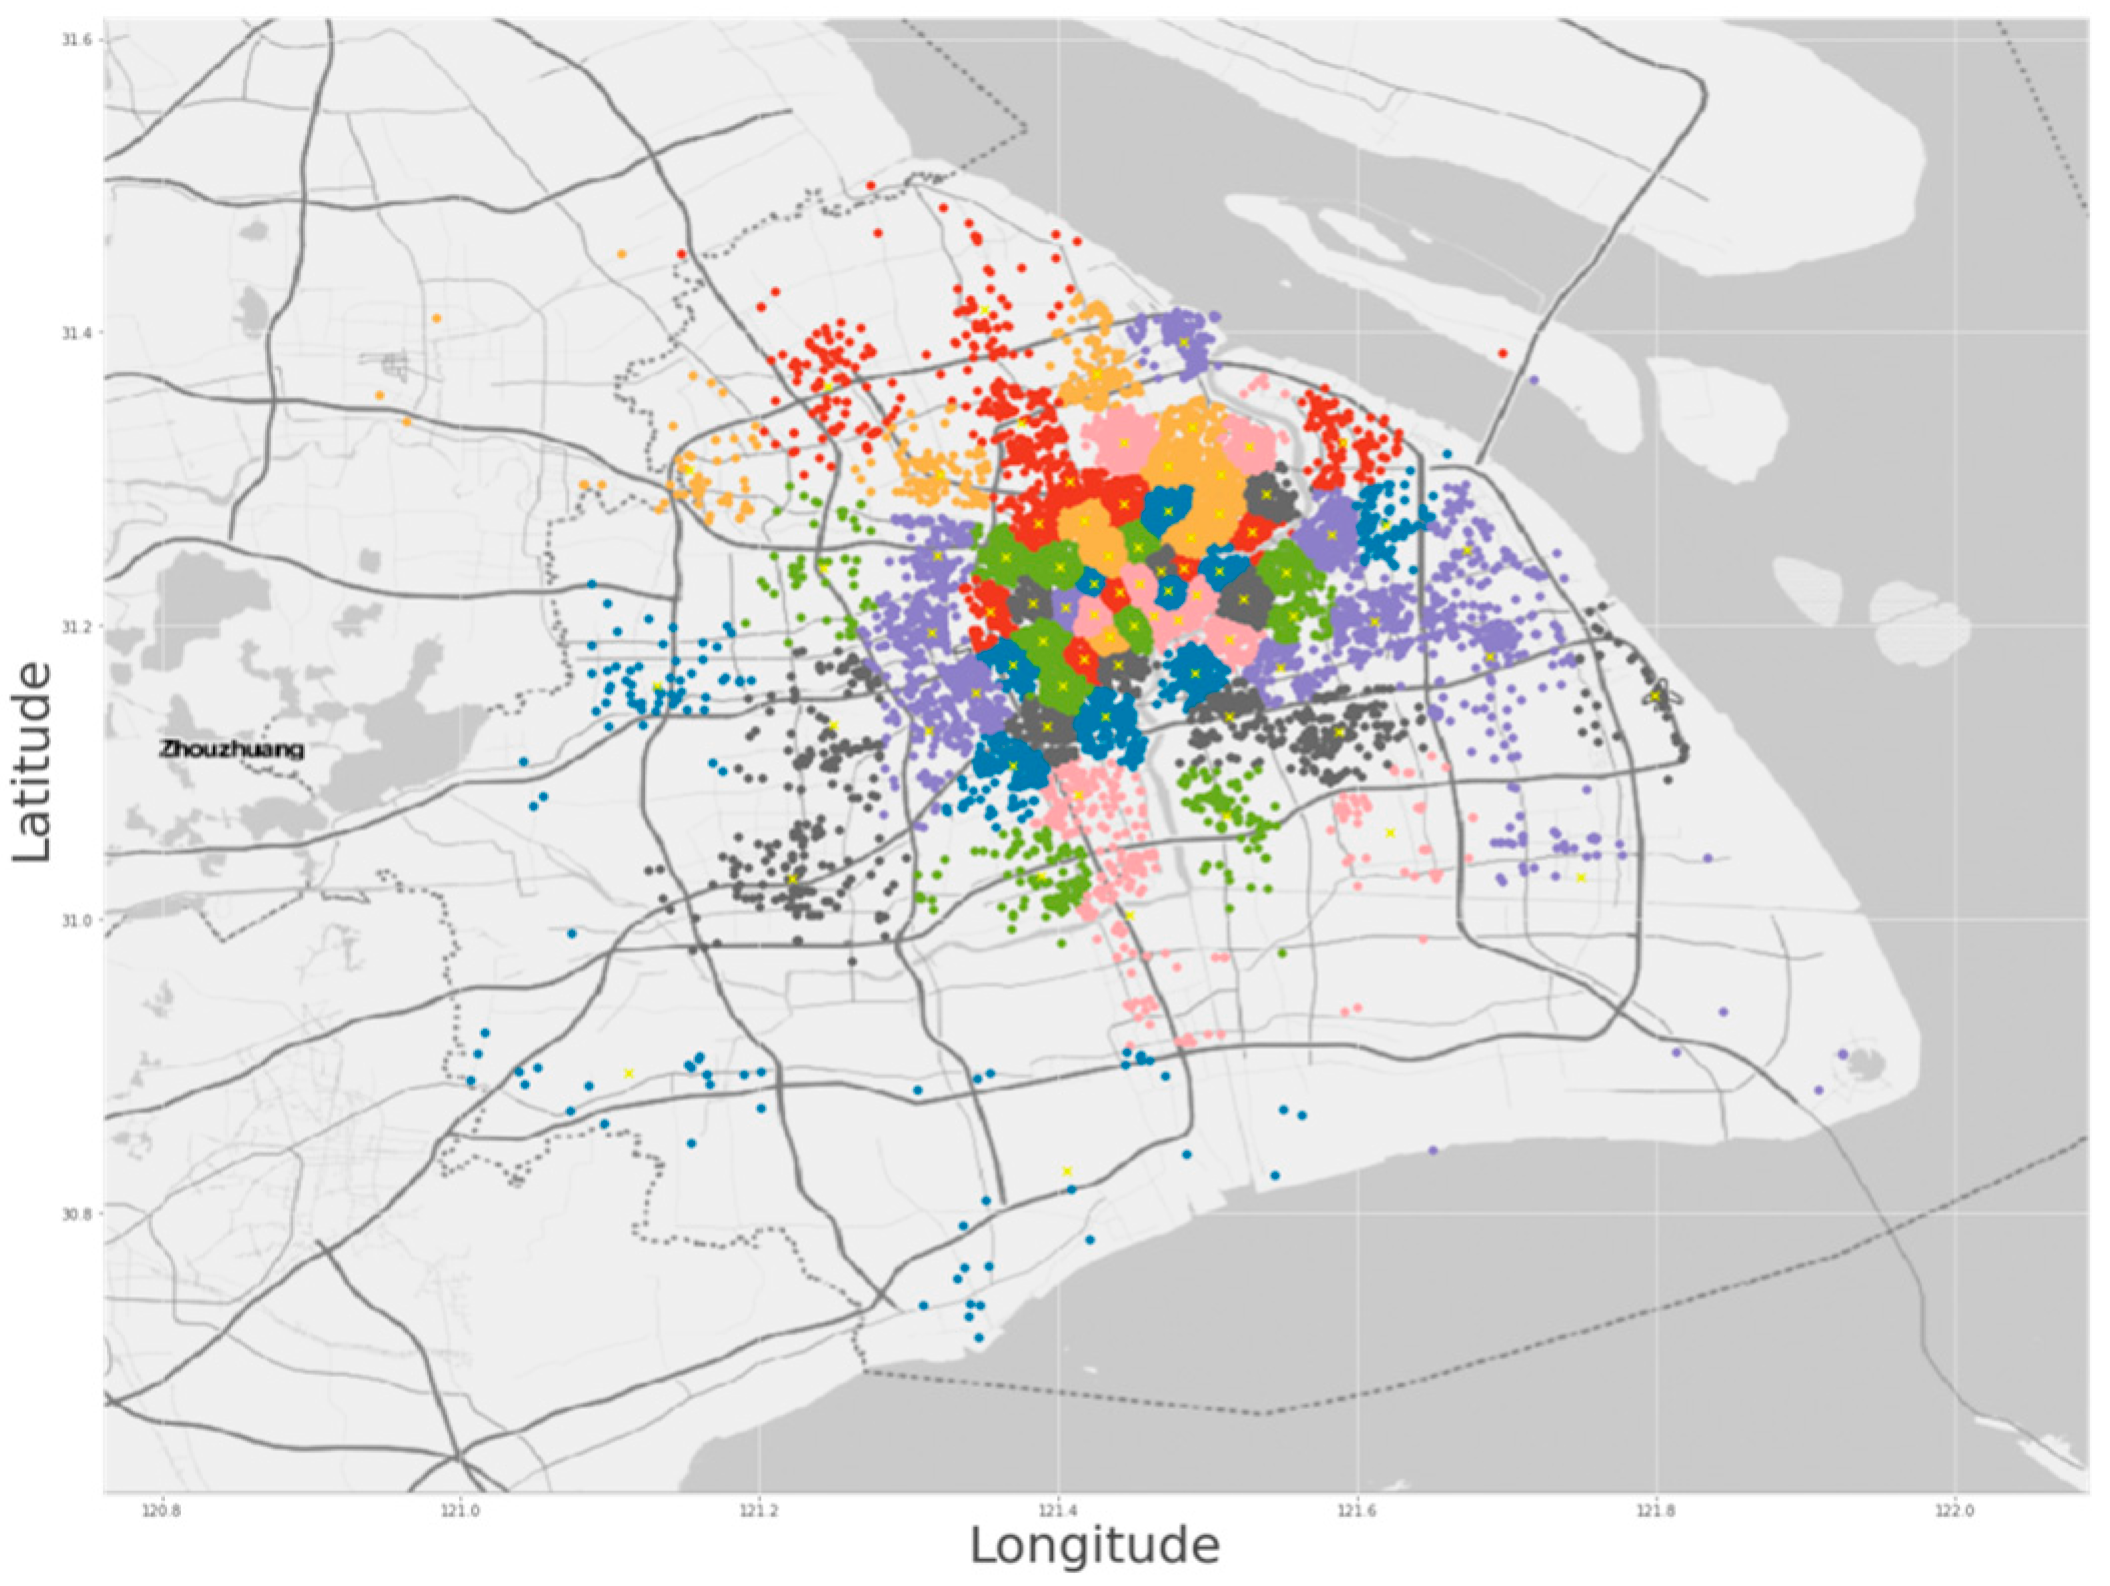
The initial solutions generated by the K-means algorithm are shown in
Figure 3, where the yellow cross marks indicate the exact deployment locations of the charging stations. Points sharing the same color in the vicinity of each cross represent the corresponding demand points associated with those charging stations.
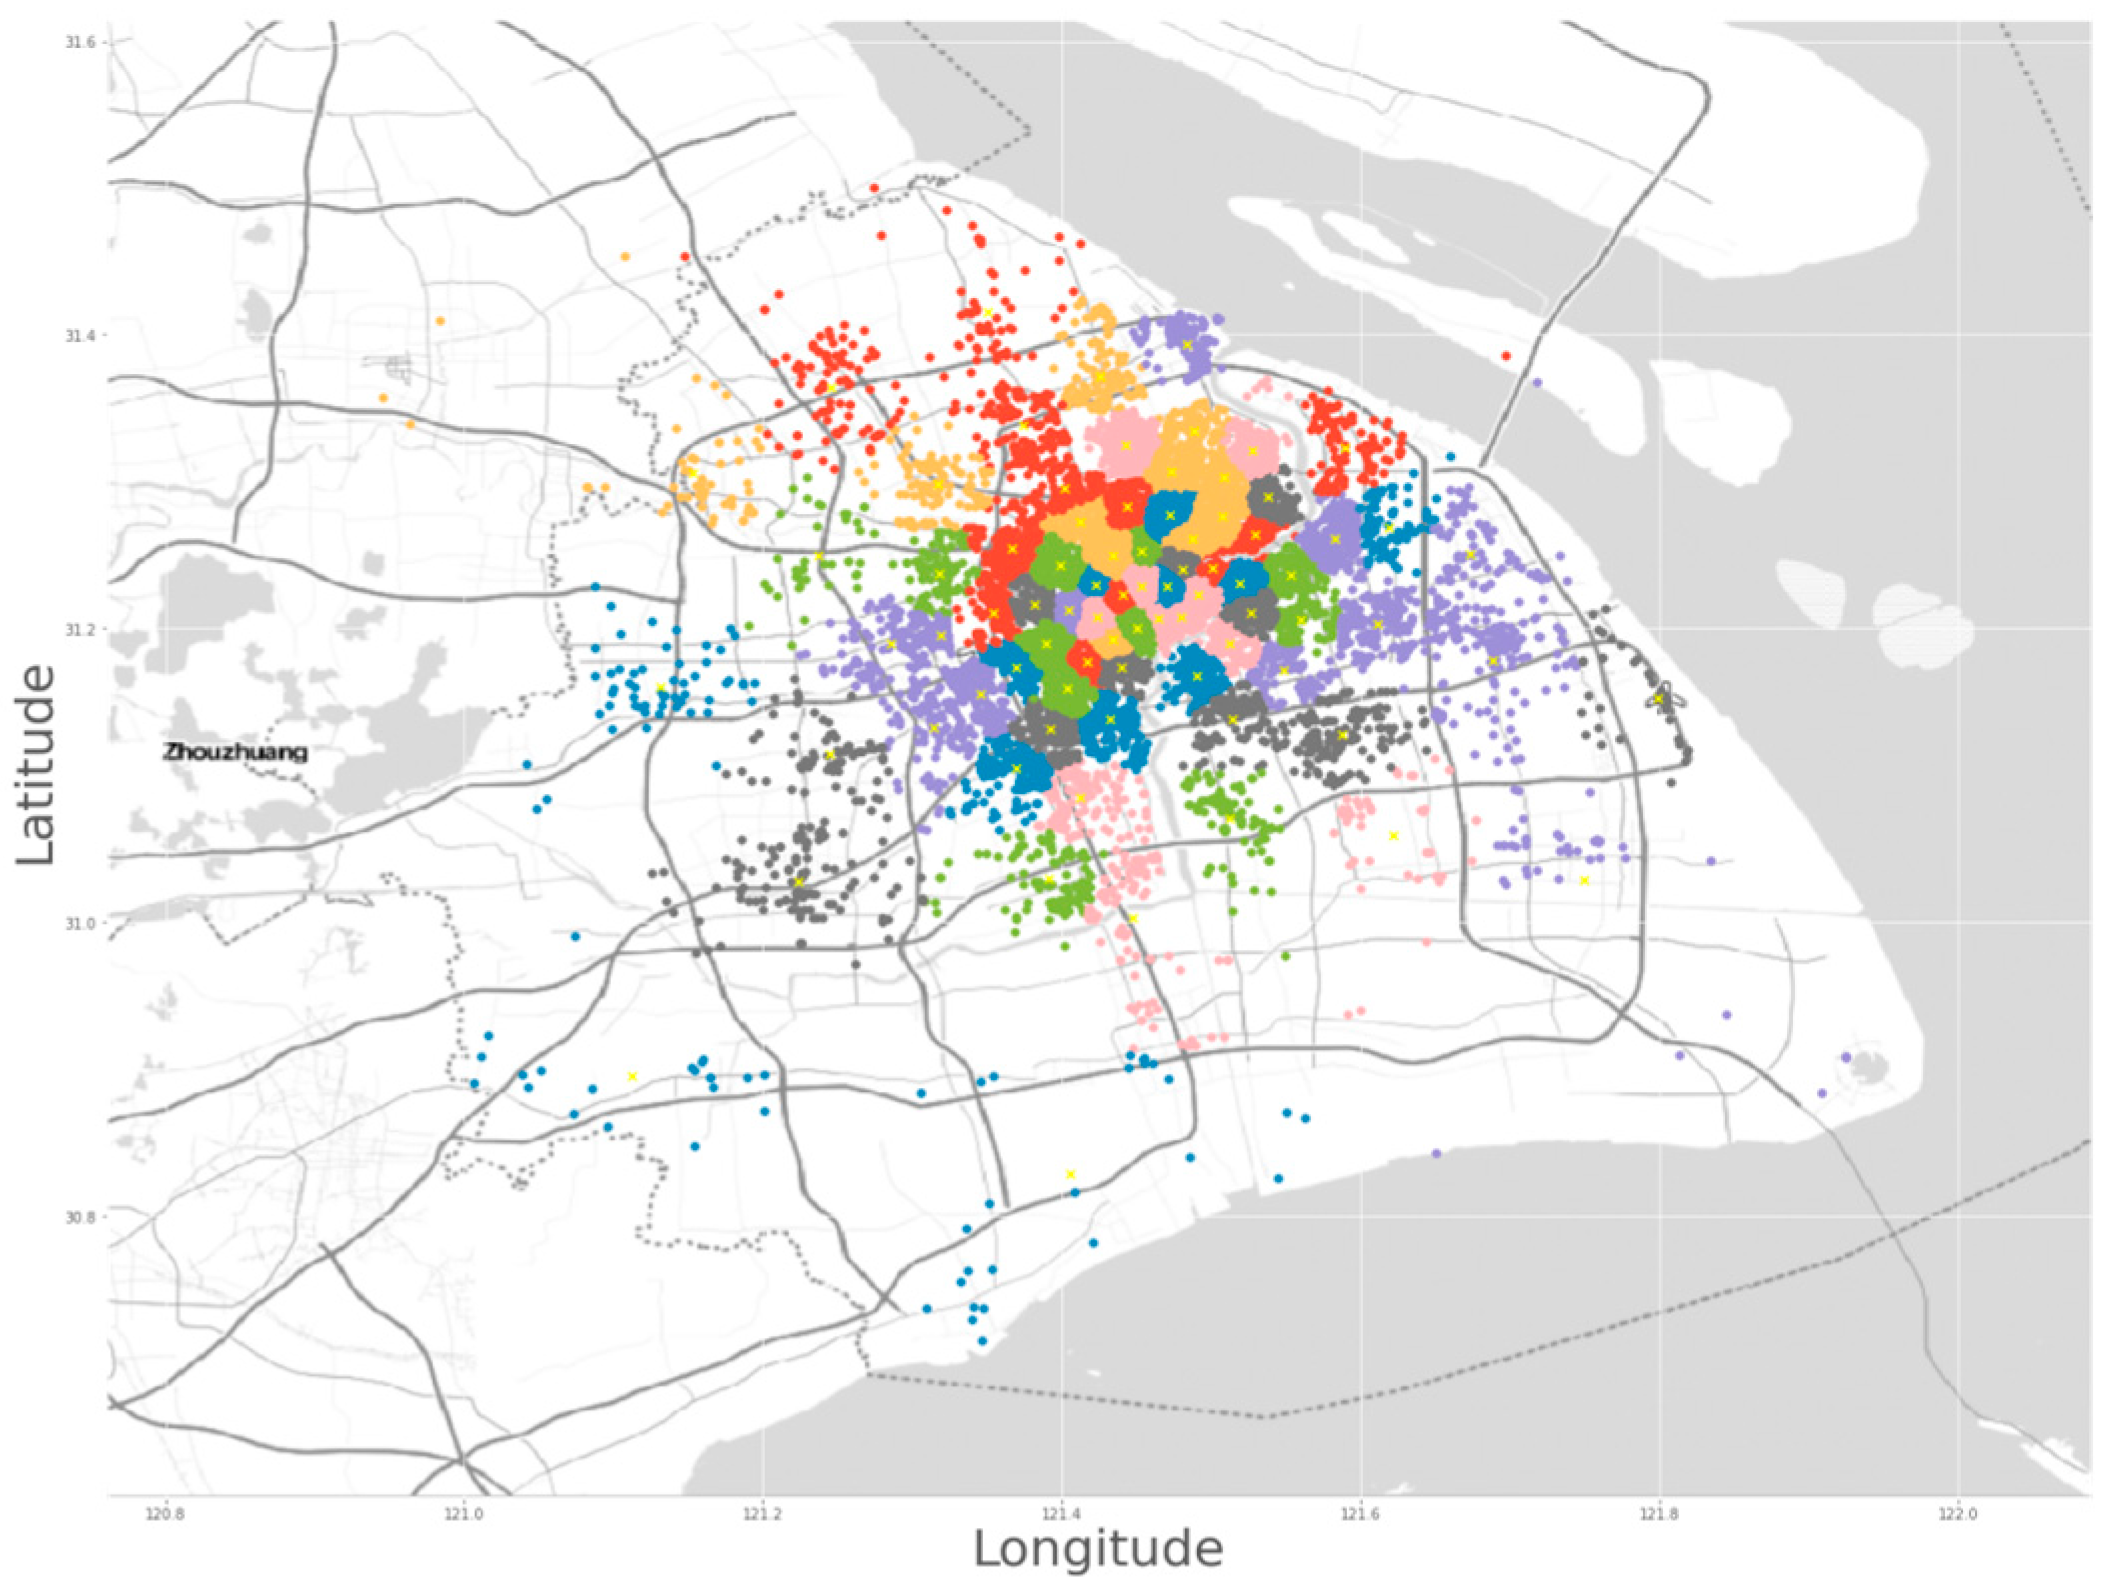
In this study, the IKQT algorithm was adopted to enhance the overall service quality with respect to charging station deployment. The number of iterations in the IKQT was set to be 10, with both α and β parameters selected to be 0.5. The final solution generated by the IKQT is shown in
Figure 4.
Table 1 summarizes the comparative influence factors that represent the overall service quality of the initial and final charging station deployments, along with their respective rates of change, as calculated using Equation (2). The values in this Table reflect the queuing theory simulation results for both the initial solution generated by K-means and the final solution obtained after the last IKQT iteration. Notably, not all influence factors exhibit a uniform trend towards improved service quality.
Specifically, the IKQT solution demonstrates a reduction in the maximum total waiting time at a single charging station, the maximum number of unserved taxis at a single charging station, the total waiting time for all charging services, and the total number of unserved taxis across all charging stations, compared to the initial solution. However, the IKQT does not reduce the maximum average waiting time at a single charging station. Based on the values presented in
Table 1, it is evident that the IKQT algorithm effectively optimizes the deployment of charging stations to enhance the overall charging service quality.
where
x0 is the value from the initial solution and
x10 is the value from the IKQT final solution.
To validate the trend of improvements in service quality during the IKQT iterations, two major influence indicators (total waiting time of all charging service and total number of unserved taxis in all charging stations) were selected for further analysis.
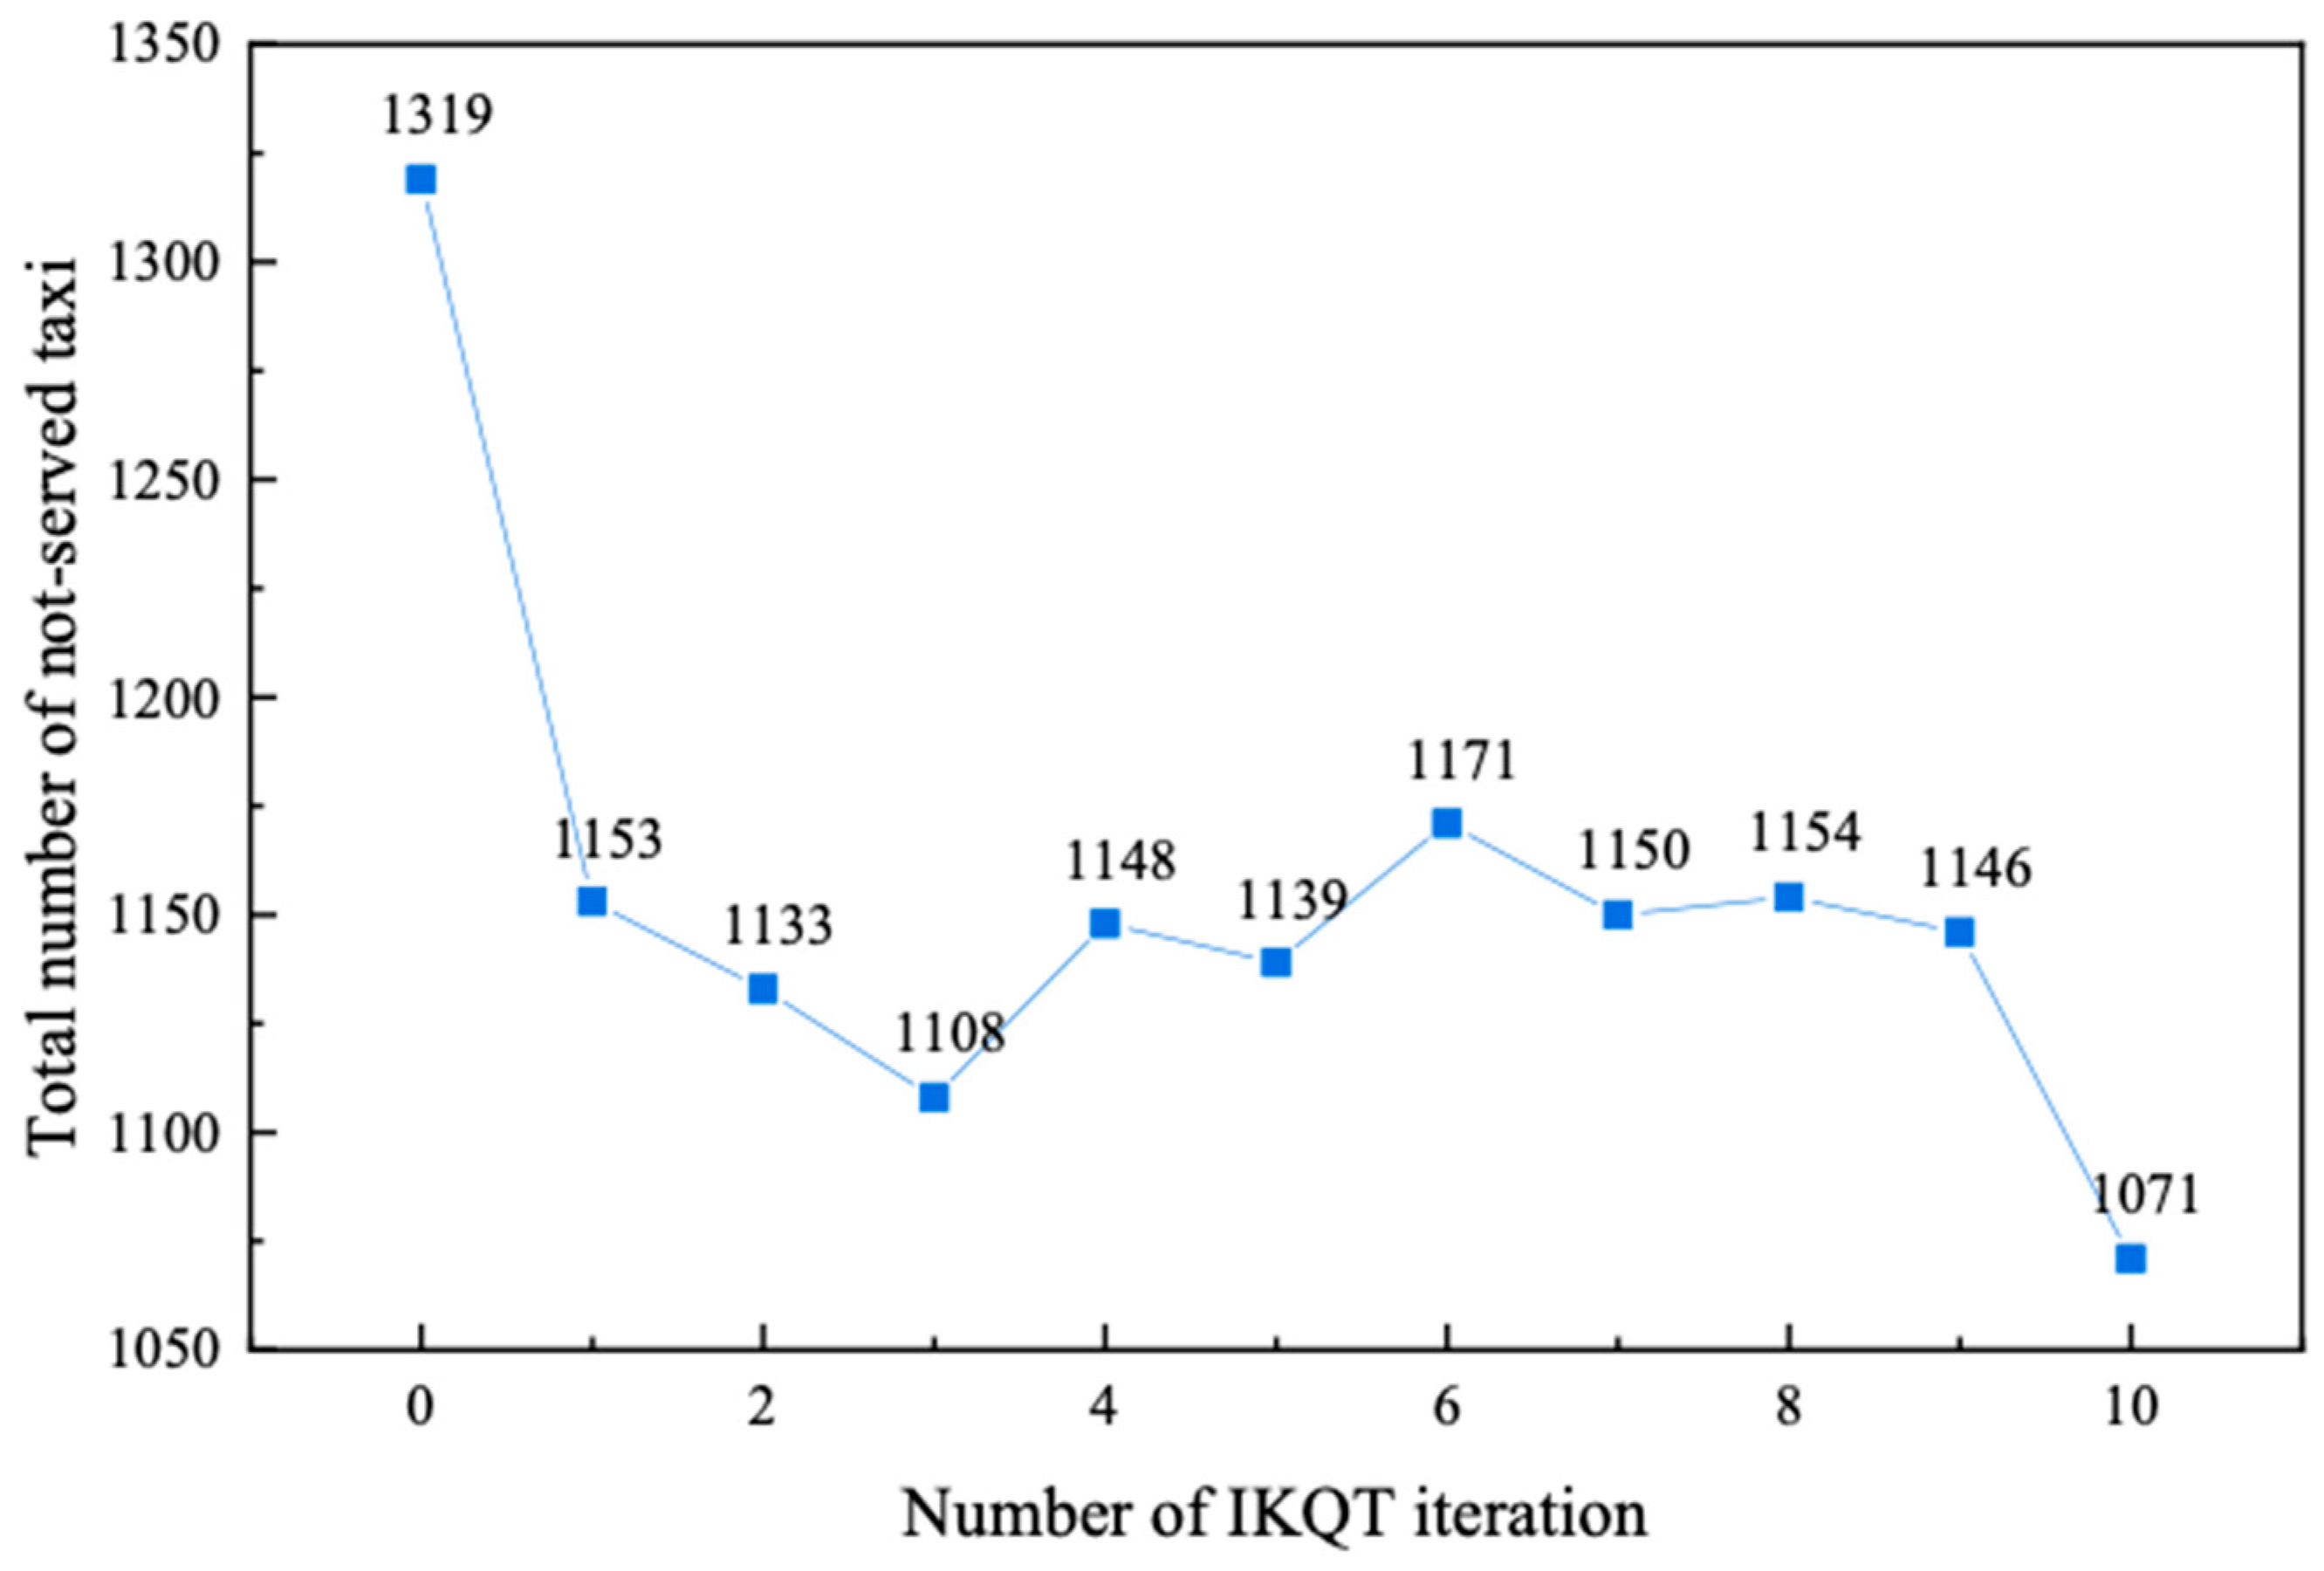
The total number of unserved taxis in all charging stations of each iteration is illustrated in
Figure 5.
Figure 5 illustrates the variation in the total number of unserved taxis over different iterations. Initially, upon the first iteration, there is a notable decrease in the number of unserved taxis. As the number of iterations increases, while there are some minor fluctuations, a general downward trend is observed.
Figure 5 depicts the progressive improvement in the number of taxis being served as the IKQT iterations proceed, demonstrating the effectiveness of the IKQT in reducing the number of unserved taxis over time.
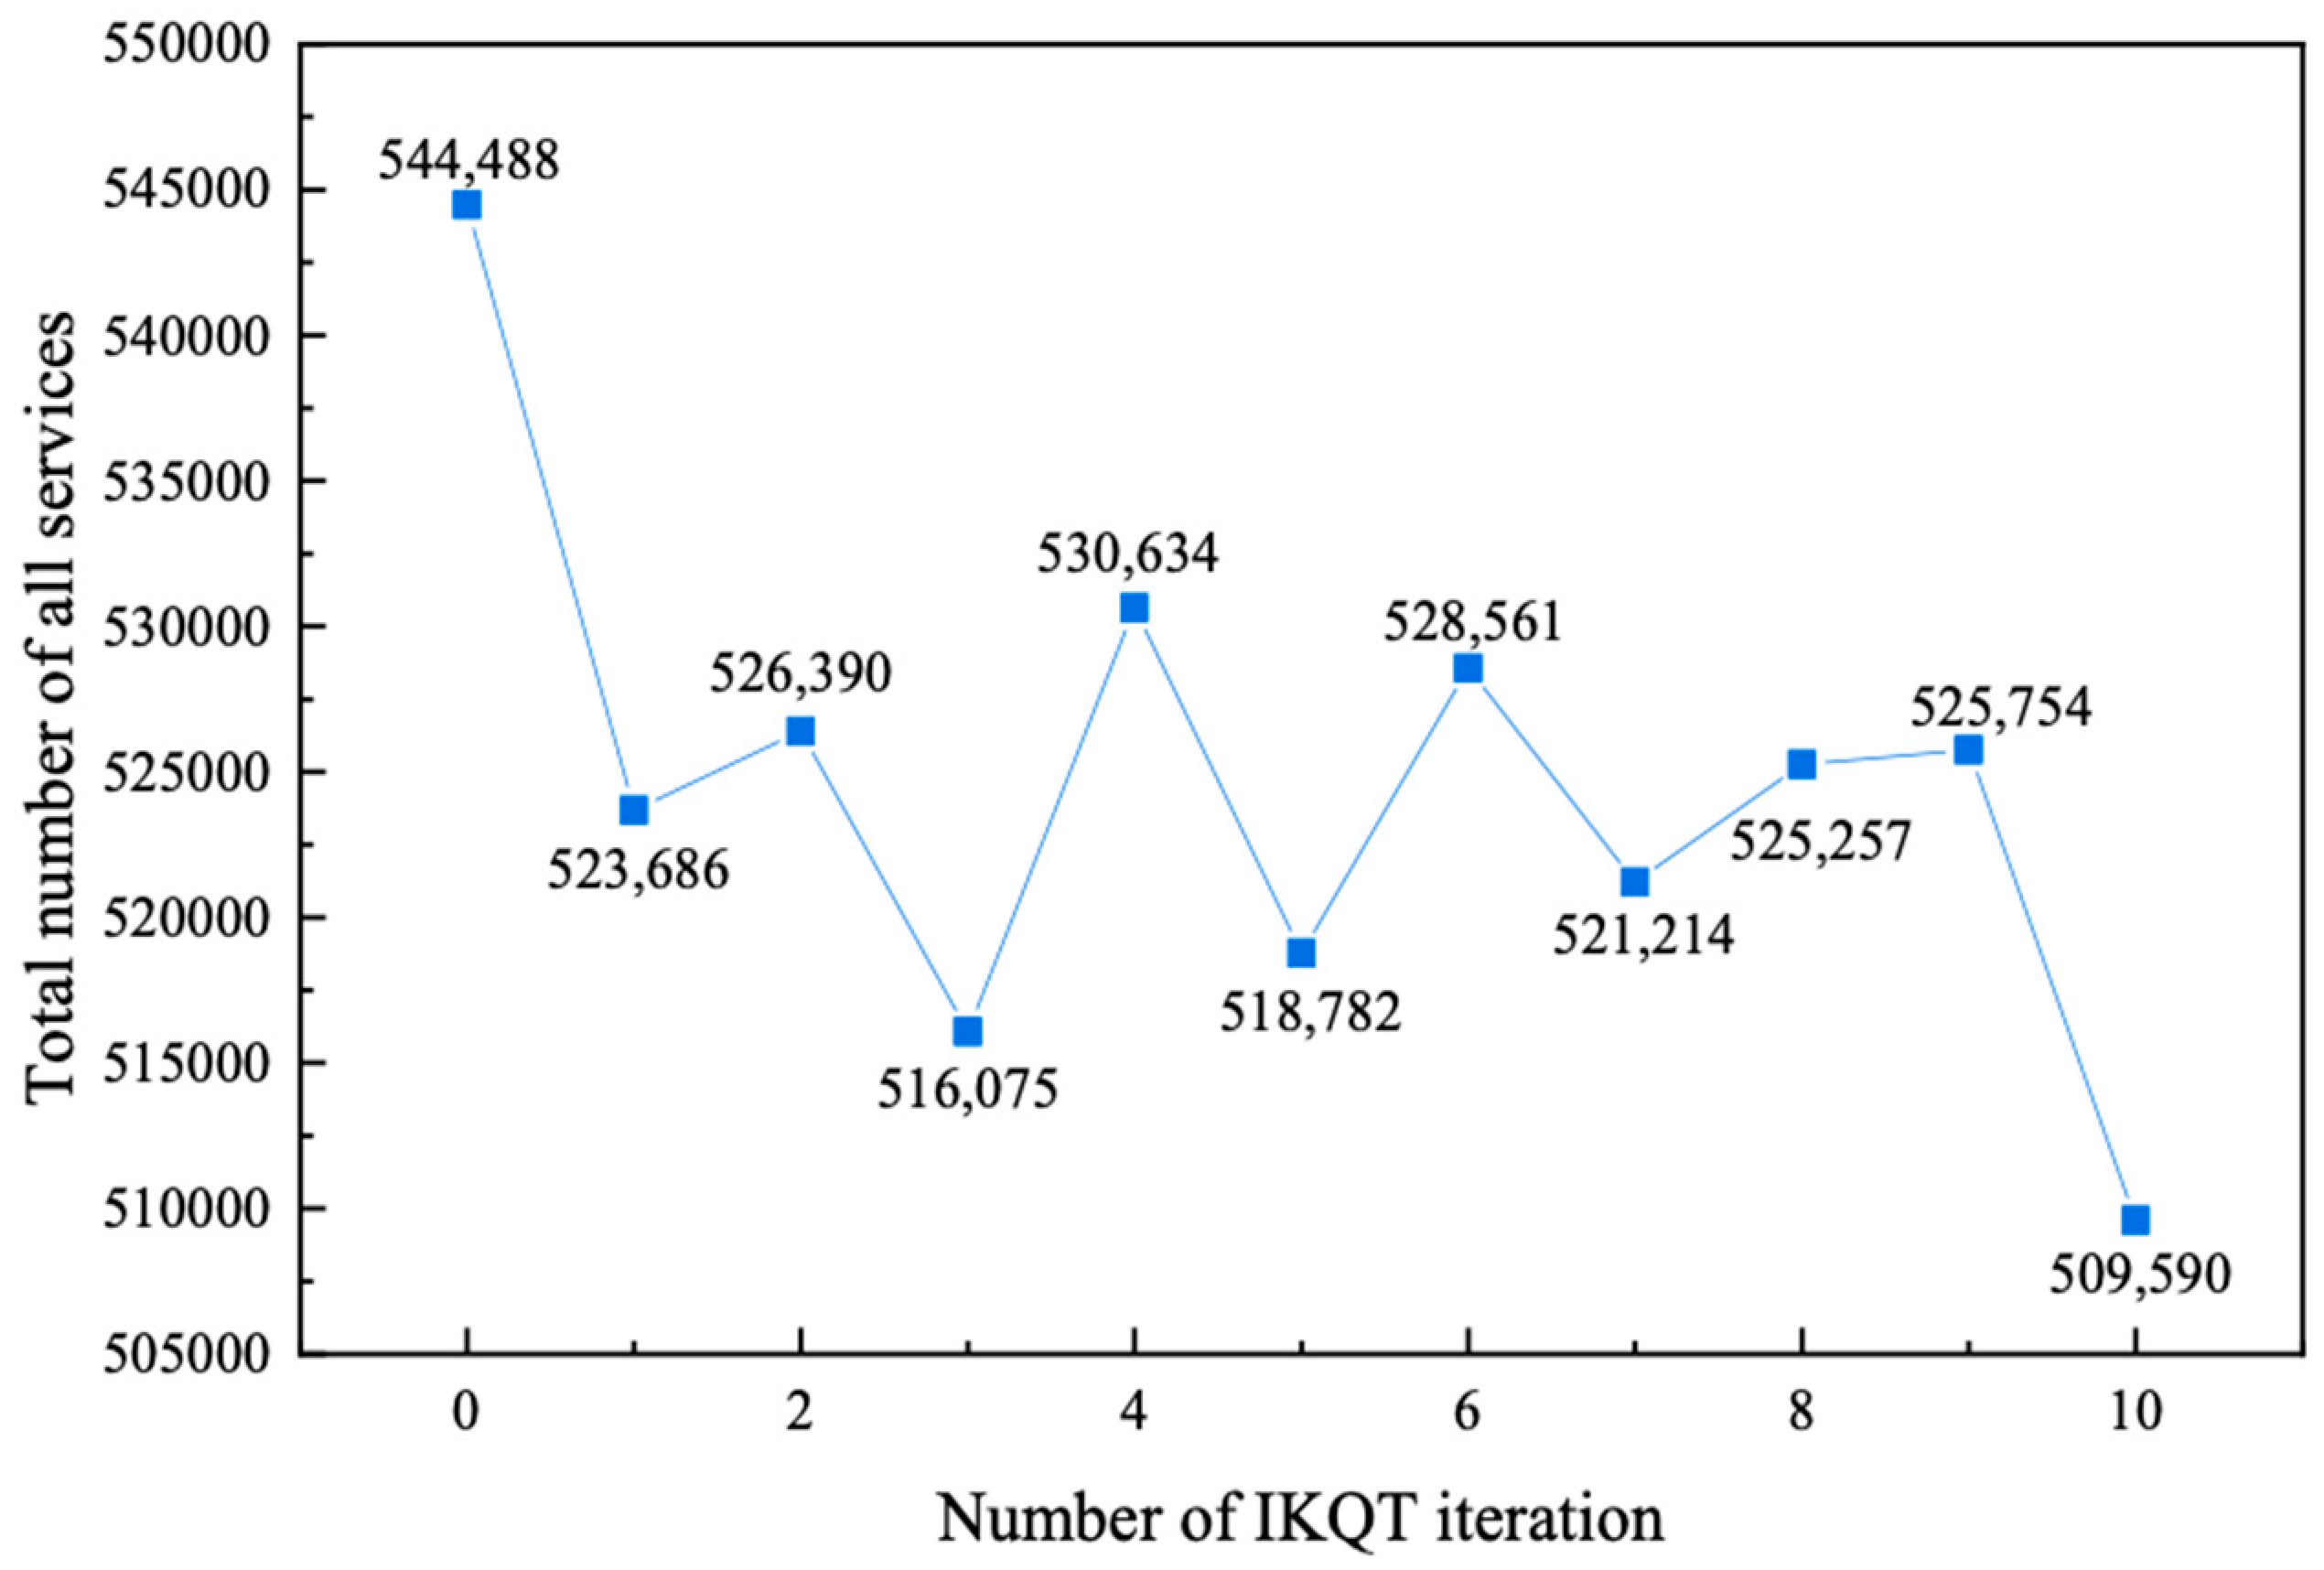
The total waiting time for all charging services in each iteration is demonstrated in
Figure 6.
Figure 6 illustrates the variation in the total waiting time (in minutes) for all charging services across different iterations of the IKQT. It is evident that the total waiting time experiences a downward trend as the number of IKQT iterations increases. Initially, the total waiting time is relatively high, suggesting potential congestion or inefficiencies in the charging service system. As the iterations progress, the total waiting time decreases, reflecting improved efficiency. It is noteworthy that despite some fluctuations, the general trend remains consistent—a decline in waiting time with each successive iteration. The last few iterations show a more stable waiting time, possibly indicating that the system has reached a state of optimal performance.
As depicted in
Figure 5 and
Figure 6, the changes between each IKQT iteration in these two pieces of data are slightly different. Importantly, these indicators are not positively correlated, meaning that a decrease in total waiting time may not necessarily correspond to a decrease in the number of unserved taxis. However, when both indicators decline simultaneously, this clearly demonstrates an improvement in charging service quality, as drivers experience shorter waiting times and a lower likelihood of not being served.
The downward trends shown by both dotted lines are very similar and obvious, suggesting that the IKQT algorithm effectively optimized the deployment of charging stations, thereby enhancing the overall charging service quality.
5. Discussion
While there is a scarcity of research focused on service quality in the context of electric vehicle (EV) charging stations, prior studies, such as those by Davidov and Pantoš, have made valuable contributions by introducing a novel Quality of Service (QoS) index that captures EV owners’/drivers’ preferred disposable charging time [
17]. This approach aims to cater to their specific needs and preferences, thereby striking a balance between cost-effective charging station placement and fulfilling charging reliability and QoS expectations.
This study considers two major influence indicators: the total waiting time for all charging services and the total number of unserved taxis across all charging stations. These indicators provide additional insights into the operational efficiency and overall service quality of the EV charging infrastructure, enabling the further refinement of strategies for charging station deployment and enhancing the overall charging experience for EV drivers.
First, by focusing on these two indicators, this study offers a more comprehensive evaluation of the operational efficiency and service quality of the EV charging infrastructure. While previous research has made valuable contributions, such as the QoS index based on preferred disposable charging time, this study provides additional metrics that are crucial for assessing the overall performance of, and user satisfaction with, EV charging stations.
The results demonstrate a reduction of approximately 6% in the total waiting time and a decrease of roughly 19% in the total number of unserved taxis across all charging stations when using the proposed IKQT algorithm, suggesting that this method can effectively improve the operational efficiency of the EV charging infrastructure. This aligns with the goals of prior studies that aimed to balance cost-effective charging station placement with high charging reliability and QoS expectations. By considering both waiting time and unserved demand, this study offers a more nuanced understanding of how these factors interact and can be optimized to enhance the overall charging experience for EV drivers.
In comparison to the QoS index proposed by Davidov and Pantoš, this study offers a more operationally focused evaluation of the EV charging infrastructure. While their QoS index aims to capture EV owners’/drivers’ preferences and needs, the indicators in this study focus on the tangible outcomes of charging station deployment—namely, reduced waiting times and fewer unserved taxis. By combining these two perspectives, future research could develop a more holistic framework for assessing and optimizing the EV charging infrastructure, taking into account both user preferences and operational efficiency.
In summary, this study contributes to the existing literature by providing additional insights into the operational efficiency and service quality of the EV charging infrastructure, while also highlighting areas for improvement and future research. By comparing the findings to those of prior studies, we can build upon existing knowledge and work towards developing more effective and user-centric charging station deployment strategies.
6. Conclusions
EVs are regarded as an environmentally friendly mode of transportation and have been implemented in public transit and taxi services worldwide. To maintain the operational efficiency of electric taxis, a properly designed charging station deployment plan is essential. In order to assist in the charging station deployment design process, this paper proposes a heuristic algorithm called Improved K-means iterated with Queuing Theory (IKQT), which considers charging waiting time and the number of unserved charging demand to enhance the deployment of charging stations. The GPS trajectory data from the Shanghai Qiangsheng taxi company were then adopted for model validation. The proposed deployment plan can reduce the total waiting time of all charging services by approximately 6%.
The IKQT algorithm offers a robust framework that can be replicated and adapted to various urban settings, highlighting its methodological replicability. However, as an empirical study, there are several avenues for improvement and future research. Firstly, exploring a wider range of α and β values for weight calculation could enhance the algorithm’s efficiency and convergence in each iteration. Furthermore, developing dynamic influence factors for α and β based on specific formulas could further refine the weight calculation process.
Additionally, augmenting the model with additional factors is crucial to improve its comprehensiveness. One significant factor to consider is the variability in traffic conditions across different areas of the city and at different times of the day. Incorporating this variability into the distance calculation, potentially through one or more weight factors, could provide a more accurate representation of the real-world charging demand patterns.
In conclusion, while the IKQT algorithm presents a promising approach for optimizing charging station deployment, there are several limitations that warrant attention and provide opportunities for refinement and expansion. Firstly, the current methodology solely considers the straight-line distance between each demand point and the corresponding charging station, rather than the actual travel distance, which may not accurately reflect real-world conditions. This limitation could potentially lead to suboptimal deployment plans. Secondly, the research lacks empirical validation through actual surveys (e.g., questionnaires) or field studies, relying instead on assumptions and data from a single taxi company. This limits the generalizability of the findings and the robustness of the proposed deployment plan.
To address these limitations, future research should endeavor to incorporate more realistic travel distance calculations, conduct extensive empirical studies to validate the findings, and engage with relevant stakeholders to gather a comprehensive understanding of charging demand. By doing so, the IKQT algorithm can be further refined and expanded, ultimately leading to more effective and efficient charging station deployment plans that better serve the needs of electric taxi services in diverse urban contexts.
Author Contributions
Conceptualization, L.L. and S.L.; methodology, L.L. and C.C.; software, L.L.; validation, Y.Z., H.D. and S.L.; formal analysis, L.L. and Y.Z.; investigation, H.D.; resources, C.C.; data curation, L.L. and S.L.; writing—original draft preparation, L.L.; writing—review and editing, H.D.; visualization, Y.Z.; supervision, C.C.; project administration, S.L.; funding acquisition, H.D. All authors have read and agreed to the published version of the manuscript.
Funding
This research is sponsored by the China Communication Construction Company Ltd. R&D program with the grant number 2019-ZJKJ-ZDZX02.
Institutional Review Board Statement
Not applicable.
Informed Consent Statement
Not applicable.
Data Availability Statement
The raw data supporting the conclusions of this article will be made available by the authors on request.
Acknowledgments
The authors disclosed the receipt of the following financial support for the research, authorship, and/or publication of this article: This study was funded by the China Communication Construction Company Ltd. R&D program (Grant No.: 2019-ZJKJ-ZDZX02).
Conflicts of Interest
Author Hao Du was employed by the Shanghai Tongke Transportation Technology Co., Ltd. The remaining authors declare that the research was conducted in the absence of any commercial or financial relationships that could be construed as a potential conflict of interest.
References
- Li, Y.; Zhan, C.; de Jong, M.; Lukszo, Z. Business innovation and government regulation for the promotion of electric vehicle use: Lessons from Shenzhen, China. J. Clean. Prod. 2016, 134, 371–383. [Google Scholar] [CrossRef]
- Shanghai Municipal Development & Reform Commission. Shanghai Municipal Government’s Announcement on a Certain Matter. Available online: https://fgw.sh.gov.cn/fgw_zxwyta/20230515/afa8c18915534b6bbb36954e9a1b021f.html (accessed on 15 May 2023).
- Beijing Municipal Commission of Development and Reform. Information on a Specific Policy. Available online: http://fgw.beijing.gov.cn/gzdt/fgzs/mtbdx/bzwlxw/201912/t20191221_1392834.htm (accessed on 21 December 2019).
- International Energy Agency (IEA). Global EV Outlook 2021. Available online: https://www.iea.org/reports/global-ev-outlook-2021 (accessed on 20 September 2023).
- Kaya, Ö.; Alemdar, K.D.; Campisi, T.; Tortum, A.; Çodur, M.K. The Development of Decarbonisation Strategies: A Three-Step Methodology for the Suitable Analysis of Current EVCS Locations Applied to Istanbul, Turkey. Energies 2021, 14, 2756. [Google Scholar] [CrossRef]
- Mądziel, M.; Campisi, T. Energy Consumption of Electric Vehicles: Analysis of Selected Parameters Based on Created Database. Energies 2023, 16, 1437. [Google Scholar] [CrossRef]
- Guo, Z.; Yu, B.; Li, K.; Yang, Y.; Yao, B.; Lin, Q. Locating battery supplying infrastructures for electric taxies. Transp. Lett. 2018, 12, 77–86. [Google Scholar] [CrossRef]
- Zhao, Z.; Tian, D.; Duan, X.; Xiao, R. Joint Optimization of Battery Swapping Scheduling for Electric Taxis. Sustainability 2023, 15, 13722. [Google Scholar] [CrossRef]
- Meng, X.; Zhang, W.; Bao, Y.; Yan, Y.; Yuan, R.; Chen, Z.; Li, J. Sequential construction planning of electric taxi charging stations considering the development of charging demand. J. Clean. Prod. 2020, 259, 120794. [Google Scholar] [CrossRef]
- Yang, J.; Dong, J.; Hu, L. A data-driven optimization-based approach for siting and sizing of electric taxi charging stations. Transp. Res. Part C Emerg. Technol. 2017, 77, 462–477. [Google Scholar] [CrossRef]
- Asamer, J.; Reinthaler, M.; Ruthmair, M.; Straub, M.; Puchinger, J. Optimizing charging station locations for urban taxi providers. Transp. Res. Part A Policy Pract. 2016, 85, 233–246. [Google Scholar] [CrossRef]
- Ko, J.; Kim, D.; Nam, D.; Lee, T. Determining locations of charging stations for electric taxis using taxi operation data. Transp. Plan. Technol. 2017, 40, 420–433. [Google Scholar] [CrossRef]
- Liu, S.; Wang, L.; Hu, J.; Zhou, Z. A Stochastic Charging Station Deployment Model for Electrified Taxi Fleets in Coupled Urban Transportation and Power Distribution Networks. IEEE Trans. Sustain. Energy 2024, 15, 1138–1150. [Google Scholar] [CrossRef]
- Xiao, D.; An, S.; Cai, H.; Wang, J.; Cai, H. An optimization model for electric vehicle charging infrastructure planning considering queuing behavior with finite queuing length. J. Energy Storage 2020, 29, 101317. [Google Scholar] [CrossRef]
- Awasthi, A.; Chandra, D.; Rajasekar, S.; Singh, A.K.; Raj, A.-D.-V.; Perumal, K.M. Optimal infrastructure planning of electric vehicle charging stations using hybrid optimization algorithm. In Proceedings of the 2016 National Power Systems Conference (NPSC), Bhubaneswar, India, 19–21 December 2016. [Google Scholar]
- Zhang, Y.; Zhang, Q.; Farnoosh, A.; Chen, S.; Li, Y. GIS-Based Multi-Objective Particle Swarm Optimization of charging stations for electric vehicles. Energy 2019, 169, 844–853. [Google Scholar] [CrossRef]
- Davidov, S.; Pantoš, M. Planning of electric vehicle infrastructure based on charging reliability and quality of service. Energy 2017, 118, 1156–1167. [Google Scholar] [CrossRef]
- Zhang, H.; Tang, L.; Yang, C.; Lan, S. Locating electric vehicle charging stations with service capacity using the improved whale optimization algorithm. Adv. Eng. Inform. 2019, 41, 100901. [Google Scholar] [CrossRef]
- Tang, X.; Liu, J.; Wang, X.; Xiong, J. Electric vehicle charging station planning based on weighted Voronoi diagram. In Proceedings of the 2011 International Conference on Transportation, Mechanical, and Electrical Engineering (TMEE), Changchun, China, 16–18 December 2011. [Google Scholar]
- Meng, W.; Liu, K. Optimization of electric vehicle charging station location based on game theory. In Proceedings of the 2011 International Conference on Transportation, Mechanical, and Electrical Engineering (TMEE), Changchun, China, 16–18 December 2011. [Google Scholar]
- Lazari, V.; Chassiakos, A. Multi-Objective Optimization of Electric Vehicle Charging Station Deployment Using Genetic Algorithms. Appl. Sci. 2023, 13, 4867. [Google Scholar] [CrossRef]
- Li, Y.; Pei, W.; Zhang, Q.; Xu, D.; Ma, H. Optimal Layout of Electric Vehicle Charging Station Locations Considering Dynamic Charging Demand. Electronics 2023, 12, 1818. [Google Scholar] [CrossRef]
- Huang, Y.; Kockelman, K.M. Electric vehicle charging station locations: Elastic demand, station congestion, and network equilibrium. Transp. Res. Part D Transp. Environ. 2020, 78, 102179. [Google Scholar] [CrossRef]
- Zhang, T.-Y.; Yang, Y.; Zhu, Y.-T.; Yao, E.-J.; Wu, K.-Q. Deploying Public Charging Stations for Battery Electric Vehicles on the Expressway Network Based on Dynamic Charging Demand. IEEE Trans. Transp. Electrif. 2022, 8, 2531–2548. [Google Scholar] [CrossRef]
- Hu, D.; Liu, Z.-W.; Chi, M. Multiple Periods Location and Capacity Optimization of Charging Stations for Electric Vehicle. In Proceedings of the 2019 China-Qatar International Workshop on Artificial Intelligence and Applications to Intelligent Manufacturing (AIAIM), Doha, Qatar, 1–4 January 2019. [Google Scholar]
- Niccolai, A.; Bettini, L.; Zich, R. Optimization of electric vehicles charging station deployment by means of evolutionary algorithms. Int. J. Intell. Syst. 2021, 36, 5359–5383. [Google Scholar] [CrossRef]
- Zhao, Z.; Lee, C.K.M.; Ren, J.; Tsang, Y.P. Optimal EV Fast Charging Station Deployment Based on a Reinforcement Learning Framework. IEEE Trans. Intell. Transp. Syst. 2023, 24, 8053–8065. [Google Scholar] [CrossRef]
- Liu, Z.-F.; Zhang, W.; Ji, X.; Li, K. Optimal planning of charging station for electric vehicle based on particle swarm optimization. In Proceedings of the IEEE PES Innovative Smart Grid Technologies, Tianjin, China, 21–24 May 2012. [Google Scholar]
- Awasthi, A.; Venkitusamy, K.; Padmanaban, S.; Selvamuthukumaran, R.; Blaabjerg, F.; Singh, A.K. Optimal planning of electric vehicle charging station at the distribution system using hybrid optimization algorithm. Energy 2017, 133, 70–78. [Google Scholar] [CrossRef]
- Sadeghi-Barzani, P.; Rajabi-Ghahnavieh, A.; Kazemi-Karegar, H. Optimal fast charging station placing and sizing. Appl. Energy 2014, 125, 289–299. [Google Scholar] [CrossRef]
- Yang, Q.; Sun, S.; Deng, S.; Zhao, Q.; Zhou, M. Optimal sizing of PEV fast charging stations with Markovian demand characterization. IEEE Trans. Smart Grid 2018, 10, 4457–4466. [Google Scholar] [CrossRef]
- Xu, M.; Meng, Q. Optimal deployment of charging stations considering path deviation and nonlinear elastic demand. Transp. Res. Part B Methodol. 2020, 135, 120–142. [Google Scholar] [CrossRef]
- Wu, G.; Xu, Z.; Zhang, H.; Shen, S.; Yu, S. Multi-agent DRL for joint completion delay and energy consumption with queuing theory in MEC-based IIoT. J. Parallel Distrib. Comput. 2023, 176, 80–94. [Google Scholar] [CrossRef]
- Liu, L.; Chang, Z.; Guo, X.; Mao, S.; Ristaniemi, T. Multiobjective Optimization for Computation Offloading in Fog Computing. IEEE Internet Things J. 2018, 5, 283–294. [Google Scholar] [CrossRef]
- Wang, X.; Ning, Z.; Wang, L. Offloading in Internet of Vehicles: A Fog-Enabled Real-Time Traffic Management System. IEEE Trans. Ind. Inform. 2018, 14, 4568–4578. [Google Scholar] [CrossRef]
- Lu, F.; Hua, G. A location-sizing model for electric vehicle charging station deployment based on queuing theory. In Proceedings of the 2015 International Conference on Logistics, Informatics and Service Sciences (LISS), Barcelona, Spain, 27–29 July 2015. [Google Scholar]
- Vazifeh, M.M.; Zhang, H.; Santi, P.; Ratti, C. Optimizing the deployment of electric vehicle charging stations using pervasive mobility data. Transp. Res. Part A Policy Pract. 2019, 121, 75–91. [Google Scholar] [CrossRef]
- Yi, T.; Cheng, X.-b.; Zheng, H.; Liu, J.-p. Research on Location and Capacity Optimization Method for Electric Vehicle Charging Stations Considering User’s Comprehensive Satisfaction. Energies 2019, 12, 1915. [Google Scholar] [CrossRef]
- Hartigan, J.A.; Wong, M.A. Algorithm AS 136: A k-means clustering algorithm. J. R. Stat. Soc. Ser. C 1979, 28, 100–108. [Google Scholar] [CrossRef]
| Disclaimer/Publisher’s Note: The statements, opinions and data contained in all publications are solely those of the individual author(s) and contributor(s) and not of MDPI and/or the editor(s). MDPI and/or the editor(s) disclaim responsibility for any injury to people or property resulting from any ideas, methods, instructions or products referred to in the content. |
© 2024 by the authors. Licensee MDPI, Basel, Switzerland. This article is an open access article distributed under the terms and conditions of the Creative Commons Attribution (CC BY) license (https://creativecommons.org/licenses/by/4.0/).


