Review

Thermal Material Property Evaluation Using through Transmission Thermography: A Systematic Review of the Current State-of-the-Art

School of Aerospace, Transport and Manufacturing (SATM), Cranfield University, Cranfield MK43 0AL, UK
*
Author to whom correspondence should be addressed.
Appl. Sci. 2024, 14(15), 6791; https://doi.org/10.3390/app14156791
Submission received: 17 July 2024 / Revised: 30 July 2024 / Accepted: 31 July 2024 / Published: 3 August 2024

Abstract

:

Featured Application

Thermal Material Characterisation.

Abstract

Determining thermal material properties such as thermal diffusivity can provide valuable insights into a material’s thermal characteristics. A well-established method for this purpose is flash thermography using Parker’s half-rise equation. It assumes one-dimensional heat transfer for thermal diffusivity estimation through the thickness of the material. However, research evidence suggests that the technique has not developed as much as the reflection mode over the last decade. This systematic review explores the current state-of-the-art in through-transmission thermography. The methodology adopted for this review is the SALSA framework that seeks to Search, Appraise, Synthesise, and Analyse a selected list of papers. It covers the fundamental physics behind the technique, the advantages/limitations it has, and the current state-of-the-art. Additionally, based on the Population, Intervention, Comparison, Outcome, and Context (PICOC) framework, a specific set of inclusion and exclusion criteria was determined. This resulted in a final list of 81 journal/conference papers selected for this study. These papers were analysed both quantitatively and quantitatively to identify and address the current knowledge gap hindering the further development of through-transmission thermography. The findings from the review outline the current knowledge gap in through-transmission thermography and the challenges hindering the development of the technique, such as depth quantification in pulsed thermography and the lack of a standardised procedure for conducting measurements in the transmission mode. Overcoming some of these obstacles can pave the way for further development of this method to aid in material characterisation.

1. Introduction

The first industrial revolution that occurred in the eighteenth century saw a major shift in many industries towards a more machine-centric production. Its inception can be traced back to England in 1760, with industrialisation paving its way to the United States as the eighteenth century came towards a close [1]. The following industrial revolutions brought further changes in various sectors improving technologies and overall quality of life. However, as technology evolved and the demands for production increased, downtime became a critical issue that needed to be addressed. To ensure that all machinery and systems are properly functioning, they require periodic maintenance. This necessitated the establishment of reliable and efficient maintenance practices, facilitating the seamless operation of industries while concurrently minimising downtime costs.
According to DIN 31051, maintenance is defined as “the combination of all technical and administrative measures as well as management measures during the life cycle of a unit of consideration to determine and assess the actual condition and to maintain the functional condition or return it to this condition so that it can fulfil the required function” [2]. Moreover, maintenance can be divided into four categories. These are reactive, preventive, predictive, and reliability-centred maintenance. Other than reactive maintenance, the other maintenance types focus on maintaining equipment before failure. This involves incorporating various technologies and techniques, such as non-destructive testing, to prevent downtime and ensure that the equipment or product complies with the relevant standards.
Non-destructive testing (NDT) is a branch of science that deals with the characterisation of materials without adversely affecting their functionality. It offers a wide range of inspection techniques that operate on different sets of physical principles to assess materials based on their properties [3]. All NDT methods can be conducted throughout a component’s life cycle. Inspections can be conducted in the manufacturing stage to ensure it complies with a set of standards or during the in-service stage to identify any damage that is present. Furthermore, it offers a cost-effective solution for conducting inspections on a single part or an entire production line [4].
While there are many NDT techniques, some of the most used are ultrasonic testing, visual inspection, radiography, microscopy, electromagnetic, and infrared thermography [5]. The requirement for NDT inspection stretches across various industries. These industries include the automotive [6], aerospace [7,8,9], oil and gas [10], and defence [11] industries. Figure 1 presents an overview of some of the NDT methods [12].
With the advent of Industry 4.0, concepts such as centralised decision making, digitalisation, artificial intelligence, Big Data and the Internet of Things (IoT) have become pivotal in data creation and management. In the context of NDT, these emerging technologies can be incorporated to allow for more reliable and accurate inspections. Current literature suggests that the focus is tilted towards the field of additive manufacturing (AM) [13,14], with X-ray computed tomography being the most reliable technique in assessing AM parts. However, the title of the most extensively used NDT technique lies with ultrasound testing (UT) [15]. Integrating ultrasonic inspection with the technologies available under Industry 4.0 can provide more valuable insights into the component’s structural health. With increased computational power, more realistic numerical models have been developed for UT-based inspections [16]. Furthermore, the technique provides fast and computationally inexpensive methods to generate synthetic and augmented UT training data. However, the technique does not come without its drawbacks. The method requires a coupling agent between the component and the ultrasonic sensor. This is undesirable, especially in places where contacting the surface can adversely affect its properties. Moreover, the surface finish of the component must be smooth to achieve a reasonable signal-to-noise ratio, although methods such as water jet ultrasonic testing are able to circumvent this issue [17]. Lastly, the wave propagation speed of the material under testing must be known a priori.
Infrared thermography (IRT) is a non-contact, non-intrusive measurement technique operating in the infrared range of the electromagnetic spectrum, i.e., ≈0.7–100 µm. It measures and records the thermal radiation emitted by an object’s surface and characterises its thermal pattern with reference to its surrounding environment. All objects above 0 K emit infrared energy. This technique had its inception in the early 1970s when it was developed as an experimental technique resulting from the use of military infrared imagers [18]. The infrared radiometer captures the emitted energy, which can either be the inherent thermal energy of the specimen (passive mode) or induced into the specimen by a thermal excitation source (active mode). Within the active mode, thermal excitation can be achieved through several means: the fundamental principles governing the technique, the existing signal, and the image. Table 1 lists the active excitation methods and the types of defects that they can detect.

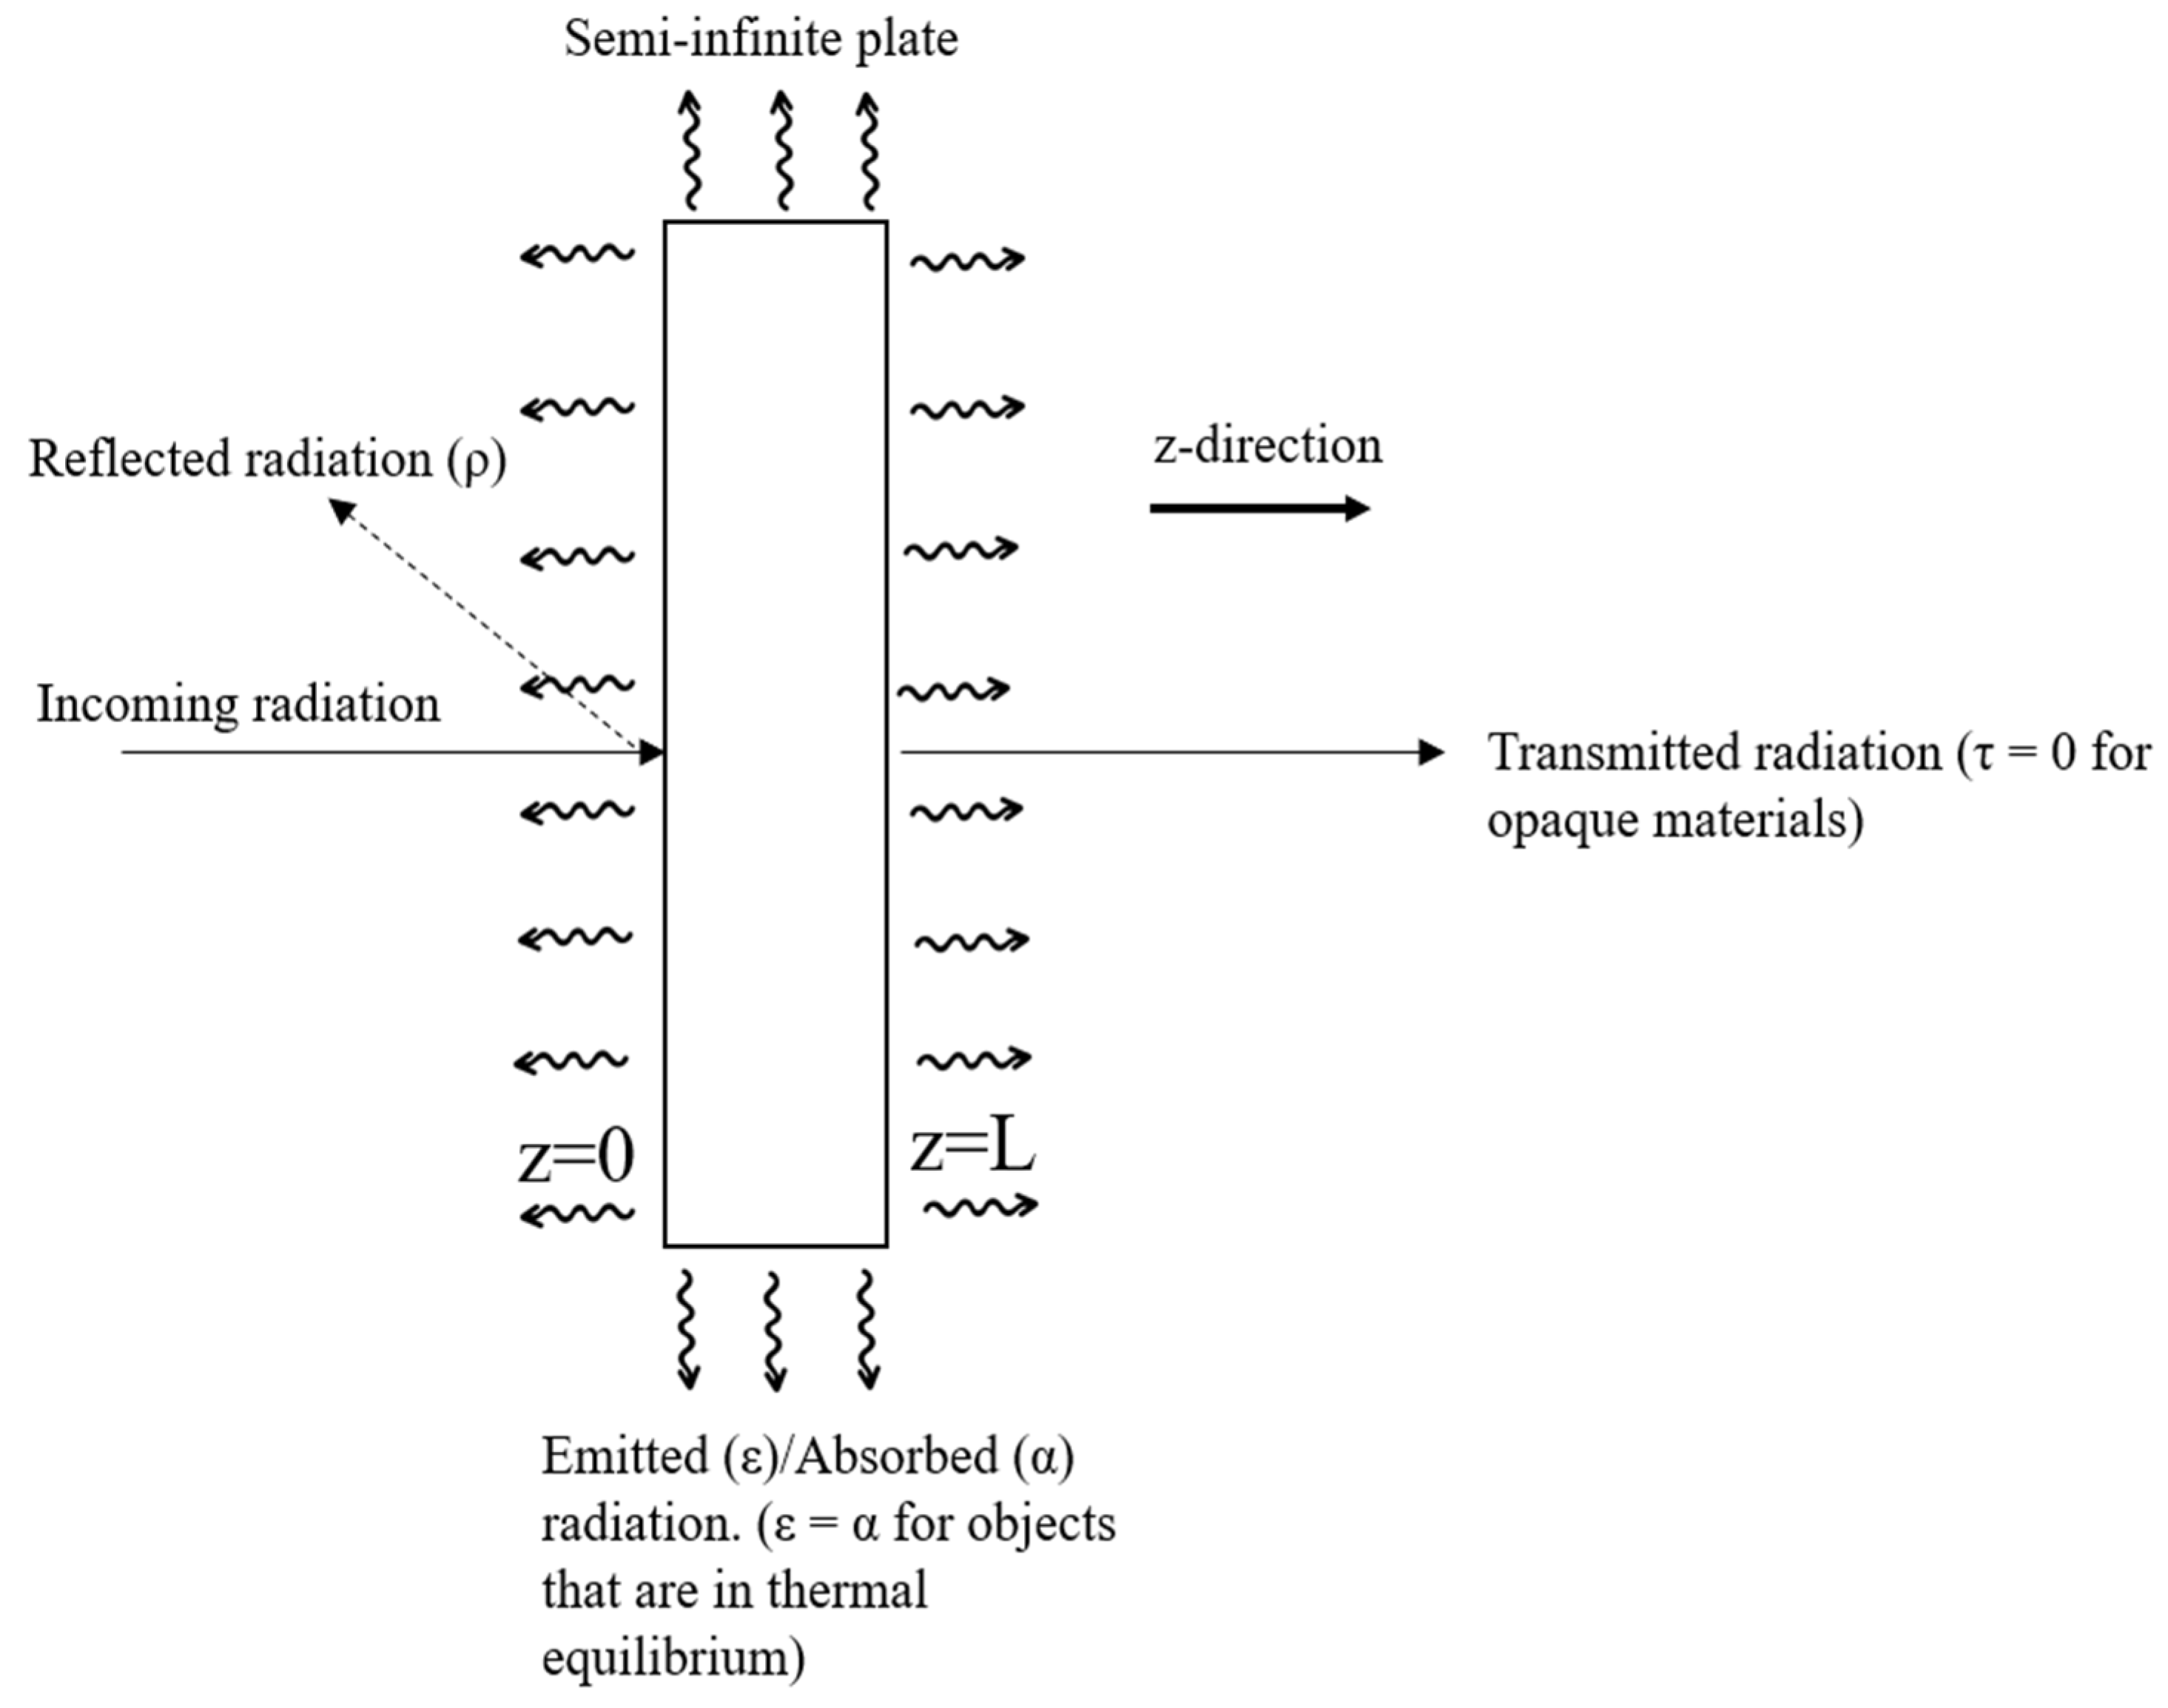
1.1. One-Dimensional Heat Diffusion

Figure 2 shows a schematic of a sample’s response to electromagnetic radiation. Part of the radiation is reflected, and the other parts are absorbed by the sample, transmitted through, or radiated back from the sample’s surface. For opaque materials, the transmitted radiation is zero. The absorbed radiation is in the form of heat, which can be observed using IRT, making it an ideal candidate for thermal material property evaluation.
The working principle using thermography for material characterisation is based on the classical heat diffusion theory in solids, which has the following equation, also known as the Fourier equation:
T t = α 2 T  
where α = k ρ C is the thermal diffusivity of the material (m2/s); k is the thermal conductivity (W/mK); ρ is the density (kg/m3); and C is the specific heat (J/kg K). Considering that the heat is uniformly distributed, the problem can be treated as a one-dimensional heat transfer problem, and Equation (1) is simplified to:
T t = α 2 T z 2  
where z is the direction in which heat travels (i.e., the thickness of the sample). Equation (2) has been addressed by Carslaw and Jaegar, assuming a semi-infinite and thermally insulated specimen whose initial temperature distribution is T z , 0 the temperature distribution can at any later time t be defined as [19]:
T z , t = 1 L 0 L T z , 0 d z + 2 L n = 0 e n 2 π 2 α t L 2 × cos n π z L 0 L T z , 0 cos n π z L d z  
with L being the thickness of the sample.

1.2. Motivation for the Review

IRT has made significant advancements in the assessment of various materials. Numerous algorithms and methodologies have been developed, and their applications extend to various industries [20,21,22]. However, closer inspection of the current state-of-the-art method revealed that the majority of research has been focused on the reflection mode in active thermography. In this mode, the heat source and the infrared radiometer are placed on the same side of the specimen. Research concerning the transmission mode, i.e., the infrared radiometer and the heat source are on opposite sides of the specimen, is limited. Based on the author’s understanding, there are several reasons that can explain this. One of the reasons is that, in many practical settings, the rear surface is not accessible, making inspections in the transmission mode impossible. Furthermore, the reluctance to explore through transmission can also be attributed to the challenge in the depth quantification of subsurface defects, especially in pulsed thermography. Based on our current understanding, depth quantification is challenging since the distance travelled by the thermal wave in the sound and defect areas is the same [23]. Moreover, there is a lack of theoretical/finite element models that simulate the back wall temperature behaviour exposed to heating on the front side. While these drawbacks have been holding through-transmission thermography behind its counterpart, the subsequent sections of this paper will reveal that there is a lot of potential for this technique and that it is an area of research worth developing. Furthermore, the increased defect depth and lateral resolution of the transmission mode, when compared to the reflection mode, makes it a more viable candidate for subsurface defect detection. The idea is to generate a greater interest in the transmission mode by identifying key research areas to develop the technique and transform it into an attractive solution for thermal material characterisation. With the emergence of modern technologies, the current drawbacks of through transmission can potentially be overcome, allowing researchers to develop a better understanding of material and defect characteristics.
Table 1. Active IRT methods.
Method of ExcitationSource of HeatActive IRT TerminologyTypes of Defects Detected
(Maximum Defect Depth Detected)
AdvantagesLimitations
OpticalPhotographic flashes, lasers, and lampsOptically Stimulated Thermography (OST)Lock-in Thermography (LIT) [24,25,26,27,28]Disbonding in coatings
Delaminations
Corrosion (3 mm)
Defects in weld roots
Cracks (surface/subsurface)
Allows for uniform heating.
Less sensitive to local variations of surface emissivity
Long heating time
Determining optimum modulation frequencies based on material properties
Difficult to detect defects in planes perpendicular to the surface
Pulsed Thermography (PT) [20,24,29,30,31]Pitting
Corrosion
Delaminations
Cracks (Surface/near surface) (6 mm)
Defects in weld roots
Fast inspection time (few ms)
Has numerous advanced post-processing algorithms
Heating is non-uniform
Cannot detect defects deeper than 6 mm
Difficult to detect defects in planes perpendicular to the surface
Frequency Modulated Thermography (FMT) [32]Pitting
Corrosion
Delaminations
Cracks (Surface/subsurface) (4.5 mm)
Defects in weld roots
Flat bottom holes
Combines the advantages of PT and LIT for defect detection
Uses multiple frequencies to detect defects at various depths
Cannot detect defects deeper than 6 mm below the surface
Difficult to detect defects in planes perpendicular to the surface
Pulsed Phase Thermography (PPT) [33]
Step-Heating Thermography (SHT) [34]Pitting
Corrosion
Delaminations
Cracks (Surface/near surface) (3.5 mm)
Defects in weld roots
Flat bottom holes
Data captured during the heating and cooling phase
Can detect damage deeper into the surface than PT
Longer inspection time compared to flash heating
Difficult to detect defects in planes perpendicular to the surface
Long Pulse Thermography (LPT) [35]Pitting
Corrosion
Delaminations
Cracks (Surface/near surface (4.25 mm)
Defects in weld roots
Flat bottom holes
Useful for materials with low thermal conductivity
Laser-Line Thermography (LLT) [36,37,38]Cracks (Surface/near surface) (5 mm)Can detect defects in planes perpendicular to the surfaceLonger inspection time compared to flash thermography
Temperature sensitivity reduces for crack lengths below ~2 mm depth below ~1 mm and crack opening below ~5 µm
Laser-Spot Thermography (LST) [38,39,40]Cracks (Surface/near surface) (10 mm)
Defects in weld roots
UltrasonicUltrasonic horn/acoustic, air-coupled transducers, piezo-ceramic sensorsNonlinear Ultrasonic Stimulated Thermography (NUST) [41,42]Cracks (surface/subsurface) (8 mm)Reduced excitation energy compared to UST
Uses a narrower frequency bandwidth for thermal excitation
Requires multiple frequencies to cover a large inspection area
Thermosonics, Sonic IR Thermography, and Vibro-thermography (Ultrasonic Stimulated Thermography) (UST) [43,44]Cracks (surface/near surface)
Delaminations (5 mm)
Suitable for in-depth damage
Can detect closed cracks
Requires contact with the sample
ElectromagneticMicrowavesMicrowave Thermography (MWT) [45,46]Cracks (surface/subsurface)
Voids
Delaminations (38 mm)
Material debonding
Fast inspection for large parts
Volumetric heating
Uniform heating
Microwave leakage is hazardous to human health
High frequency required (890 MHz to 2.45 GHz) to minimize interference with communication services
Eddy current inductionPulsed Eddy Current thermography (PEC) [47,48,49,50]Delaminations
Cracks (surface/near surface) (4 mm)
Heating is not limited to specimen surface
Lower SNR ratio compared to optical methods
Will not work with nonconductive materials
Limited penetration depth compared to other techniques
Cannot detect cracks that are very close to each other
Dependent on crack geometry to estimate crack depth
Thermo-resistive radiation (for composites)Embedded shape memory alloy wires with electric currentIndirect Material-based Thermography (IMT)Shape Memory Alloy-based Thermography (SMArT) [51]Cracks (surface/subsurface) (1.25 mm)Does not require external heaters or complex signal-processing techniques
Consumes less energy compared to other active IRT methods
Can detect deep-lying defects
Useful for in situ assessment
Inspection time is longer than optical excitation methods such as PT
Does not cover wider range of materials than other excitation methods
Embedded steel wires with electric currentMetal-based Thermography (MT) [52]Delaminations
Cracks (surface/subsurface) (8.25 mm)
Material deformations
Removes the requirement for external heaters
Removes the drawbacks of optical excitation caused by material anisotropy
Embedded carbon nanotubes with electric currentCarbon Nanotube-based Thermography (CNTT) [53]Cracks (surface/near surface)
Holes (1 mm)
Useful for in situ assessment
Requires low power
Does not require external heaters
Electrical current running through carbon fibresDirect Material-based ThermographyElectrical Resistance Change Method (ERCM) coupled with thermography [54]Cracks (surface/near surface)
Indentation damage (6.5 mm)
Can detect defects at multiple anglesDetectability reduces at higher thermal conductivity values
Applications are limited to materials with good electro-thermal properties
This state-of-the-art review seeks to uncover the existing capabilities of through-transmission thermography and identify the obstacles currently impeding its progress. The fundamental principles governing the technique, the existing signal, and image processing algorithms to evaluate raw thermographic data, as well as the materials assessed using this method, will be analysed. Finally, gaps that are hindering the progress of the technique will be identified and potential solutions will be recommended in order to overcome these gaps. To ensure transparency and repeatability, the methods used to conduct this review are outlined in the next section. The authors would also like to emphasise that this is a state-of-the-art review focused on the transmission mode. This may lead to many of the works of renowned experts in this field being omitted. This is simply due to the nature of the type of review and not due to bias on the authors’ side. The details of the review methodology are discussed in the next section.

2. Materials and Methods

To provide a comprehensive analysis of the current state-of-the-art in through-transmission thermography in a systematic way, the methodology outlined in the book “Systematic approaches to a successful literature review” by Booth et al. [55] was adopted. Booth et al. define the literature review as “a systematic explicit, and reproducible method for identifying, evaluating, and synthesising the existing body of completed and recorded work made by researchers, scholars, and practitioners”. The research framework is defined as the SALSA framework that seeks to Search, Appraise, Synthesise, and Analyse the available literature. These four steps will be explained in greater detail in the following subsections.

2.1. Search

The first step in the SALSA framework is the search. To do so, it is essential to have a well-defined search scope. This, in turn, helps in crafting clear and concise research questions that can be successfully answered during the review. For this purpose, the PICOC framework, which stands for Population, Intervention, Comparison, Outcome, and Context, will be used. Table 2 explains the framework and indicates the relevance of each concept to this systematic literature review (SLR).

2.2. Research Aim and Objectives

Defining the research scope using the PICOC framework, the following aim, objectives, and three research questions have been derived. The aim of this review is to investigate the current capabilities of through-transmission thermography and identify the research gap that currently exists using this method. The research aim will be achieved by accomplishing the following set of objectives.
  • Identify the capabilities of through-transmission thermography for thermal material property evaluation.
  • Explore the current state-of-the-art in through-transmission thermography.
  • Identify the limitations of through-transmission thermography in terms of material characterisation.
Based on the research aim and objectives, three research questions that this paper will answer are the following:
  • How effectively can through-transmission thermography evaluate thermal material properties?
  • What are the fundamentals (definition, working principle, application) and the current state-of-the-art in through-transmission thermography for material and defect characterisation?
  • What advantages and/or limitations does the transmission mode have in terms of defect and material characterisation compared to the reflection mode?
After defining the research scope, the resulting aim, objectives, and the research questions, to ensure that the conducted literature review can be defined as systematic, an appropriate search strategy needs to be implemented. The resulting papers then have to be screened based on certain inclusion and exclusion criteria outlined in Table 3 to ensure that the final set of papers is within the scope of this review. To accomplish this, the database Scopus was used, as it covers both journal articles and conference papers that can be selected to be part of this review.
To ensure the review covers all the literature available on active thermography using transmission mode, the authors have included synonymous terms as the search strings as well. For example, for the transmission mode of infrared thermography, the phrase “through transmission” is synonymous with “transmission mode”. However, searching the terms “through transmission” and “thermography” yields results related to ultrasound testing where the “through transmission” method is widely used as well (e.g., through transmission laser welding). To exclude these results, a specific exclusion criterion was added to limit the search results to thermography. It is also important to note that to include papers that discuss material characterisation, the authors limited their search to thermal material properties, which is why the term “thermal diffusivity” was used as part of the search strings. A detailed overview of the search strings is shown in Table 4. To manage the selected references, Mendeley (http://www.mendeley.com accessed on 10 July 2024) was used for its ease of access, add-in for Microsoft Word for in-text citation (which has been used for writing this paper), and an integrated pdf viewer, which allows its users to download available articles so that they can be uploaded and viewed on Mendeley directly.

2.3. Appraisal

The second step in the SALSA framework is the appraisal, where the papers resulting from the search string need to be evaluated and either included or excluded based on the criteria shown in Table 3. The literature search using the strings mentioned in Table 4, which ran on the 1st of July 2024, yielded a total of 379 results. Then, based on the specific inclusion and exclusion criteria, the total number of papers was narrowed down to 81. These articles are then used for the next parts of the review.

2.4. Synthesis

The next phase in the systematic literature review is the synthesis phase. This phase involves the extraction and classification of information from the final selection of articles to help answer the research questions mentioned in Section 2.2 during the search phase. To be able to do this in an efficient and systematic way, the articles were tabulated in Microsoft Excel. The included papers were then analysed and evaluated on their reporting quality in several key areas that the authors deemed to be important in answering the research questions.
Furthermore, since this paper employs a mixed synthesis strategy, the publication elements of the papers are also selected as part of the synthesis process. Table 5 shows all the records selected for this phase of the review.

2.5. Analysis

The analysis phase of the systematic literature review involves extracting the relevant information from the final selection of papers. This phase can be divided into two parts. The first part is a thematic analysis, which includes the quantitative and qualitative elements listed in Table 5 and correlates these elements with the selected list of papers. The next step will evaluate the selected studies to answer the research questions outlined in Section 2.1. Finally, the last step is the conclusion, which provides a brief summary of what this review had set out to achieve and to what extent it has managed to do so. It will also highlight some of the key findings in the review and provide some insight into future research opportunities.
The following subsections will describe the qualitative and quantitative elements used in this review in greater detail.

2.6. Quantitative Elements

The quantitative elements mentioned in Table 5 are the basic elements extracted from the selected articles before full-text reading:
  • Authors;
  • Keywords;
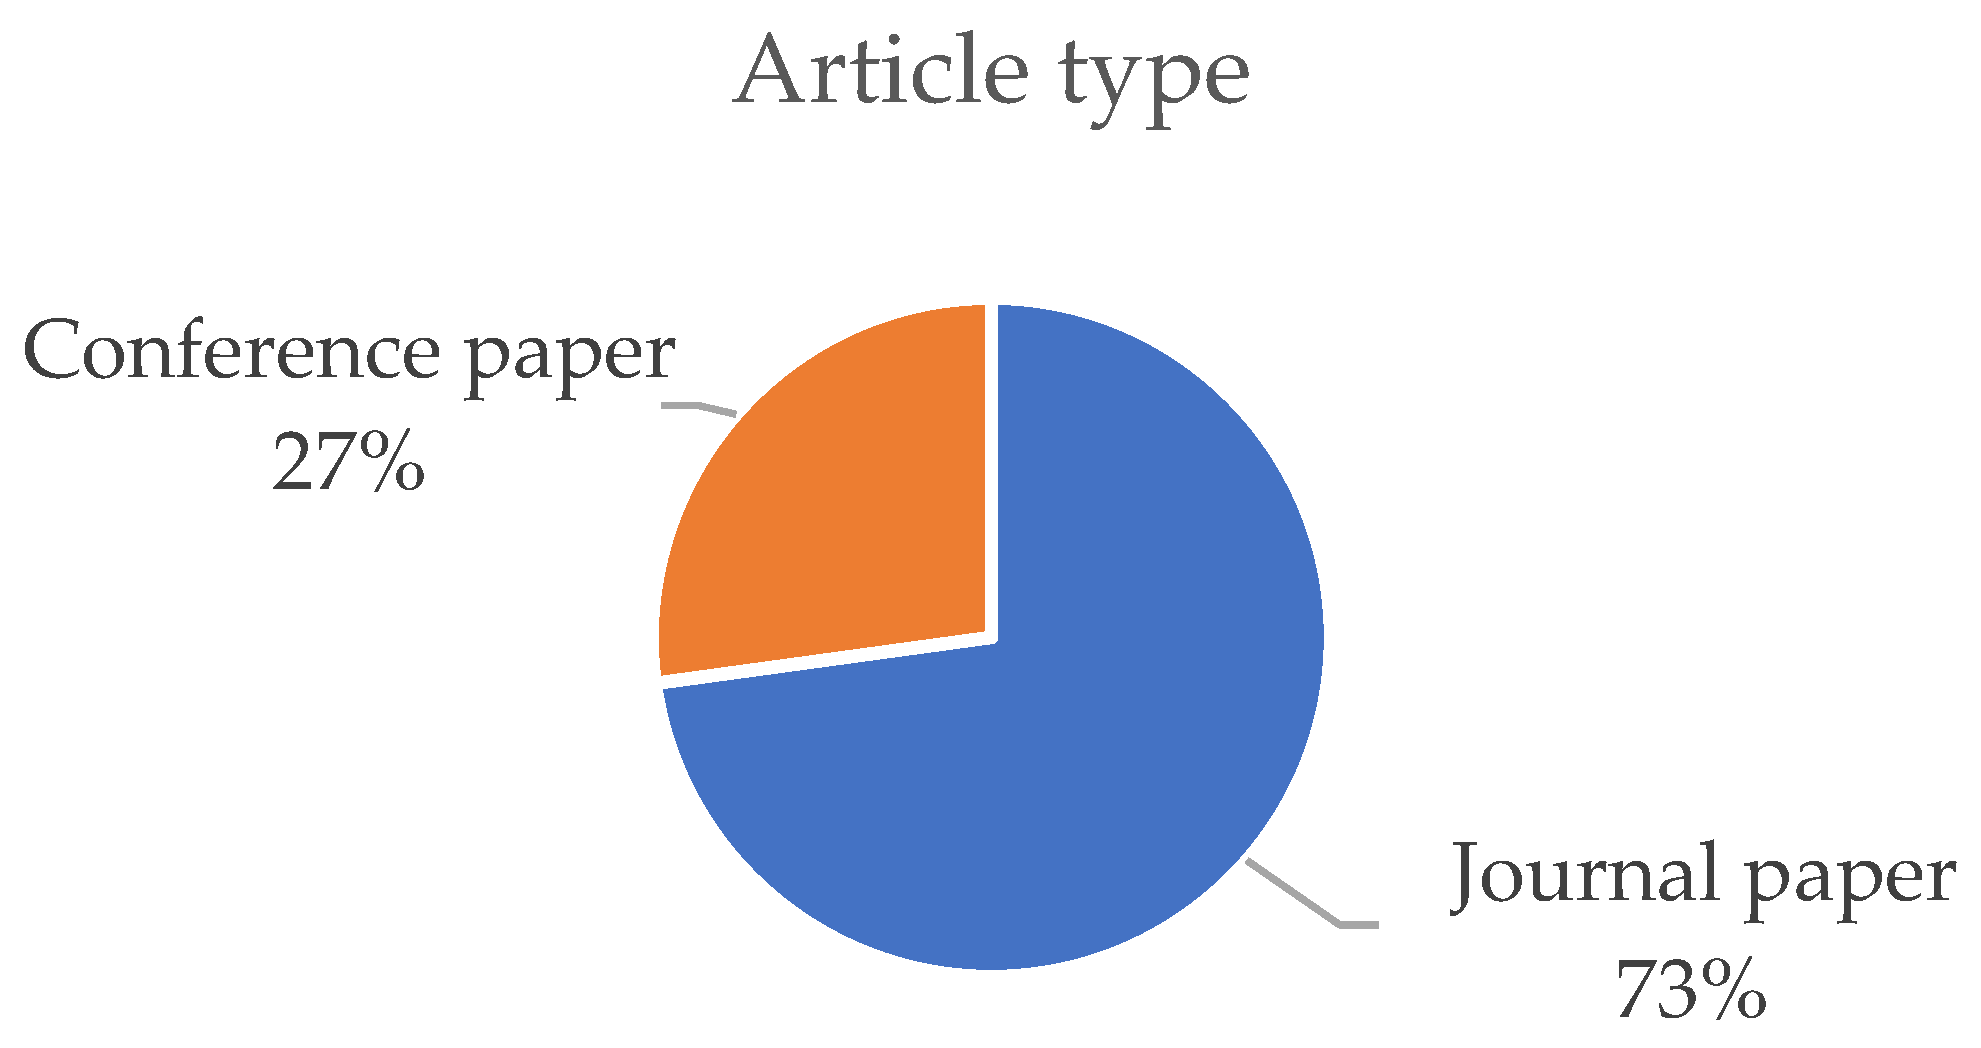
  • The type of paper, whether it is a journal or conference paper and which journal or conference the paper has been published in;
  • Year of Publication.

2.7. Qualitative Elements

This review also addresses the qualitative elements of the review. These elements will aid in identifying the current research gap in through-transmission thermography and help answer the research questions that were mentioned in an earlier section of the paper. These elements include the following:
  • Definition of the said technique and the materials used to apply the mentioned technique;
  • Working principle of the techniques used;
  • Data processing algorithms;
  • Data analysis;
  • Conclusion and future work.

2.7.1. Definition and Materials Used

The first element analysed for the thematic synthesis is the definition and materials. The final set of selected papers was screened to observe how they define the technique used, whether it is the reflection or the transmission mode. With regards to materials, the industries that use thermography for applications such as structural integrity often tend to use metal alloys, such as titanium and nickel alloys [6,7,8], as well as composite materials such as carbon fibre-reinforced polymers (CFRPs) [56,57,58]. This has led to a lot of research effort being focused towards developing novel techniques to evaluate their material properties. Furthermore, this review also includes all the equipment used to conduct the experiment or simulations as part of the materials.

2.7.2. Working Principle

As mentioned at the beginning of this paper, each NDT method operates on a set of physical principles that govern it. Therefore, the working principal element of the qualitative analysis will evaluate how the authors explain the physics/operating principles of through-transmission thermography. Similarly, as mentioned in the previous subsection, the evaluation of the working principle will not be limited to just through-transmission thermography but will also include the working principles of the thermal excitation method.

2.7.3. Data Processing Algorithms

Raw thermograms often have noise from various sources embedded in them, which can make distinguishing actual data challenging. To eliminate this noise, numerous signal and image reconstruction algorithms have been developed. This part of the qualitative analysis will explore the various algorithms and how they are used to improve the raw data.

2.7.4. Data Analysis

The data analysis element of the review explores the methods used to analyse and interpret the data obtained and the implications it has. This can include data visualisation in the form of graphs to describe trends and/or anomalies in the data and an explanation of the behaviour. Furthermore, quantities such as repeatability and measurement uncertainty will also be evaluated to determine the quality of the data presented.

2.7.5. Conclusions and Future Work

The final qualitative element used as part of the analysis is the conclusion and future work. The continuous and evolutionary state of research dictates that no study will be comprehensive and will have certain limitations that need to be explored further. This review will evaluate the conclusions the authors have drawn from their research and what limitations they have identified. This part of the review is crucial as it highlights the current state-of-the-art and the limitations of through-transmission thermography.

3. Results

This section of the paper presents the findings of the final selection of papers used for this review. It is divided into two subsections; the first is a quantitative analysis that includes the quantitative elements defined in Table 5 in the previous section, followed by a qualitative analysis using the elements defined in the same table.

3.1. Quantitative Analysis

Figure 3 shows the number of authors that have at least two or more publications in the final selection of papers. From the figure, it can be seen that Salazar, Mendioroz, and Maldague have the greatest number of publications, with four each. This is followed by Sfarra, Mayr, Krishnamurthy, Kalyanavali, Ishizaki, Ibarra, Balasubramanium, and Avdelidis, each of them having three publications. The rest of the authors have two.
Figure 4 shows the most common keywords for the final selection of papers appearing at least three times or more. The phrase “thermal diffusivity” is the most commonly used term, which makes sense as it was also one of the search terms. This was followed by “infrared thermography”, which appeared 15 times. Other common keywords, while occurring more than three times, appeared in less than ten instances.
Table 6 and Table 7 show the names of the journals and conferences, respectively, along with the papers that were published in them. The journal that had the greatest number of publications was NDT and E International, with 6 publications, and the conference in which most of the papers were presented was Thermosense, which had 11 out of the 22 publications. Overall, studies have been published in different journals with varying scopes, highlighting the versatility of the technique.
The pie chart in Figure 5 shows the distribution of publications among journals and conferences. Out of the 81 papers selected, 73% (59) were published in journals, and the remaining 27% (22) of papers were published in conferences.
The number of publications per year from the selected list of papers is displayed in Figure 6. Most of the publications seem to be between 2014 and 2018. There is no trend in terms of increasing or decreasing publications except for a decrease seen between 2009 and 2011. On average, there are five publications per year. It is also important to mention here that while there have been publications in 2024, these papers have been excluded since they do not meet the inclusion criteria of this review. The limited number of papers throughout the years can be attributed to the lack of popularity of the transmission mode compared to the reflection mode.

3.2. Qualitative Analysis

The following subsections evaluate the selected list of papers based on the qualitative elements listed in Table 5.

3.2.1. Definition and Materials

The definition and materials element in this review is associated with the definition of through transmission. The materials are simply the specimen and the equipment used for capturing data. With respect to the definition of through-transmission thermography, most of the selected papers define the technique as heating the specimen on one side and placing the camera on the opposite side of the specimen [63,92,105,114,133,134]. Other studies do not explicitly provide a definition for the transmission mode but do provide a schematic of the through-transmission configuration [47,60,87,125]. For the materials, the standard experimental setup consists of a specimen that needs to be inspected, a heat source, and an infrared radiometer. However, conducting purely numerical/simulation-based research nullifies this requirement, as computer software is used instead. The literature search revealed that the most common heating source for active thermography in transmission mode includes flash lamps, laser pulse, eddy current coils, and halogen lamps.
Based on the final selection of papers, most of the papers focused on evaluating the material properties of composite materials, which is evident in [47,60,62,66,87,125]. Composite materials such as CFRPs have become increasingly popular in various industries, such as the shipbuilding, aerospace, automotive, and sports industries [139]. Their success could be attributed to their high strength-to-weight ratios. Another popular material is steel. As mentioned in an earlier section, the material element also incorporates the software packages used for the numerical/computational analysis. For this purpose, the literature shows that the finite element software COMSOL is a popular choice for performing numerical analysis [82,108,109,136]. Another popular commercially available software used for finite element analysis (FEA) analysis is ANSYS [114,134]. Based on the author’s experience using both software, COMSOL may be the preferred software, as it is more user friendly, allows for multiphysics modelling, and allows the user to input their own equations. However, ANSYS offers better meshing and more robust solvers; hence, it is used more than COMSOL in the industry.

3.2.2. Working Principle

The next element for qualitative evaluation is the working principle. While the definition element defines what the technique is, the working principle explains the physics behind the technique. For through-transmission pulsed thermography, most of the selected papers adopt Parker’s model (Equations (4)–(6)) [140]. Motivated by the solution presented by Carslaw and Jaegar (Equation (3)), Parker et al. provided a solution to the 1D heat transfer problem by addressing two major obstacles that lead to difficulties in solving the classical heat conduction equation. Firstly, a flash excitation is introduced to eliminate the thermal contact resistance between the heat source and the sample. Secondly, the effect of surface heat loss is removed by taking the heat measurements in a very short period of time so that the cooling time is reduced to a minimum. Using these two conditions, any semi-infinite homogenous material with thickness L subjected to a Dirac pulse of energy Q , the temperature evolution with respect to time can be described by the following relationship [140]:
T L , t = Q ρ C L 1 + 2 n = 0 1 n exp n 2 π 2 α t L 2  
In the equation, a dimensionless quantity F can be introduced, where F = α t L 2 is the Fourier number that characterises a material’s transient heat conduction. It is the ratio of the material’s diffusive rate to its storage rate. To make the equation above independent of material properties and dimensions, Parker introduces two dimensionless quantities V = T T M , which is a ratio of the temperature to the maximum temperature T M the backwall can reach and ω = π 2 α t L 2 , which is the dimensionless quantity of time. Using this relation, Equation (4) is then reduced to:
V L , t = 1 + 2 n = 0 1 n exp n 2 ω  
Figure 7 shows the reflection and transmission configurations of flash thermography along with their corresponding time vs. temperature plots generated on MATLAB R2023a using Equation (5). To generate Figure 7a, the 1 n term is removed to show the temporal behaviour at the front wall. Additionally, to show the temporal behaviour when a defect is introduced, Figure 8 was generated on COMSOL v.6.0, a commercially available finite element modelling software. The sample was a 200 mm × 150 mm × 10 mm steel plate with thermal conductivity k = 45 W/mK, density ρ = 7850 kg/m3, and specific heat capacity C = 475 kJ/kgK. The defect was an airgap in the shape of a circle with a radius of 8 mm, and the depth of the defect was 1 mm from the front wall. The above method for through-transmission is currently the standard and is used for determining the thermal properties of materials also used by commercial apparatus such as the laser flash apparatus Netzsch LFA 427 [141]. This system evaluates the thermal diffusivity of a material using Parker’s half-rise equation. The method utilises the time taken for the temperature to reach half the maximum temperature, where ω = 1.38. If the length of the sample is known, the thermal diffusivity (m2/s) can be evaluated using the following formula:
α = 1.38 L 2 π 2 t 1 2  
While Parker’s method has remained the most popular choice for determining thermal properties, there have been some efforts to develop novel techniques in through-transmission thermography. One such effort can be seen in a paper published by Chihab et al. [75]. The paper provides a more novel and efficient formula for calculating thermal diffusivity by addressing an issue that Parker fails to consider, which is heat losses in the rear and front faces. According to the method, the thermal diffusivity can be expressed as a function of the natural logarithm of the backwall temperature curve’s descending part as well as the Biot number relative to the front and backwall heat losses. This is achieved by solving the transient heat conduction equation using Green’s function. Then, in the Laplace domain, the integral expressions for the front and backwall temperatures are calculated using the analytical solution ranging from 0 to +∞. Approximating the solution numerically yields a formula for the Biot number on the rear face.
To identify defects in structures, the temperature curve can be observed from either the front or back surface. A deviation of the curve in the defected zone compared to the sound area can be used to determine the defect properties. Vageswar et al. [109] utilise the deviation of temperature to measure wall thinning, which is a common material degradation mechanism for corrosion. In the paper, the slope of the temperature contrast between the defect and the defect-free zones is determined. Then, the first derivative of the curve is used to determine the defect depth. The slope reaches a maximum, referred to as the peak slope time, td.
The paper also concludes that the peak slope time is proportional to the square of the defect. Furthermore, as long as the ratio between the defect length and the defect-free length, Ld/L is less than 0.5, the peak slope time can be calculated using the defect length as shown below [109].
  t d = 0.9 L d 2 π 2 α  
Alternatively, if the ratio exceeds 0.5, then in the above equation, 0.9 needs to be replaced by another factor from the graph, which displays the variation in the proportionality factor ωd with Ld/L.
An important material property that has been the focus of many of the selected papers is the determination of the material thermal diffusivity. The thermal diffusivity is a parameter that governs how quickly the temperature of a material will change when heated. As mentioned in an earlier section, it is dependent on the material’s thermal conductivity k (W/mK), its density ρ (kg/m3), and its specific heat C (J/kg K). Defect characterisation is possible by observing the change in material thermal diffusivity between the defect and the defect-free zones. The change in the defect zone will cause a temperature change different from the one observed in the defect-free zone. Furthermore, thermal diffusivity measurements have also been linked to the integrity assessment of thermal barrier coatings TBCs [60]. It has been observed that there is an increase in thermal diffusivity from smaller fractions of spent life and decreases at higher fractions. A non-monotonic trend is observed between the thermal diffusivity and the spent life. The cause for this has been attributed to the progressive growth of cracks and their propagation parallel to the boundary between the TBC top layer and bond coat during the cyclic oxidation tests, which caused an increase in thermal diffusivity. This effect is nullified at longer times, where a decrease in thermal diffusivity is observed. The effect on thermal diffusivity due to progressive cracks inside the TBC can be used to estimate the degree of damage.
Most papers address the challenge of thermal diffusivity through the thickness of the material. This diffusivity is labelled as the transverse diffusivity, as reported in [65]. The transverse diffusivity is defined as the diffusivity measured in the direction perpendicular to the x-y plane of a sample. For this purpose, the 1D heat flow approximation of Equation (1) is valid and adequate for determining the material thermal diffusivity. Another assumption made in this process is that the inspected material is isotropic, which means its intrinsic properties are independent of orientation. For anisotropic materials, this is not the case, so the 1D heat approximation derived for the z-direction (through thickness) no longer holds. Here, the longitudinal thermal diffusivity, i.e., the diffusivity measured parallel to the x-y plane also needs to be measured in order to obtain a thorough assessment of the material’s thermal properties. Equations (8)–(14) [65] describe this process. First, the temperature response T(x,y,t) is measured using an infrared camera. This results in time series data, which are then converted in terms of spatial frequencies using the Fourier transform, and thus, the following equation is obtained:
θ α n , β m , z , t = 0 L 0 l T x , y , z , t cos α n x cos β m y d x d y  
where L and l are the dimensions of the sample in the x and y directions, α n = n π l and β m = m π L are the discrete eigenvalues for the boundary conditions in the x and y directions. Performing a Laplace transform on Equation (8) yields
Θ α n , β m , e , p = F α n β m sinh γ e λ m γ + h 2 λ z γ + 2 h c o s h γ e  
where γ is:
γ = p + a x α n 2 + a y β m 2 a z  
where F α n β m is the Fourier transform coefficient of f x , y and a x , a y , a z are the thermal diffusivities in the x, y, and z directions. It is important to mention here that:
Θ α n , β m , e , p = S α n , β m , p + k  
with
k = a x α n 2 + a y β m 2  
Therefore, leveraging the shift property in Laplace space, a straightforward expression can be derived in the simple Fourier space:
θ α n , β m , e , t θ 0,0 , e , t = F α n , β m F 0,0 · exp k t  
where θ 0,0 , e , t is the temperature average of the rear face multiplied by its surface:
T ¯ t = 0 L 0 l T x , y , e , t d x d y / l L = θ 0,0 , e , t l L  
Equation (13) can be used to estimate a x by setting α n 0 and β m = 0 or a y by setting β m 0 and α n = 0 .
Another important factor that most papers consider is that the material under assessment is usually opaque. Based on the final selection of papers, three explicitly discuss the assessment of semi-transparent materials. Pawlak et al. [98] discuss the use of lock-in thermography to assess a GaAs semi-transparent wafer. The theoretical model is described by Equations (15)–(17) [98]. Firstly, the photothermal infrared radiometry (PTR) signal in the transmission configuration is written as:
  S 1 f , β e x t , β I R 0 L β I R · T 1 z , β e x t · exp β I R · L z d z  
where β e x t is the optical absorption coefficient of the material at the wavelength of the excitation source and T 1 z , β e x t is the thermal wave field equation, L is the sample thickness, f is the modulation frequency, and β I R is the infrared absorption coefficient. Assuming 1D approximation, the PTR signal can be written as:
S t r a n s ω , β e f f , I R = T 1 β e f f , I R 2 k m β e f f , I R 2 σ t 2 × 2 g + t t + 1 1 + g e σ 1 L + ( t 1 ) ( 1 g ) e σ 1 L e β e f f , I R L ( 1 + g ) 2 e σ 1 L ( 1 + g ) 2 e σ 1 L  
Here, T 1 is the instrumental factor t ω = β e f f , I R / σ t ( ω ) , σ t ( ω ) = s q r t ( ( i . ω ) / α i d ) where α i d is the thermal diffusivity, g = k g · s q r t ( α i d ) / k i d · s q r t ( α 0 ) , k i d is the thermal conductivity of the material, ω = 2 π f . The effective infrared absorption coefficient β e f f is the weighted average value of the infrared absorption coefficient and given by the relation:
  β e f f , I R = λ m i n λ m a x R d e t λ W λ β , I R ( λ ) d λ λ m i n λ m a x R d e t λ W λ d λ  
β I R is defined as the IR absorption spectrum of the sample. The sensitivity limits of the detector are denoted by λ m a x and λ m i n , the spectral sensitivity of the detector is R d e t λ , and finally, the temperature derivative of Planck’s expression for the spectral radiance is given by W λ = W / T λ .
For pulsed thermography, Salazar et al. [97] derived Equations (18)–(25) to effectively extend the original flash method introduced by Parker and applied it to measure the thermal diffusivity of semi-transparent solids. Here, a semi-transparent slab with thickness L is used as an example that is thermally excited using a light beam with wavelength λ and intensity Io. Using the Beer–Lambert law and taking multiple reflections of the incident light beam, the light intensity inside the sample can be written as:
I z = I o 1 R e α z + I o 1 R e α z R e α L z + I o 1 R e 2 α L R 2 e α z +   = I o 1 R ( e α z + R e 2 α L e α z ) 1 R 2 e 2 α L  
where R and α are the optical reflection and absorption coefficients of the slab at the wavelength of the incident light beam (λ), respectively. The Laplace transform for the heat diffusion equation is then written as:
d 2 T ¯ d z 2 q 2 T ¯ = P o ¯ 1 R α ( e α z R e 2 α L e α z ) K 1 R 2 e 2 α L  
where the Laplace transform of the sample temperature is expressed by the symbol T ¯ , and the temporal shape of the light beam is denoted by P o ¯ . The thermal conductivity of the sample is K and q = s / D , s is the Laplace variable, and D is the thermal diffusivity of the material. Neglecting the thermal conduction due to the surrounding gas, the general solution to Equation (19) can be written as a superposition of the solution to the homogeneous equation with a particular solution of the non-homogeneous equation:
  T ¯ z = A e q z + B e q z + C e α z + E e α z  
The coefficients of the particular solution are given by:
C = P o ¯ ( 1 R ) α 2 K ( q 2 α 2 )  
  E = P o ¯ 1 R α R e 2 α L 2 K ( q 2 α 2 )
To obtain constants A and B in Equation (20), the boundary conditions applied to the sample surfaces are used:
K d T ¯ d z z = 0 = h T ¯ z = 0  
K d T ¯ d z z = L = h T ¯ z = L
where the linear coefficient of heat transfer is h, which takes into consideration the combined effect of convective and radiative heat transfer. Assuming h is the same at both surfaces, the Laplace transform of the temperature inside the sample is given by:
T ¯ z = C A 0 e q z + B 0 e q z E 0 + e α z + E A 1 e q z + B 1 e q z E 0 + e α z  
where:
A 0 = e q L q h K α + h K + e α L q + h K α + h K  
B 0 = e q L q + h K α + h K + e α L q h K α + h K  
A 1 = e q L q h K α + h K + e α L q + h K α + h K  
B 1 = e q L q + h K α + h K + e α L q h K α + h K  
E 0 = e q L q h K 2 + e q L q + h K 2  
As mentioned in previous equations for semi-transparent materials, a variable β is introduced. This variable represents the effective IR absorption coefficient for the sample under observation. The reason for introducing this variable is because, for semi-transparent materials, the signal recorded by the infrared radiometer does not only come from the sample surface but also from the bulk. Keeping this in mind, the Laplace transform of the signal recorded by the infrared radiometer in the transmission configuration is:
S ¯ L = F 0 L β e β z L T ¯ z d z  
The constant F includes the emissivity of the sample, detectivity, and the sensor area, as well as the temperature derivative of the Planck function at room temperature. It also includes the effect of multiple reflections of the IR emission in the walls of the sample. T ¯ z is the Laplace transform of the sample temperature given in Equation (22). Substituting Equation (22) into Equation (24) and analytically solving the integral Laplace transform of the recorded IR signal is given by:
S ¯ L = F C β e β L E o A 0 q + β 1 e β + q L + B o q β 1 e β q L + E o α β 1 e β α L + F E β e β L E o A 1 q + β 1 e β + q L + B 1 q β 1 e β q L E o α + β 1 e β + α L  
The last paper in the final list of selected papers that deals with semi-transparent materials is a paper written by Exarchos et al. [126]. The paper deals with a non-destructive technique based on near-infrared (NIR) imaging to assess transparent and semi-transparent composite materials. It introduces the NIR double-transmission mode (NIR-DTM) composed of an NIR sensor, an illumination source, and a reflector surface behind the samples under inspection, which, in this case, were GFRP samples. The technique in this configuration provided a higher spatial resolution of the defect and allowed for a more accurate estimation of the defect size compared to the NIR in the reflection mode.
As mentioned in the previous subsection, the most commonly used techniques used to thermally excite the specimen are flash lamps, eddy current coils, laser pulse, and halogen lamps. The papers that have used pulsed thermography as the thermal excitation method use a description similar to what is explained by Parker et al. [140]. Parker describes the flash as an instantaneous heat source that, when applied to a specimen, heat is “instantaneously and uniformly absorbed in the small depth g at the front surface x = 0…”. The flash is defined as a Dirac pulse with an energy q0. A Dirac pulse is a pulse that has values of zero everywhere except a time zero. It is also known as a unit impulse. Another thermal excitation method is the pulsed eddy current method, which delivers the same pulse of energy to heat up the specimen but with the use of an eddy current coil instead of flash lamps. The articles that have used eddy current heating as the excitation source describe the physical phenomena in three subcategories. These are eddy current induction, Joule heating, and heat conduction. The first is the eddy current induction, where eddy currents are induced into a material by bringing a current-carrying coil to a conducting material. This induces a localised current perpendicular to the coil’s orientation, known as an eddy current. These eddy currents have a penetration depth, which is governed by the following relationship [66]:
δ = 1 π μ σ f  
where δ (m) is the depth, f (Hz) is the excitation frequency, σ is the electrical conductivity in S/m, μ is the magnetic permeability in H/m. The heating phenomenon is known as Joule heating, which is caused by eddy current-induced resistive heating. The heat, Q, is related to the eddy current density, J, or the electric field intensity vector, E, by the relation shown in the equation below:
Q = 1 σ J 2 = 1 σ σ E 2  
Finally, the heat conduction from a Joule heating source, Q, is governed by the following relation:
ρ C p T t k T = Q  
where the density, specific heat capacity, and thermal conductivity are denoted by ρ (kg/m3), C p (J/kgK), and k (W/mK), respectively. It has also been determined that for pulsed excitation, the thermal penetration depth is dependent on the thermal diffusivity of the material α as shown in the equation below:
δ t h = α t π  
By observing Equations (26) and (29), it can be concluded that defect detection using pulsed eddy current thermography is governed by the skin depth and the thermal penetration depth. These two quantities are dependent on the material’s conductivity, permeability, thermal diffusivity, and the material observation time.
Another thermal excitation source for pulsed thermography literature was a laser pulse. Similar to a flash produced by lamps, the laser pulse is characterised by the same Dirac pulse; however, the beam is more concentrated at a certain point on the specimen.
Finally, halogen lamps have also been used in the selected papers that deal with lock-in or frequency-modulated thermography for material characterisation. The halogen lamps thermally excite the specimen by using a thermal wave with a fixed frequency value. Equations (30)–(34) [113] describe the resulting thermal behaviour induced by the halogen lamps. The first assumption made here is that the thermal wave generated is harmonic in nature and thus can be described by the following heat equation:
1 α t T T = g k  
where k is the thermal conductivity, g is the volumetric heat rate (W), and α is the thermal diffusivity. Thermal diffusivity is also defined as α = k ρ c p , where c p (J/kgK) is the specific heat capacity of the material. For a material that is isotropic and homogeneous, the problem can be reduced to a 1D problem, provided that the thickness of sample d is much greater than the thermal diffusion length μ = α π · f at the corresponding frequency of the lock-in thermal wave. The temperature within the semi-infinite body can be determined using the angular frequency ω = 2 π f , as shown in the equation below:
T d , t = A d   e d μ   e i ω t d μ  
The phase delay ϕ w a v e on the back surface can be expressed as:
ϕ w a v e = d μ  
variable b is defined as:
  b = d π α  
The phase delay of thermal wave ϕ at the back side of the sample can be defined using the phase of the thermal wave along with the system-dependent phase delay as follows:
ϕ = ϕ s y s t e m d μ = ϕ s y s t e m d π α · f = ϕ s y s t e m b · f  
the thermal diffusivity is determined by applying a curve fitting based on Equation (34).

3.2.3. Data Processing Algorithms

The next element for the qualitative analysis is the data processing algorithms. As mentioned in earlier sections, raw thermal images may contain a lot of noise, which requires processing to filter out. For defect detection, several algorithms have been used. Table 8 provides a summary of these algorithms and their corresponding equation numbers.

Pulsed Phase Thermography (PPT)

Pulsed Phase Thermography (PPT) is a technique first introduced by Maldague and Marrinetti [33]. This method converts the obtained thermographic data from the time domain to the frequency domain using the Fast Fourier Transform (FFT). This conversion offers several advantages, such as solving the issues incurred during data capture, such as non-uniform heating, irregular surfaces, and environmental reflections [144]. The conversion of each pixel from the time to the frequency domain and the following extraction of the amplitude and phase is conducted via the equations below [33]:
  F n = k = 0 N 1 T k e 2 π i k n N = R e n + i I m n  
  A n = R e n 2 + I m n 2   a n d   Φ n = a   t a n I m n R e n  
where Re and Im are used to obtain the amplitude An and phase angle Φ n in Equation (36). Furthermore, information on the defect depth can be extracted by equating it to the blind frequency, i.e., the frequency where the defect becomes invisible, using the following relation:
d = C 1 α π f b  
where the correlation constant C 1 has values in the range of 1.5 and 2 [145].

Principle Component Thermography (PCT)

Principle Component Thermography (PCT), introduced by Rajic [142], is a signal processing technique that makes use of single-value decomposition to distinguish undesirable data from an image while retaining its major features. It reduces the temporal and spatial thermal data from three dimensions to two. The input thermal image is then reconstructed from a matrix in which each single image pixel has a raster-like arrangement on each row. This way, each column represents the temporal evolution of a specific pixel. Using Empirical Orthogonal Function (EOF) analysis, a matrix A is created with M × N dimensions, which can be decomposed as follows [142]:
A = U S V T  
where the spatial variation is represented through the orthogonal matrix U that has dimensions M × N and a set of EOFs. S is also a matrix of M × N dimensions containing the singular values of matrix A on the diagonals. The transpose of the orthogonal N × N matrix that represents characteristic time is denoted by V T .

Thermal Wave Radar Analysis (TWR)

Thermal Wave Radar Analysis [143], first introduced by Tabatabaei and Mandelis, is a subsurface imaging modality that draws from linear frequency-modulated continuous wave radars and frequency domain Photothermal Radiometry (PTR). It was specifically designed to enhance the depth resolution of subsurface defects. To calculate the TWR amplitude (CC), the following equation is used [143]:
C C τ = F 1 R E F ω S ω  
where R E F ω is the Fourier transform of a reference non-defective pixel ref(t), and S ω is the Fourier transform of pixel s(t). The symbol denotes the complex conjugation. The inverse Fourier transform and the time delay between ref(t) and s(t) are denoted by F 1   and τ , respectively. ∆CC, which is the differential TWR CC, is calculated as shown in Equation (40):
C C τ = C C τ C C r e f τ  
The object temperature and emissivity strongly affect the TWR amplitude (CC). Equation (41) can be used to calculate the TWR phase ( θ ).
θ τ = F 1 R E F ω S ω F 1 i s g n ω R E F ω S ω  
where s g n ω is defined as the signum function and i is the imaginary component. The phase θ is independent of the emissivity and dependent on the time-delay quantity. The TWR phase differential is calculated by the following equation:
Δ θ τ = θ τ θ r e f τ  
where θ r e f τ is the reference TWR phase resulting from non-defective pixels. Δ θ τ , like θ τ , is an emissivity-independent and time-delay-dependent quantity.

Diffusion-Compensated Correlation Analysis (DCCA)

DCCA relies on analysing the correlation between the thermal response and a collection of template thermal responses that have been calculated analytically. Equation (5) in [100] is used to compute a depth library ψd(d, t) = ψ(d, α = αr, t). This results in a 2D array of size [Nd, Ns] that includes Nd depth components calculated for Ns time components based on a known thermal diffusivity value αr. This identifies the highest similarity between the measured and template response and the corresponding depth. The analytical library is standardised with respect to the temporal Root Mean Square (RMS), as the form and magnitude of the analytically computed thermal responses vary largely by depth and, therefore, cannot be used as a meaningful measure of similarity [100].
ψ d , s t d d m , t n = ψ d d m , t n 1 N s i = 1 N s ψ d 2 d m , t i ,   m 1,2 , 3 , , N d n 1,2 , 3 , , N s  
Seeking out the component that exhibits no lag time, i.e., τ = 0, is an effective strategy when there is a lack of synchronization between the excitation system and the acquisition system. For a synchronised system, it is better to seek the maximum magnitude at 0 lag time. This can be effectively determined through a singular correlation analysis of the time response throughout the depth dimension of the library.
C d d m = 1 N s i = 1 N s ψ d , s t d d m , t i T s t d t i ,   m 1,2 , 3 , , N d  
where T s t d is the standardised thermal response with respect to its RMS value:
T s t d t n = T t n 1 N s i = 1 N s T 2 i ,   n 1,2 , 3 , , N s  
Obtaining the estimated depth d ^ of the measured response, the peak C d and the corresponding depth is found using the following relation:
  P e a k C d = argmax m C d d m  
d ^ = d m | C d d m = P e a k C d  

3.2.4. Data Analysis

The data analysis element in the qualitative analysis evaluates the paper’s presentation and interpretation of the data. Thermography is primarily a visual-based inspection technique, which is why papers have conducted simulations or experiments and presented the resulting thermograms. The studies that have conducted signal reconstruction using either novel or existing techniques have also completed a comparative analysis to either validate their findings based on existing literature or to prove that their proposed method is superior [47,66,125,134,142]. Furthermore, since the presence of a defect is identified by observing a deviation in the time vs. temperature curve between defect and defect-free zones, most of the results have been presented in the form of graphs that represent this change. Verification of the findings has been conducted via several means, such as an uncertainty analysis, as shown in [96,100], that uses relative standard deviation as an indicator of measurement uncertainty. Others include different types of statistical analysis that indicate precision, repeatability, or both [75,105]. For defect depth prediction, samples of known defect depths are inspected, and the predicted values are validated by comparing them with the real values, as seen in [109]. Other studies on defect detection present the defect detection limit with little or no information on measurement uncertainty, such as in [92,114].

3.2.5. Conclusions and Future Work

This part of the qualitative analysis focuses on how the authors of the selected papers concluded their papers. This includes the limitations of their work and what could be done to improve it by proposing prospective future work. Out of the 81 selected papers, 25 of them either offered an indication or explicitly mentioned/proposed future works following their findings. Eleven papers commented purely on the limitations of the work. Six papers explicitly listed their contribution to knowledge, and two papers contained a direct comparison of their proposed methodology to existing techniques. The remaining papers provide a summary of the study and re-iterate the fact that their proposed methods can successfully deliver the desired outcome.

4. Research Outcomes

In Section 2.1, three key research questions were formulated to refine the search scope and maintain the systematic nature of this review. The purpose of this section is to provide answers to these questions based on the final selection of papers.
  • The first research question was, “How effectively can through-transmission thermography evaluate thermal material properties?” Through-transmission thermography has demonstrated that it can effectively determine thermal diffusivity. Commercial instruments such as the Netzsch LFA measure thermal diffusivity using pulsed thermography in the transmission configuration. Thermal diffusivity measurements have been taken using other active methods, such as lock-in thermography. Moreover, the technique has also been used to detect the thermal properties of different materials, such as cellulose fibres [90], spider silk [102], and other various microfibers [92].
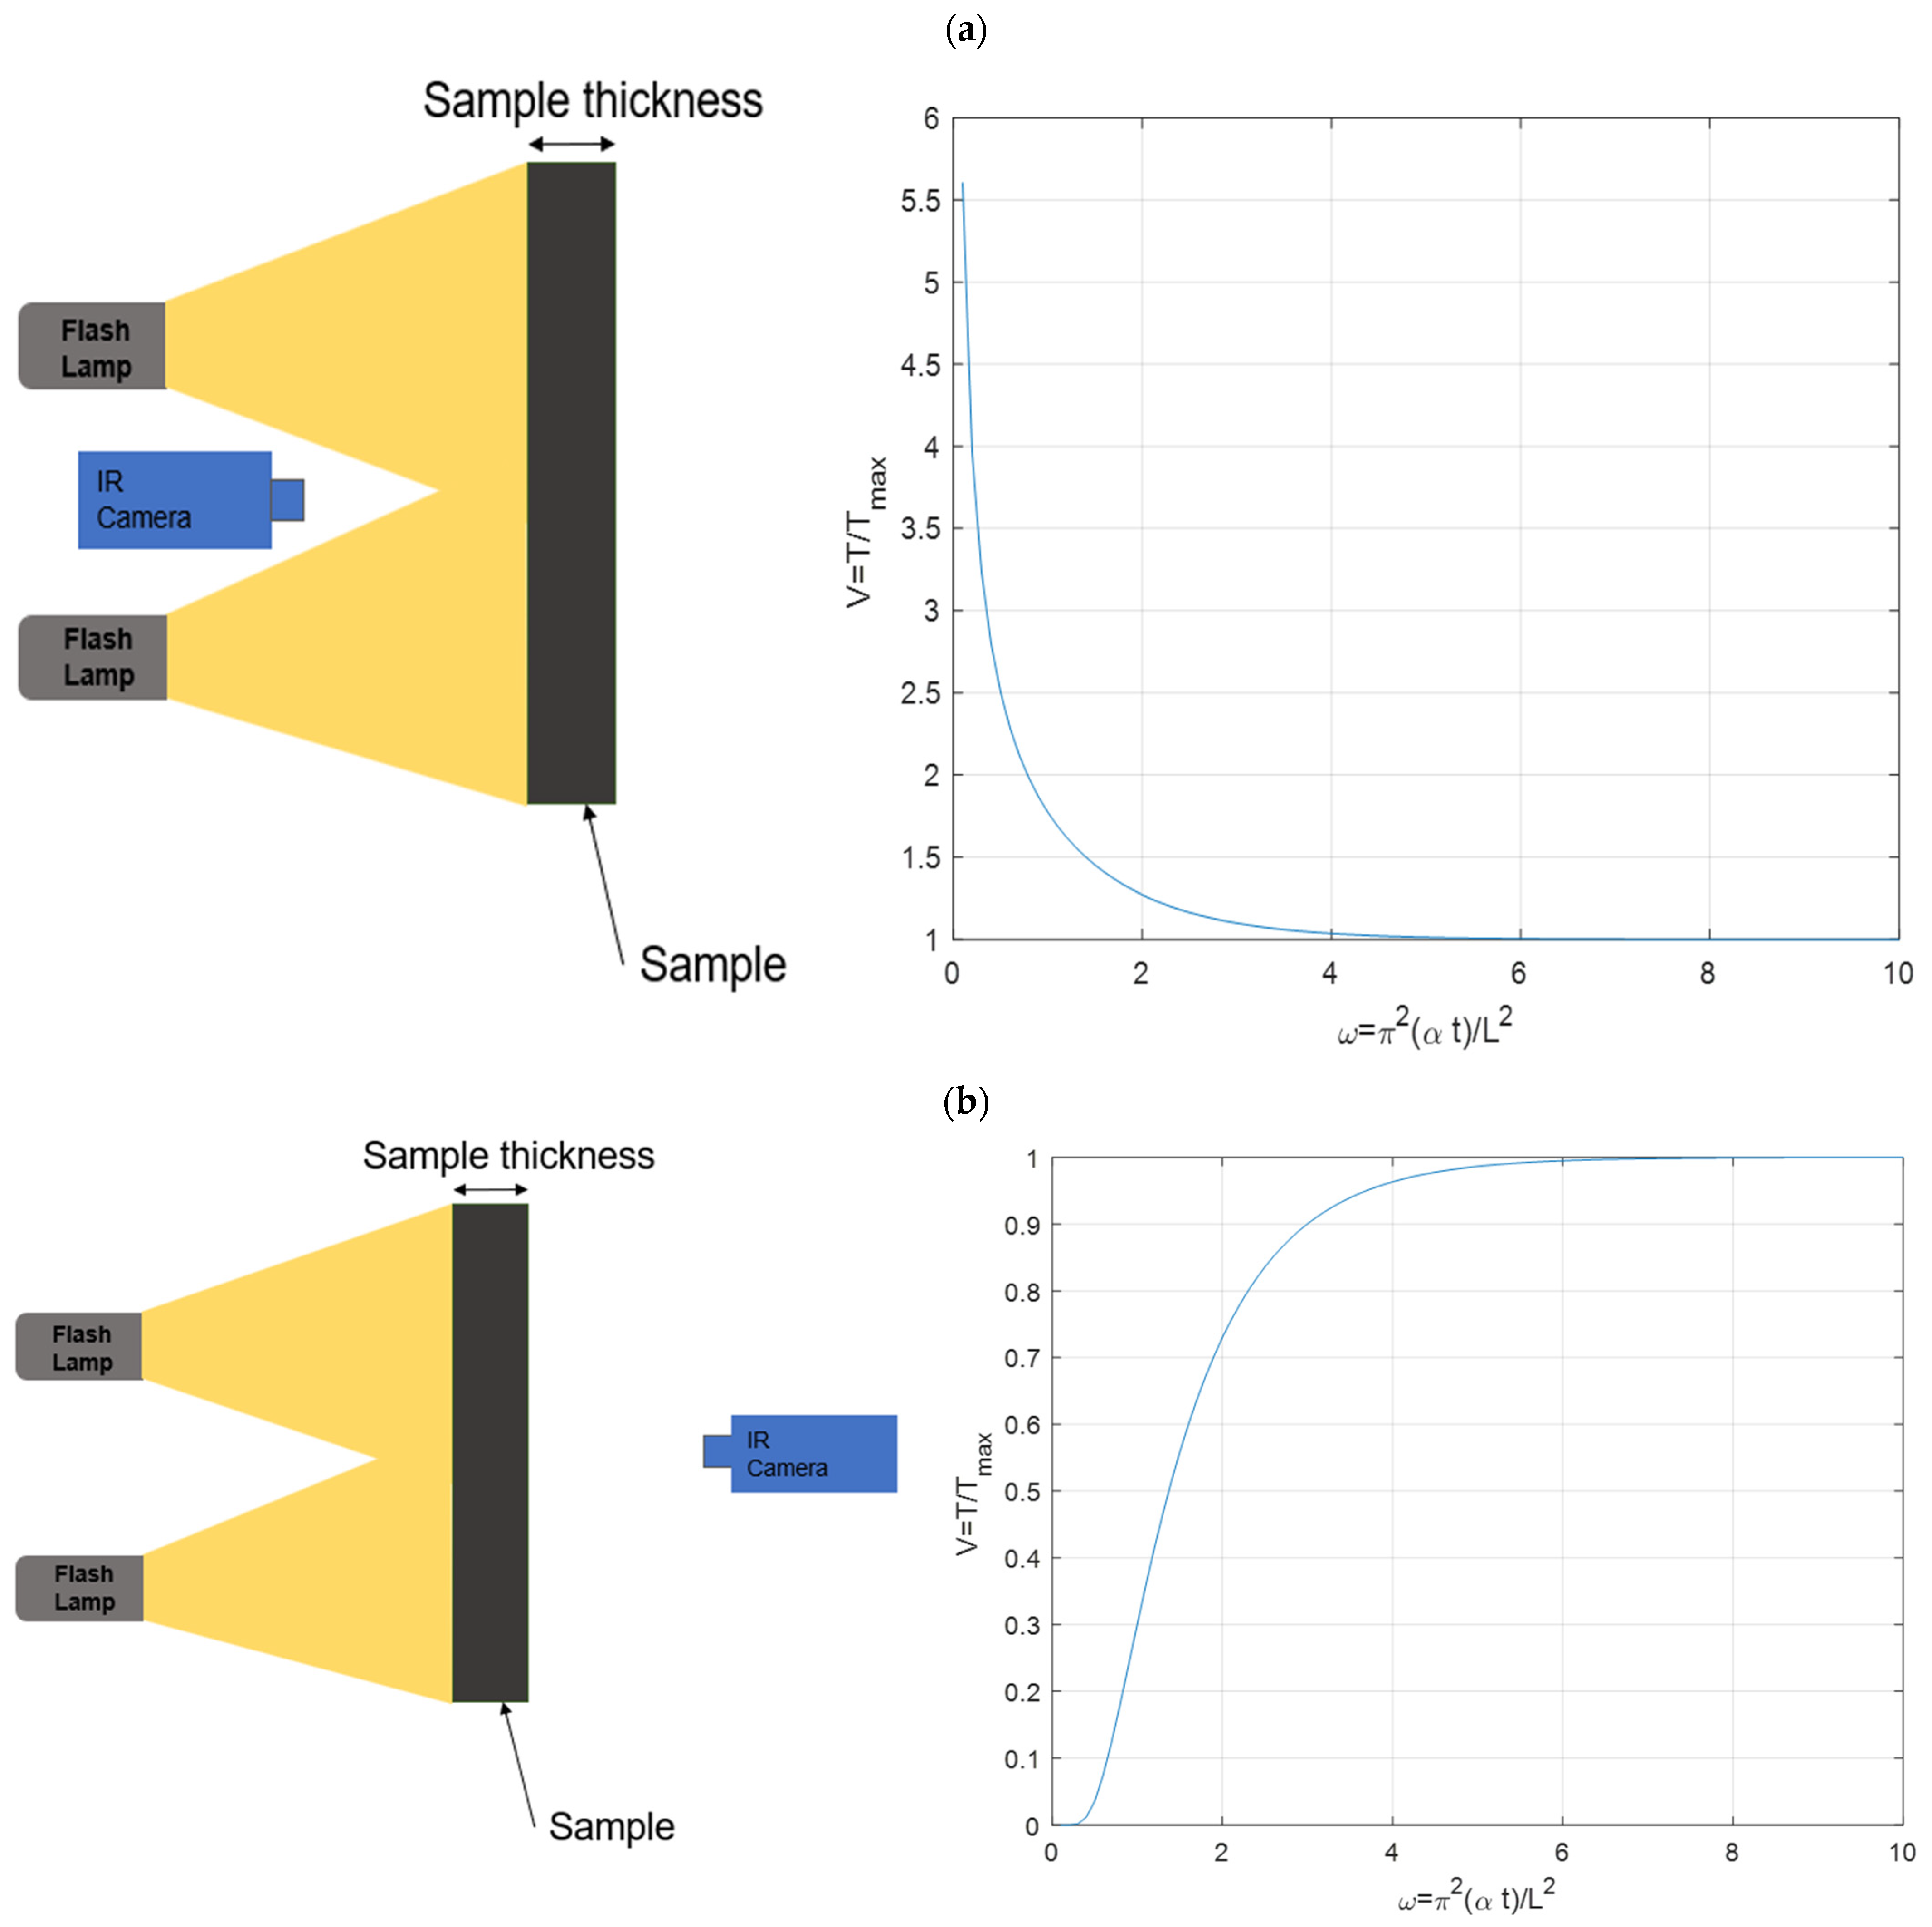
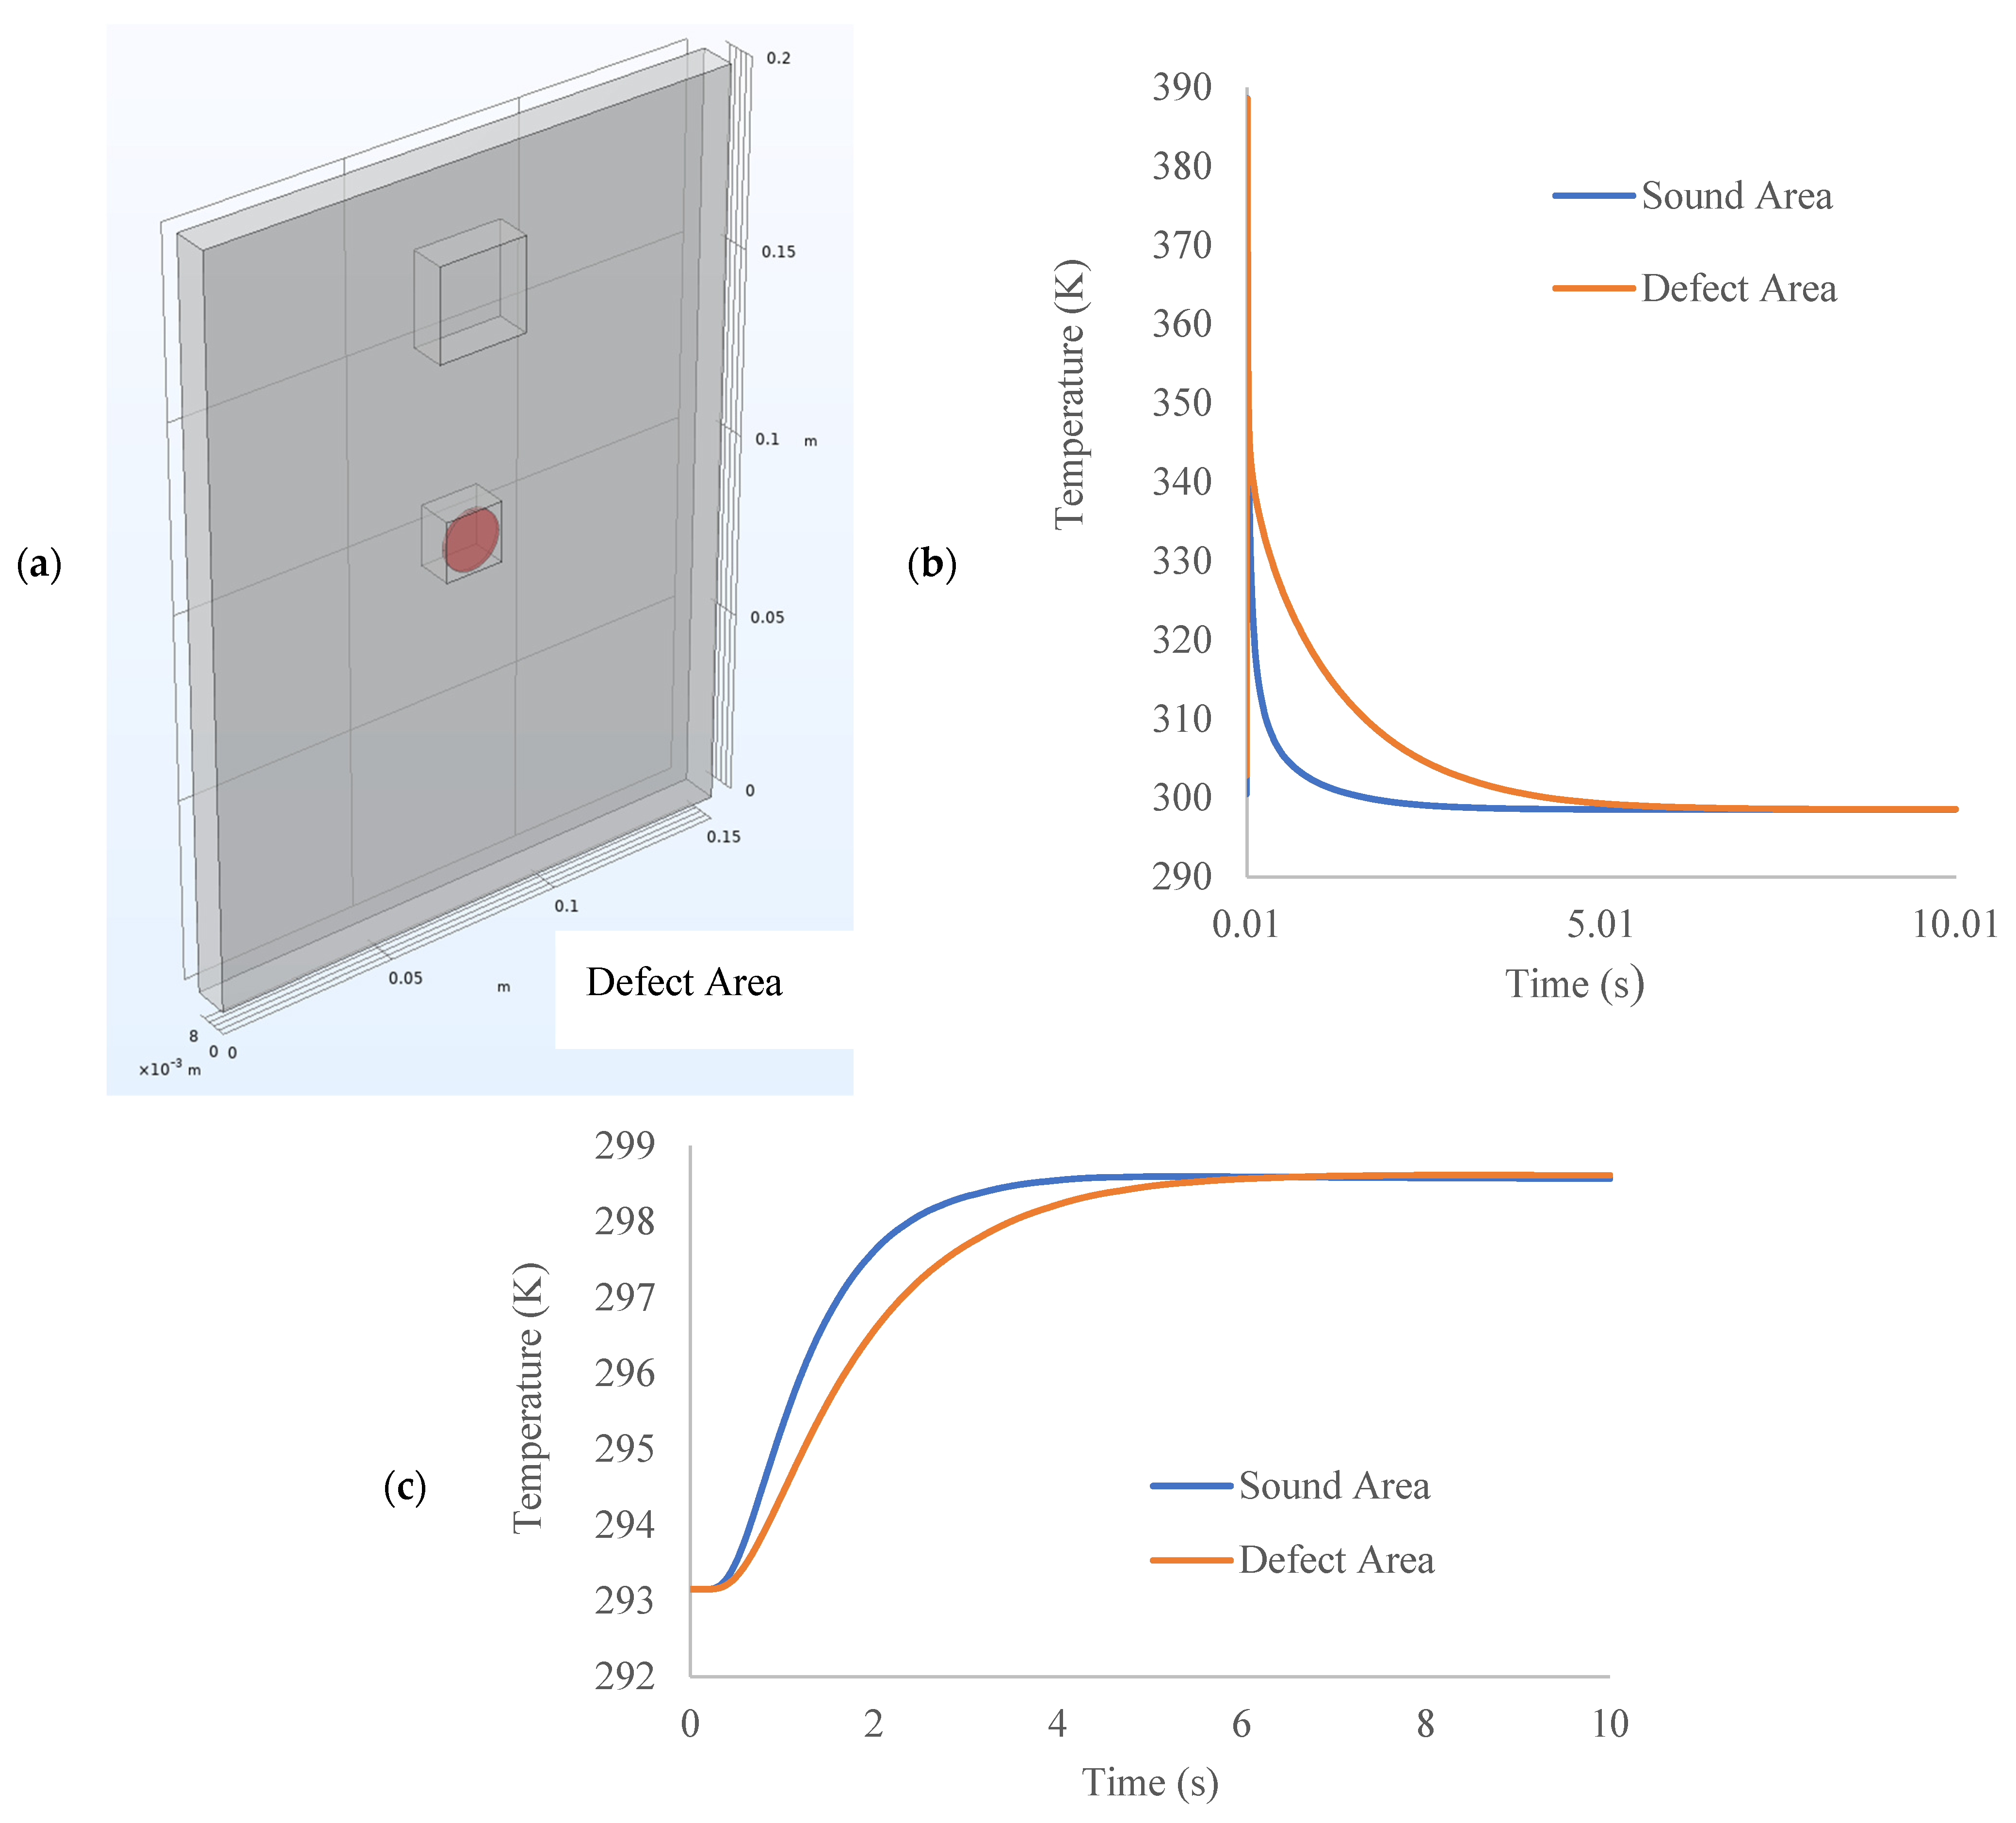
  • Regarding the second question, “What are the fundamentals (definition, working principle, application) and the current state-of-the-art in through-transmission thermography for material and defect characterisation?” Through-transmission thermography is defined by the positioning of the infrared radiometer and the heat source relative to the specimen. In through-transmission thermography, the heat source and the IR radiometer are placed on opposite sides of the specimen. Therefore, through-transmission thermography is also sometimes referred to as “two-sided testing” [139]. It is also important to note that the definition of through transmission can have various heat sources, as shown in Section 3.2.2, where the working principles of different heat sources are explained. From the literature search, it can also be concluded that heat sources which have longer heating times, such as in frequency-modulated thermography, are the preferred choice when depth information for the defect is required. This could be attributed to the frequency-dependent nature of the thermal wave. The frequency value could be changed to determine the depth of the defect. The working principle of through transmission is based on the heat diffusion theory. When a specimen is excited from one end, heat will diffuse through the material, causing a temperature rise on the back wall. While heat can travel in all three directions, through-transmission thermography focuses on one-dimensional heat transfer, which is the direction of the samples through thickness. The amount of temperature rise on the back wall is dependent on the thermal diffusivity of the material, which itself is dependent on a material’s thermal conductivity, density, and specific heat capacity. The greater the value of thermal diffusivity, the greater the rate at which temperature increases at the back wall. However, as mentioned before, heat travels in all three directions; hence, the heat intensity is reduced in the through-thickness direction as it goes through. For materials that contain defects, the literature has shown that these are in the form of an airgap, such as when a material goes through corrosion, which results in sample thinning. This means that the heat has less distance to travel in the direction of thickness, resulting in less heat dissipation in the other two directions, resulting in a localised hotspot. If the air gap is a subsurface between the front and the back wall of the sample, that will result in a cold spot at the location of the defect, as the heat will take longer to diffuse through the material since the thermal conductivity of air is less than metals and composites. In terms of theoretical models for through transmission, almost all of the papers using pulsed thermography adopt Parker’s model to calculate the thermal properties of the material. The current state-of-the-art in through-transmission thermography is tilted more towards the signal reconstruction algorithms rather than the physics behind the technique. To enhance the image obtained from raw thermographs, various signal reconstruction algorithms such as pulsed phased thermography, principal component and independent component analysis, wavelet transform, and thermal wave radar analysis are used. Thermal diffusivity measurements are also conducted using the same equation, although one study developed a novel method for computing thermal diffusivity by accounting for the heat losses in the front and rear surfaces [87]. In terms of technique development, work has been conducted on the positioning of temperature probes to calculate thermal diffusivity more accurately [83].
  • Lastly, the third and final research question was, “What advantages and/or limitations does the transmission mode have in terms of defect and material characterisation compared to the reflection mode?” Limited studies have answered this question, but it has been observed that the transmission mode is able to detect subsurface defects with better spatial resolution, as shown in [63]; however, no reason is provided as to why this happens. Based on the author’s knowledge, there are several reasons why the reflection mode is able to detect shallow defects only. One of the reasons is the physical limitation of the reflection mode. This can be explained by assuming a sample with no defects. While the temperature decay curve will flatten out after some time, as shown in [103], this characteristic time can be used to compute the length of the sample. However, for components with a greater thickness value, by the time the heat reaches the back wall, the signal-to-noise ratio is reduced to the point where detecting temporal anomalies is no longer possible. This reduction in the signal can be attributed to the heat capacitance of the material, where the heat is stored within the material rather than diffusing through its thickness. Moreover, one-dimensional heat transfer is considered, but in reality, heat is flowing in three directions, further reducing the heat propagation through the sample’s thickness. For the transmission mode, this limitation does not exist, as the temperature increase is observed from the back wall. Other limitations could be the camera itself, its sensor integration time, and the frame rate for data acquisition, in which case it misses the event at which the temperature change due to a defect occurs. Finally, there are limitations with the signal reconstruction algorithms themselves, whether they are powerful enough to enhance the raw thermograms for defect detection. The last two limitations could be attributed to both reflection and transmission modes; however, existing literature has indicated the potential for through-transmission thermography to be a better choice for subsurface defect detection and characterisation.

5. Conclusions and Outlook

The primary motivation for conducting this state-of-the-art review was to generate greater interest in thermography in the transmission mode by presenting the current state-of-the-art and highlighting its potential in defect characterisation. This revealed the untapped areas of research for this technique. With the increased use of materials, such as CFRPs, in various industries, as discussed in [63], the need for a reliable NDT technique to effectively assess the structural integrity of these structures is paramount. While the reflection mode in thermography does exist for this purpose, its limitations in depth and lateral resolution adversely affect its capabilities in thermal material property evaluation. Currently, the limitation of the through-transmission technique within the context of pulsed thermography lies in the depth of quantification of defects. The reason provided for this is the fact that in the two-sided testing, the distance travelled by the thermal wave in the defect and defect-free region is the same [146]. Another explanation that was recently presented showed that the temperature contrast between the defect and defect-free zones is not sensitive to defect depth [132]. Besides this, theoretical models provide an in-depth knowledge of the thermal behaviour in the transmission mode to understand why depth quantification is a challenge that is currently lacking in the literature. Moreover, the literature survey also reveals that there is no standard procedure to conduct thermographic measurements in the transmission mode, for example, in terms of the optimal distance of the IR radiometer to the sample or an uncertainty analysis using various excitation energy levels in determining the thermal diffusivity. This also includes exploring the effect of thermal diffusivity calculations for the same material at varying thicknesses. While thermal diffusivity is inherent in intrinsic material property, i.e., its value does not change with changing size; practical scenarios could show slight variations that need to be considered when evaluating thermal material properties. Lastly, to ensure repeatability, multiple runs need to be conducted for the same experimental conditions. While the authors of the papers found in this literature review may have conducted multiple runs, a greater level of transparency of this procedure should be documented in their published work. This can be achieved via an Analysis of Variance (ANOVA) to show minimum variation between repeats. Therefore, the authors of this paper recommend a thorough analysis of through-transmission thermography be conducted, considering all the mentioned variables in determining material thermal properties. This will allow for a standardised and transparent method of thermographic inspections in the transmission mode. If these limitations can be overcome, it would provide a more reliable tool for the NDT industry to characterise defects. Applications include but are not limited to predictive maintenance, where the remaining useful life of components can be estimated for different types of defects with greater accuracy. While other techniques exist, such as lock-in and vibrothermography, it must be noted that the inspection time is longer as a good understanding of the techniques’ response to excitation frequency is required beforehand, thereby reducing the overall reliability to detect all types of defects. Furthermore, it would also provide better insights into the true limitations of pulsed thermography since existing limitations, such as defect depth information extraction, could potentially be overcome by integrating the inspection with technologies central to Industry 4.0.

Author Contributions

Z.A., conceptualization, methodology, writing—original draft preparation; S.A., conceptualization, review and editing, funding acquisition; Y.Z., review and editing, supervision. All authors have read and agreed to the published version of the manuscript.

Funding

This work was supported by the EPSRC platform grant (grant number EP/P027121/1). The authors of this paper would also like to thank the Cranfield Industrial Partnership PhD Scholarships Scheme (CIPPS), Cranfield University and Sun Resources for co-funding this research.

Data Availability Statement

No new data were created or analysed during this study. Data sharing is not applicable to this article.

Conflicts of Interest

The authors declare no conflicts of interest.

References

  1. Adel, A. Future of industry 5.0 in society: Human-centric solutions, challenges and prospective research areas. J. Cloud Comput. 2022, 11, 40. [Google Scholar] [CrossRef] [PubMed]
  2. DIN 31051; Fundamentals of Maintenance. German National Standard: Berlin, Germany, 2019. Available online: https://www.en-standard.eu/din-31051-fundamentals-of-maintenance/ (accessed on 21 September 2023).
  3. Hull, B.; John, V. Non-Destructive Testing; Macmillan Education Ltd.: London, UK, 1988. [Google Scholar] [CrossRef]
  4. Dwivedi, S.K.; Vishwakarma, M.; Soni, P. Advances and Researches on Non Destructive Testing: A Review. Mater. Today Proc. 2018, 5, 3690–3698. [Google Scholar] [CrossRef]
  5. Gholizadeh, S. A review of non-destructive testing methods of composite materials. In Procedia Structural Integrity; Elsevier B.V.: Paço de Arcos, Portugal, 2016; pp. 50–57. [Google Scholar] [CrossRef]
  6. Schauerte, O. Titanium in Automotive Production. Adv. Eng. Mater. 2003, 5, 411–418. [Google Scholar] [CrossRef]
  7. Boyer, R.R. An overview on the use of titanium in the aerospace industry. Mater. Sci. Eng. A 1996, 213, 103–114. [Google Scholar] [CrossRef]
  8. Smith, R.; Lewi, G.; Yates, D. Development and application of nickel alloys in aerospace engineering. Aircr. Eng. Aerosp. Technol. 2001, 73, 138–147. [Google Scholar] [CrossRef]
  9. Rambabu, P.; Prasad, N.E.; Kutumbarao, V.V.; Wanhill, R.J.H. Aluminium Alloys for Aerospace Applications; Springer: Singapore, 2017; pp. 29–52. [Google Scholar] [CrossRef]
  10. Dudić, S.; Ignjatović, I.; Šešlija, D.; Blagojević, V.; Stojiljković, M. Leakage quantification of compressed air using ultrasound and infrared thermography. Measurement 2012, 45, 1689–1694. [Google Scholar] [CrossRef]
  11. Sudhakar, I.; Madhu, V.; Reddy, G.M.; Rao, K.S. Enhancement of wear and ballistic resistance of armour grade AA7075 aluminium alloy using friction stir processing. Def. Technol. 2015, 11, 10–17. [Google Scholar] [CrossRef]
  12. Different Types of Non-Destructive Testing (NDT)—MoviTHERM. Available online: https://movitherm.com/knowledgebase/types-of-non-destructive-testing/ (accessed on 15 March 2024).
  13. Gogolinskiy, K.V.; Syasko, V.A. INDUSTRY 4.0 Prospects and challenges of the Fourth Industrial Revolution for instrument engineering and metrology in the field of non-destructive testing and condition monitoring. Insight 2019, 61, 434–440. [Google Scholar] [CrossRef]
  14. Schulenburg, L. NDT 4.0-A Technology Overview. In Proceedings of the 11th International Workshop NDT in Progress, Prague, Czech Republic, 4–7 October 2021. Available online: http://www.ndt.net/?id=26460 (accessed on 29 July 2024).
  15. Shi, H.; Ebrahimi, M.; Zhou, P.; Shao, K.; Li, J. Ultrasonic and phased-array inspection in titanium-based alloys: A review. Proc. Inst. Mech. Eng. Part E J. Process. Mech. Eng. 2023, 237, 511–530. [Google Scholar] [CrossRef]
  16. Sebastian, U.; Ilkin, A.; Frank, S.; Constanze, T.; Matthias, W. A review of synthetic and augmented training data for machine learning in ultrasonic non-destructive evaluation. Ultrasonics 2023, 134, 107041. [Google Scholar] [CrossRef]
  17. Wolfgang, D.P.D.L. Ultrasonic Material Testing Using Water Squirting Technique—Involves Several, Adjacent, Laminar Water Jets, Each Controlled by Separate Phase Array. DE2916933A1, 26 April 1979. [Google Scholar]
  18. Vavilov, V.P. Modelling Thermal NDT Problems. In Proceedings of the 18th World Conference on Nondestructive Testing, Durban, South Africa, 16–20 April 2012; Available online: http://www.ndt.net/?id=12809 (accessed on 10 May 2022).
  19. Carslaw, H.S. Conduction of Heat in Solids, 2nd ed.; Clarendon Press: Oxford, UK, 1959. [Google Scholar]
  20. Chung, Y.; Lee, S.; Kim, W. Latest advances in common signal processing of pulsed thermography for enhanced detectability: A review. Appl. Sci. 2021, 11, 12168. [Google Scholar] [CrossRef]
  21. Ciampa, F.; Mahmoodi, P.; Pinto, F.; Meo, M. Recent advances in active infrared thermography for non-destructive testing of aerospace components. Sensors 2018, 18, 609. [Google Scholar] [CrossRef] [PubMed]
  22. de Melo, S.B.; da Paz, R.F.; Mesquita, E. Recent advances on infrared thermography for ceramic tiles detachments diagnosis: Literature review. J. Build. Pathol. Rehabil. 2024, 9, 35. [Google Scholar] [CrossRef]
  23. Maldague, X.; Moore, P.O. Nondestructive Testing Handbook: Infrared and Thermal Testing, 3rd ed.; American Society for Nondestructive Testing: Columbus, OH, USA, 2001; Volume 3. [Google Scholar]
  24. Swiderski, W. Detection of defects in CFRP composites by Optical Thermographic methods. In Proceedings of the 2021 International Conference on Electrical, Computer, Communications and Mechatronics Engineering (ICECCME), Mauritius, 7–8 October 2021; pp. 1–6. Available online: https://www.iceccme.com/2021/ (accessed on 16 July 2024). [CrossRef]
  25. Wu, D.; Busse, C. Lock-in thermography for nondestructive evaluation of materials. Rev. Générale Therm. 1998, 37, 693–703. [Google Scholar] [CrossRef]
  26. Jones, R.; Lo, M.; Dorman, M.; Bowler, A.; Roles, D.; Wade, S.A. Lock-in Thermography for the Wide Area Detection of Paint Degradation and Incipient Corrosion. In Non-Destructive Evaluation of Corrosion and Corrosion-Assisted Cracking; John Wiley & Sons, Ltd.: Hoboken, NJ, USA, 2019; Chapter 5; pp. 122–159. [Google Scholar] [CrossRef]
  27. Riccio, A. Damage Growth in Aerospace Composites; Springer: Aversa, Italy, 2015; Available online: http://www.springer.com/series/8613 (accessed on 29 July 2024).
  28. Tang, Q.; Liu, J.; Wang, Y.; Liu, H. Subsurface interfacial defects of metal materials testing using ultrasound infrared lock-in thermography. Procedia Eng. 2011, 16, 499–505. [Google Scholar] [CrossRef]
  29. Liu, S.; Liu, H.; Liu, Z. Quantification of pitting corrosion from thermography using deep neural networks. Rev. Sci. Instrum. 2021, 92, 035116. [Google Scholar] [CrossRef] [PubMed]
  30. Cheng, L.; Tian, G.Y. Comparison of Nondestructive Testing Methods on Detection of Delaminations in Composites. J. Sens. 2012, 2012, 1–7. [Google Scholar] [CrossRef]
  31. Meola, C.; Carlomagno, G.M.; Squillace, A.; Giorleo, G. The use of infrared thermography for nondestructive evaluation of joints. Infrared Phys. Technol. 2004, 46, 93–99. [Google Scholar] [CrossRef]
  32. Mulaveesala, R.; Tuli, S. Theory of frequency modulated thermal wave imaging for nondestructive subsurface defect detection. Appl. Phys. Lett. 2006, 89, 191913. [Google Scholar] [CrossRef]
  33. Maldague, X.; Marinetti, S. Pulse phase infrared thermography. J. Appl. Phys. 1996, 79, 2694–2698. [Google Scholar] [CrossRef]
  34. Kamińska, P.; Ziemkiewcz, J.; Synaszko, P.; Dragan, K. Comparison of Pulse Thermography (PT) and Step Heating (SH) Thermography in Non-Destructive Testing of Unidirectional GFRP Composites. Fatigue Aircr. Struct. 2019, 2019, 87–102. [Google Scholar] [CrossRef]
  35. Almond, D.P.; Angioni, S.L.; Pickering, S.G. Long pulse excitation thermographic non-destructive evaluation. NDT E Int. 2017, 87, 7–14. [Google Scholar] [CrossRef]
  36. Muzika, L.; Svantner, M.; Honner, M.; Houdkova, S. Laser Scanning Thermography for Coating Thickness Inspection. Eng. Proc. 2021, 8, 17. [Google Scholar] [CrossRef]
  37. Mund, M.; Blass, D.; Dilger, K. Laser excited Thermography-Simulation based Determination of detection thresholds in aluminum welds depending on geometrical and excitation Properties. In Proceedings of the 12th European Conference on Non-Destructive Testing (ECNDT 2018), Gothenburg, Sweden, 11–15 June 2018; Available online: http://www.ndt.net/?id=22873 (accessed on 29 July 2024).
  38. Li, T.; Almond, D.P.; Rees, D.A.S. Crack imaging by scanning laser-line thermography and laser-spot thermography. Meas. Sci. Technol. 2011, 22, 035701. [Google Scholar] [CrossRef]
  39. Roemer, J.; Pieczonka, Ł.; Agh, U.; Górniczo-Hutnicza, A.; Robotyki, K.; Al, M.A. Laser Spot Thermography of Welded Joints. Diagnostyka 2014, 15, 43–49. [Google Scholar]
  40. Roemer, J.; Uhl, T.; Pieczonka, Ł. Laser Spot Thermography for Crack Detection in Aluminum Structures. In Proceedings of the 7th International Symposium on NDT in Aerospace—We.5.A.5, Bremen, Germany, 16–18 November 2015; Available online: http://creativecommons.org/licenses/by/3.0/ (accessed on 29 July 2024).
  41. Fierro, G.P.M.; Ginzburg, D.; Ciampa, F.; Meo, M. Imaging of Barely Visible Impact Damage on a Complex Composite Stiffened Panel Using a Nonlinear Ultrasound Stimulated Thermography Approach. J. Nondestruct. Eval. 2017, 36, 69. [Google Scholar] [CrossRef]
  42. Fierro, G.P.M.; Calla, D.; Ginzburg, D.; Ciampa, F.; Meo, M. Nonlinear ultrasonic stimulated thermography for damage assessment in isotropic fatigued structures. J. Sound Vib. 2017, 404, 102–115. [Google Scholar] [CrossRef]
  43. Zweschper, T.; Riegert, G.; Dillenz, A.; Busse, G. Ultrasound excited thermography—Advances due to frequency modulated elastic waves. Quant. InfraRed Thermogr. J. 2005, 2, 65–76. [Google Scholar] [CrossRef]
  44. Renshaw, J.; Chen, J.C.; Holland, S.D.; Thompson, R.B. The sources of heat generation in vibrothermography. NDT E Int. 2011, 44, 736–739. [Google Scholar] [CrossRef]
  45. Foudazi, A.; Donnell, K.M.; Ghasr, M.T. Application of Active Microwave Thermography to delamination detection. In Conference Record—IEEE Instrumentation and Measurement Technology Conference; Institute of Electrical and Electronics Engineers Inc.: Piscataway, NJ, USA, 2014; pp. 1567–1571. [Google Scholar] [CrossRef]
  46. Zhang, H.; Yang, R.; He, Y.; Foudazi, A.; Cheng, L.; Tian, G. A review of microwave thermography nondestructive testing and evaluation. Sensors 2017, 17, 1123. [Google Scholar] [CrossRef]
  47. Pan, M.; He, Y.; Tian, G.; Chen, D.; Luo, F. Defect characterisation using pulsed eddy current thermography under transmission mode and NDT applications. NDT E Int. 2012, 52, 28–36. [Google Scholar] [CrossRef]
  48. Anandika, R.; Lundberg, J. Limitations of eddy current inspection for the characterization of near-surface cracks in railheads. Proc. Inst. Mech. Eng. Part F J. Rail Rapid Transit 2022, 236, 532–544. [Google Scholar] [CrossRef]
  49. Yin, A.; Gao, B.; Tian, G.Y.; Woo, W.L.; Li, K. Physical interpretation and separation of eddy current pulsed thermography. J. Appl. Phys. 2013, 113, 064101. [Google Scholar] [CrossRef]
  50. Abidin, I.Z.; Tian, G.Y.; Wilson, J.; Yang, S.; Almond, D. Quantitative evaluation of angular defects by pulsed eddy current thermography. NDT E Int. 2010, 43, 537–546. [Google Scholar] [CrossRef]
  51. Pinto, F.; Ciampa, F.; Meo, M.; Polimeno, U. Multifunctional SMArt composite material for in situ NDT/SHM and de-icing. Smart Mater. Struct. 2012, 21, 105010. [Google Scholar] [CrossRef]
  52. Ahmed, T.; Nino, G.; Bersee, H.; Beukers, A. Heat emitting layers for enhancing NDE of composite structures. Compos. Part A Appl. Sci. Manuf. 2008, 39, 1025–1036. [Google Scholar] [CrossRef]
  53. de Villoria, R.G.; Yamamoto, N.; Miravete, A.; Wardle, B.L. Multi-physics damage sensing in nano-engineered structural composites. Nanotechnology 2011, 22, 185502. [Google Scholar] [CrossRef] [PubMed]
  54. Sakagami, T.; Ogura, K. New Flaw Inspection Technique Based on Infrared Thermal Images under Joule Effect Heating. JSME Int. J. Ser. A Mech. Mater. Eng. 1994, 37, 380–388. [Google Scholar] [CrossRef]
  55. Booth, A.; Papaioannou, D.; Sutton, A. Systematic Approaches to a Successful Literature Review, 1st ed.; Sage Publications Ltd.: Thousand Oaks, CA, USA, 2012; Available online: https://www.researchgate.net/publication/235930866 (accessed on 16 July 2024).
  56. Zhou, J.; Du, W.; Yang, L.; Deng, K.; Addepalli, S.; Zhao, Y. Pattern Recognition of Barely Visible Impact Damage in Carbon Composites Using Pulsed Thermography. IEEE Trans. Ind. Inform. 2021, 18, 7252–7261. [Google Scholar] [CrossRef]
  57. Fernandes, H.; Ibarra-Castanedo, C.; Zhang, H.; Maldague, X. Thermographic Non-destructive Evaluation of Carbon Fiber-Reinforced Polymer Plates After Tensile Testing. J. Nondestruct. Eval. 2015, 34, 35. [Google Scholar] [CrossRef]
  58. Guo, J.; Gao, X.; Toma, E.; Netzelmann, U. Anisotropy in carbon fiber reinforced polymer (CFRP) and its effect on induction thermography. NDT E Int. 2017, 91, 1–8. [Google Scholar] [CrossRef]
  59. El Yagoubi, J.; Lamon, J.; Batsale, J.-C.; Le Flem, M. Experimental assessment of damage-thermal diffusivity relationship in unidirectional fibre-reinforced composite under axial tensile test. Acta Mater. 2019, 173, 302–312. [Google Scholar] [CrossRef]
  60. Toscano, C.; Meola, C.; Iorio, M.C.; Carlomagno, G.M. Porosity and Inclusion Detection in CFRP by Infrared Thermography. Adv. Opt. Technol. 2012, 2012, 765953. [Google Scholar] [CrossRef]
  61. Curà, F.; Sesana, R.; Corsaro, L.; Mantoan, R. Characterization of Thermal Barrier Coatings Using an Active Thermography Approach. Ceramics 2022, 5, 848–861. [Google Scholar] [CrossRef]
  62. He, Y.; Tian, G.; Pan, M.; Chen, D. Impact evaluation in carbon fiber reinforced plastic (CFRP) laminates using eddy current pulsed thermography. Compos. Struct. 2014, 109, 1–7. [Google Scholar] [CrossRef]
  63. Maierhofer, C.; Myrach, P.; Reischel, M.; Steinfurth, H.; Röllig, M.; Kunert, M. Characterizing damage in CFRP structures using flash thermography in reflection and transmission configurations. Compos. Part B Eng. 2014, 57, 35–46. [Google Scholar] [CrossRef]
  64. Fujita, R.; Nagano, H. Novel fiber orientation evaluation method for CFRP/CFRTP based on measurement of anisotropic in-plane thermal diffusivity distribution. Compos. Sci. Technol. 2016, 140, 116–122. [Google Scholar] [CrossRef]
  65. Bamford, M.; Florian, M.; Vignoles, G.L.; Batsale, J.-C.; Cairo, C.A.A.; Maillé, L. Global and local characterization of the thermal diffusivities of SiCf/SiC composites with infrared thermography and flash method. Compos. Sci. Technol. 2009, 69, 1131–1141. [Google Scholar] [CrossRef]
  66. Yang, R.; He, Y.; Mandelis, A.; Wang, N.; Wu, X.; Huang, S. Induction infrared thermography and thermal-wave-radar analysis for imaging inspection and diagnosis of blade composites. IEEE Trans. Ind. Inform. 2018, 14, 5637–5647. [Google Scholar] [CrossRef]
  67. Chulkov, A.; Sfarra, S.; Zhang, H.; Osman, A.; Szielasko, K.; Stumm, C.; Sarasini, F.; Fiorelli, J.; Maldague, X.; Vavilov, V. Evaluating thermal properties of sugarcane bagasse-based composites by using active infrared thermography and terahertz imaging. Infrared Phys. Technol. 2019, 97, 432–439. [Google Scholar] [CrossRef]
  68. Fuente, R.; Rodríguez, S.; Mendioroz, A.; Salazar, A.; Zhukov, A.; Zhukova, V. Thermal Conductivity and Diffusivity Measurements of Glass-Coated Magnetic Microwires Using Lock-in Thermography. Int. J. Thermophys. 2015, 36, 1137–1141. [Google Scholar] [CrossRef]
  69. Schoderböck, P.; Klocker, H.; Sigl, L.S.; Seeber, G. Evaluation of the Thermal Diffusivity of Thin Specimens from Laser Flash Data. Int. J. Thermophys. 2009, 30, 599–607. [Google Scholar] [CrossRef]
  70. Souhar, Y.; Rémy, B.; Degiovanni, A. Thermal Characterization of Anisotropic Materials at High Temperature Through Integral Methods and Localized Pulsed Technique. Int. J. Thermophys. 2013, 34, 322–340. [Google Scholar] [CrossRef]
  71. Davis, S.E.; Wright, N.T. Optimal Positioning of Temperature Measurements to Estimate Thermal Diffusivity. Int. J. Thermophys. 2013, 34, 1021–1038. [Google Scholar] [CrossRef]
  72. Sánchez-Carballido, S.; Justo-María, C.; Meléndez, J.; Cortés, F.; López, F.; del Cerro, F.J.L. Experimental Determination of the Thermal Parameters of Carbon Fiber-Composite Materials Exposed to Fire by Infrared Imaging Pulse Thermography. Int. J. Thermophys. 2013, 34, 1606–1616. [Google Scholar] [CrossRef]
  73. Rodiet, C.; Remy, B.; Degiovanni, A. Thermal characterization of anisotropic materials by integral transforms taking into account the thermal coupling with the sample-holder. Int. J. Therm. Sci. 2014, 79, 67–75. [Google Scholar] [CrossRef]
  74. El Rassy, E.; Billaud, Y.; Saury, D. Unconventional flash technique for the identification of multilayer thermal diffusivity tensors. Int. J. Therm. Sci. 2020, 155, 106430. [Google Scholar] [CrossRef]
  75. Chihab, Y.; Garoum, M.; Laaroussi, N. A New Efficient Formula for the Thermal Diffusivity Estimation from the Flash Method Taking into Account Heat Losses in Rear and Front Faces. Int. J. Thermophys. 2020, 41, 118. [Google Scholar] [CrossRef]
  76. Ishizaki, T.; Nagano, H.; Tanaka, S.; Sakatani, N.; Nakamura, T.; Okada, T.; Fujita, R.; Alasli, A.; Morita, T.; Kikuiri, M.; et al. Measurement of Microscopic Thermal Diffusivity Distribution for Ryugu Sample by Infrared Lock-in Periodic Heating Method. Int. J. Thermophys. 2023, 44, 51. [Google Scholar] [CrossRef]
  77. Ishizaki, T.; Kawahara, T.; Tomioka, K.; Tanaka, S.; Sakatani, N.; Nakamura, T.; Nagano, H. Measurement of Thermal Diffusivity Distribution for Murray and Murchison Meteorites Using Lock-in Thermography. Int. J. Thermophys. 2022, 43, 97–98. [Google Scholar] [CrossRef]
  78. Hatori, K.; Awano, T.; Otsuki, T.; Uetani, K.; Nagano, H. Fibre Orientation Evaluation of Cellulose Nanofibre Films Through Rapid Measurement of Thermal Diffusivity Anisotropy. Int. J. Thermophys. 2022, 43, 84. [Google Scholar] [CrossRef]
  79. Ishizaki, T.; Nagano, H. Measurement of Three-Dimensional Anisotropic Thermal Diffusivities for Carbon Fiber-Reinforced Plastics Using Lock-In Thermography. Int. J. Thermophys. 2015, 36, 2577–2589. [Google Scholar] [CrossRef]
  80. Tran, T.; Kodisch, C.; Schöttle, M.; Pech-May, N.W.; Retsch, M. Characterizing the Thermal Diffusivity of Single, Micrometer-Sized Fibers via High-Resolution Lock-In Thermography. J. Phys. Chem. C 2022, 126, 14003–14010. [Google Scholar] [CrossRef]
  81. Godin, A.; del Barrio, E.P.; Morikawa, J.; Duquesne, M. Microscopic infrared thermography for fast estimation of the thermal properties of thin films. J. Appl. Phys. 2018, 124, 085111. [Google Scholar] [CrossRef]
  82. Potenza, M.; Coppa, P.; Corasaniti, S.; Bovesecchi, G. Numerical simulation of thermal diffusivity measurements with the laser-flash method to evaluate the ef-fective property of composite materials. J. Heat Transf. 2021, 143, 072102. [Google Scholar] [CrossRef]
  83. Hu, Y.; Abuseada, M.; Alghfeli, A.; Holdheim, S.; Fisher, T.S. High-Temperature Thermal Diffusivity Measurements Using a Modified Ångström’s Method with Transient Infrared Thermography. J. Heat Transf. 2022, 144, 023502. [Google Scholar] [CrossRef]
  84. Pawlak, S. Application of IR Thermography with Thermal Diffusivity Analysis for Detection of Plies Displacement in CFRP Composites. J. Mater. Eng. Perform. 2018, 27, 6545–6551. [Google Scholar] [CrossRef]
  85. Zhu, W.; Liu, Z.; Jiao, D.; Xie, H. Eddy Current Thermography with Adaptive Carrier Algorithm for Non-destructive Testing of Debonding Defects in Thermal Barrier Coatings. J. Nondestruct. Eval. 2018, 37, 31. [Google Scholar] [CrossRef]
  86. Zhang, H.; Sfarra, S.; Saluja, K.; Peeters, J.; Fleuret, J.; Duan, Y.; Fernandes, H.; Avdelidis, N.; Ibarra-Castanedo, C.; Maldague, X. Non-destructive Investigation of Paintings on Canvas by Continuous Wave Terahertz Imaging and Flash Thermography. J. Nondestruct. Eval. 2017, 36, 1–12. [Google Scholar] [CrossRef]
  87. Santhosh, U.; Gowayed, Y.; Ojard, G.; Smyth, I.; Kalarikkal, S.; Jefferson, G. Quantification of Porosity in Ceramic Matrix Composites Using Thermography. J. Nondestruct. Eval. 2018, 37, 37. [Google Scholar] [CrossRef]
  88. Krankenhagen, R.; Jonietz, F.; Zirker, S. Determination of Thermal Parameters of Concrete by Active Thermographic Measurements. J. Nondestruct. Eval. 2022, 41, 25. [Google Scholar] [CrossRef]
  89. Nagpure, S.C.; Dinwiddie, R.; Babu, S.; Rizzoni, G.; Bhushan, B.; Frech, T. Thermal diffusivity study of aged Li-ion batteries using flash method. J. Power Sources 2010, 195, 872–876. [Google Scholar] [CrossRef]
  90. Ranjan, S.; Ryu, M.; Morioka, R.; Kamegaki, S.; Ng, S.H.; Smith, D.; Vongsvivut, J.; Tobin, M.J.; Juodkazis, S.; Morikawa, J.; et al. Structural and Thermal Diffusivity Analysis of an Organoferroelastic Crystal Showing Scissor-Like Two-Directional Deformation Induced by Uniaxial Compression. J. Am. Chem. Soc. 2023, 145, 23027–23036. [Google Scholar] [CrossRef] [PubMed]
  91. Noszczyk, P.; Nowak, H. Inverse Contrast in Non-Destructive Materials Research by Using Active Thermography. Materials 2019, 12, 835. [Google Scholar] [CrossRef] [PubMed]
  92. Montinaro, N.; Fustaino, M.; Bellisario, D.; Quadrini, F.; Santo, L.; Pantano, A. Testing the Dispersion of Nanoparticles in a Nanocomposite with an Ultra-Low Fill Content Using a Novel Non-Destructive Evaluation Technique. Materials 2022, 15, 1208. [Google Scholar] [CrossRef] [PubMed]
  93. Fuente, R.; Mendioroz, A.; Salazar, A. Revising the exceptionally high thermal diffusivity of spider silk. Mater. Lett. 2014, 114, 1–3. [Google Scholar] [CrossRef]
  94. Mercuri, F.; Zammit, U.; Paoloni, S.; Caruso, G.; Ferretti, M.; Porcinai, S.; Orazi, N. Infrared thermography for the thermal diffusivity evaluation in Sn-Pb bronze alloys: A tool for the investigation of ancient statuary. Measurement 2022, 201, 111731. [Google Scholar] [CrossRef]
  95. Basheer, C.; Krishnamurthy, C.; Balasubramaniam, K. Hot-rod thermography for in-plane thermal diffusivity measurement. Measurement 2017, 103, 235–240. [Google Scholar] [CrossRef]
  96. Kalyanavalli, V.; Mithun, P.M.; Sastikumar, D. Analysis of long-pulse thermography methods for defect depth prediction in transmission mode. Meas. Sci. Technol. 2020, 31, 014002. [Google Scholar] [CrossRef]
  97. Salazar, A.; Mendioroz, A.; Apiñaniz, E.; Pradere, C.; Noël, F.; Batsale, J.-C. Extending the flash method to measure the thermal diffusivity of semitransparent solids. Meas. Sci. Technol. 2014, 25, 035604. [Google Scholar] [CrossRef]
  98. Pawlak, M.; Streza, M.; Morari, C.; Strzałkowski, K.; Depriester, M.; Chirtoc, M. Quantitative thermal wave phase imaging of an IR semi-transparent GaAs wafer using IR lock-in thermography. Meas. Sci. Technol. 2016, 28, 025008. [Google Scholar] [CrossRef]
  99. Kalyanavalli, V.; Kalyanavalli, V.; Kalyanavalli, V.; Ramadhas, T.A.; Ramadhas, T.A.; Ramadhas, T.A.; Sastikumar, D.; Sastikumar, D.; Sastikumar, D. Determination of thermal diffusivity of Basalt fiber reinforced epoxy composite using infrared thermography. Measurement 2019, 134, 673–678. [Google Scholar] [CrossRef]
  100. Hedayatrasa, S.; Van Paepegem, W.; Kersemans, M. Diffusion-compensated correlation analysis of frequency-modulated thermal signal for quantitative infrared thermography. Mech. Syst. Signal Process. 2023, 197, 110373. [Google Scholar] [CrossRef]
  101. Mouhoubi, K.; Bodnar, J.; Ousseni, S.; Nicolas, J.; Caron, D. Local thermal characterization of metal sample by stimulated infra-red thermography. Mech. Ind. 2014, 15, 307–312. [Google Scholar] [CrossRef]
  102. Arrizubieta, J.I.; Cortina, M.; Mendioroz, A.; Salazar, A.; Lamikiz, A. Thermal Diffusivity Measurement of Laser-Deposited AISI H13 Tool Steel and Impact on Cooling Performance of Hot Stamping Tools. Metals 2020, 10, 154. [Google Scholar] [CrossRef]
  103. Allard, A.; Fischer, N.; Ebrard, G.; Hay, B.; Harris, P.; Wright, L.; Rochais, D.; Mattout, J. A multi-thermogram-based Bayesian model for the determination of the thermal diffusivity of a material. Metrologia 2015, 53, S1–S9. [Google Scholar] [CrossRef]
  104. Ashraf, A.; Jani, N.; Farmer, F.; Lynch-Branzoi, J.K. Non-Destructive Investigation of Dispersion, Bonding, and Thermal Properties of Emerging Polymer Nanocomposites Using Close-Up Lens Assisted Infrared Thermography. MRS Adv. 2020, 5, 735–742. [Google Scholar] [CrossRef]
  105. Kabouri, A.; Khabbazi, A.; Youlal, H. Applied multiresolution analysis to infrared images for defects detection in materials. NDT E Int. 2017, 92, 38–49. [Google Scholar] [CrossRef]
  106. Vageswar, A.; Balasubramaniam, K.; Krishnamurthy, C.; Jayakumar, T.; Raj, B. Periscope infrared thermography for local wall thinning in tubes. NDT E Int. 2009, 42, 275–282. [Google Scholar] [CrossRef]
  107. Mayr, G.; Plank, B.; Sekelja, J.; Hendorfer, G. Active thermography as a quantitative method for non-destructive evaluation of porous carbon fiber reinforced polymers. NDT E Int. 2011, 44, 537–543. [Google Scholar] [CrossRef]
  108. Zacharia, S.G.; Siddiqui, A.; Lahiri, J. In situ thermal diffusivity determination of anisotropic composite structures: Transverse diffusivity measurement. NDT E Int. 2012, 48, 1–9. [Google Scholar] [CrossRef]
  109. Vageswar, A.; Balasubramaniam, K.; Krishnamurthy, C. Wall thinning defect estimation using pulsed IR thermography in transmission mode. Nondestruct. Test. Eval. 2010, 25, 333–340. [Google Scholar] [CrossRef]
  110. Kenned, J.J.; Sankaranarayanasamy, K.; Kalyanavalli, V.; Suresh Kumar, C. Characterization of indentation damage resistance and thermal diffusivity of needle-punched Musa sapientum cellulosic fiber/unsaturated polyester composite laminates using IR thermography. Polym. Compos. 2020, 41, 2933–2946. [Google Scholar] [CrossRef]
  111. Mayr, G.; Plank, B.; Gruber, J.; Sekelja, J.; Hendorfer, G. Quantitative evaluation of the effective thermal diffusivity for model-based porosity prediction in CFRP. Quant. Infrared Thermogr. J. 2015, 13, 70–82. [Google Scholar] [CrossRef]
  112. Zhelnin, M.; Iziumova, A.; Vshivkov, A.; Plekhov, O. Experimental study of an effect of plastic deformation on thermal properties of stainless steel. Quant. Infrared Thermogr. J. 2018, 16, 74–86. [Google Scholar] [CrossRef]
  113. Nolte, P.W.; Malvisalo, T.; Wagner, F.; Schweizer, S. Thermal diffusivity of metals determined by lock-in thermography. Quant. Infrared Thermogr. J. 2017, 14, 218–225. [Google Scholar] [CrossRef]
  114. Oswald-Tranta, B.; Sorger, M. Scanning pulse phase thermography with line heating. Quant. Infrared Thermogr. J. 2012, 9, 103–122. [Google Scholar] [CrossRef]
  115. Mayr, G.; Gresslehner, K.H.; Hendorfer, G. Non-destructive testing procedure for porosity determination in carbon fibre reinforced plastics using pulsed thermography. Quant. Infrared Thermogr. J. 2017, 14, 263–274. [Google Scholar] [CrossRef]
  116. Ha, S.M.; Kwon, O.H.; Oh, Y.G.; Kim, Y.S.; Lee, S.-G.; Won, J.C.; Cho, K.S.; Kim, B.G.; Yoo, Y. Thermally conductive polyamide 6/carbon filler composites based on a hybrid filler system. Sci. Technol. Adv. Mater. 2015, 16, 065001. [Google Scholar] [CrossRef]
  117. Bison, P.; Ferrarini, G.; Morselli, N.; Muscio, A.; Rossi, S. The Thermal Diffusivity of Biochar Coating Deposited on a Heat Exchanger. Eng. Proc. 2023, 51, 26. [Google Scholar] [CrossRef]
  118. Ionescu, C.; Branzei, M.; Mihailescu, B.; Bonfert, D. Studies on thermal properties of substrates for electronics using IR thermography. In Proceedings of the 2014 IEEE 20th International Symposium for Design and Technology in Electronic Packaging, SIITME 2014, Bucharest, Romania, 23–26 October 2014; Institute of Electrical and Electronics Engineers Inc.: Piscataway, NJ, USA, 2014; pp. 45–49. [Google Scholar] [CrossRef]
  119. Wang, X.; Whalley, D.C.; Silberschmidt, V.V. Non-destructive defect detection for MEMS devices using transient thermography. In Proceedings of the 2016 6th Electronic System-Integration Technology Conference, ESTC 2016, Grenoble, France, 13–15 September 2016; Institute of Electrical and Electronics Engineers Inc.: Piscataway, NJ, USA, 2016. [Google Scholar] [CrossRef]
  120. Odebowale, A.A.; Abdel-Rahman, M. Design and optical simulation of a sensor pixel for an optical readout-based thermal imager. In Proceedings of the 2019 8th International Conference on Modeling Simulation and Applied Optimization, ICMSAO 2019, Manama, Bahrain, 15–17 April 2019; Institute of Electrical and Electronics Engineers Inc.: Piscataway, NJ, USA, 2019. [Google Scholar] [CrossRef]
  121. Genna, S.; Simoncini, A.; Tagliaferri, V.; Ucciardello, N. Optimization of the sandblasting process for a better electrodeposition of copper thin films on aluminum substrate by feedforward neural network. Procedia CIRP 2017, 62, 435–439. [Google Scholar] [CrossRef]
  122. Prakash, R.V.; Maharana, M. Damage Detection using Infrared Thermography in a Carbon-Flax Fiber Hybrid Composite. Procedia Struct. Integr. 2017, 7, 283–290. [Google Scholar] [CrossRef]
  123. Wunderle, B.; Schulz, M.; Braun, T.; Sheva, S.; May, D.; Bauer, J.; Bader, V.; Hoelck, O.; Walter, H.; Keller, J. A novel and practical method for in-situ monitoring of interface delamination by local thermal diffusivity measurement. In Proceedings—Electronic Components and Technology Conference; Institute of Electrical and Electronics Engineers Inc.: Piscataway, NJ, USA, 2015; pp. 438–447. [Google Scholar] [CrossRef]
  124. Strag, M.; Swiderski, W. The evolution of the non-destructive defect detection in composites with the use of terahertz radiation. In Proceedings of the Sixteenth International Conference on Quality Control by Artificial Vision, Albi, France, 6–8 June 2023; SPIE: Bellingham, WA, USA, 2023; pp. 102–107. [Google Scholar] [CrossRef]
  125. Sfarra, S.; Osman, A.; Sarasini, F.; Valeske, B.; Netzelmann, U.; Avdelidis, N.P.; Ibarra-Castanedo, C.; Zhang, H.; Maldague, X.P.V. Nondestructive evaluation using eddy current pulsed thermographic imaging of basalt-carbon hybrid fiber-reinforced composite laminates subjected to low-velocity impact loadings. In Smart Materials and Nondestructive Evaluation for Energy Systems IV; Matikas, T.E., Ed.; SPIE: Bellingham, WA, USA, 2018; p. 10. [Google Scholar] [CrossRef]
  126. Exarchos, D.A.; Dassios, K.G.; Matikas, T.E. Development of a nondestructive methodology based on near infrared imaging for the characterization of damage in transparent and semi-transparent aircraft components. In Smart Materials and Nondestructive Evaluation for Energy Systems IV; Matikas, T.E., Ed.; SPIE: Bellingham, WA, USA, 2018; p. 25. [Google Scholar] [CrossRef]
  127. Yang, X.; Sun, H.; Wang, S.; Luan, H.; Wang, C.; Tao, N.; Sun, J.; Chen, B.; Han, Y.; Liu, S. Thermal property analysis characterization of the bronze casting moulds. In Proceedings of the SPIE/COS Photonics Asia, Online, 11–13 October 2020; SPIE: Bellingham, WA, USA, 2020; pp. 53–59. [Google Scholar] [CrossRef]
  128. Morel, A.; Genest, M. Reliable adhesion failure qualification of metal-adhesive-metal assemblies using pulsed thermography. In Thermosense: Thermal Infrared Applications XLV; SPIE: Bellingham, WA, USA, 2023; p. 11. [Google Scholar] [CrossRef]
  129. Spaeth, P.W.; Zalameda, J.N.; Bisgard, J.; Hudson, T.B.; Ledesma, R.I.; Huertas, R.A. Composite bond line measurements based on a Bayesian analysis of flash thermography data. In Thermosense: Thermal Infrared Applications XLV; SPIE: Bellingham, WA, USA, 2023; p. 18. [Google Scholar] [CrossRef]
  130. Fujita, R.; Natsuko, K.; Abe, S.; Fikry, M.J.M.; Koyanagi, J.; Ogihara, S.; Nagano, H. Lock-in thermographic measurement and model-based evaluation of effective thermal diffusivity to quantify early stage fatigue damage of CFRP. In Thermosense: Thermal Infrared Applications XLV; SPIE: Bellingham, WA, USA, 2023; p. 10. [Google Scholar] [CrossRef]
  131. Alhammad, M.; Avdelidis, N.P.; Ibarra-Castanedo, C.; Torbali, M.E.; Zolotas, A.; Maldague, X. Quantitative comparison between reflection mode and transmission modes for the inspection of composite materials using pulsed thermography. In Thermosense: Thermal Infrared Applications XLV; SPIE: Bellingham, WA, USA, 2023; p. 21. [Google Scholar] [CrossRef]
  132. Ali, Z.; Addepalli, S.; Zhao, Y. A theoretical investigation into material characterisation using pulsed thermography in the reflection and transmission modes. In Thermosense: Thermal Infrared Applications XLV; SPIE: Bellingham, WA, USA, 2023; p. 8. [Google Scholar] [CrossRef]
  133. Genest, M.; Ouellet, S.; Williams, K. Infrared thermography for inspection of aramid and ultra-high-molecular-weight polyethylene armour systems. In Thermosense: Thermal Infrared Applications XL; de Vries, J., Burleigh, D., Eds.; SPIE: Bellingham, WA, USA, 2018; p. 28. [Google Scholar] [CrossRef]
  134. Oswald-Tranta, B.; Tuschl, C.; Hackl, A. Detection of subsurface cracks using inductive thermography. In Thermosense: Thermal Infrared Applications XLIII; Zalameda, J.N., Mendioroz, A., Eds.; SPIE: Bellingham, WA, USA, 2021; p. 14. [Google Scholar] [CrossRef]
  135. Chu, T.; Poudel, A.; Filip, P.; Chu, T.P. C/C composite brake disk nondestructive evaluation by IR thermography. In Thermosense: Thermal Infrared Applications XXXIV; SPIE: Bellingham, WA, USA, 2012; pp. 66–75. [Google Scholar] [CrossRef]
  136. Ferrarini, G.; Bison, P.; Bortolin, A.; Cadelano, G.; Rossi, S. Thermal diffusivity measurement of ring specimens by infrared thermography. In Thermosense: Thermal Infrared Applications XXXIX; SPIE: Bellingham, WA, USA, 2017; pp. 255–262. [Google Scholar] [CrossRef]
  137. Simões, N.; Simões, I.; Serra, C.; Tadeu, A. Thermographic inspection of external thermal insulation systems with mechanical fixing. In Thermosense: Thermal Infrared Applications XXXVII; Hsieh (Tony), S.-J., Zalameda, J.N., Eds.; SPIE: Bellingham, WA, USA, 2015; p. 94851A. [Google Scholar] [CrossRef]
  138. Vavilov, V.; Shiryaev, V.; Chulkov, A. A novel data processing algorithm in thermal property measurement and defect detection by using one-sided active infrared thermography. In Thermosense: ThermalInfrared Applications XXXVII; SPIE: Bellingham, WA, USA, 2015; pp. 232–238. [Google Scholar] [CrossRef]
  139. Liu, B.; Zhang, H.; Fernandes, H.; Maldague, X. Quantitative evaluation of pulsed thermography, lock-in thermography and vibrothermography on foreign object defect (FOD) in CFRP. Sensors 2016, 16, 743. [Google Scholar] [CrossRef]
  140. Parker, W.J.; Jenkins, R.J.; Butler, C.P.; Abbott, G.L. Flash method of determining thermal diffusivity, heat capacity, and thermal conductivity. J. Appl. Phys. 1961, 32, 1679–1684. [Google Scholar] [CrossRef]
  141. “Laser Flash Apparatus LFA 427.” netzsch.com. Available online: https://analyzing-testing.netzsch.com/en/products/thermal-diffusivity-and-conductivity/lfa-427(accessed on 22 October 2022).
  142. Rajic, N. Principal component thermography for flaw contrast enhancement and flaw depth characterisation in composite structures. Compos. Struct. 2002, 58, 521–528. [Google Scholar] [CrossRef]
  143. Tabatabaei, N.; Mandelis, A. Thermal-wave radar: A novel subsurface imaging modality with extended depth-resolution dynamic range. Rev. Sci. Instrum. 2009, 80, 034902. [Google Scholar] [CrossRef]
  144. Ishikawa, M.; Hatta, H.; Habuka, Y.; Fukui, R.; Utsunomiya, S. Detecting deeper defects using pulse phase thermography. Infrared Phys. Technol. 2013, 57, 42–49. [Google Scholar] [CrossRef]
  145. Meola, C.; Carlomagno, G.M.; Giorleo, L. The use of infrared thermography for materials characterization. J. Mech. Work. Technol. 2004, 155–156, 1132–1137. [Google Scholar] [CrossRef]
  146. Maldague, X. Theory and Practice of Infrared Technology for Nondestructive Testing; Wiley: Hoboken, NJ, USA, 2001; Volume 130. [Google Scholar]
Figure 1. The various NDT methods.
Applsci 14 06791 g001
Figure 2. Schematic of 1D heat transfer on a semi-infinite plate with heat flowing in the z-direction.
Applsci 14 06791 g002
Figure 3. Names of authors with two or more publications.
Applsci 14 06791 g003
Figure 4. Common keywords (occurring at least 2 or more times).
Applsci 14 06791 g004
Figure 5. Distribution of papers published in journals and conferences.
Applsci 14 06791 g005
Figure 6. Number of publications per year.
Applsci 14 06791 g006
Figure 7. (a) The reflection and (b) transmission configurations with their respective temperature profiles (graphs have been generated using MATLAB R2023a).
Applsci 14 06791 g007
Figure 8. (a) Schematic for pulsed thermography using COMSOL v.6.0 with the temperature response of the defect and defect-free areas for an 8 mm radius defect at 1 mm depth (as viewed from the front wall) at the (b) front wall (c) back wall. Plots have been generated using Microsoft Excel v.2406.
Applsci 14 06791 g008
Table 2. PICOC Framework.
ConceptDefinitionSLR Application
PopulationThe research area that will be targetedCurrent methods using through-transmission thermography are not able to accurately characterise certain material characteristics
InterventionExisting methodologies to address the defined problemThe various thermal excitation methods used to heat the specimen and the various signal reconstruction techniques to enhance the defect features such as defect shape, size, and depth
ComparisonComparison between the proposed and existing techniquesThe capabilities of the reflection mode in defect characterisation
Outcome(s)Measurement criteria for testing effectivenessThe ability to successfully characterise the defects, measurement uncertainty, inspection time, etc.
Table 3. Inclusion and exclusion criteria.
Inclusion criteria (IC)Publications related to active thermography
Publications dealing with material characterisation
Publications related to through-transmission thermography
Exclusion criteria (EC)Does not meet inclusion criteria
Full paper not available
Papers using thermography in the medical industry
Publications not in English
Publications before the year 2008
Table 4. Search strategy.
DatabaseScopus
Search stringsTITLE-ABS-KEY (thermal AND diffusivity AND measurement AND thermography)
TITLE-ABS-KEY (“thermography” “transmission mode”)
TITLE-ABS-KEY (“thermography” AND “through transmission” AND NOT “electron microscope” AND NOT “transmission line” AND NOT “ultrasonic” AND NOT” electron microscopy” AND NOT “electron microscopies” AND NOT “transmission welding” AND NOT “electron” AND NOT “transmission weld” AND NOT “laser weld” AND NOT “laser welding”)
Type of articleJournal or conference
Table 5. Elements for synthesis analysis.
Quantitative ElementsAuthors
Keywords
Type of Paper (Journal/Conference)
Year of Publication
Qualitative ElementsDefinition and Materials
Working principle of the technique
Data processing algorithms
Data analysis
Conclusion and future work
Table 6. List of journals and their related publications.
Journal NameRef.
Acta Material[59]
Advances in Optical Technologies[60]
Ceramics[61]
Composite Structures[62]
Composites Part B: Engineering[63]
Composites Science and Technology[64,65]
IEEE Transactions on Industrial Informatics[66]
Infrared Physics and Technology[67]
Int J Thermophys[68,69,70,71,72]
International Journal of Thermal Sciences[73,74]
International Journal of Thermophysics[75,76,77,78,79]
J. Phys. Chem. C[80]
Journal of Applied Physics[81]
Journal of Heat Transfer[82,83]
Journal of Materials Engineering and Performance[84]
Journal of Non-destructive Evaluation[85,86,87,88]
Journal of Power Sources[89]
Journal of the American Chemical Society[90]
Materials[91,92]
Materials Letters[93]
Measurement[94,95]
Measurement Science and Technology[96,97,98]
Measurement: Journal of the International Measurement Confederation[99]
Mechanical Systems and Signal Processing[100]
Mechanics and Industry[101]
Metals[102]
Metrologia[103]
MRS Advances[104]
NDT and E International[47,58,105,106,107,108]
Non-destructive Testing and Evaluation[109]
Polymer Composites[110]
Quantitative InfraRed Thermography Journal[111,112,113,114,115]
Science and Technology of Advanced Materials[116]
Table 7. List of conferences and their related publications.
Conference NameRef.
17th International Workshop on Advanced Infrared Technology and Applications[117]
2014 IEEE 20th International Symposium for Design and Technology in Electronic Packaging, SIITME 2014[118]
2016 6th Electronic System-Integration Technology Conference, ESTC 2016[119]
2019 8th International Conference on Modeling Simulation and Applied Optimization, ICMSAO 2019[120]
Procedia CIRP[121]
Procedia Structural Integrity[122]
Proceedings—Electronic Components and Technology Conference[123]
Sixteenth International Conference on Quality Control by Artificial Vision[124]
Smart Materials and Non-destructive Evaluation for Energy Systems IV[125,126]
SPIE/COS Photonics Asia[127]
Thermosense: Thermal Infrared Applications XLV[128,129,130,131,132]
Thermosense: Thermal Infrared Applications XL[133]
Thermosense: Thermal Infrared Applications XLIII[134]
Thermosense: Thermal Infrared Applications XXXIV[135]
Thermosense: Thermal Infrared Applications XXXIX[136]
Thermosense: Thermal Infrared Applications XXXVII[137,138]
Table 8. Most common signal processing techniques for through transmission.
AlgorithmAuthor and ReferenceEquations
Pulsed Phase ThermographyMaldague and Marrinetti [33](35), (36)
Principle Component Thermography (PCT)Rajic [142](38)
Thermal Wave Radar Analysis (TWR)Tabatabaei and Mandelis [143](39)–(42)
Diffusion-Compensated Correlation Analysis (DCCA)Hedayatrasa et al. [100](43)–(47)
Disclaimer/Publisher’s Note: The statements, opinions and data contained in all publications are solely those of the individual author(s) and contributor(s) and not of MDPI and/or the editor(s). MDPI and/or the editor(s) disclaim responsibility for any injury to people or property resulting from any ideas, methods, instructions or products referred to in the content.

