Article

Thermodynamic and Exergoeconomic Analysis of a Novel Compressed Carbon Dioxide Phase-Change Energy Storage System

1
School of Energy and Power Engineering, Xi’an Jiaotong University, Xi’an 710049, China
2
National Innovation Platform (Center) for Industry-Education Integration of Energy Storage Technology, Xi’an Jiaotong University, Xi’an 710049, China
*
Author to whom correspondence should be addressed.
Appl. Sci. 2024, 14(14), 6307; https://doi.org/10.3390/app14146307
Submission received: 1 June 2024 / Revised: 12 July 2024 / Accepted: 16 July 2024 / Published: 19 July 2024

Abstract

:
As an advanced energy storage technology, the compressed CO2 energy storage system (CCES) has been widely studied for its advantages of high efficiency and low investment cost. However, the current literature has been mainly focused on the TC-CCES and SC-CCES, which operate in high-pressure conditions, increasing investment costs and bringing operation risks. Meanwhile, some studies based on the phase-change CO2 energy storage system also have had the disadvantages of low efficiency and the extra necessity of heat or cooling sources. To overcome the above problems, this paper proposes an innovative compressed CO2 phase-change energy storage system. During the energy charge process, molten salt and water are used to store heat with a smaller temperature difference in heat exchangers, and high-pressure CO2 is reserved in liquid form. During the energy discharge process, throttle expansion is applied to realize the evaporation at room temperature, and CO2 absorbs the reserved heat to improve the power capacity in the turbine and the system energy storage efficiency. The thermodynamic and exergoeconomic studies are performed firstly by using MATLAB. Then, the parametric study based on energy storage efficiency, system unit product cost, and exergy destruction is analyzed. The results show that energy storage efficiency can be improved by lifting liquid CO2 pressure as well as compressor and turbine isentropic efficiencies, and CO2 evaporation pressure has the optimal pressure point. The system unit product cost can be reduced by decreasing liquid CO2 pressure and compressor isentropic efficiency, while CO2 evaporation pressure and turbine isentropic efficiency both have optimal points. Finally, the optimization of two performances is performed by NSGA-II, and they can reach 75.30% and 41.17 $/GJ, respectively. Moreover, the optimal energy storage efficiency is obviously higher than that of other energy storage technologies, indicating the great advantage of the proposed system. This study provides an innovative research method for a new type of large-scale energy storage system.

1. Introduction

To address the adverse impacts of climate change, clean energy such as solar energy, wind energy, and hydropower is gradually accelerating the pace of replacing traditional fossil energy [1]. However, restrictions and technical barriers still exist, constraining the development of clean energy. Clean energy power generation is unstable, intermittent, unpredictable, etc., which requires that it be combined with thermal power units to improve the peak regulation ability. However, long-term operation under off-design conditions will cause great damage to thermal power units, and the peak periods of consumer electric power consumption and clean energy power are inconsistent. In order to handle these issues, developing energy storage system (ESS) technology is vital to guarantee the development of clean energy [2].
At present, the pumped hydro energy storage system (PHS), the electrochemical energy storage system, the compressed air energy storage system (CAES), and the thermal energy storage system (TES) are the main mature energy storage technologies. Among them, the PHS is the most extensively applied [3] for its superiority in its long lifetime, mature technologies, and low investment cost compared to battery and thermal energy storage systems [4,5]. However, it needs to equip upstream and downstream reservoirs, which requires suitable geographical conditions and long-period construction, making for an unignorable influence on regional ecology. Electrochemical energy storage realizes the energy conversion between chemical energy and electricity through chemical reactions. And it has received much attention from scholars due to the advantages of its short energy transition time, flexible site selection, and capacity configuration. However, it also has a great disadvantage in large capital investment [6].
TES technology is often combined with other energy storage systems to improve the energy utilization and avoid the usage of fuel, which benefits both the environment and the construction cost. It stores the thermal energy in sensible, latent, and thermochemical forms [7]. It has three mature classifications [8]: sensible thermal energy storage (STES), latent thermal energy storage (LTES), and thermochemical energy storage (TCES). Specifically, STES often works at low–mid-range temperature conditions [9], and the storage mediums typically used are water, oil, sand, molten salts, and some inorganic liquids [10]. As to the medium of STES, molten salt is usually applied in the Solar Power Industry for its favorable heat transfer characteristics in the mid–high temperature range, and unsaturated water is also a preferred medium for its low cost [8]. STES stores the thermal energy by increasing the temperature of the storage medium to store the sensible heat. Koçak et al. [11] compared the thermal and economic performances of different kinds of TES technologies, considering that STES is the only cost-effective technology, especially for mid–high-temperature industrial applications. Gao et al. [12] compared the thermal performances of the LTES system (where the storage medium is paraffin RT55) and STES system (where the storage medium is water), finding that water could make the thermal storage capacity more efficient than paraffin. Other scholars have also paid attention to the combination of TES and different forms of heat in coupling systems. Ortega-Fernández et al. [13] utilized a TES unit to store the thermal energy during the compression stage and release it during the expansion stage, realizing the high cycle efficiency of an adiabatic-CAES plant. Chaychizadeh et al. [14] employed a TES to store the released heat from the compression process and the heat transferred by electrical heaters from wind farm power. The dynamic simulation under steady wind power generation and real conditions were both conducted, and the results showed that the RTE reached 57.55% and the energy density reached 84.1 kWh/m3.
Compared to other grand-scale energy storage systems, CAES has been studied widely [15]. The high-pressure air pressurized by the compressor is reserved during the peak period, and it is released to generate power through the turbine in the off-peak period. The non-negligible advantages of CAES are its fast response, low construction cost, large capacity, and long lifetime [16]. However, some technology restrictions still exist for the CAES system. In the current research, CAES can be widely classified into four types, including traditional CAES, AA-CAES (advanced adiabatic compressed air energy storage), LAES (compressed liquid air energy storage), and ICAES (isothermal compressed air energy storage) [1]. For the traditional CAES, the efficiency is low because of the irreversible losses during internal flowing and energy conversion, as well as the waste gas emission after turbine expansion [17]. And for the underground CAES, macro-cracks could appear in the lined underground caves because of high tensile stress and varying temperature during air injection [15]. To improve system efficiency and reduce the waste gas pollution, AA-CAES is proposed, which would use stored heat from the compression process [18]. The system efficiency of the traditional CAES is about 30% to 43%, while the AA-CAES can reach 50% to 75% [17]. For the LAES, it compresses air at atmosphere pressure and then condenses it to the liquid state, improving the energy storage density and the system efficiency [19,20]. However, these three types of CAES technologies are restricted to fossil fuels and geographic conditions [20,21]. For the ICAES, it has no limitations of geographic conditions and it has low compression power and high efficiency. But the difficulties that it needs to overcome include finding a method to enhance the heat transfer efficiency to make the expansion and the compression close to the isothermal process [1].
Compared to air, the critical temperature of CO2 is close to normal temperature. CO2 can be liquefied at room temperature (the critical point of CO2 is at 7.4 MPa, 31.4 °C), and the density of CO2 in the liquid phase and the supercritical phase is several times the density of air, making CO2 more suitable to be the working medium of energy storage systems. The system structure of the compressed carbon dioxide energy storage (CCES) resembles the CAES. Morandin et al. [22] first proposed a TC-CCES which used water to store heat energy and cool salt water to store cold energy, while the discharging time was 2 h and charging and discharging power was 50 MW. Ahmadi et al. [23] proposed a TC-CCES which used cooling energy of liquefied natural gas (LNG) and thermal energy of a geothermal source. This paper systematically studied the influence of three key parameters (CO2 turbine inlet temperature, inlet pressure, and outlet pressure) on the system performance. Liu et al. [24] accomplished the exergetic analysis of a two-stage TC-CCES, determining the component with the greatest exergy loss. Zhang et al. [25] integrated a CCES system with the organic Rankine cycle (ORC) to make full use of the stored compression intercooling energy during the storage period. The results demonstrated that the system net output energy, the system exergy efficiency, and the total product unit cost under typical conditions were 27.736 MW, 66.64%, and USD 20.34/GJ, respectively. Zhang et al. [26] proposed a novel adsorption-type trans-critical compressed carbon dioxide ESS which achieved high-density and low-pressure CO2 storage by using high-pressure absorbents to absorb CO2 rather than CO2 liquefaction. The thermodynamic simulation and parameter sensitivity analysis were conducted and the system round trip efficiency, the exergy efficiency, and the energy storage density under typical conditions were 66.68%, 67.79%, and 12.11 kWh/m3, respectively. Zhang et al. [27] proposed a new CCHP combined with the TC-CCES and wind energy (which includes wind power and wind energy waste heat). It improved the wind energy utilization by analyzing the influences of five main variables on the system performance. Hao et al. [28] proposed a TC-CCES integrated with a heat pump subsystem, and the economic performance was analyzed by the life cycle cost method for CO2 utilization. In the thermal energy storage (TES) subsystem, the heat pump cycle was applied to improve the quality of the heat stored in the thermal storage unit, and the working fluid of the heat pump was R245fa with its low boiling point, fairly high molecular mass, and high critical temperature (427 K).
Except for the above-mentioned TC-CCES systems, the SC-CCES has also aroused wide attention. Xu et al. [29] proposed two SC-CCES systems, applying an underwater bag to reserve supercritical CO2, which keeps the pressure constant during the energy conversion. Oh et al. [30] constructed a SC-CCES system with two-stage compression. The system operation status was analyzed and the operational feasibility was discussed. Chen et al. [31] came up with a SC-CCES coupled with the concentrating solar thermal subsystem, and a printed circuit heat exchanger was used to promote the system. This paper analyzed the influences of the mass flow and temperature of thermal oil, and calculated the economic indicators, identifying the viability of the system investment. Meanwhile, advanced exergy analysis was conducted on the SC-CCES system. Liu et al. [24] performed the comprehensive analysis of the new two-stage SC-CCES by studying the conventional and advanced exergy analyses, finding that the result from the advanced exergetic analysis was more persuasive. He et al. [32] found that the SC-CCES performs better than the CAES, and the recuperator has the biggest avoidable exergy loss. Zhang et al. [33] established an SC-CCES coupled with a TES and compared it with the compressed liquid CO2 energy storage (LCES) and the AA-CAES, finding that the energy storage efficiency of the AA-CAES was better than that of the CCES, while the system efficiency of the CCES was 4.05% higher than that of the LCES, and the energy density of the CCES was 2.8 times bigger than that of the AA-CAES. Moreover, the results showed that system minimum pressures have a major effect on the system performance compared to system maximum pressures. Huang et al. [34] placed emphasis on the system layout by dividing super-critical heat exchangers into two sets so that different masses of thermal fluid were adjusted to fit the specific heat of supercritical CO2. The exergy destructions of high-pressure heat exchangers could be significantly lessened, while the system round trip efficiency was improved by 2.84–5.26% compared to the baseline system. Chaychizadeh et al. [14] put forward an SC-CCES system combined with a hierarchical water TES, which stored wind energy in the off-peak period and discharged it as the steady power in the peak period. Zhang et al. [35] proposed the SC-CCES system with a low-temperature TES. The influences of main variables on the system performance were analyzed and the system optimization was completed by the genetic algorithm method.
In the ESS with trans-critical and supercritical CO2 as the working fluids, each component needs to withstand high pressure. In case the operation pressure is higher than the CO2 critical pressure, the difficulty and the cost for the system manufacturing increase and the safety for system operation are challenged. In response to these problems, Tang et al. [36] and Sun et al. [37] proposed the ESS based on the carbon dioxide phase transition process (PC-CCES). This system used a gas tank to reserve the gaseous working fluid at normal temperature and pressure. During the energy storage process, the working fluid was compressed first and then condensed, and finally reserved in the liquid tank. During the energy discharge period, the working medium evaporated and then expanded to generate power. The gas storage tank bore the highest pressure, close to the CO2 critical pressure, while the pressure of other components was much lower than the critical value, which effectively solved the problem caused by high pressure in the supercritical or trans-critical systems. However, these systems also have problems, such as low system energy storage efficiency and the necessity of the additional heat source to evaporate the working fluid, because the storage pressure of the working fluid is lower than its critical pressure. Meanwhile, only one TES unit will raise the temperature difference of the heat exchanger for the severe changes of the specific heat capacity when CO2 approaches the critical state.
This paper puts forward an innovative compressed CO2 phase-change energy storage system in which gaseous carbon dioxide is reserved in a gas storage tank at normal temperature and pressure. Carbon dioxide is compressed and then condensed into the liquid state to store in a liquid tank during the energy storage period. The system maximum pressure is lower than carbon dioxide critical pressure, which can largely reduce the system manufacture investment and improve the operational security. During the energy discharge period, the STES is used to store the sensible heat from the compression and reheat CO2, so that the power capacity of the turbine is improved and the system energy storage efficiency is raised. To avoid the heat exchanger pinch points, this system proposes two-unit TES to complete heat exchange, respectively. Meanwhile, the throttle valve is applied to decrease both the pressure and the temperature of the evaporator, so that normal-temperature water can be used to evaporate CO2 in the evaporator.
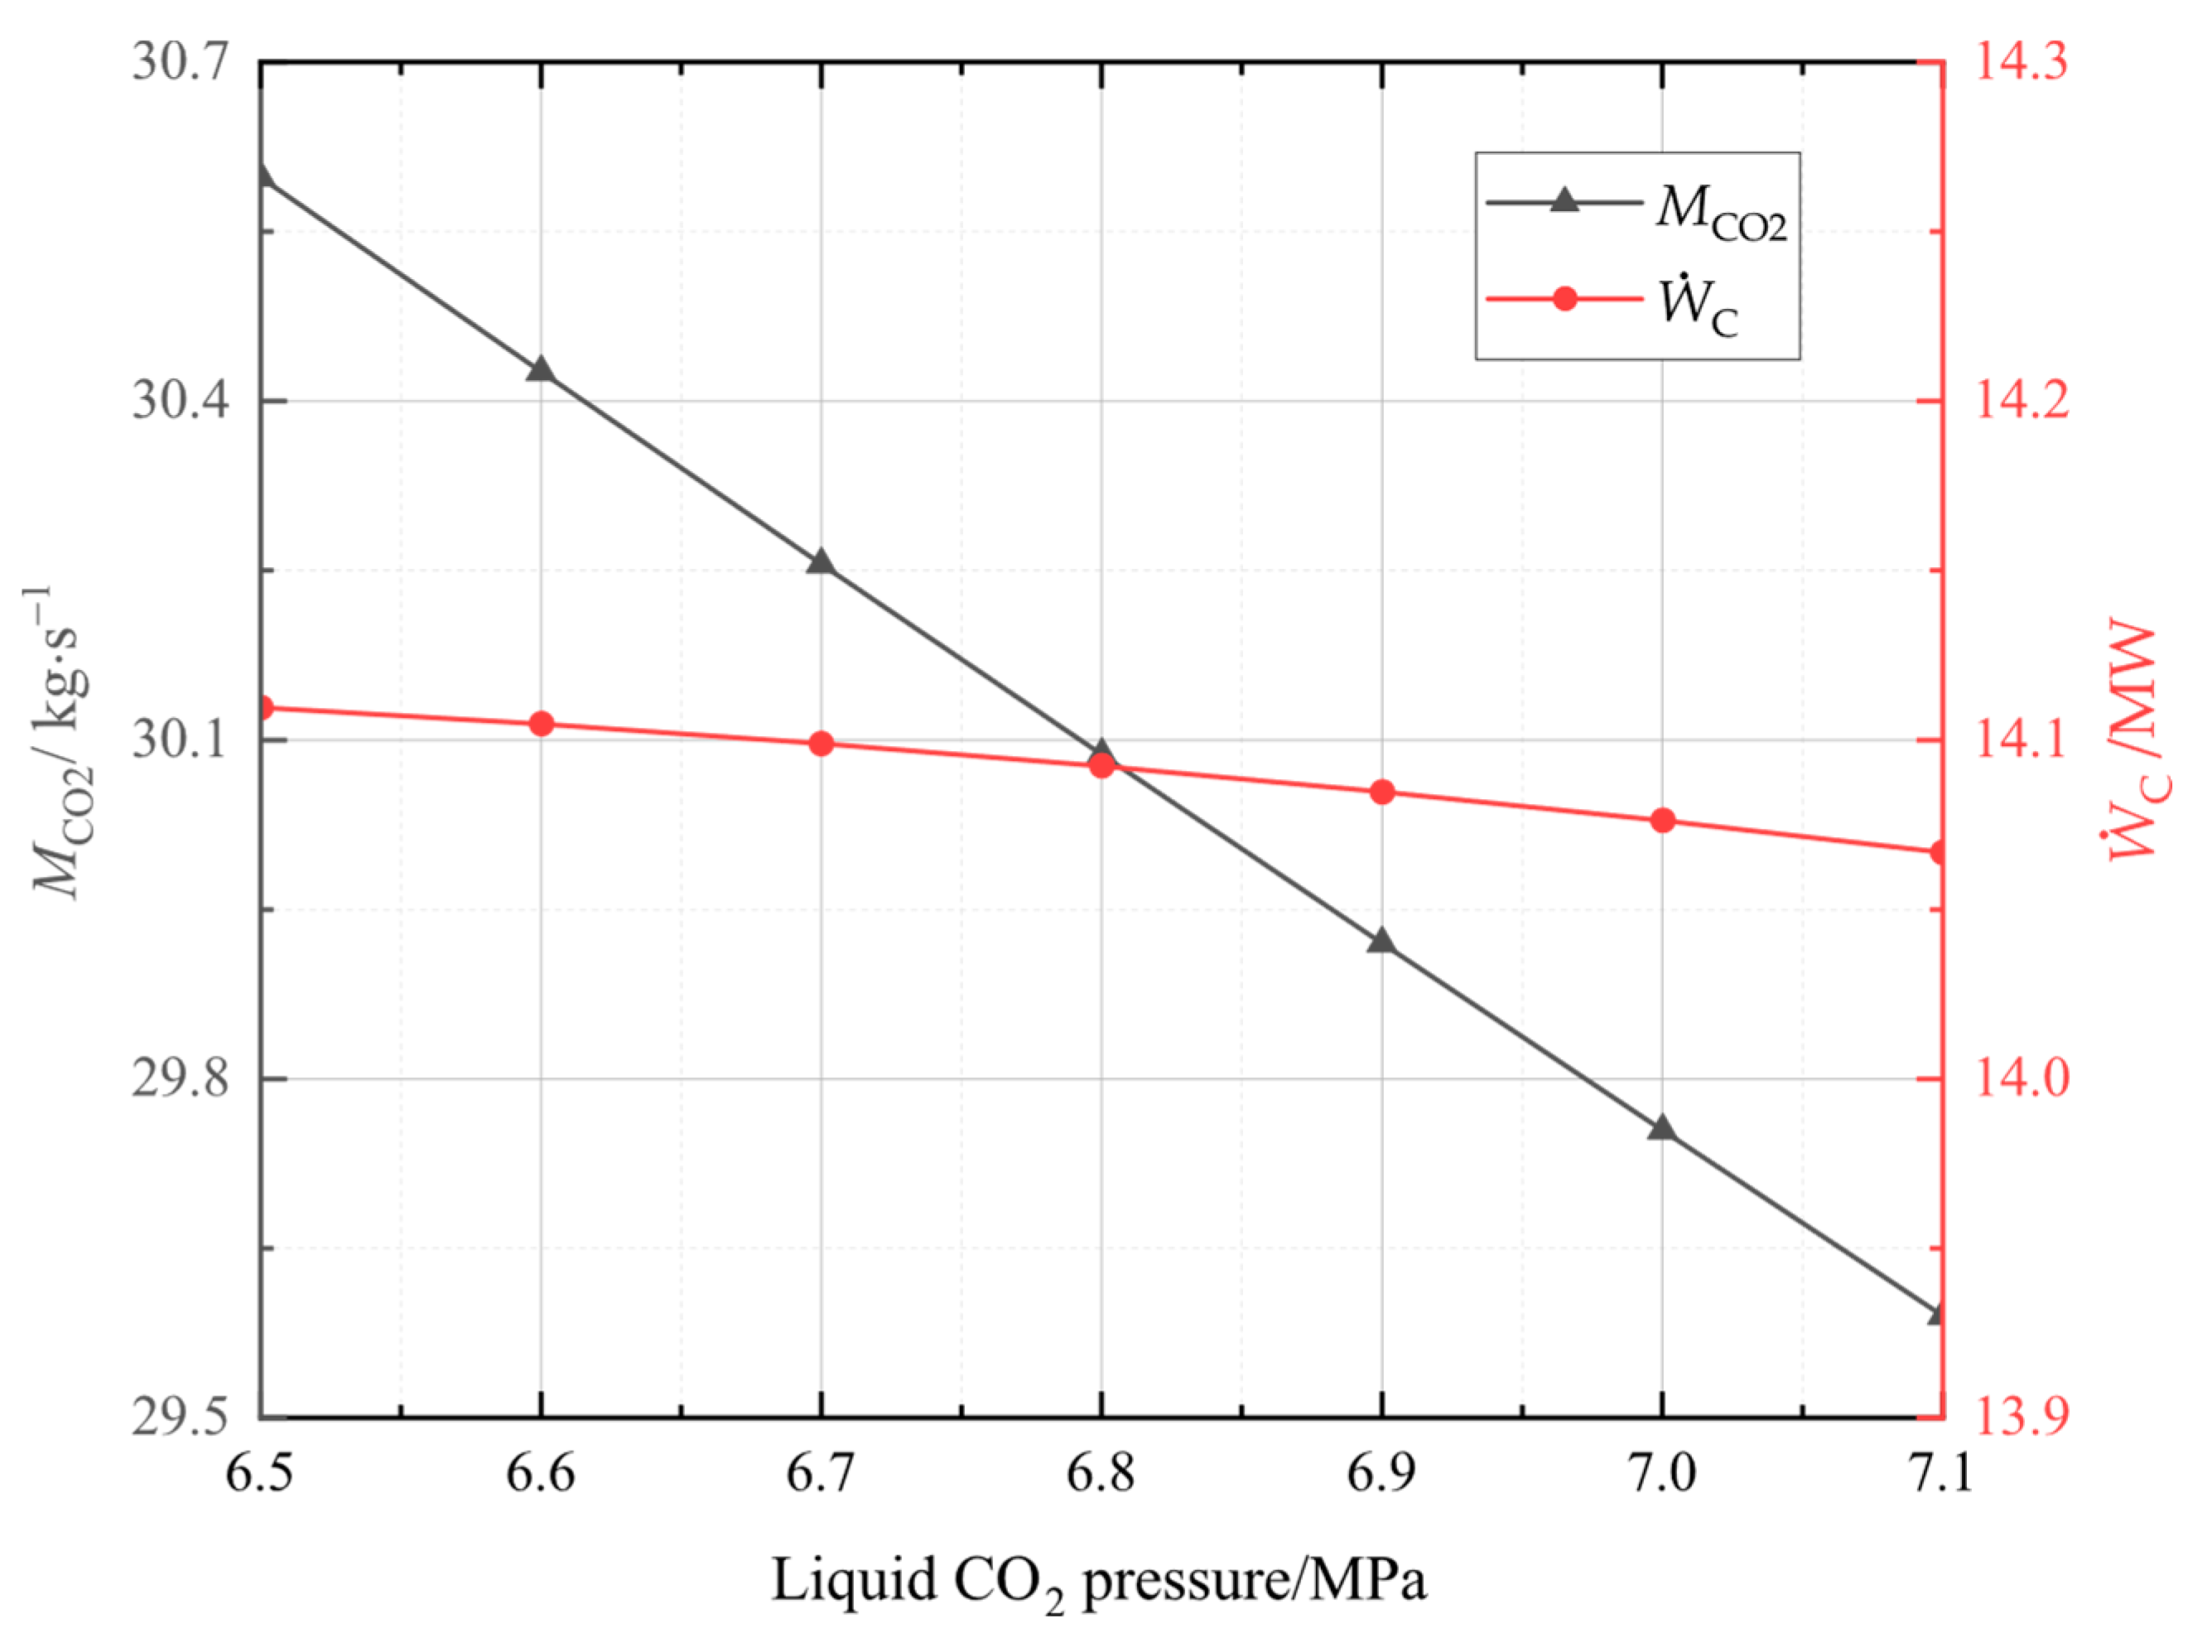
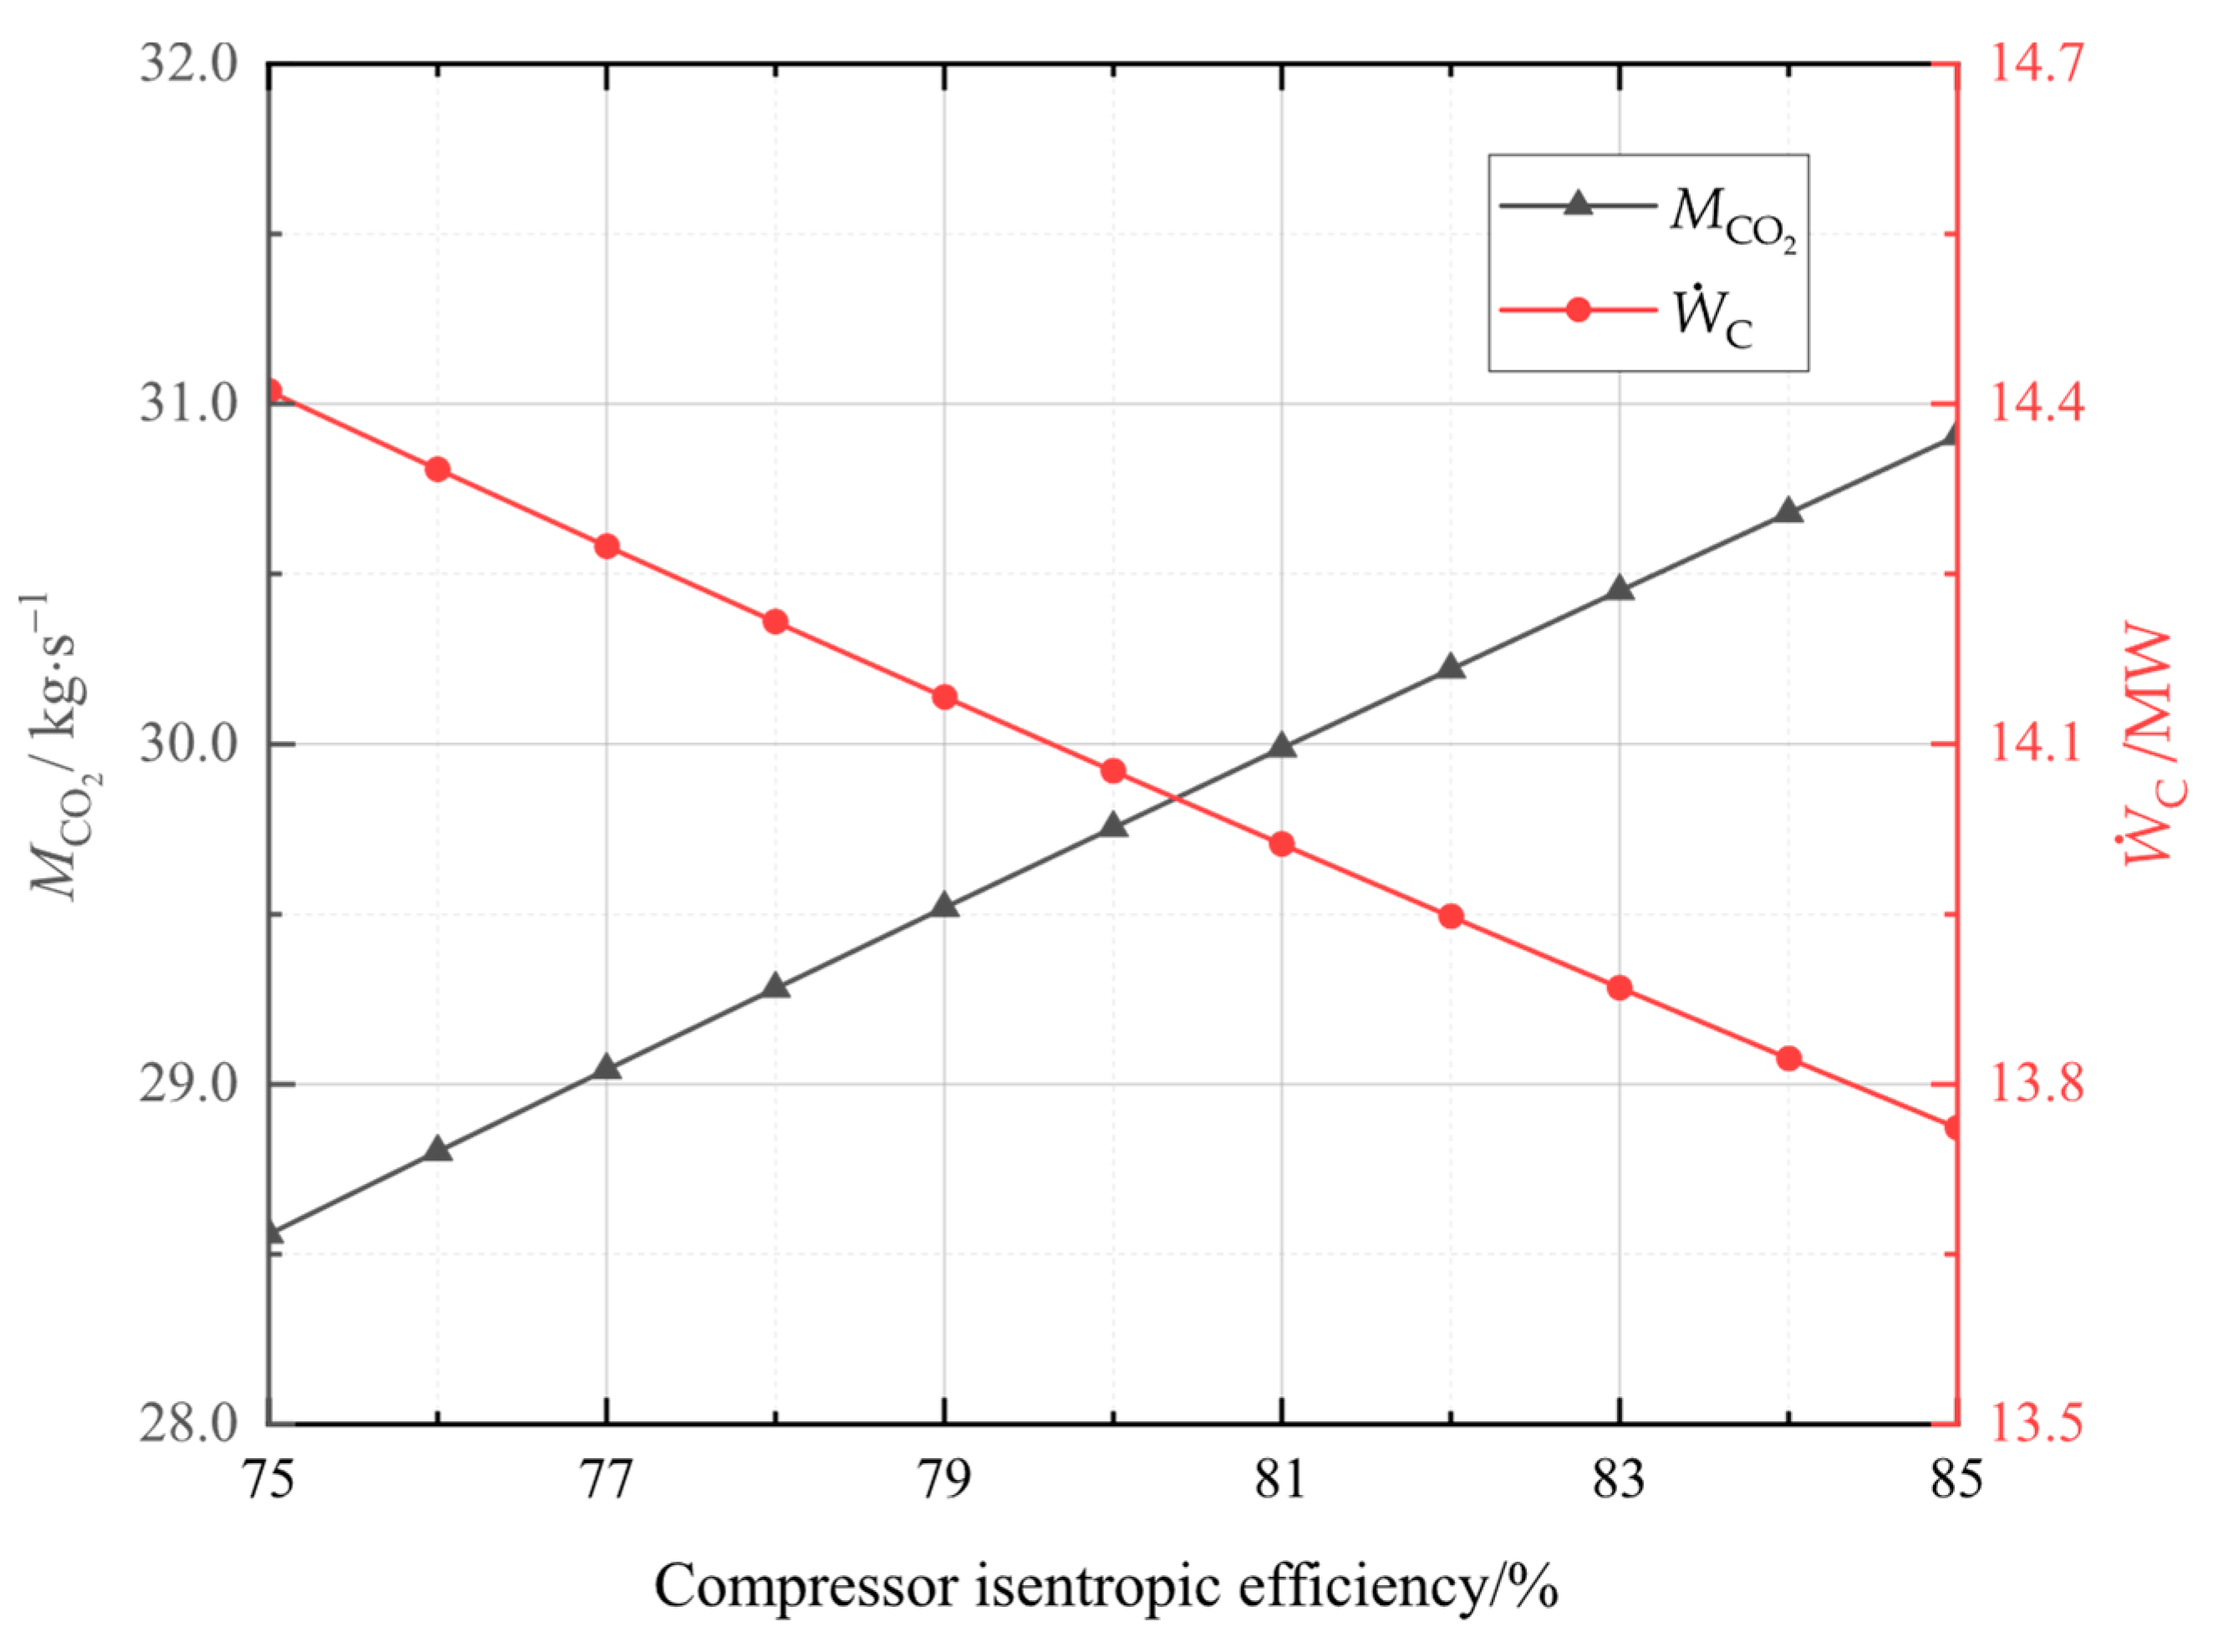
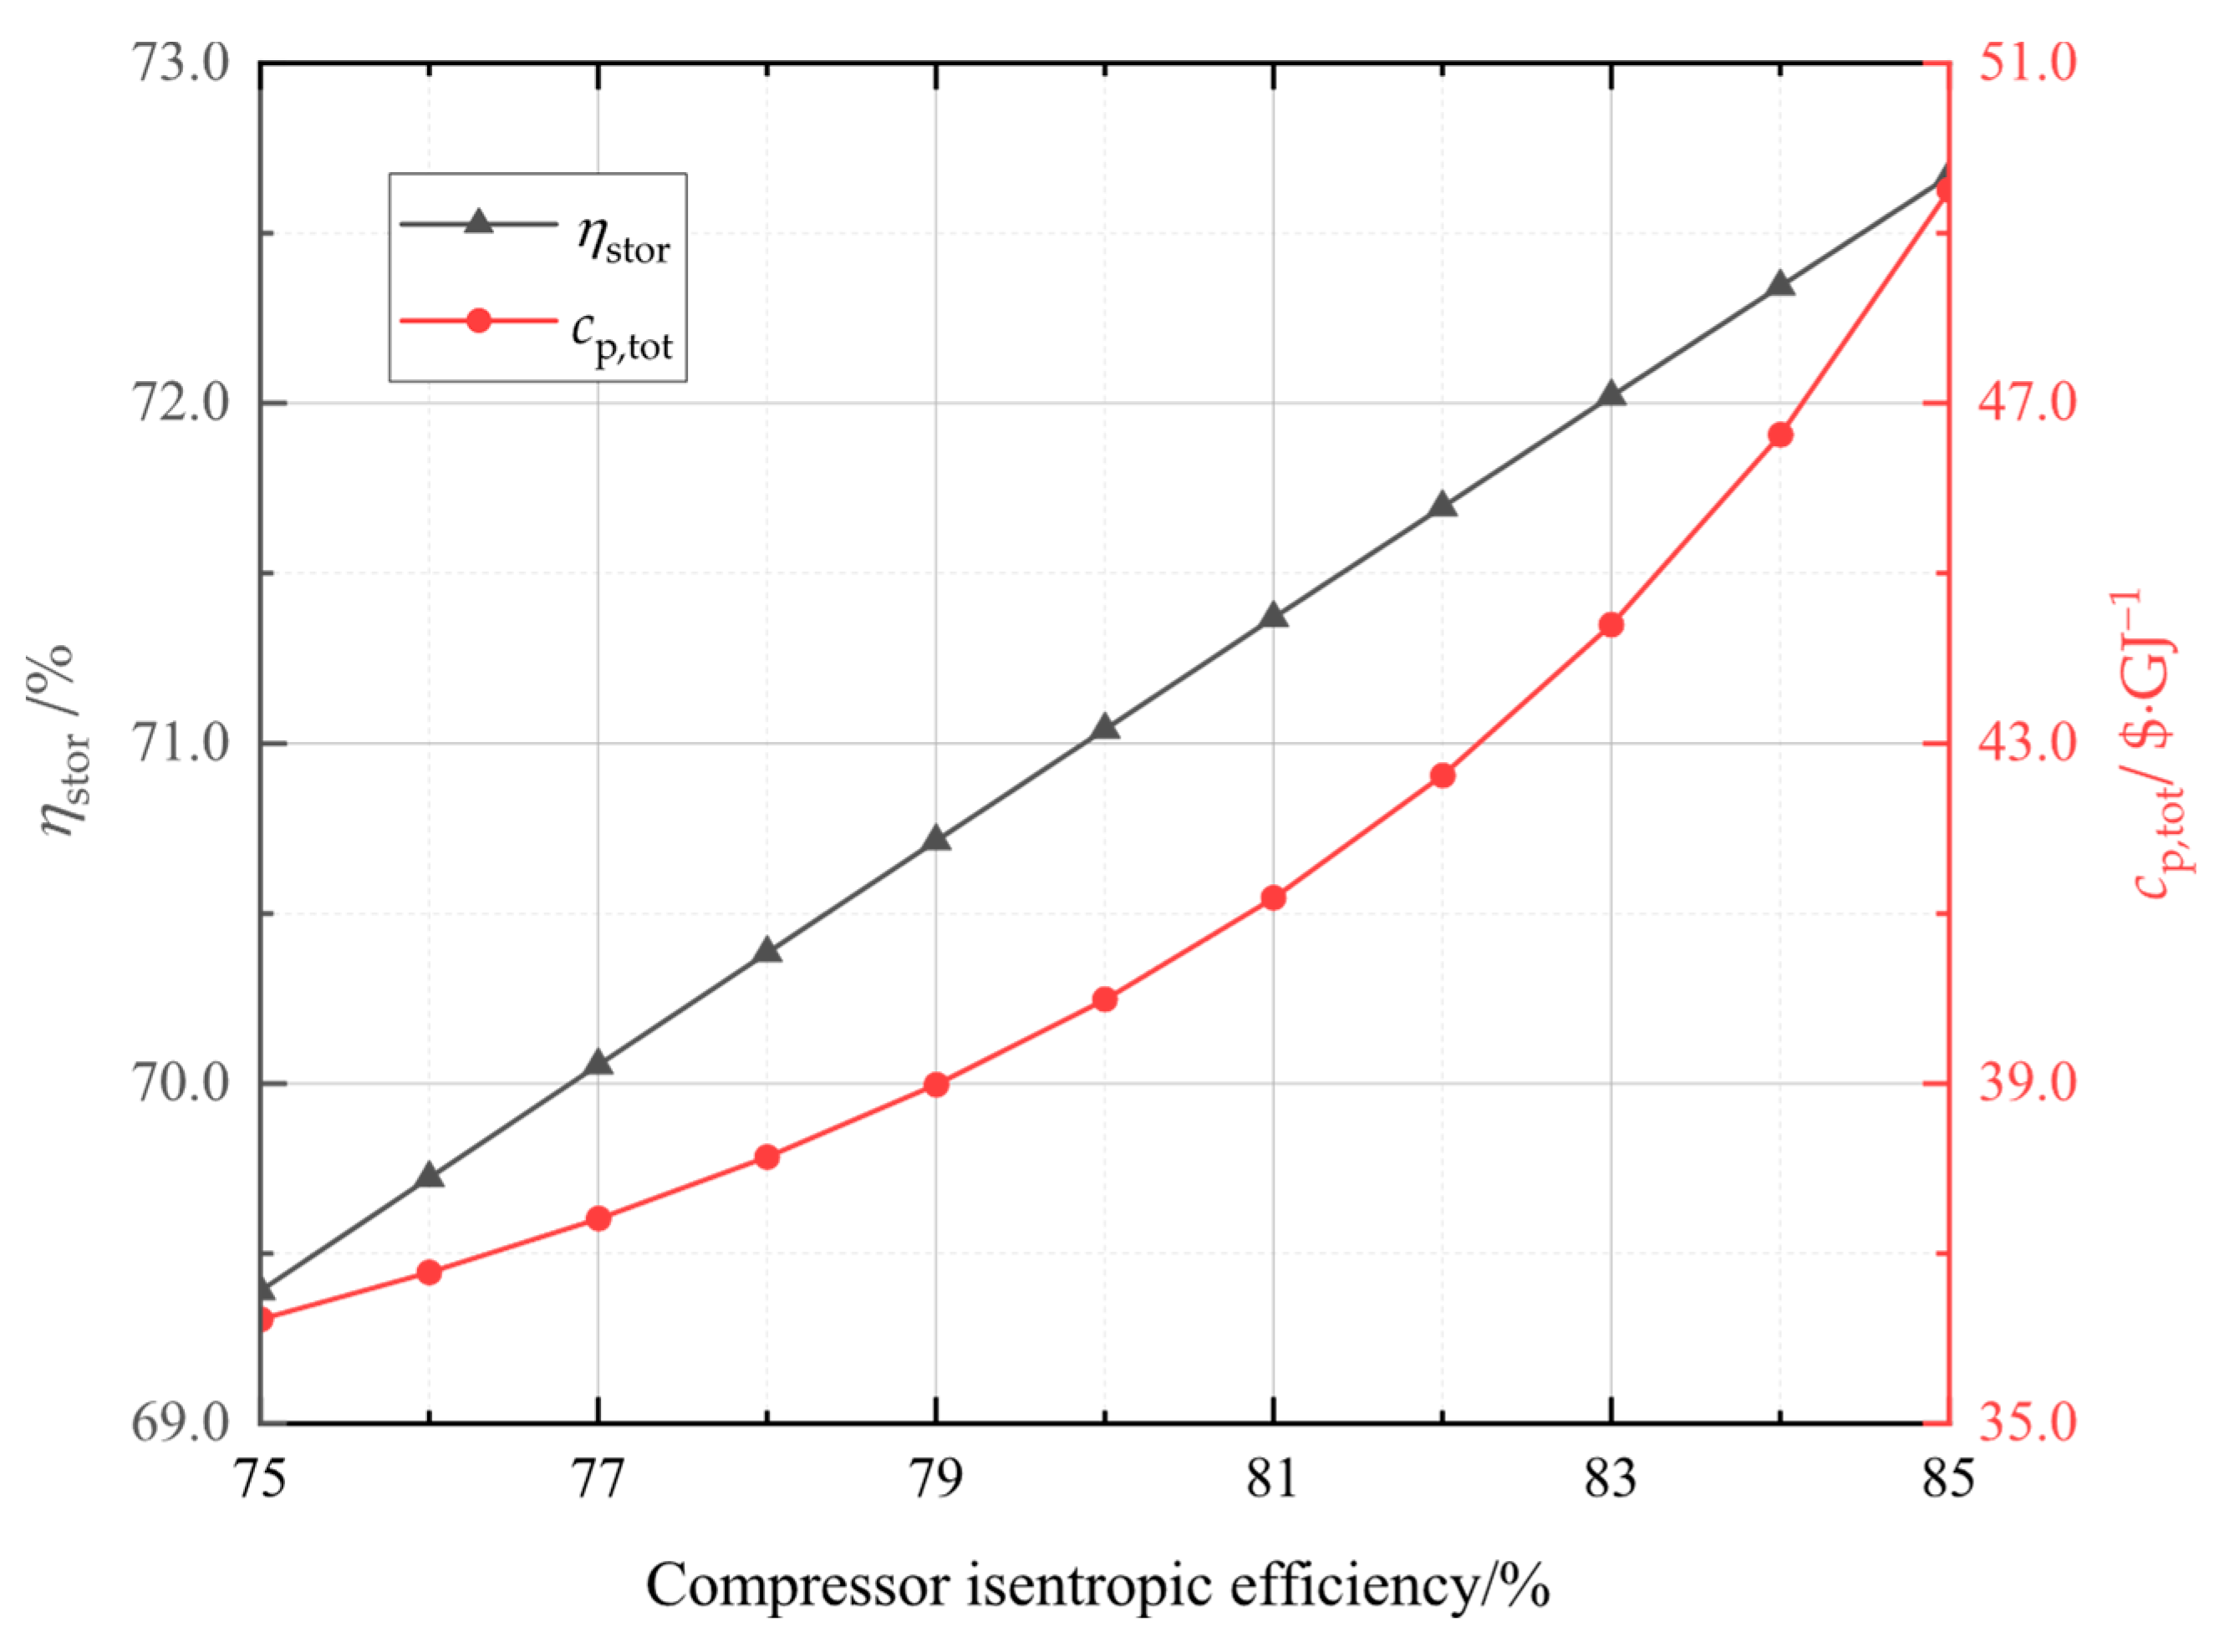
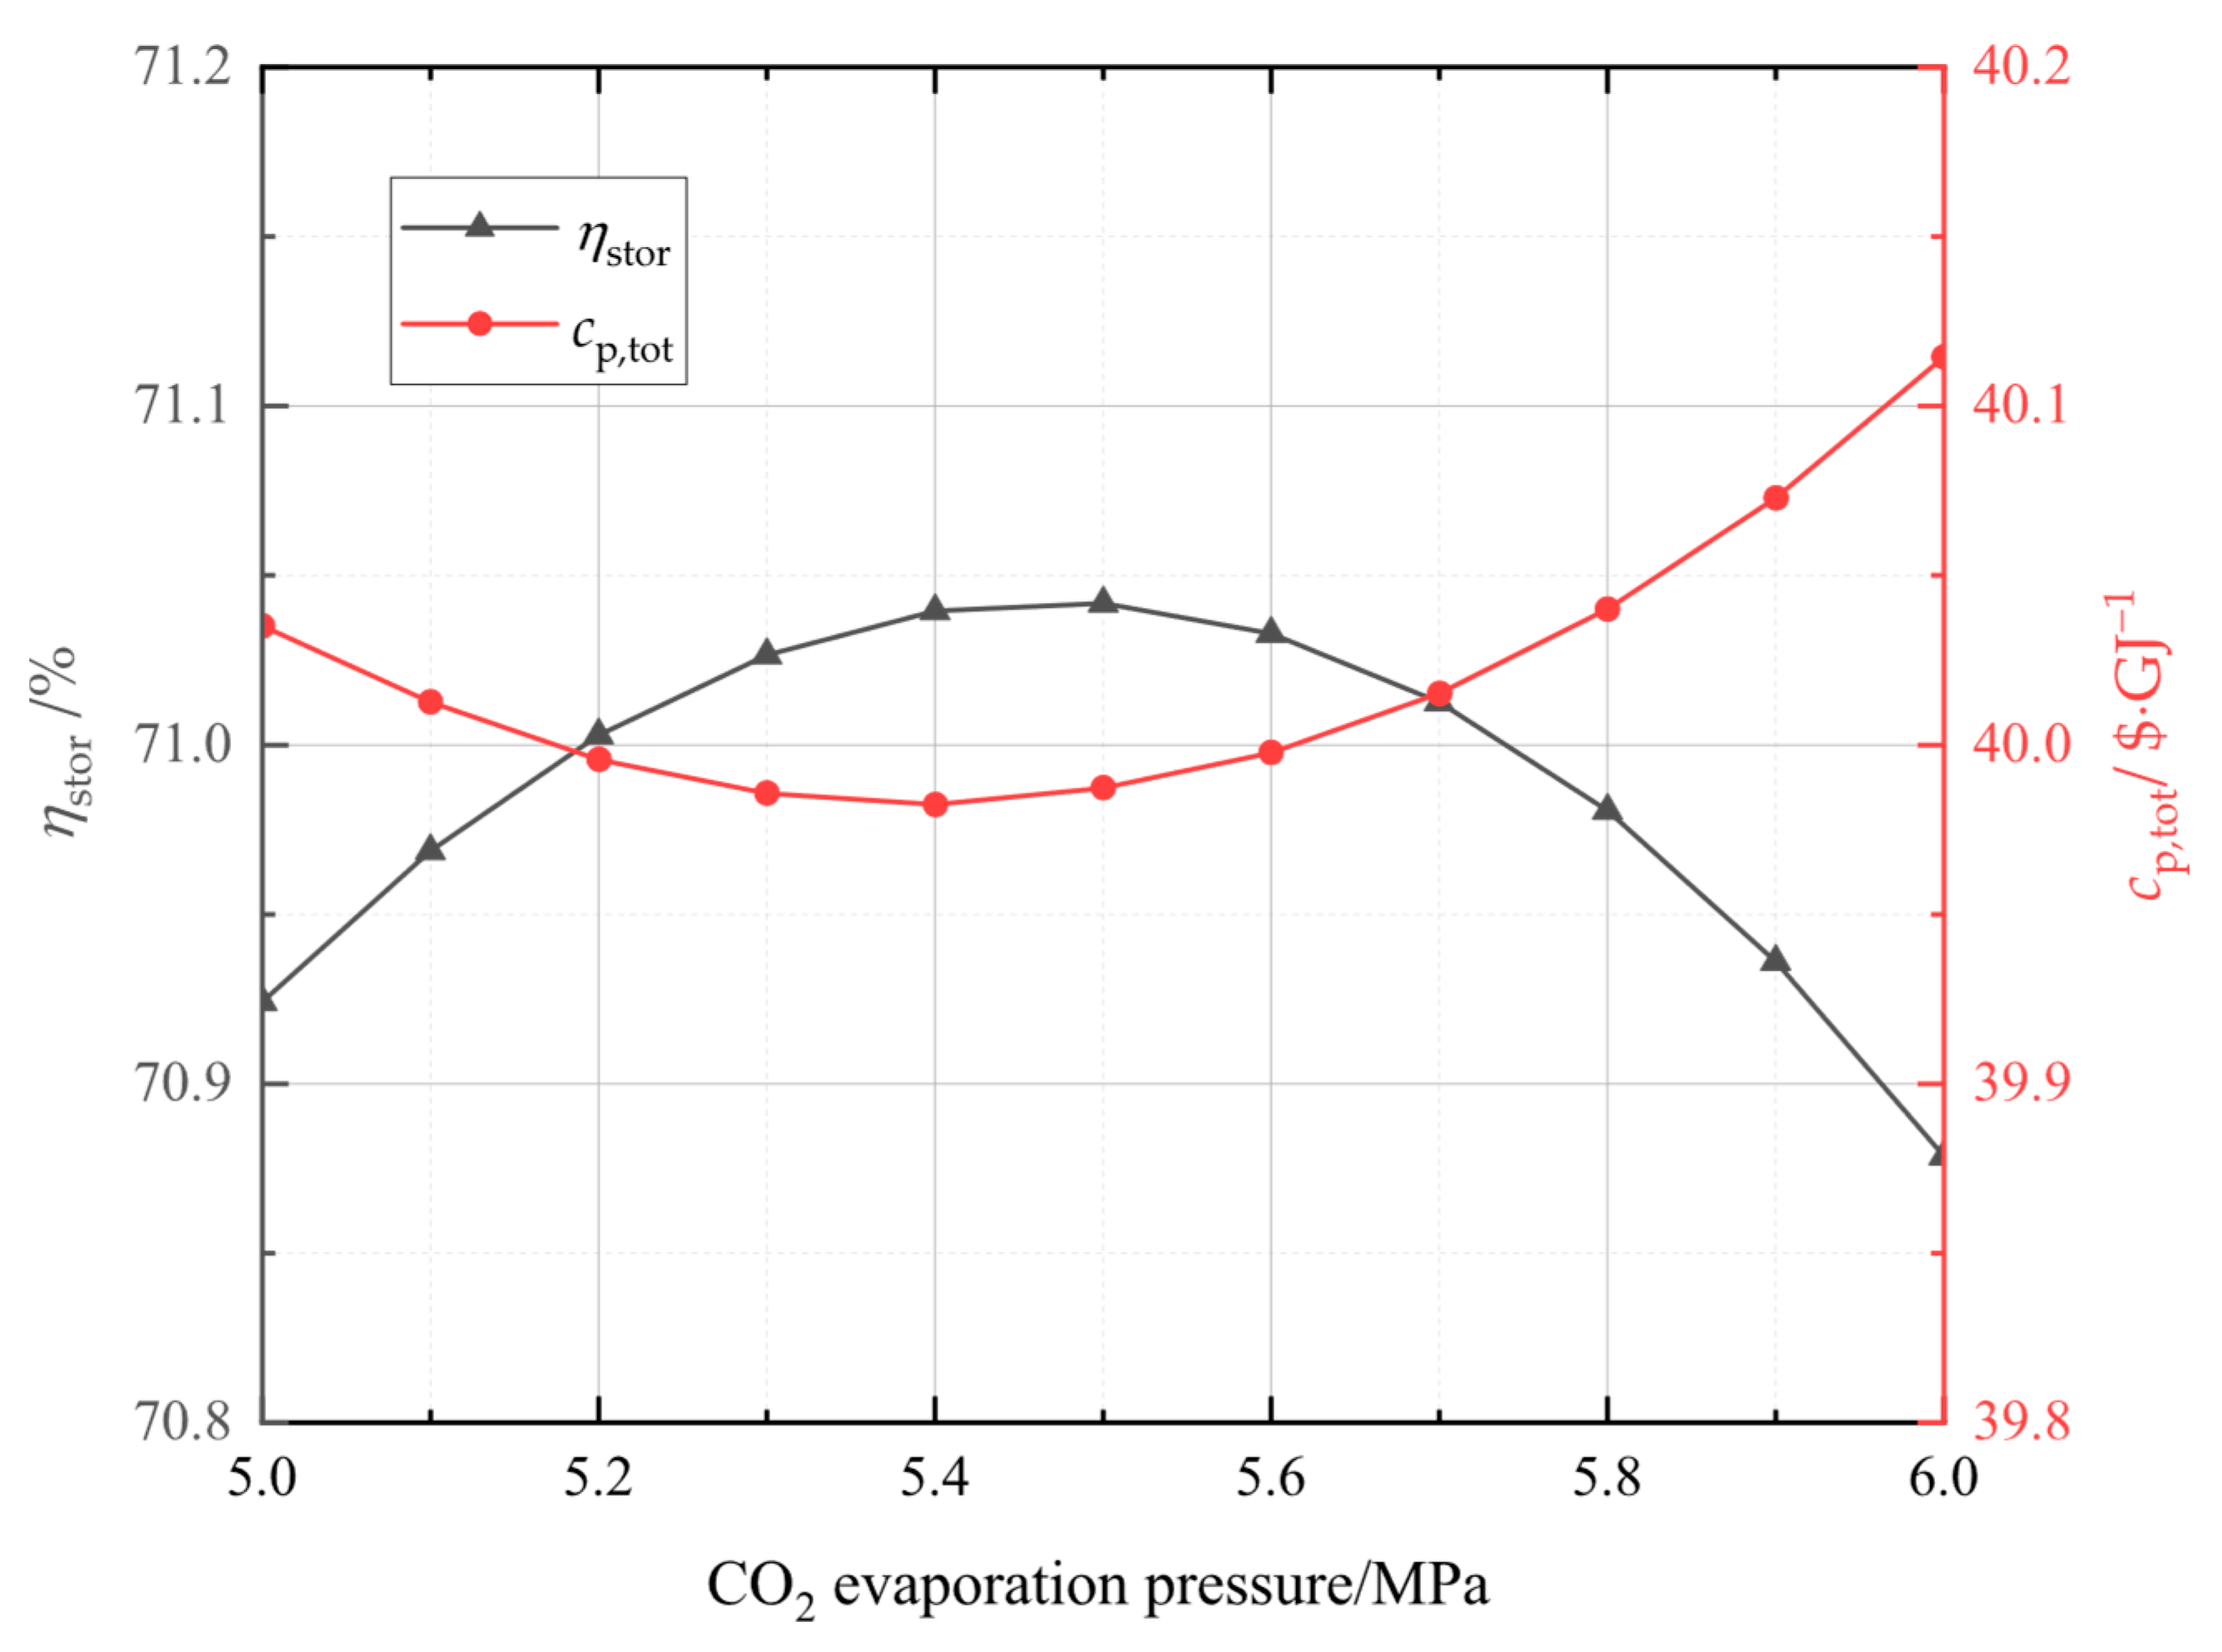
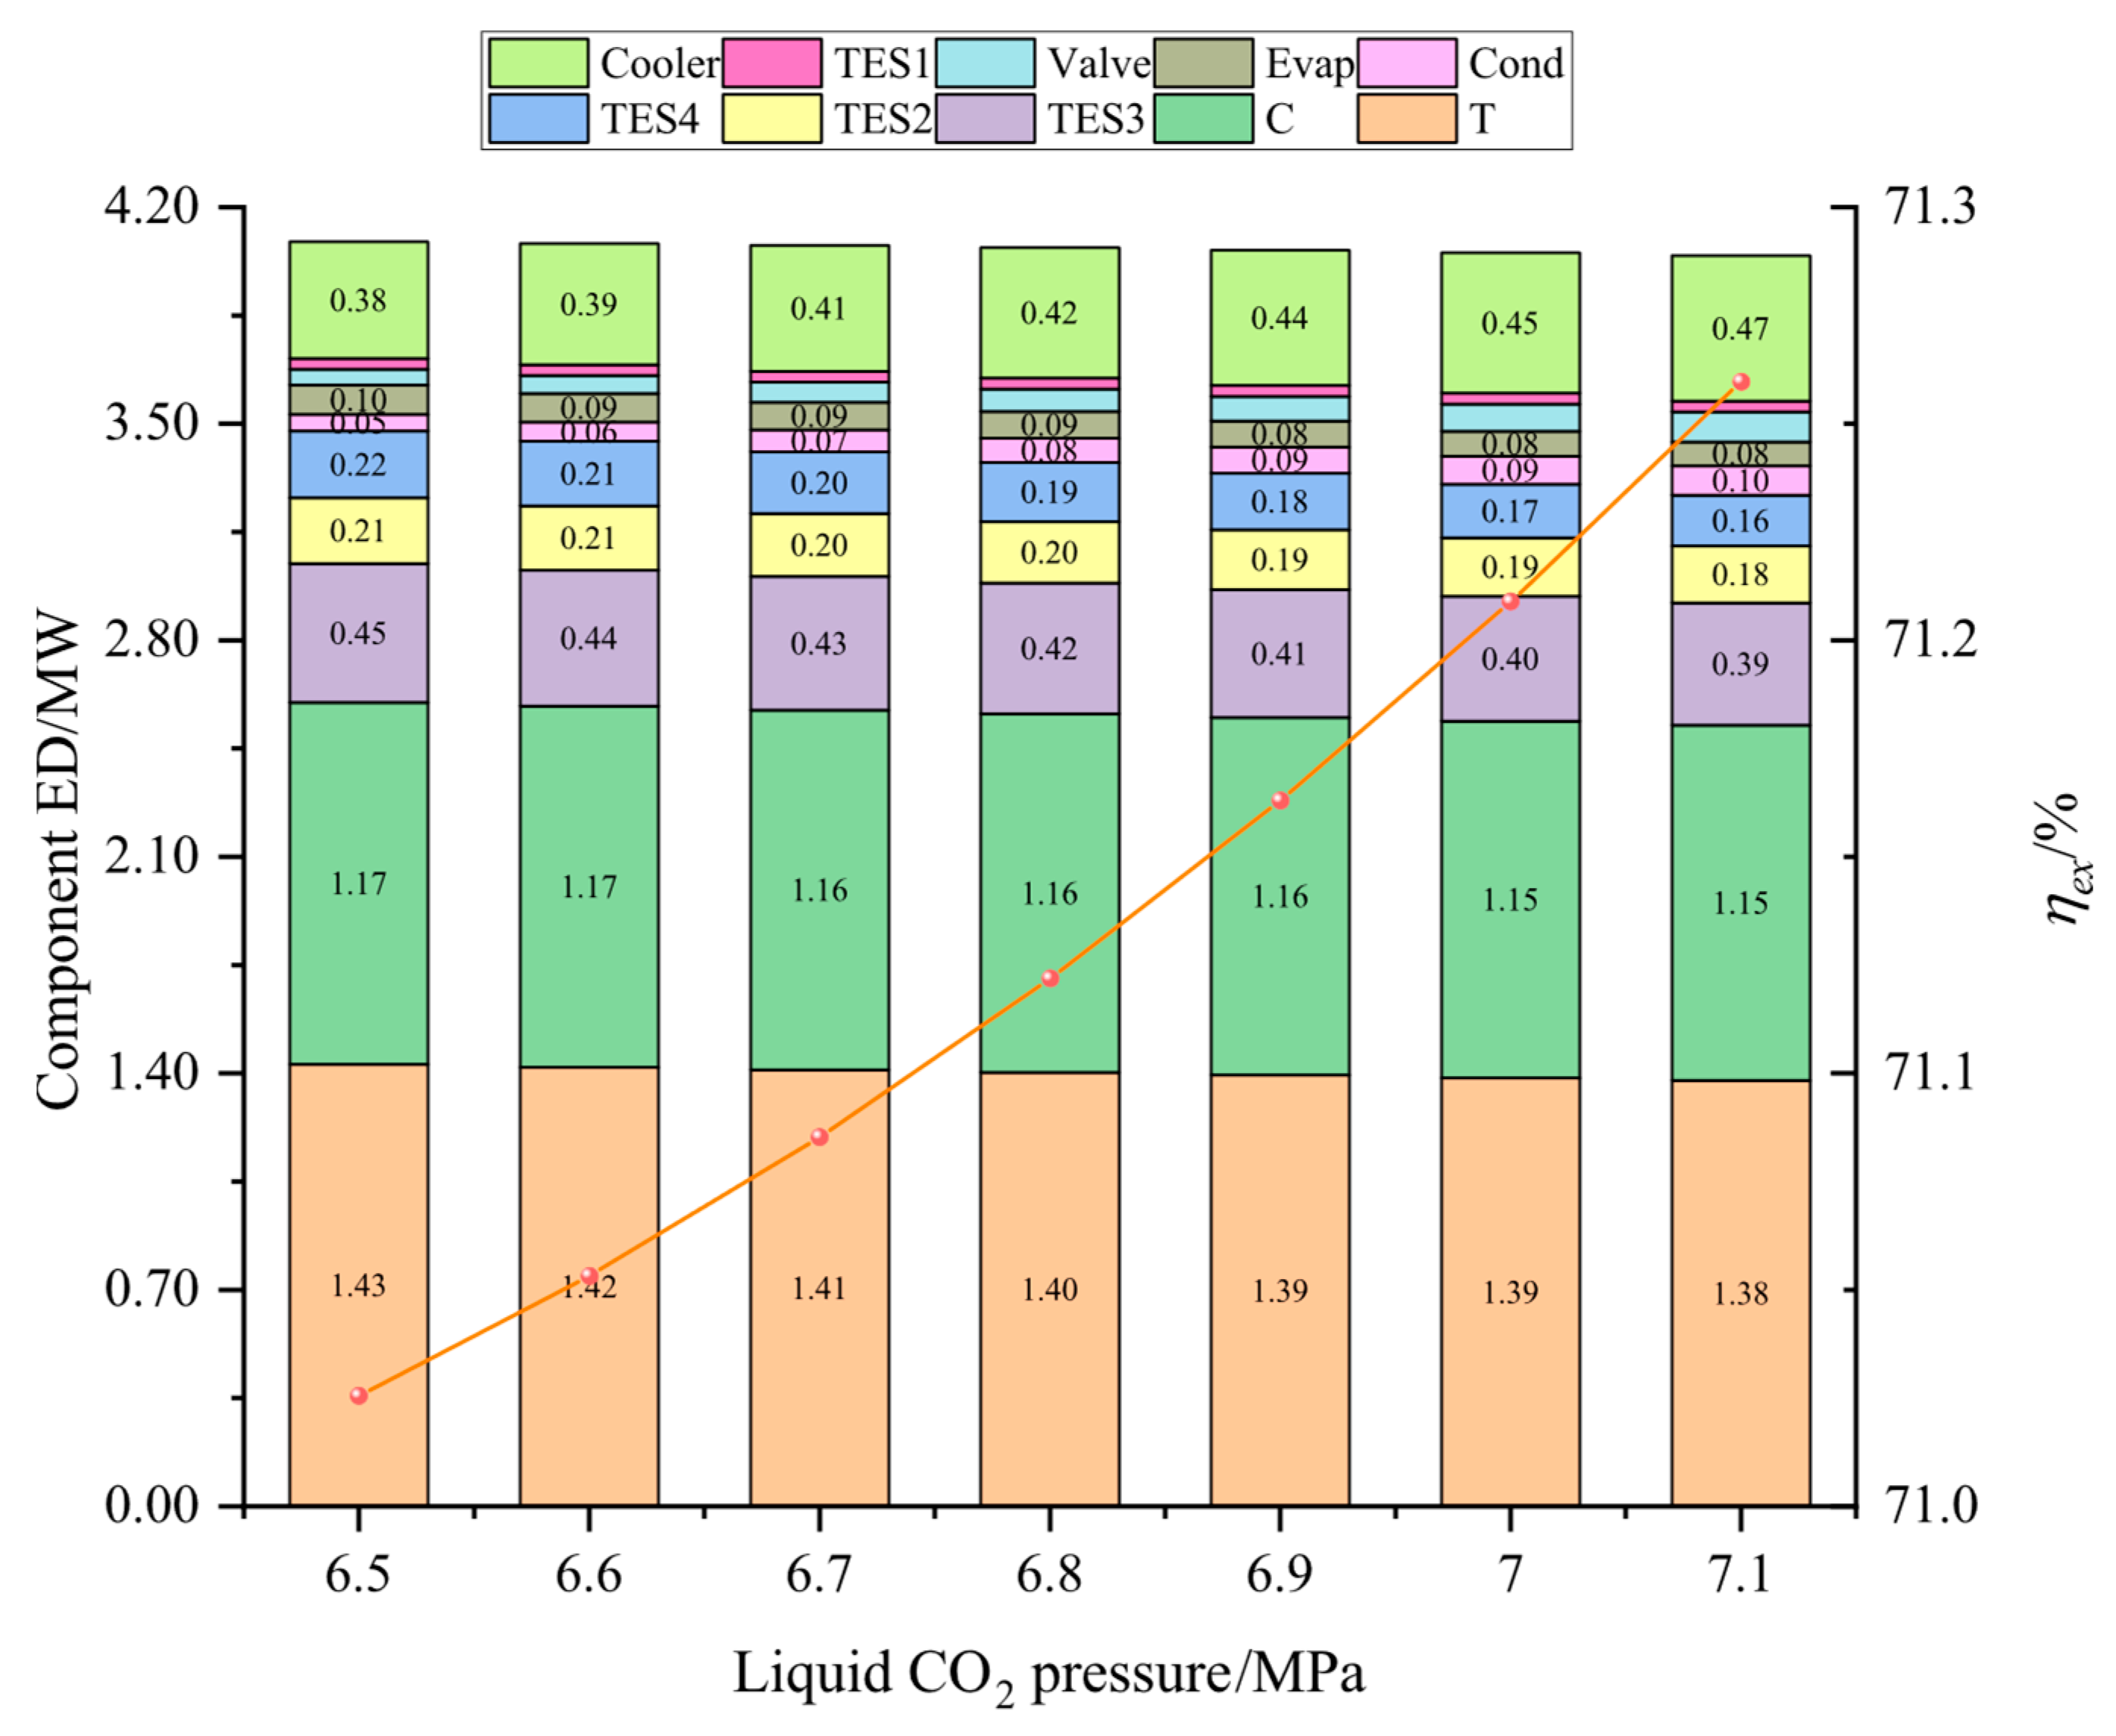
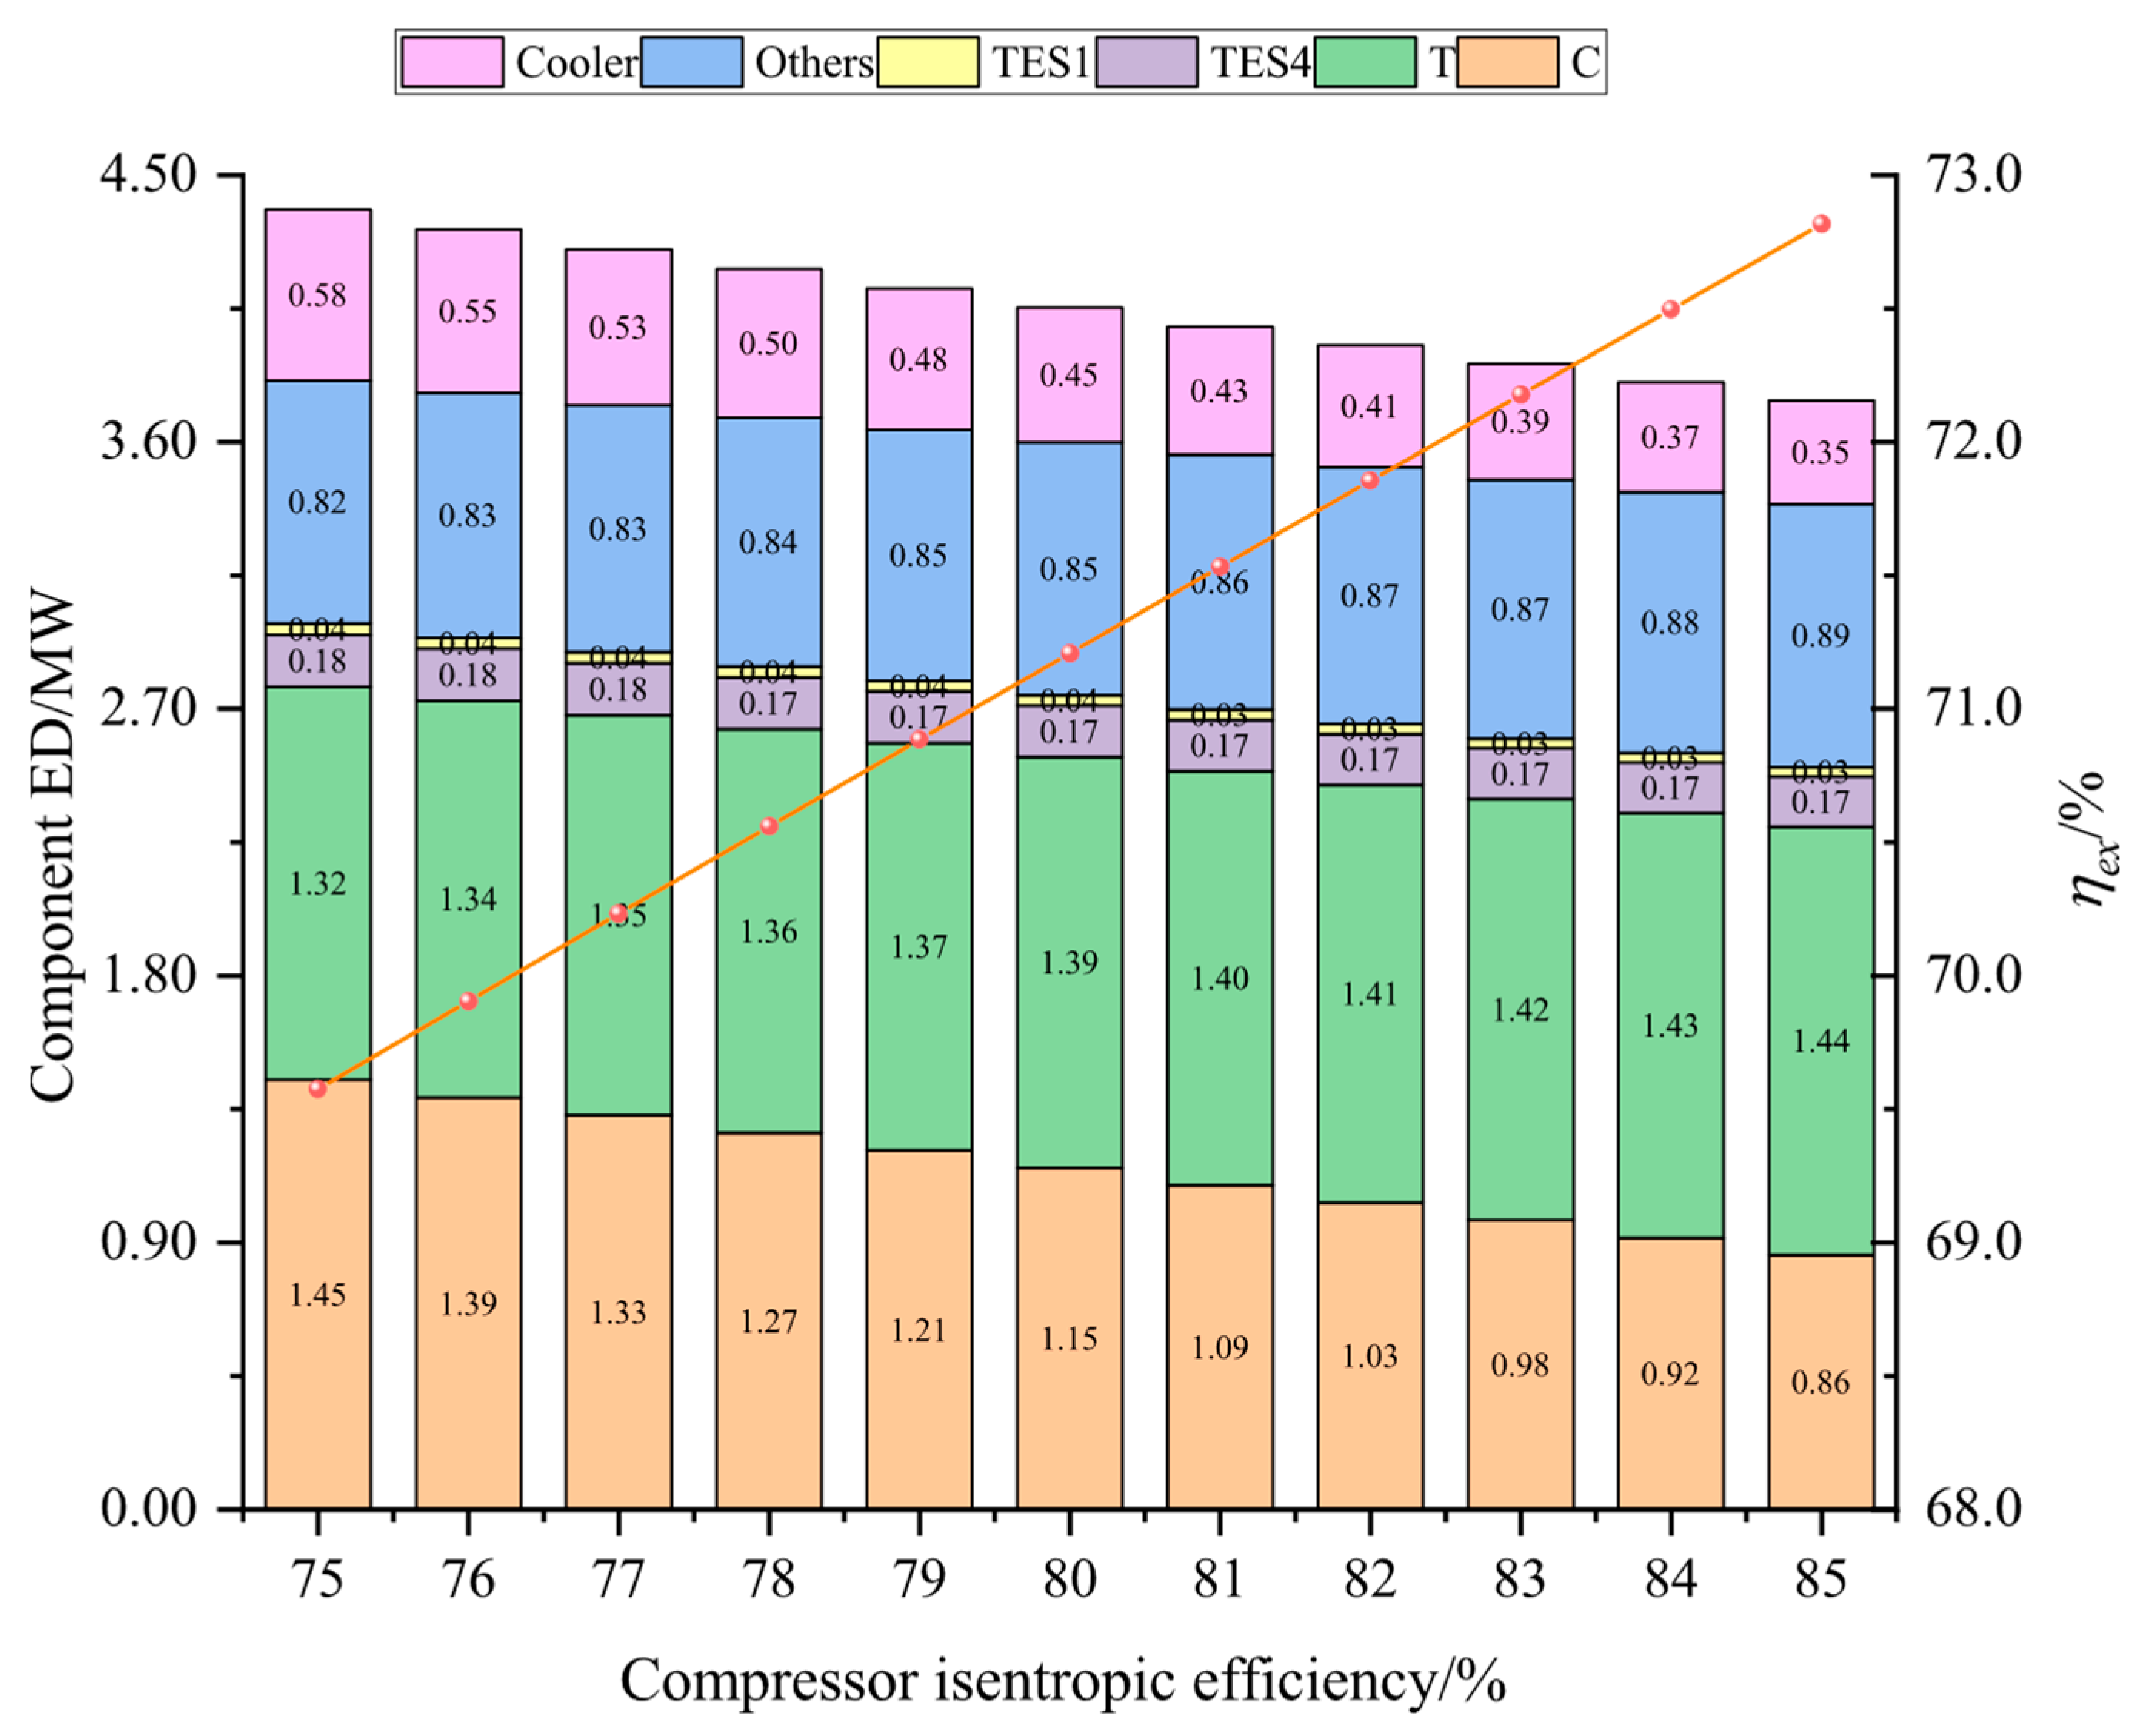
In this study, the system was established and the performance under typical operation conditions was calculated and analyzed. Then, the main variables, including liquid CO2 pressure, as well as compressor and turbine isentropic efficiencies, and CO2 evaporation pressure were studied for their effects on the system energy storage efficiency, the system unit output power cost, and the system exergetic efficiency. Finally, the multi-objective optimization was accomplished to acquire optimal operation parameters, then the system superiority was proved by comparing optimal energy storage efficiency with that of other systems.

2. System Process and Assumptions

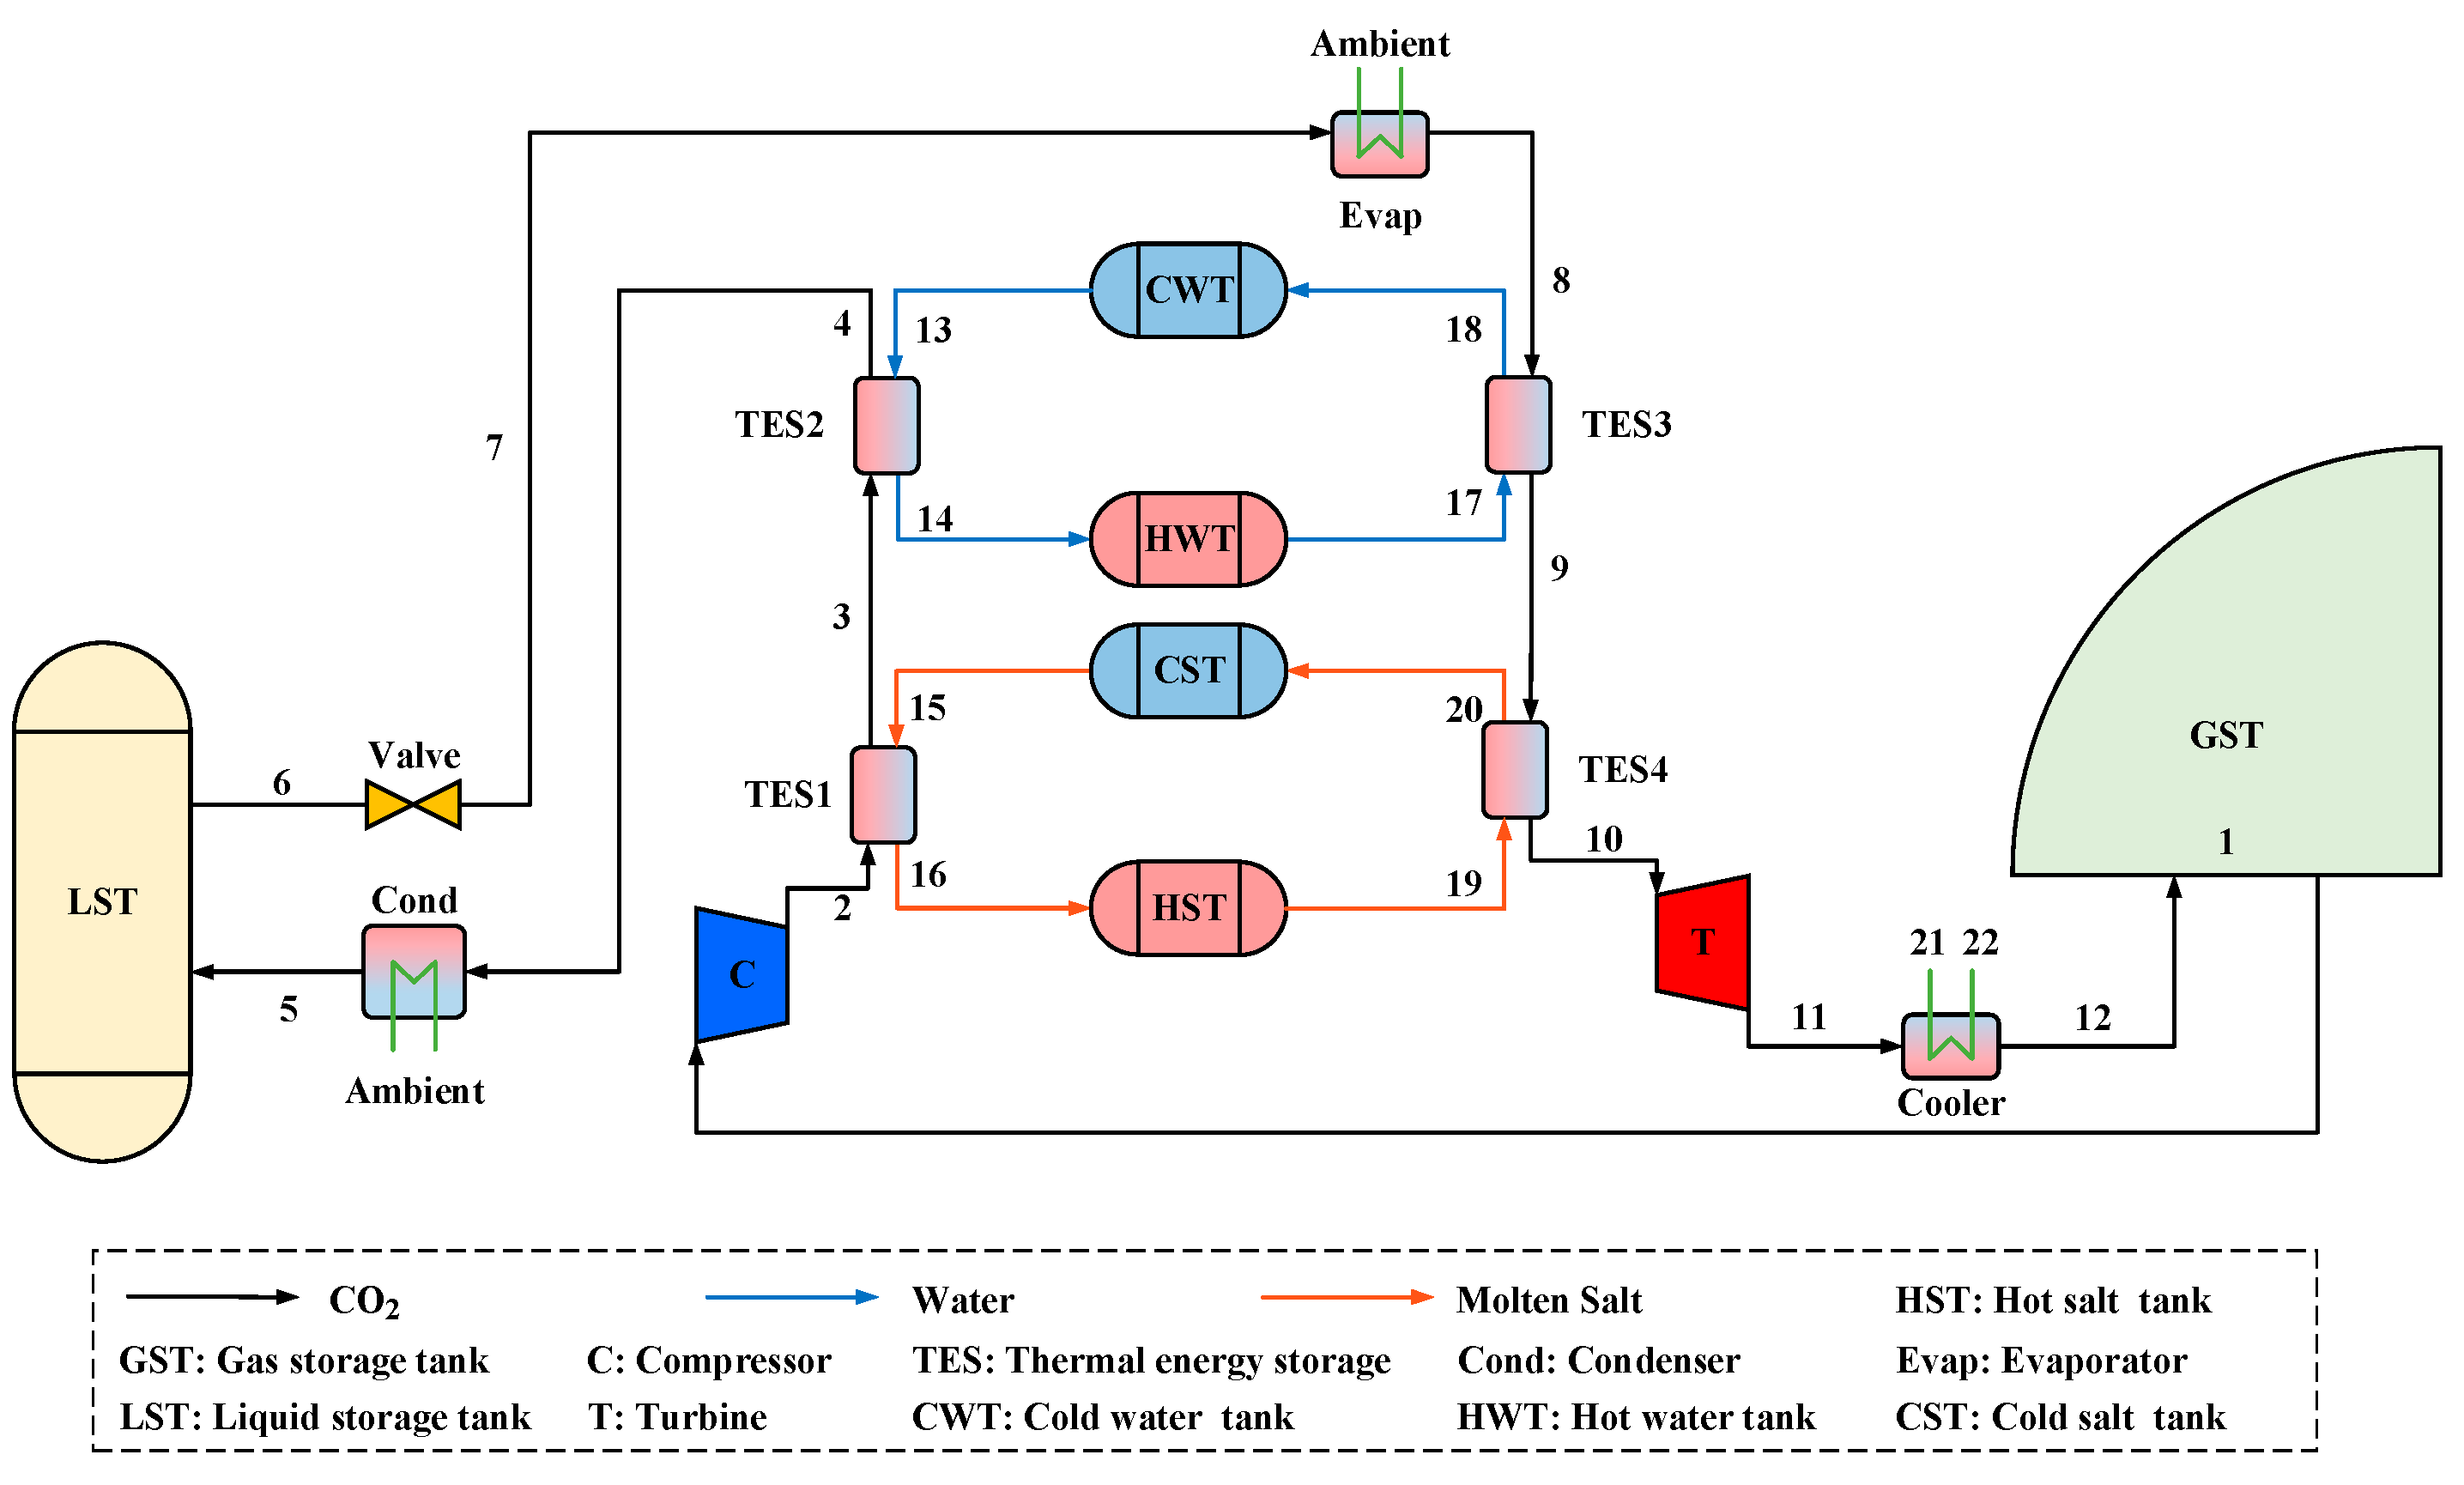
Figure 1 shows an innovative PC-CCES system: throttling expansion compressed CO2 phase-change energy storage system. The system’s main components include a CO2 gas storage tank, compressor, TES, condenser, liquid CO2 storage tank, throttle valve, evaporator, turbine, cooler, cold water tank, hot water tank, cold salt tank, hot salt tank. The specific heat capacity of CO
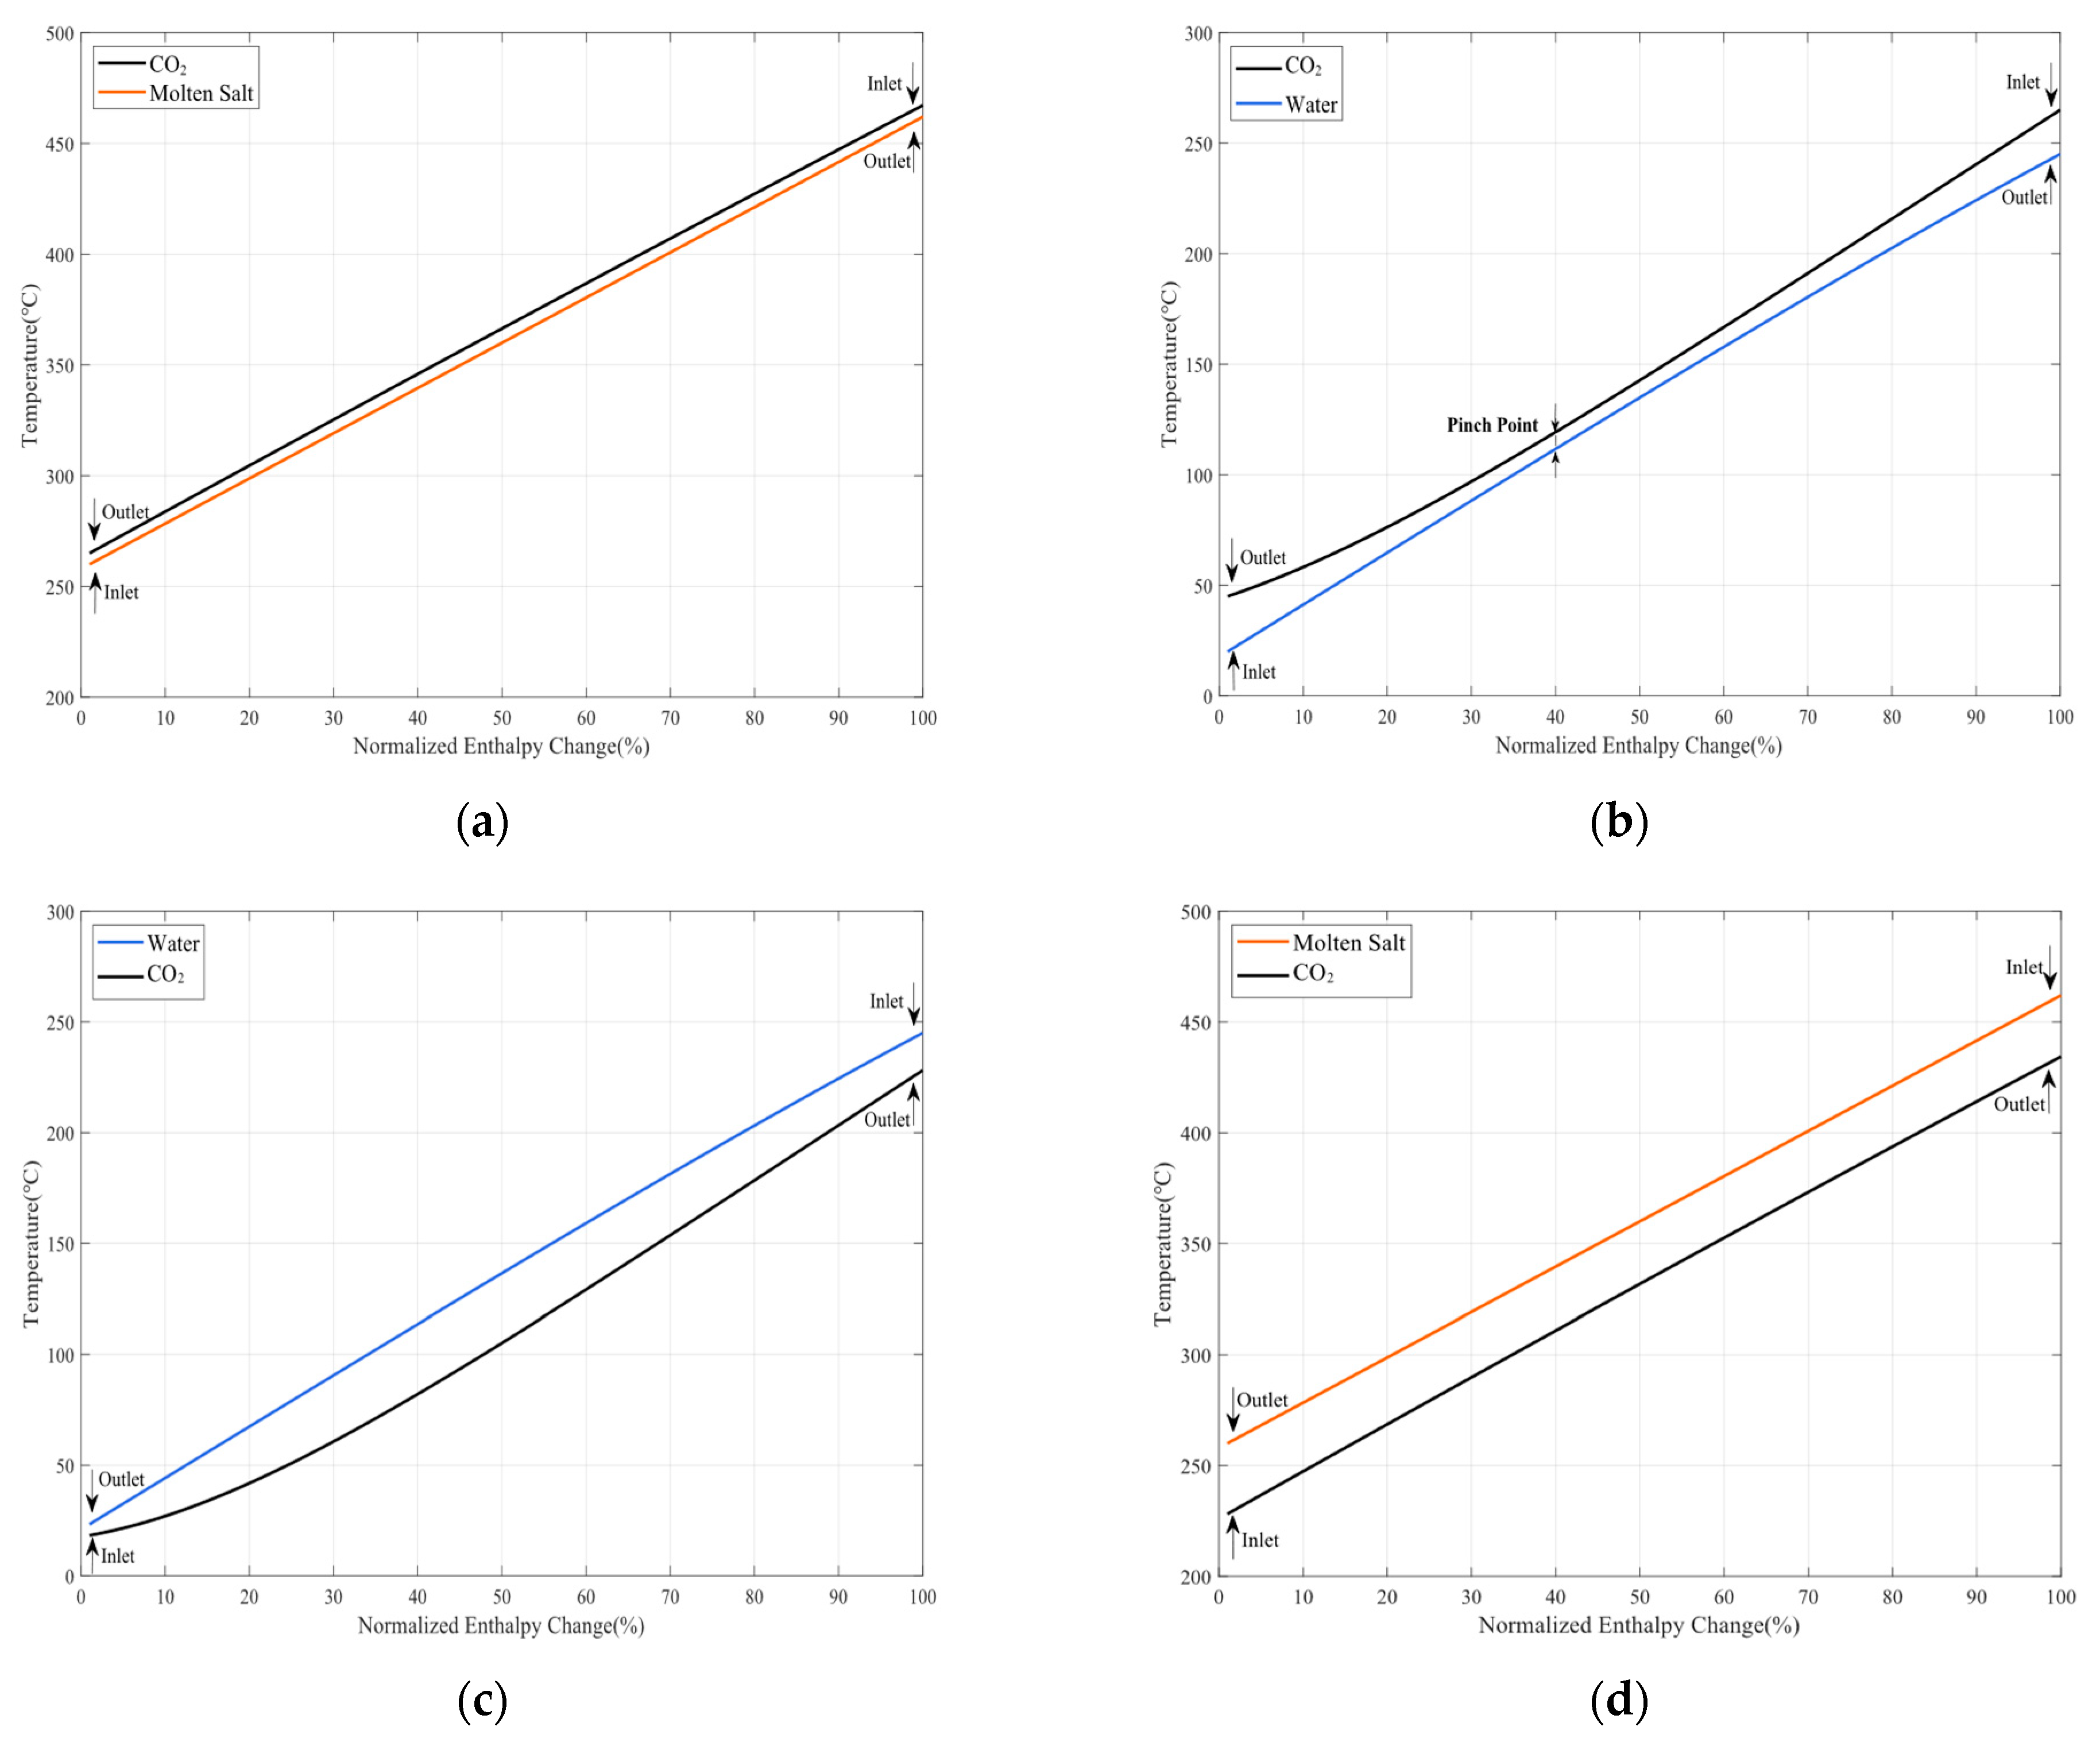
2 varies dramatically when the physical property is close to the critical point, and it remains roughly unchanged when the physical property is far from the critical point. The temperature of CO2 during the heat exchanging process has differing trends and it is necessary to assign two sets of TES units instead of only one set with a high terminal temperature difference. Based on a consideration of the temperature range, molten salt is selected in the high-temperature range for its sterling heat transfer performance, and water is selected in the middle-temperature range for its low cost.
The system energy charge process stores the pressure energy and the heat in different components. Carbon dioxide in the gas storage tank is of normal temperature and pressure, it is compressed to a high-temperature and high-pressure state during the energy storage period, and then it is liquefied and reserved in a liquid CO2 storage tank. Since the condensation temperature of CO2 is slightly higher than ambient temperature, the water with ambient temperature and pressure can be used to chill CO2. During the energy discharge period, liquid CO2 evaporates to gaseous CO2 by absorbing the heat from water with ambient temperature and pressure. Then, it enters the turbine to generate power, comes out in a normal state, and finally is reserved in the gas storage tank. The thermal energy produced during the energy charge period is reserved in the hot salt and the hot water tanks to increase the turbine power capability during the energy discharge period. Notably, the CO2 gas storage tank is flexible enough to keep pressure constant by changing its volume during the charging and discharging periods.
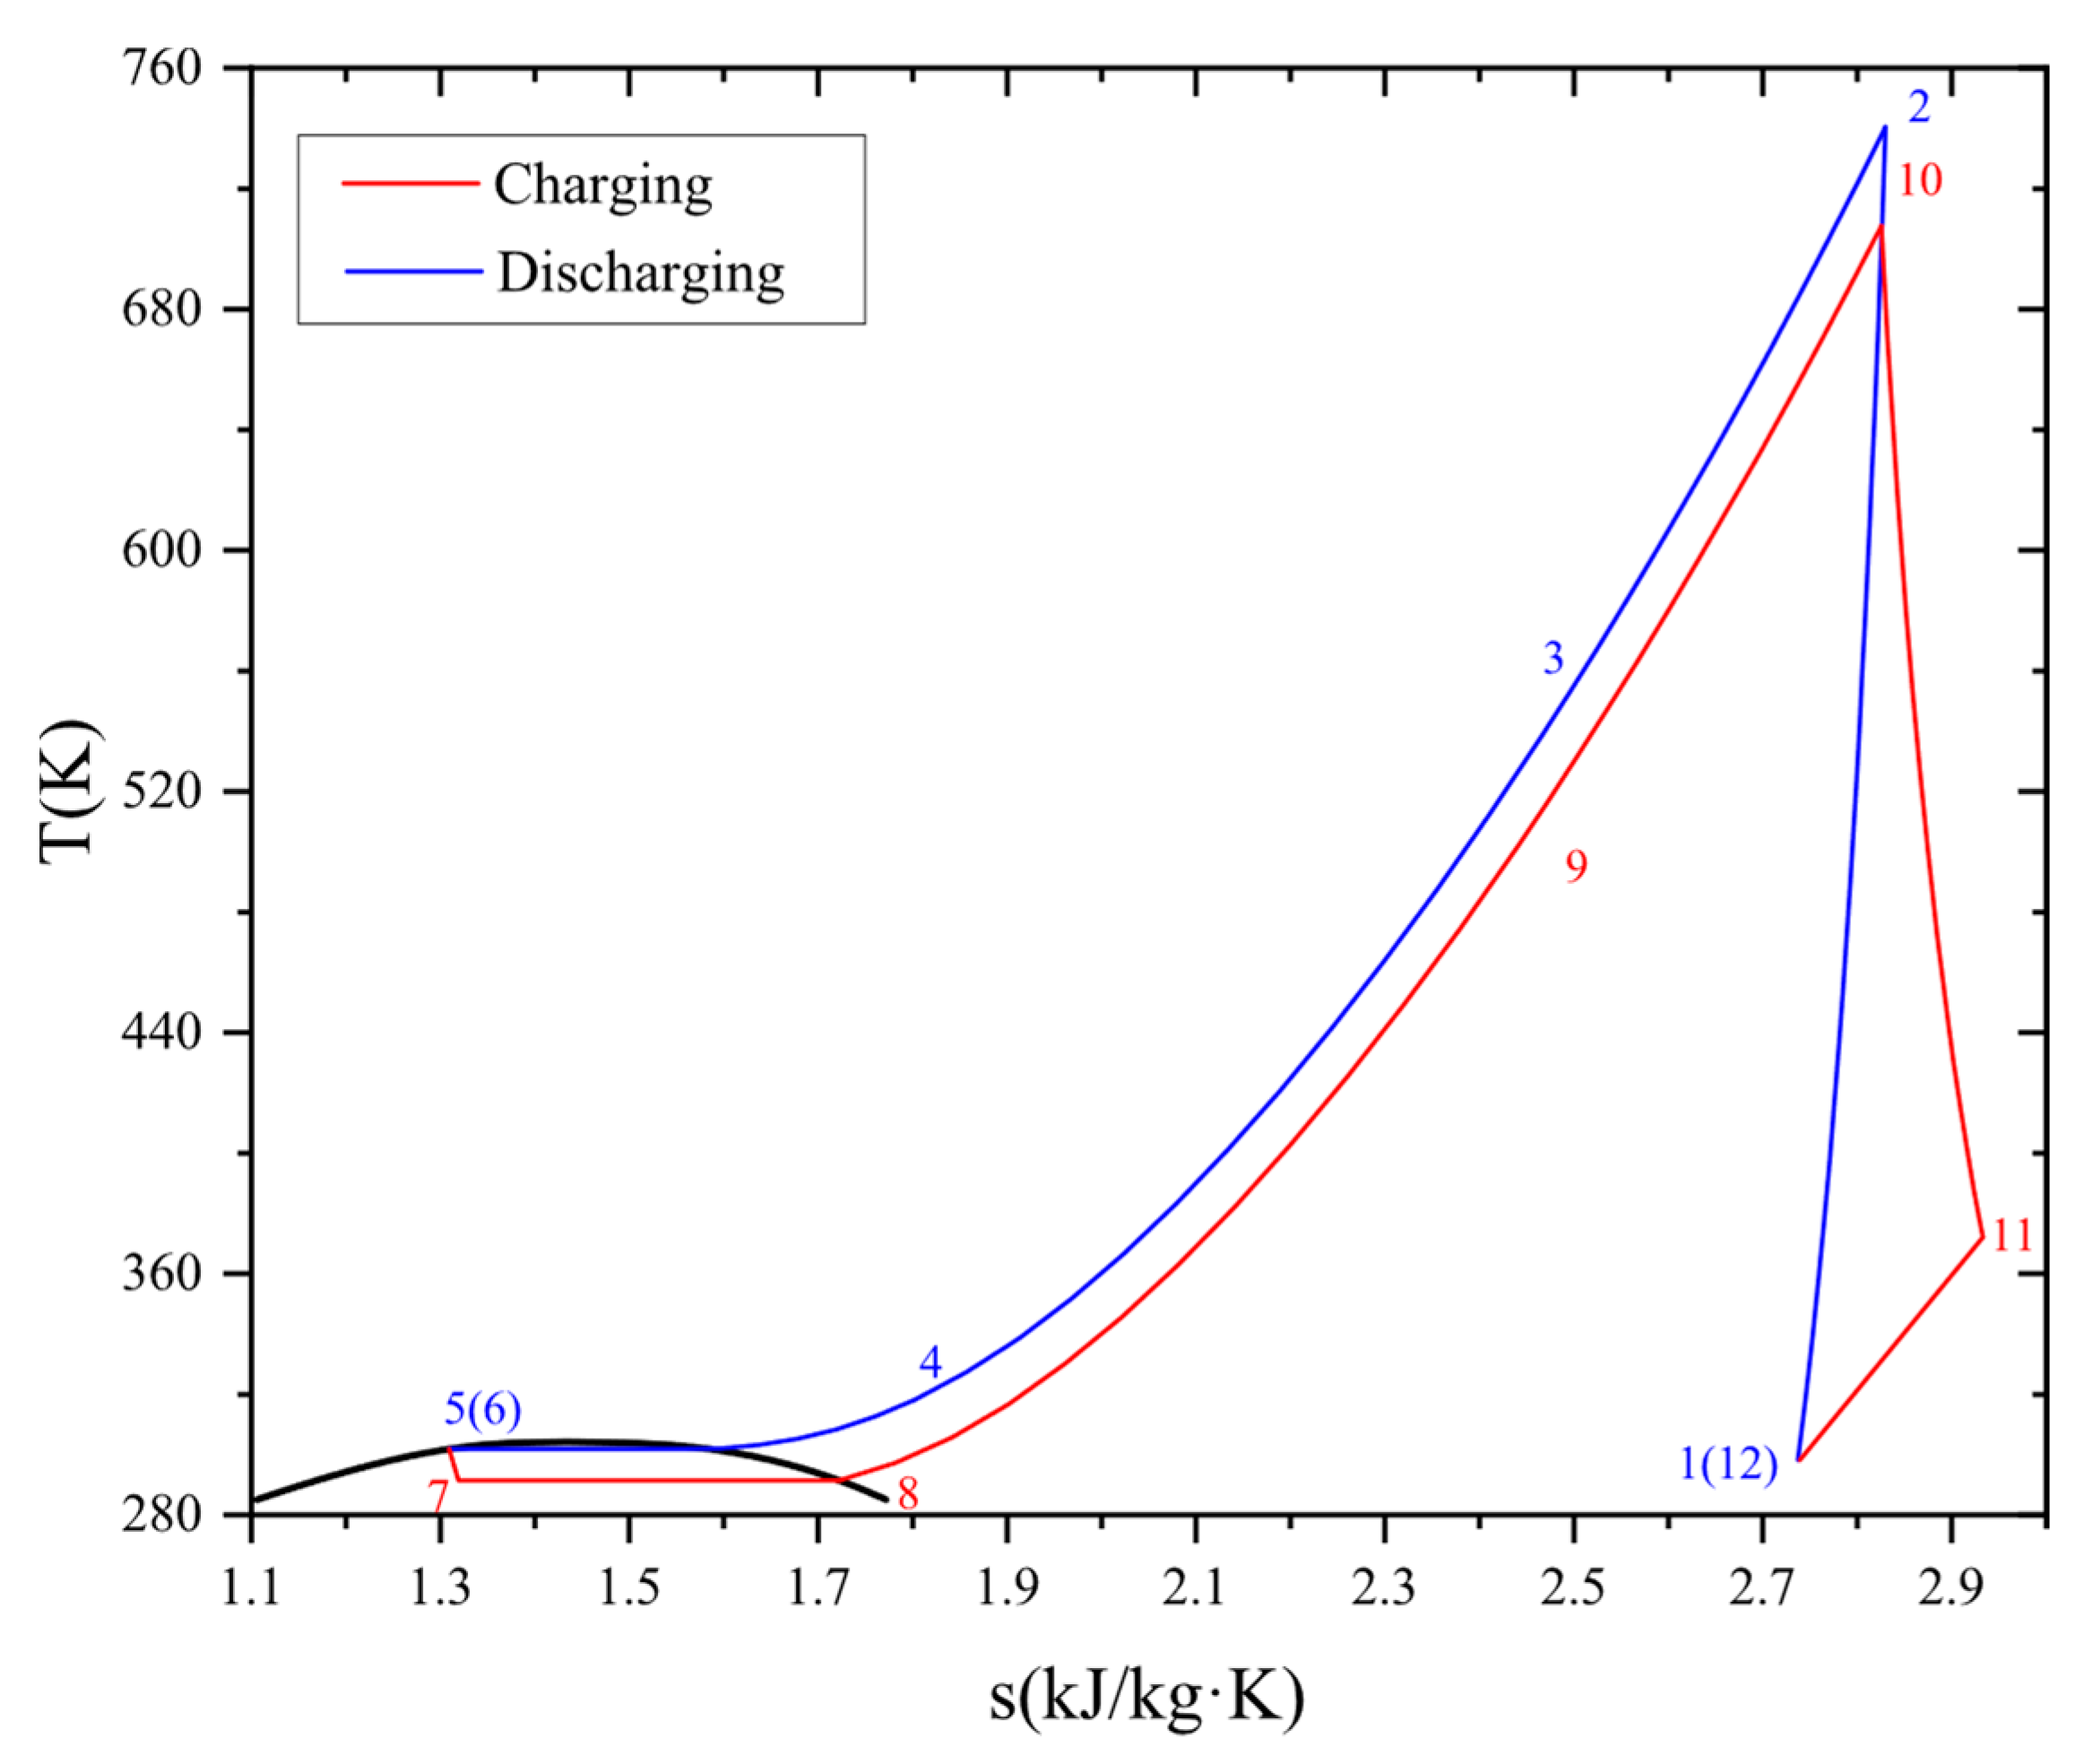
In this study, gaseous CO2 enters the compressor (1–2), the TES1, and the TES2 sequentially. CO2 with high temperature and pressure releases heat to the molten salt and cooling water (2–4) in the TES, then CO2 is further cooled to the liquid state during the condensation (4–5), and the liquid CO2 is reserved in the liquid storage tank, completing the energy charge process. In the energy discharge process, liquid CO2 expands into the gas–liquid two-phase state in the throttle (6–7), and then completely evaporates into a gaseous state through the evaporator (7–8). Gaseous CO2 absorbs heat from the TES3 and the TES4 (8–10), and then enters the turbine to output power (10–11). CO2 with low pressure is chilled by the environment (11–12) and finally reserved in the gas storage tank.
Figure 2 exhibits the temperature–entropy diagram of the system.

3. Mathematical Modeling

In order to facilitate the system numerical simulation, the following related basic hypotheses are given:
  • The system operates under stable working conditions, neglecting the kinetic and potential energy changes [38,39].
  • The pressure loss and the heat loss during the pipeline are ignored [40].
  • The minimum pinch temperature of the condenser and the heat exchanger is 3 °C, while the pinch temperature of the TES is set as 5 °C [41].
  • The inlet cooling water is in a normal state, and the amount of water is sufficient to ensure the water temperature remains constant during the condensation and the refrigeration.
  • Compressor and turbine isentropic efficiencies remain unchanged.

3.1. Energy Analysis

According to the hypotheses mentioned above and the energy conservation principles, a mathematical model is established for each component.
Compressor input power rate during the energy charge process is defined as:
W ˙ C = m ˙ CO 2 ( h 2 h 1 )
Compressor isentropic efficiency is defined as:
η C = h 2 s h 1 h 2 h 1
Turbine output power rate during the energy discharge process is defined as:
W ˙ T = m ˙ CO 2 ( h 10 h 11 )
Turbine isentropic efficiency is defined as:
η T = h 10 h 11 h 10 h 11 s
Molten salt and water are two system heat storage media, and the calculation for the heat exchanger is also divided into two types. The heat transfer rate of the CO2–molten salt heat exchanger is calculated as:
Q ˙ = m ˙ CO 2 Δ h CO 2 = m ˙ salt c salt Δ T salt
The heat transfer rate of the CO2–water heat exchanger is defined as:
Q ˙ = m ˙ CO 2 Δ h CO 2 = m ˙ water Δ h water
where m ˙ salt represents molten salt mass flow rate, c salt represents molten salt specific heat capacity, m ˙ water represents water mass flow.
The definition of the system energy storage efficiency is shown in Equation (7), equal to the total power output during the energy discharge period versus the total power input during the energy charge period.
η stor = W ˙ T t r W ˙ C t s
where t r denotes the energy release duration and t s denotes the energy storage duration.

3.2. Exergy Analysis

Exergy represents the part of energy that could be converted into useful power to the greatest extent. Exergy analysis is an important indicator to assess the system’s irreversible loss and the energy utilization. In this system, chemical exergy is ignored [42], and the exergy of each state point can be expressed as physical exergy [43]:
E ˙ = m ˙ [ ( h h 0 ) T 0 ( s s 0 ) ]
where the subscript 0 signifies a normal state.
The exergy destruction ( E ˙ D ) is defined as the energy that cannot be used for the inefficiency of each component, which can be represented by:
E ˙ D , k = E ˙ F , k E ˙ P , k
where the subscript k signifies the component, and subscripts F and P denote the fuel exergy and the product exergy of components.
The system exergy efficiency is as follows:
η ex = 1 E ˙ D , k W ˙ C

3.3. Exergoeconomic Analysis

Exergoeconomic analysis incorporates the exergy into the economic concepts to offer the exergetic costs of each stream and the system unit product, and it also reveals the methods to reduce the system product cost. The component investment costs ( Z k ) are shown in Table 1.
The exergoeconomic balance and the basic equations of the kth component are defined as [44]:
C ˙ o , k + C ˙ W , k = C ˙ i , k + C ˙ Q , k + Z ˙ k
C ˙ k = c k E ˙ k
c F , k = C ˙ F , k E ˙ F , k
c P , k = C ˙ P , k E ˙ P , k
C ˙ D , k = c F , k E ˙ D , k
where indexes i and o denote the input and the output stream, subscripts W and Q denote the output power and the input heat energy, where C ˙ and c are the exergetic cost rate of each stream and per unit stream, where c F , k and c P , k are the average cost rate per unit fuel and product of the kth component, where C ˙ D , k is the exergetic loss cost rate of the kth component.
The investment cost rate of components can be acquired by [44]:
Z ˙ k = φ C R F N Z k
where φ means the maintenance factor, and N means the annual running hours.
C R F denotes the capital recovery factor, which is given in Equation (17), where i and n represent the interest rate and the system life span [45].
C R F = i ( i + 1 ) n ( i + 1 ) n 1
The exergoeconomic performance criteria are the exergoeconomic factor ( f k ) and the relative cost difference rate ( r k ) for the kth component, and the system unit cost per product ( c P , t o t ). f k represents the investment cost proportion of operation cost for system components, revealing that the kth component has either high investment cost or low efficiency. It is defined as [36,45]:
f k = Z ˙ k Z ˙ k + C ˙ D , k
r k reveals the exergetic cost difference between the fuel and the product, and the lower value is preferred. It could be acquired by [46]:
r k = c P , k c F , k c F , k
c P , t o t represents the system total exergy cost per unit product and it is defined as [37]:
c P , t o t = Z ˙ k + C ˙ W , c W ˙ T
where C ˙ W , c is the exergetic cost rate of compressor input power.
Since the capital investment costs are cited at the reference year, all of them should be updated to 2023 by the use of the cost indicator, which can be found in the Chemical Engineering Plant Cost Index (CEPCI), and the specific function is shown as [38]:
Z 2023 = Z origin ( C E P C I 2023 / C E P C I origin )
The values of the related parameters for the functions above are shown in Table 2. The detailed exergoeconomic balance functions and the auxiliary equations of each component are shown in Table 3.
Table 1. Investment cost of each system component [22,45,47,48,49,50,51].
ComponentInvestment Cost/USDOriginal YearCEPCI
Compressor 71.1 m ˙ C 0.9 η C P e P i l n P e P i 1996381.7
Turbine 479.34 m ˙ T 0.92 η T l n P i P e ( 1 + e x p ( 0.036 T i 54.4 ) ) 1996381.7
Heat exchangers Z ref A 100 0.6 2000394.1
Valve 114.5 m ˙ v a l 2000394.1
Thermal storage tanks 600 V tan k 0.78 + 8000 2009521.9
GST/LST 4042 V tan k 0.506 2013567.3

3.4. Multi-Objective Optimization

In engineering and scientific research, there are a large number of problems that need to be optimized and solved for more than one target at the same time, which is defined as multi-objective optimization. The optimal solution of a multi-objective optimization problem is often not unique, and the relationship between multiple optimization objectives is often conflicting, which means the optimal solutions of each objective cannot be obtained at the same time and the solutions are non-dominated for each other. To acquire the non-dominated solution, which is also defined as the Pareto frontier solution, the multi-objective optimization is carried out by using the nondominated sorting genetic algorithm-II (NSGA-II) method, first proposed by Deb et al. [53]. NSGA-II is developed on NSGA and has been enhanced by decreasing the computation complexity of the nondominated sorting, reserving the parent elites, and proposing the crowded-comparison operator to ensure the diversity in the population. According to the reference, the corresponding optimization objectives in this paper are the system energy storage efficiency ( η s t o r ) and the unit power product cost ( c P , t o t ), and the optimization issues can be described as follows:
M a x ( η s t o r ( x ) ) M i n   ( c P , t o t ( x ) )
x = [ P l i q , P e v a p , η C , η T , Δ d T 1 , Δ d T 2 ] T
x [ L , U ]
x is the variable vector for the optimization problem. P l i q refers to the liquid CO2 pressure, η C and η T are the compressor isentropic efficiency and turbine isentropic efficiency, P e v a p represents CO2 evaporation pressure, Δ d T 1 and Δ d T 2 are the hot terminal temperature difference and cold terminal temperature difference in the TES2.
The variation range of x is limited to the ceiling and floor array, while L means the minimum values and U means the maximum values.

4. Model Validation

Table 4 shows the model validation with the related data provided by Tang et al. [54]. The reference report selected different CO2-based mixtures as the energy storage working medium and the CO2–propane mixture had the highest round-trip efficiency. It also used therminol-66 oil as the thermal storage medium, which absorbed the heat from bypass steam in the thermal power plant and transmitted the heat to a CO2-based mixture during the energy release period. The verification results indicate that the mathematical model established by the proposed system fits the reference literature well.

5. Results and Analysis

In this part, the thermodynamic and the exergoeconomic studies are conducted. And the parametric analyses based on the energy, exergy, and economy are performed for further understanding. After that, the multi-objective optimization on the basis of NSGA-II genetic algorithms is completed. Finally, the comparison of the proposed system and previous studies is applied.
To calculate the above system, MATLAB R2022a software is used in this paper to establish the system simulation program, and the thermophysical attribute of the working medium is acquired by the REFPROP9.1 database provided by NIST [51]. The molten salt is selected as the widely used Solar Salt (60% NaNO3 + 40% KNO3), and its physical properties (specific heat capacity, density, etc.) can be obtained from the literature [55]. Table 5 shows the system parameter settings under typical operating conditions.

5.1. Results under Typical Conditions

Due to the physical property changes of CO2, it is necessary to consider the pinch point in each heat exchanger. Figure 3 clearly shows the temperature profiles of both the hot side and the cold side in the TES. As to water and molten salt, their specific heat capacities change slightly and the temperatures show linear variations. For CO2, the specific heat capacity rises intensely and the temperature varies smoothly when CO2 approaches the critical point. In the TES1 and TES2, CO2 releases the heat with a constant pressure of 7.0 MPa, and the maximum specific heat capacity occurs at 29 °C. Thus, the decrease in temperature in the TES2 narrows during the heat transfer process and the pinch point appears in the middle position of the heat exchanger. And the temperature of CO2 in the TES1 shows an approximately linear change, as the temperature is far from 29 °C, and the minimum temperature difference (pinch point) appears in the hot terminal. In the TES3 and TES4, CO2 absorbs the heat with a constant pressure of 5.5 MPa, and the maximum specific heat capacity occurs at 18 °C. Hence, the temperature of CO2 in the TES3 shows a similar variation in the TES2, and the pinch point occurs in the cold terminal. In the TES4, the temperature of CO2 shows a linear change for the same reason in the TES2, and the pinch point also occurs in the hot terminal. Above all, CO2 has a different variation trend during distinct temperature ranges, indicating that two sets of heat transferring units are necessary to diminish the temperature difference in the heat exchangers. Therefore, molten salt is used in the high-temperature range and water is used in the middle-temperature range.
Table 6 demonstrates the thermodynamic and the exergoeconomic values of system state points under typical operation. Table 7 clearly lists the exergy and exergoeconomic results of system components under typical conditions, while Figure 4 presents the E ˙ D ratio of system components. It is clear that the E ˙ D proportions of the turbine and the compressor are the highest, representing 34.19% and 28.43%, respectively. It is mainly due to the large pressure drops of the power components, which cause high irreversible losses during CO2 flow. Large exergy destructions occur in the cooler, TES3, TES2, TES4, and condenser, with values of about 11.19%, 9.97%, 4.67%, 4.27%, and 2.24%, respectively. For the TES3, its specific heat capacity varies greatly during the heat exchange, since the inlet state of the cold fluid is close to the critical state, resulting in the large changes in temperature difference between the cold and hot fluid ( Δ T ), and E ˙ D is increased accordingly. For the TES1, the E ˙ D proportion is the smallest and the value is about 0.87%. It is because of the fact that Δ T , during the flowing process, is kept in a low range.
Figure 5 shows the operation cost ( Z ˙ k + C ˙ D , k ) of each system component. The operation cost ( Z ˙ k + C ˙ D , k ) reveals the improvement order of system components from the exergoeconomic perspective. It is clear that large Z ˙ k + C ˙ D , k mainly occurs in the compressor and the turbine, which have the greatest impacts on the system exergoeconomic performance, with a total proportion of 84.3%. The compressor has the highest Z ˙ k + C ˙ D , k , which reaches USD 508.76/h, accounting for 58.5% of the total system operation cost. And it also has a high f k (88.68%) for great capital investment, which means decreasing the investment cost of the compressor at the expense of its isentropic efficiency, which could lower its operation cost effectively. After the compressor, the turbine has a non-negligible Z ˙ k + C ˙ D , k (25.7%), and its investment cost accounts for 27.92% of its operation cost. It implies that the exergy destruction of the turbine has a bigger impact on its operation cost, and improving its isentropic efficiency at the cost of its investment cost should be selected. The third largest operation cost appears in the TES3 (USD 51.41/h); thus, the heat transfer efficiency should be improved to lower its operation cost at the cost of higher investment. Although the cooler has a large value of r k , it has the little influence on the system exergoeconomic performance for its low operation cost. The TES3, compressor, and turbine have both high r k and Z ˙ k + C ˙ D , k , which means that lowering their Z ˙ k + C ˙ D , k could improve the system exergoeconomic performance notably.
Table 8 shows the system calculation results of main performances under typical conditions. It is found that the input power needs to reach 14.08 MW for a 10.00 MW system, and the energy storage efficiency reaches 71.04%. Meanwhile, the system total exergy efficiency achieves 71.21%, and the system cost per unit product is USD 40.03·GJ−1.

5.2. Parametric Study Based on Thermodynamics and Exergoeconomics

The system is equipped with some devices, such as the liquid storage tank, the compressor, and the turbine. And the liquid CO2 pressure ( P l i q ), compressor and turbine isentropic efficiencies ( η C , η T ), and CO2 evaporation pressure ( P e v a p ) are selected as main system variables, and their influences on the system energy storage efficiency ( η s t o r ) and the unit power product cost ( c P , t o t ) are calculated and analyzed. Table 9 shows the ranges of key variables [54,58].
Figure 6 and Figure 7 show the changes of the CO2 mass flow rate ( M CO 2 ), system total input ( W ˙ C ), system energy storage efficiency ( η s t o r ), and unit power product cost ( c P , t o t ) under valid P l i q , respectively. It is clear that M CO 2 and W ˙ C both decrease linearly with the increase in P l i q , while η s t o r and c P , t o t both have opposite change with the increase in P l i q . The compressor input power per unit working medium rises with the increase in P l i q , while the turbine output power per unit working medium also rises for higher inlet temperature, which is improved by the greater compression heat. Because the increase in unit turbine power is slightly higher than unit compressor power, η s t o r is improved under the combined influences. Also, M CO 2 decreases while the system total output power remains at 10 MW, leading to the decline in W ˙ C with the rise in P l i q . Meanwhile, the rise in P l i q could also induce higher wall thickness and investment cost of high-pressure components; hence, c P , t o t is increased to some extent.
Figure 8 and Figure 9 exhibit the changes of the CO2 mass flow rate ( M CO 2 ), system total input ( W ˙ C ), system energy storage efficiency ( η s t o r ), and unit power product cost ( c P , t o t ) under valid η C , respectively. η C is the main index to measure the compressor performance, and the increase in η C represents the decrease in the unit power consumption per CO2 under the same condition. The increase in η C causes the decrease in the compressor export temperature as well, and the heat reserved in the hot salt tank and the hot water tank decrease correspondingly. Thus, the turbine inlet temperature drops, and the unit output power generated during the energy release process also goes down. Thus, M CO 2 would rise with a constant W ˙ T . With the increase in η C , the decrease extent of the compressor unit power is higher than the changes of the turbine unit power, resulting in the increase in η s t o r and the decrease in W ˙ C . Furthermore, the lower compressor export temperature brings down the heat transfer rate and the high-temperature resistance requirement of the TES1, TES4, and HST, inducing the decrease in the investments of the above components. Therefore, c P , t o t maintains a prominent upward tendency due to the co-influence.
Figure 10 presents the changes of η s t o r and c P , t o t with the changes of η T . It could be seen that η s t o r increases with the increase in η T , while c P , t o t shows the U curve trace. The change of η T will not affect the energy storage process, and the compressor input power and the heat recovered in the system energy storage process remain unchanged. When η T increases, the unit mass CO2 with unchanged import parameters generates more power during the expansion process, making η s t o r demonstrate a rising trend. For c P , t o t , the investment cost of the turbine rises with the increase in η T , whereas the investment costs of other system components decrease with lower M CO 2 . Because the investment cost proportion of the turbine is large, c P , t o t declines first and then increases with the increase in η T .
Figure 11 exhibits the changes of η s t o r and c P , t o t with changed P e v a p . η s t o r reveals a tendency of first rising and then decreasing with the increase in P e v a p , and there is an optimal evaporation pressure point enabling the highest η s t o r . c P , t o t declines a little and then increases with the increase in P e v a p , and the change extent is negligible. The reason is as follows. CO2 with lower pressure could be heated to a higher temperature for unchanged compression heat. Thus, the increase in P e v a p induces the improvement of the turbine import pressure and the decrease in the turbine import temperature. The turbine power generation capacity falls with the decline in its inlet pressure, and rises with the increase in the turbine import temperature when other conditions remain unchanged. Therefore, the turbine unit power rises first and then drops with the effects of two factors, which leads to the above changing trend of η s t o r . Meanwhile, the increase in P e v a p not only changes M CO 2 , which has a significant impact on the investment cost, but also increases the requirement of the wall thickness, pressure resistance, and sealing properties of high-pressure components. Therefore, c P , t o t shows the U curve trace with the increase in P e v a p .
The following analyses examine the influences of key parameters on the system exergy efficiency ( η e x ) and the exergy destruction of each component.
Figure 12 exhibits the changes of η e x and the exergy loss for system components with valid P l i q , and η e x increases with the increase in P l i q . The specific analyses of each component are as follows. For the compressor, the unit exergy loss per CO2 rises because of the increase in the pressure ratio, but the total exergy destruction of the compressor drops with the decrease in M CO 2 ; for the TES1, Δ T rises with the increase in hot terminal temperature, causing the growth of its exergy loss; for the TES2, the specific heat capacity of CO2 from the inlet section is more sensitive to the pressure, and it increases when P l i q rises. Therefore, Δ T in the inlet section comes down correspondingly, causing a decrease in the exergy loss; for the condenser, the exergy loss increases with the decrease in the heat transfer efficiency; for the throttle valve, the pressure drop increases and the exergy loss increases; for the evaporator, due to the increase in CO2 inlet enthalpy, the heat transfer rate and the mass flow rate of the hot working medium both decrease, resulting in the decrease in the exergy loss; for the TES3 and TES4, they have the same tendency as the TES2 and TES1, respectively; for the turbine, due to the increase in the import temperature, the power generation capacity increases and the exergy loss decreases under the same inlet and outlet pressure; for the cooler, the exergy loss increases with the increase in Δ T .
Figure 13 exhibits the changes of η e x , E ˙ D , and exergy destructions of related components with valid η C . η e x rises with the increase in η C . It is because W ˙ C and E ˙ D both decrease with the increase in η C ; thus, η e x increases under the comprehensive effects. The specific analyses of the relevant components are as follows. For the compressor, the exergy loss decreases due to the increase in the power generation capacity; for the TES1 and TES4, the heat transfer rate decreases owing to the decrease in the outlet temperature during CO2 compression, and thus, the exergy loss decreases; for the turbine, due to the drop in the inlet temperature, its unit power generation capacity decreases and the exergy loss increases; for the cooler, the exergy loss decreases due to the drop in the inlet temperature; for other components, the exergy loss increases with the increase in M CO 2 .
Figure 14 presents the changes of η e x and E ˙ D with valid η T . η e x increases with the increase in η T , while the system total exergy loss slumps with the decrease in M CO 2 .
Figure 15 shows the changes of η e x , E ˙ D , and exergy destructions of related components with valid P e v a p . η e x climbs first and then drops with the increase in P e v a p . Since the increase in P e v a p does not affect the energy storage process, E ˙ D of components in the charging process decreases first and then rises with the same tendency of M CO 2 . During the energy release process, E ˙ D of the throttle valve decreases with the increase in P e v a p , while the temperature difference in the evaporator decreases, and the exergy loss decreases as a result of the increase in CO2 evaporation temperature. For the TES3, Δ T increases on account of the increase in CO2 specific heat capacity, and then the exergy loss rises. For the TES4, the unit heat exchange remains unchanged and the terminal temperature difference increases because of the decrease in CO2 inlet and outlet temperature; thus, the exergy loss increases. For the turbine, the flow loss and the power generation capacity both decrease because of the decrease in inlet temperature and the increase in inlet pressure; thus, the exergy loss rises. For the cooler, the exergy loss decreases with the decrease in Δ T .

5.3. System Optimization and Comparison

In this study, η s t o r and c P , t o t are selected as the optimization objectives, and the liquid CO2 pressure, as well as compressor and turbine isentropic efficiencies, and CO2 evaporation pressure are selected as the key parameters. To obtain the system maximum η s t o r and the minimum c P , t o t at certain weights, the NSGA-II genetic algorithm method [37] is used to optimize system key variables. The parametric boundaries are listed in Table 10, which adds terminal temperature differences in the heat exchangers to minimize the pinch point to 5 with other varied key parameters. Since the performance of the algorithm relies on the iteration times and the population size, and the mutation factor and crossover factor determine the diversity of the new generation, we have used different parameter values to compare the performances, and the final parametric settings of NSGA-II are shown in Table 11. Table 12 exhibits the algorithm optimization result.
The calculation results of the system performance corresponding to the optimal parameters are listed in Table 13, and η s t o r reaches 75.30%, while c P , t o t reaches USD 41.17·GJ−1. Figure 16 shows the Pareto frontier distribution, which is composed of non-dominated solutions. According to Figure 16, c P , t o t rises with the increase in η s t o r , meaning that a compromise exists between c P , t o t and η s t o r . The ideal point has the maximum energy storage efficiency and the minimum system unit product cost, while the non-ideal point has the minimum energy storage efficiency and the maximum system unit product cost. The optimal solution occurs at point A, from which the distance to the ideal point is minimal [44].
Table 14 gives the optimal operating parameters of eight kinds of energy storage technologies in the literature, and they can be mainly divided into five kinds, including CAES, AA-CAES, LCES, TC-CCES, and SC-CCES. Table 14 also lists some new ESSs grounded on the TC-CCES and SC-CCES technologies, including a trough solar heat storage trans-critical compressed CO2 energy storage (STC-CCES), a trough solar heat storage supercritical compressed CO2 energy storage (SSC-CCES), a trans-critical compressed CO2 energy storage system combined heat pump (TCES-HP).
Table 15 gives the optimization values of η s t o r , corresponding to the above eight energy storage technologies. It could be seen that η s t o r of the proposed system is higher than that of other seven ESS technologies and close to the STC-CCES system, indicating that the proposed system has great development potential and research value.

6. Conclusions

This paper puts forward a novel ESS based on the compressed CO2 phase-change system. The system performance is calculated and analyzed first, then the parametric study is conducted and the multi-objective optimization is finally applied. The primary conclusions are below:
  • Under the basic operation condition, the system energy storage efficiency, the unit product cost, and the system exergy efficiency can reach 71.04%, USD 40.03/GJ, and 71.21%, respectively. The optimization sequence of system components is confirmed by the Z ˙ k + C ˙ D , k : the compressor, turbine, TES3, TES2, TES4, evaporator, condenser, throttle valve, TES1, cooler. For the compressor and the turbine, they have unignorable proportions in Z ˙ k + C ˙ D , k of 58.6% and 25.7%, indicating that decreasing the investment cost of the compressor and improving the isentropic efficiency of the turbine can greatly reduce the system total operation cost.
  • Increasing P l i q and η C is conducive to improving the system energy storage efficiency, while the system unit product cost has the opposite change. For η T , the system energy storage efficiency rises with its increase, and the system unit product cost demonstrates a U curve trend. When increasing P e v a p , the system energy efficiency demonstrates a tendency of rising firstly and then going down, while the system unit product cost presents the reverse tendency. Referring to the above regulation, the system energy storage efficiency and the system unit product cost have a trade-off under four varied parameters. Meanwhile, increasing P l i q , η T , and η C is conducive to improving the system exergy efficiency, and P e v a p has the optimal point to improve the system exergy performance. In addition, η C and η T have the most important impact on the system exergy efficiency.
  • The system energy storage efficiency and the system unit product cost can reach 75.30% and USD 41.17/GJ with optimal key parameters, respectively. Compared with the CAES (where the energy storage efficiency is 60.65%), AA-CAES (where the energy storage efficiency is 67.22%), LCES (where the energy storage efficiency is 56.64%), TC-CCES (where the energy storage efficiency is 60.69%), SC-CCES (where the energy storage efficiency is 73.02%), SSC-CCES (where the energy storage efficiency is 67.72%), STC-CCES (where the energy storage efficiency is 77.75%), and TCES-HP (where the energy storage efficiency is 66%), the phase-change energy storage system in this paper has great superiority in terms of system energy storage efficiency.
The new compressed CO2 phase-change energy storage system has good application prospects due to its advantages of high system energy storage efficiency, low investment and operation cost, and flexible and stable operation conditions. At present, the compressed CO2 phase-change energy storage system is at the initial stage of system design and thermodynamic and exergoeconomic study. Future research work will start from further system performance analysis, such as advanced exergy analysis, design and analysis of system components, and performance analysis under off-design conditions. After the system theoretical analysis, the practical applications of the system, such as combining it with renewable power generation, will be studied.

Author Contributions

Conceptualization and investigation, S.L., D.W., D.Z. and Y.X.; Data curation, S.L.; Methodology, S.L. and D.W.; Writing—original draft preparation, S.L.; Writing—Review and Editing, S.L., D.W. and D.Z.; Resources, Y.X.; Validation, Y.X. All authors have read and agreed to the published version of the manuscript.

Funding

The work was fully supported by University Joint Program of Shaanxi Province Key Research Project-Major Project (2022GXLH-01-17).

Institutional Review Board Statement

Not applicable.

Informed Consent Statement

Not applicable.

Data Availability Statement

The original contributions presented in the study are included in the article, further inquiries can be directed to the corresponding author.

Conflicts of Interest

The authors declare no conflicts of interest.

Nomenclature

Aheat transfer area (m2)
cspecific heat capacity (kJ/(kg·K)−1)
E ˙ exergy flow rate (kW)
especific exergy (kJ/kg−1)
hspecific enthalpy (kJ/kg−1)
m ˙ mass flow rate (kg/s−1)
Ppressure (MPa)
Q ˙ heat transfer rate (kW)
sspecific entropy (kJ/(kg·K)−1)
Ttemperature (°C)
Vvolume (m3)
Uheat transfer coefficient (W/(m2·K)−1)
W ˙ power (kW)
Greek Symbols
η efficiency (%)
Δ T temperature difference (°C)
Subscripts
0ambient state
1,2, et al.state points
Ccompressor
Ddestruction
exexergy
iinlet side
kcomponent
liqliquid
ooutlet side
sisentropic
storstorage
Tturbine
Abbreviations
ESSenergy storage system
CAEScompressed air energy storage
PHSpumped hydro energy storage
AA-CAESadvanced adiabatic compressed air energy storage
LAEScompressed liquid air energy storage
ICAESisothermal compressed air energy storage
CCEScompressed carbon dioxide energy storage
TC-CCEStrans-critical carbon dioxide energy storage
SC-CCESsupercritical carbon dioxide energy storage
TESthermal energy storage
LCEScompressed liquid carbon dioxide energy storage
PC-CCEScarbon dioxide phase-change energy storage
SSC-CCEStrough solar heat storage supercritical compressed CO2 energy storage
STC-CCEStrough solar heat storage trans-critical compressed CO2 energy storage
TCES-HPtrans-critical compressed CO2 energy storage system combined heat pump
Ccompressor
Condcondenser
CSTcold salt tank
CWTcold water tank
Evapevaporator
Ffuel
GSTgas storage tank
HSThot salt tank
HWThot water tank
hothot end
Lliquid storage tank
Pproduct
Tturbine
TESthermal energy storage

References

  1. Lu, L.C.; Wang, K.; He, Q. Thermodynamic analysis of a novel isothermal compressed carbon dioxide energy storage system. J. Energy Storage 2023, 61, 106826. [Google Scholar] [CrossRef]
  2. Yao, E.R.; Wang, H.R.; Liu, L.; Xi, G. A Novel Constant-Pressure Pumped Hydro Combined with Compressed Air Energy Storage System. Energies 2014, 8, 154–171. [Google Scholar] [CrossRef]
  3. Amoussou, I.; Tanyi, E.; Ali, A.; Agajie, T.F.; Khan, B.; Ballester, J.B.; Nsanyuy, W.B. Optimal Modeling and Feasibility Analysis of Grid-Interfaced Solar PV/Wind/Pumped Hydro Energy Storage Based Hybrid System. Sustainability 2023, 15, 1222. [Google Scholar] [CrossRef]
  4. Arnaoutakis, G.E.; Kefala, G.; Dakanali, E.; Katsaprakakis, D.A. Combined Operation of Wind-Pumped Hydro Storage Plant with a Concentrating Solar Power Plant for Insular Systems: A Case Study for the Island of Rhodes. Energies 2022, 15, 6822. [Google Scholar] [CrossRef]
  5. Katsaprakakis, D.A.; Dakanali, I.; Condaxakis, C.; Christakis, D.G. Comparing electricity storage technologies for small insular grids. Appl. Energy 2019, 251, 113332. [Google Scholar] [CrossRef]
  6. Hassan, N. Catalytic performance of nanostructured materials recently used for developing fuel cells’ electrodes. Int. J. Hydrog. Energy 2021, 46, 39315–39368. [Google Scholar] [CrossRef]
  7. Sharma, A.; Tyagi, V.V.; Chen, C.R.; Buddhi, D. Review on thermal energy storage with phase change materials and applications. Renew. Sustain. Energy Rev. 2009, 13, 318–345. [Google Scholar] [CrossRef]
  8. Tagle-Salazar, P.D.; Prieto, C.; López-Román, A.; Cabeza, L.F. A transient heat losses model for two-tank storage systems with molten salts. Renew. Energy 2023, 219, 119371. [Google Scholar] [CrossRef]
  9. Okogeri, O.; Stathopoulos, V.N. What about greener phase change materials? A review on biobased phase change materials for thermal energy storage applications. Int. J. Thermofluids 2021, 10, 100081. [Google Scholar] [CrossRef]
  10. Mukherjee, S.S.; Meshram, H.A.; Rakshit, D.; Saha, B.B. A comparative study of sensible energy storage and hydrogen energy storage apropos to a concentrated solar thermal power plant. J. Energy Storage 2023, 61, 106629. [Google Scholar] [CrossRef]
  11. Koçak, B.; Fernandez, A.I.; Paksoy, H. Review on sensible thermal energy storage for industrial solar applications and sustainability aspects. Sol. Energy 2020, 209, 135–169. [Google Scholar] [CrossRef]
  12. Gao, Y.N.; He, F.; Xu, T.; Meng, X.; Zhang, M.; Yan, L.Y.; Gao, W.J. Thermal performance analysis of sensible and latent heat thermal energy storage tanks: A contrastive experiment. J. Build. Eng. 2020, 32, 101713. [Google Scholar] [CrossRef]
  13. Ortega-Fernández, I.; Zavattoni, S.A.; Rodríguez-Aseguinolaza, J.; D’Aguanno, B.; Barbato, M.C. Analysis of an integrated packed bed thermal energy storage system for heat recovery in compressed air energy storage technology. Appl. Energy 2017, 205, 280–293. [Google Scholar] [CrossRef]
  14. Chaychizadeh, F.; Dehghandorost, H.; Aliabadi, A.; Taklifi, A. Stochastic dynamic simulation of a novel hybrid thermal-compressed carbon dioxide energy storage system (T-CCES) integrated with a wind farm. Energy Convers. Manag. 2018, 166, 500–511. [Google Scholar] [CrossRef]
  15. Xia, C.C.; Xu, Y.J.; Zhou, S.W.; Qin, S.K.; He, X.H. Fracture initiation and propagation in the lined underground caverns for compressed air energy storage: Coupled thermo-mechanical phase-field modeling. Comput. Geotech. 2023, 157, 105329. [Google Scholar] [CrossRef]
  16. Camargos, T.P.L.; Pottie, D.L.F.; Ferreira, R.A.M.; Maia, T.A.C.; Porto, M.P. Experimental study of a PH-CAES system: Proof of concept. Energy 2018, 165, 630–638. [Google Scholar] [CrossRef]
  17. He, Q.; Li, G.Q.; Lu, C.; Du, D.M.; Liu, W.Y. A compressed air energy storage system with variable pressure ratio and its operation control. Energy 2019, 169, 881–894. [Google Scholar] [CrossRef]
  18. Li, Y.W.; Miao, S.H.; Zhang, S.X.; Yin, B.X.; Luo, X.; Dooner, M.; Wang, J.H. A reserve capacity model of AA-CAES for power system optimal joint energy and reserve scheduling. Int. J. Electr. Power Energy Syst. 2019, 104, 279–290. [Google Scholar] [CrossRef]
  19. Guizzi, G.L.; Manno, M.; Tolomei, L.M.; Vitali, R.M. Thermodynamic analysis of a liquid air energy storage system. Energy 2015, 93, 1639–1647. [Google Scholar] [CrossRef]
  20. Luo, X.; Wang, J.H.; Dooner, M.; Clarke, J.; Krupke, C. Overview of Current Development in Compressed Air Energy Storage Technology. Energy Procedia 2014, 62, 603–611. [Google Scholar] [CrossRef]
  21. Hameer, S.; van Niekerk, J.L. A review of large-scale electrical energy storage. Int. J. Energy Res. 2015, 39, 1179–1195. [Google Scholar] [CrossRef]
  22. Morandin, M.; Mercangöz, M.; Hemrle, J.; Maréchal, F.; Favrat, D. Thermoeconomic design optimization of a thermo-electric energy storage system based on transcritical CO2 cycles. Energy 2013, 58, 571–587. [Google Scholar] [CrossRef]
  23. Ahmadi, M.H.; Mehrpooya, M.; Pourfayaz, F. Thermodynamic and exergy analysis and optimization of a transcritical CO2 power cycle driven by geothermal energy with liquefied natural gas as its heat sink. Appl. Therm. Eng. 2016, 109, 640–652. [Google Scholar] [CrossRef]
  24. Liu, Z.; Liu, B.; Guo, J.Z.; Xin, X.; Yang, X.H. Conventional and advanced exergy analysis of a novel transcritical compressed carbon dioxide energy storage system. Energy Convers. Manag. 2019, 198, 111807. [Google Scholar] [CrossRef]
  25. Zhang, Y.; Liang, T.Y.; Yang, K. An integrated energy storage system consisting of Compressed Carbon dioxide energy storage and Organic Rankine Cycle: Exergoeconomic evaluation and multi-objective optimization. Energy 2022, 247, 123566. [Google Scholar] [CrossRef]
  26. Zhang, T.H.; Gao, J.M.; Zhang, Y.; Zhang, J.; Sun, Q.Q.; Du, Q.; Tang, Z.P.; Peng, Y.R. Thermodynamic analysis of a novel adsorption-type trans-critical compressed carbon dioxide energy storage system. Energy Convers. Manag. 2022, 270, 116268. [Google Scholar] [CrossRef]
  27. Zhang, Y.; Lin, Y.H.; Lin, F.Z.; Yang, K. Thermodynamic analysis of a novel combined cooling, heating, and power system consisting of wind energy and transcritical compressed CO2 energy storage. Energy Convers. Manag. 2022, 260, 115609. [Google Scholar] [CrossRef]
  28. Hao, Y.P.; He, Q.; Zhou, Q.; Du, D.M. Modeling and techno-economic analysis of a novel trans-critical carbon dioxide energy storage system based on life cycle cost method. J. Energy Storage 2020, 28, 101273. [Google Scholar] [CrossRef]
  29. Xu, M.J.; Wang, X.; Wang, Z.H.; Zhao, P.; Dai, Y.P. Preliminary design and performance assessment of compressed supercritical carbon dioxide energy storage system. Appl. Therm. Eng. 2021, 183, 116153. [Google Scholar] [CrossRef]
  30. Oh, S.; Oh, B.S.; Lee, J.I. Performance Evaluation of Supercritical Carbon Dioxide Recompression Cycle for High Temperature Electric Thermal Energy Storage. Energy Convers. Manag. 2022, 255, 115325. [Google Scholar] [CrossRef]
  31. Chen, K.Q.; Pu, W.H.; Zhang, Q.; Xing, X.L.; Xiong, C.; Guo, M.D. Thermodynamic and Economic Assessment on the Supercritical Compressed Carbon Dioxide Energy Storage System coupled with Solar Thermal Storage. J. Energy Storage 2021, 41, 102959. [Google Scholar] [CrossRef]
  32. He, Q.; Liu, H.; Hao, Y.P.; Liu, Y.N.; Liu, W.Y. Thermodynamic analysis of a novel supercritical compressed carbon dioxide energy storage system through advanced exergy analysis. Renew. Energy 2018, 127, 835–849. [Google Scholar] [CrossRef]
  33. Zhang, Y.; Yang, K.; Hong, H.; Zhong, X.H.; Xu, J.Z. Thermodynamic analysis of a novel energy storage system with carbon dioxide as working fluid. Renew. Energy 2016, 99, 682–697. [Google Scholar] [CrossRef]
  34. Huang, R.; Zhou, K.; Liu, Z. Reduction on the inefficiency of heat recovery storage in a compressed carbon dioxide energy storage system. Energy 2022, 244, 123224. [Google Scholar] [CrossRef]
  35. Zhang, Y.; Yao, E.R.; Zhang, X.L.; Yang, K. Thermodynamic analysis of a novel compressed carbon dioxide energy storage system with low-temperature thermal storage. Int. J. Energy Res. 2020, 44, 6531–6554. [Google Scholar] [CrossRef]
  36. Tang, B.; Sun, L.; Xie, Y.H. Comprehensive performance evaluation and optimization of a liquid carbon dioxide energy storage system with heat source. Appl. Therm. Eng. 2022, 215, 118957. [Google Scholar] [CrossRef]
  37. Sun, L.; Tang, B.; Xie, Y.H. Performance assessment of two compressed and liquid carbon dioxide energy storage systems: Thermodynamic, exergoeconomic analysis and multi-objective optimization. Energy 2022, 256, 124648. [Google Scholar] [CrossRef]
  38. Xu, W.P.; Zhao, P.; Gou, F.F.; Wu, W.Z.; Liu, A.J.; Wang, J.F. A combined heating and power system based on compressed carbon dioxide energy storage with carbon capture: Exploring the technical potential. Energy Convers. Manag. 2022, 260, 115610. [Google Scholar] [CrossRef]
  39. Yang, D.L.; Tang, G.H.; Luo, K.H.; Fan, Y.H.; Li, X.L.; Sheng, Q. Integration and conversion of supercritical carbon dioxide coal-fired power cycle and high-efficiency energy storage cycle: Feasibility analysis based on a three-step strategy. Energy Convers. Manag. 2022, 269, 116074. [Google Scholar] [CrossRef]
  40. Cao, Y.; Zhan, J.; Dong, Y.S.; Si, F.Q. Off-design performance analysis of a gas-supercritical carbon dioxide combined cycle under multi-stage mass flow cooperative operation. Appl. Therm. Eng. 2023, 219, 119486. [Google Scholar] [CrossRef]
  41. Mercangöz, M.; Hemrle, J.; Kaufmann, L.; Z’Graggen, A.; Ohler, C. Electrothermal energy storage with transcritical CO2 cycles. Energy. 2012, 45, 407–415. [Google Scholar] [CrossRef]
  42. Wang, X.R.; Dai, Y.P. Exergoeconomic analysis of utilizing the transcritical CO2 cycle and the ORC for a recompression supercritical CO2 cycle waste heat recovery: A comparative study. Appl. Energy 2016, 170, 193–207. [Google Scholar] [CrossRef]
  43. Kurtulus, K.; Coskun, A.; Ameen, S.; Yilmaz, C.; Bolatturk, A. Thermoeconomic analysis of a CO2 compression system using waste heat into the regenerative organic Rankine cycle. Energy Convers. Manag. 2018, 168, 588–598. [Google Scholar] [CrossRef]
  44. Hou, S.Y.; Zhou, Y.D.; Yu, L.J.; Zhang, F.Y.; Cao, S.; Wu, Y.D. Optimization of a novel cogeneration system including a gas turbine, a supercritical CO2 recompression cycle, a steam power cycle and an organic Rankine cycle. Energy Convers. Manag. 2018, 172, 457–471. [Google Scholar] [CrossRef]
  45. Zhang, Q.; Luo, Z.W.; Zhao, Y.J.; Cao, R. Performance assessment and multi-objective optimization of a novel transcritical CO2 trigeneration system for a low-grade heat resource. Energy Convers. Manag. 2020, 204, 112281. [Google Scholar] [CrossRef]
  46. Zhong, L.K.; Yao, E.R.; Zou, H.S.; Xi, G. Thermo-economic-environmental analysis of an innovative combined cooling and power system integrating Solid Oxide Fuel Cell, Supercritical CO2 cycle, and ejector refrigeration cycle. Sustain. Energy Technol. Assess. 2021, 47, 101517. [Google Scholar] [CrossRef]
  47. Ghaebi, H.; Parikhani, T.; Rostamzadeh, H. Energy, exergy and thermoeconomic analysis of a novel combined cooling and power system using low-temperature heat source and LNG cold energy recovery. Energy Convers. Manag. 2017, 150, 678–692. [Google Scholar] [CrossRef]
  48. Liu, Z.; Liu, Z.H.; Yang, X.Q.; Zhai, H.Y.; Yang, X.H. Advanced exergy and exergoeconomic analysis of a novel liquid carbon dioxide energy storage system. Energy Convers. Manag. 2020, 205, 112391. [Google Scholar] [CrossRef]
  49. Wu, C.; Wan, Y.K.; Liu, Y.; Xu, X.X.; Liu, C. Thermodynamic simulation and economic analysis of a novel liquid carbon dioxide energy storage system. J. Energy Storag. 2022, 55, 105544. [Google Scholar] [CrossRef]
  50. Zhang, Y.; Shen, X.; Tian, Z.; Yang, C.; Gao, W.; Yang, K. 5E (energy, exergy, energy level, exergoeconomic, and exergetic sustainability) analysis on a carbon dioxide binary mixture based compressed gas energy storage system: A comprehensive research and feasibility validation. Energy Convers. Manag. 2023, 292, 117399. [Google Scholar] [CrossRef]
  51. Zhao, P.; Xu, W.P.; Zhang, S.Q.; Gou, F.F.; Wang, J.F.; Dai, Y.P. Components design and performance analysis of a novel compressed carbon dioxide energy storage system: A pathway towards realizability. Energy Convers. Manag. 2021, 229, 113679. [Google Scholar] [CrossRef]
  52. Xu, C.; Wang, Z.F.; He, Y.L.; Li, X.; Bai, F.W. Sensitivity analysis of the numerical study on the thermal performance of a packed-bed molten salt thermocline thermal storage system. Appl. Energy 2012, 92, 65–75. [Google Scholar] [CrossRef]
  53. Deb, K.; Pratap, A.; Agarwal, S.; Meyarivan, T. A Fast and Elitist Multiobjective Genetic Algorithm: NSGA-II. IEEE Access. 2002, 6, 182–197. [Google Scholar] [CrossRef]
  54. Tang, B.; Sun, L.; Xie, Y.H. Design and performance evaluation of an energy storage system using CO2-based binary mixtures for thermal power plant under dry conditions. Energy Convers. Manag. 2022, 268, 116043. [Google Scholar] [CrossRef]
  55. Huang, L.J.; Du, B.C.; Lei, Y.G. Coupled Thermal and Mechanical Dynamic Performances of the Molten Salt Packed-Bed Thermal Energy Storage System. J. Therm. Sci. 2022, 31, 1337–1350. [Google Scholar] [CrossRef]
  56. Cheung, B.C.; Carriveau, R.; Ting, D.S.K. Multi-objective optimization of an underwater compressed air energy storage system using genetic algorithm. Energy 2014, 74, 396–404. [Google Scholar] [CrossRef]
  57. Zhao, P.; Xu, W.P.; Gou, F.F.; Fan, G.; Wang, J.F. Performance analysis of a self-condensation compressed carbon dioxide energy storage system with vortex tube. J. Energy Storage 2021, 41, 102995. [Google Scholar] [CrossRef]
  58. Meng, N.; Li, T.L.; Kong, X.F.; Gao, X. Advanced exergy and exergoeconomic analyses and a case study of a novel trans-critical CO2 cycle with pressurization process for hot dry rock. Energy Convers. Manag. 2021, 246, 114687. [Google Scholar] [CrossRef]
  59. Wang, M.K.; Zhao, P.; Wu, Y.; Dai, Y.P. Performance analysis of a novel energy storage system based on liquid carbon dioxide. Appl. Therm. Eng. 2015, 91, 812–823. [Google Scholar] [CrossRef]
  60. Fu, H.L.; He, Q.; Song, J.T.; Hao, Y.P. Thermodynamic of a novel solar heat storage compressed carbon dioxide energy storage system. Energy Convers. Manag. 2021, 247, 114757. [Google Scholar] [CrossRef]
  61. Hao, Y.P.; He, Q.; Du, D.M. A trans-critical carbon dioxide energy storage system with heat pump to recover stored heat of compression. Renew. Energy 2020, 152, 1099–1108. [Google Scholar] [CrossRef]
Figure 1. Structural diagram of the novel system.
Applsci 14 06307 g001
Figure 2. T-s plot of the proposed system.
Applsci 14 06307 g002
Figure 3. Temperature profiles in all TES heat exchangers. (a) Temperature trace in the TES1; (b) temperature trace in the TES2; (c) temperature trace in the TES3; (d) temperature trace in the TES4.
Applsci 14 06307 g003
Figure 4. E ˙ D ratio of system components.
Applsci 14 06307 g004
Figure 5. Operation cost ratio of system components.
Applsci 14 06307 g005
Figure 6. Influence of P l i q on the CO2 mass flow rate and compressor input power.
Applsci 14 06307 g006
Figure 7. Influence of P l i q on the system energy storage efficiency and unit power product cost.
Applsci 14 06307 g007
Figure 8. Influence of η C on the CO2 mass flow rate and compressor input power.
Applsci 14 06307 g008
Figure 9. Influence of η C on the system energy storage efficiency and unit power product cost.
Applsci 14 06307 g009
Figure 10. Influence of η T on the system energy storage efficiency and unit power product cost.
Applsci 14 06307 g010
Figure 11. Influence of P e v a p on the system energy storage efficiency and unit power product cost.
Applsci 14 06307 g011
Figure 12. Influence of P l i q on the system exergy performances and component exergy loss.
Applsci 14 06307 g012
Figure 13. Influence of η C on the system exergy performances and component exergy loss.
Applsci 14 06307 g013
Figure 14. Influence of η T on the system exergy performance and turbine exergy loss.
Applsci 14 06307 g014
Figure 15. Influence of P e v a p on the system exergy performance and related component exergy loss.
Applsci 14 06307 g015
Figure 16. Pareto frontier solution of the system energy storage efficiency with total unit product cost.
Applsci 14 06307 g016
Table 2. Major input data applied in the proposed system [36,45,49,52].
ParameterUnitValue
Electricity   cost   during   charge   period   ( c w c )USD/kWh0.05
Maintenance factor-1.06
Interest rate-0.12
System life spanyear20
Density of molten saltkg/m3 2090 0.636 t ( ° C )
Heat transfer coefficientW/(m2·K)Condenser: 2000
Evaporator: 1500
Table 3. Cost balance modeling of each system component.
ComponentCost Balance EquationAuxiliary Equation
Compressor C ˙ 1 + C ˙ W C + Z ˙ C = C ˙ 2 c w c = 0.05
TES1 C ˙ 2 + C ˙ 15 + Z ˙ T E S 1 = C ˙ 3 + C ˙ 16 c 2 = c 3
TES2 C ˙ 3 + C ˙ 13 + Z ˙ T E S 2 = C ˙ 4 + C ˙ 14 c 3 = c 4
Condenser C ˙ 4 + Z ˙ c o n d = C ˙ 5 -
Valve C ˙ 6 + Z ˙ v a l v e = C ˙ 7 -
Evaporator C ˙ 7 + Z ˙ e v a p = C ˙ 8 -
TES3 C ˙ 8 + C ˙ 17 + Z ˙ T E S 3 = C ˙ 9 + C ˙ 18 c 18 = c 17
TES4 C ˙ 9 + C ˙ 19 + Z ˙ T E S 4 = C ˙ 10 + C ˙ 20 c 20 = c 19
Turbine C ˙ 10 + Z ˙ T = C ˙ 11 + C ˙ W t c 10 = c 11
Cooler C ˙ 11 + C ˙ 21 + Z ˙ Cooler = C ˙ 12 + C ˙ 22 C ˙ 21 = 0 ,   c 12 = c 11
LST C ˙ 5 + Z ˙ L S T = C ˙ 6 -
GST C ˙ 12 + Z ˙ G S T = C ˙ 1 -
CWT C ˙ 18 + Z ˙ C W T = C ˙ 13 -
HWT C ˙ 14 + Z ˙ H W T = C ˙ 17 -
CST C ˙ 20 + Z ˙ C S T = C ˙ 15 -
HST C ˙ 16 + Z ˙ H S T = C ˙ 19 -
Table 4. Model validation with the simulation data.
ParametersReported DataModel DataRelative Error/%
Input dataPropane molar fraction (MF)0.2250.225-
Mass flow of CO2–propane930.27 kg/s930.27 kg/s-
Mass flow of therminol-66 oil823.42 kg/s823.42 kg/s-
Import pressure of compression120 MPa20 MPa-
Import pressure of turbine6.965 MPa6.965 MPa-
Import temperature of compressions313.18 K313.18 K-
Compressor isentropic efficiency80%80%-
Turbine isentropic efficiency85%85%-
Heat transfer temperature difference10 K10 K-
Charge time8 h8 h-
Release time8 h8 h-
Mass flow of steam80 kg/s80 kg/s-
Output dataPower rate of turbine64.62 MW64.62 MW0
Power rate of compressors27.71 MW27.74 MW0.10%
Round trip efficiency60.10%60.09%0.02%
Energy density3.06 kWh/m33.06 kWh/m30
Table 5. System parameter settings under typical conditions [36,42,56,57].
ParameterUnitValue
Reference temperature°C25.0
Reference pressureMPa0.1
Water storage tank pressureMPa5.0
System output powerMW10.0
Storage pressure of CO2MPa7.0
Temperature of cold molten salt°C260.0
Evaporation pressure of CO2MPa5.5
Terminal differences of TES1°C5.0
Hot terminal difference of TES2°C20.0
Cold terminal difference of TES2°C25.0
Cold terminal difference of TES3°C5.0
Charging and discharging timehour8.0
Compressor isentropic efficiency%80.0
Turbine isentropic efficiency%85.0
Table 6. Thermodynamic values of system state points under the design conditions.
PointFluid P
MPa
T
°C
h
k J / k g
s
k J / ( k g K )
E ˙
kW
C ˙
USD/h
c
USD/GJ
1CO20.128.00508.402.740.38178.04130,003.86
2CO27.0496.27981.482.8712,924.361333.0028.65
3CO27.0265.00715.812.468656.25892.7928.65
4CO27.045.00443.861.806447.98665.0428.65
5CO27.028.68293.881.316357.24666.3429.12
6CO27.028.68293.881.316357.24675.4429.51
7CO25.518.27293.881.326269.36675.7329.94
8CO25.518.27411.281.726188.69678.9830.48
9CO25.5228.13679.422.447804.61920.1232.75
10CO25.5463.84945.092.8711,864.341376.6832.23
11CO20.1139.25609.003.03478.8855.5732.23
12CO20.128.00508.402.740.380.0432.23
13Water5.020.0088.610.2942.288.0853.06
14Water5.0245.001061.602.752061.16238.2432.11
15Molten Salt0.1260.00--2109.30230.6330.37
16Molten Salt0.1491.27--6342.19676.6929.64
17Water5.0245.001061.602.752061.16242.0132.61
18Water5.023.271022.320.3440.994.8132.61
19Molten Salt0.1491.27--6342.19681.0429.83
20Molten Salt0.1260.00--2109.30226.5029.83
21Water0.125.00104.920.370.000.000.00
22Water0.130.00125.820.4424.8256.17628.56
Table 7. System components’ exergy results.
Component E ˙ F
M W
E ˙ P
M W
E ˙ D
M W
ε D % c F , k
$ / G J
c P , k
$ / G J
C ˙ D , k
$ / h
Z ˙ k + C ˙ D , k
$ / h
f k % γ k %
C14.0812.921.1528.4313.8924.8257.61508.7688.6878.73
TES14.274.240.030.8728.6529.273.639.4961.732.17
TES22.212.020.194.6728.6531.6719.5321.9410.9810.54
Cond6.456.360.092.2428.6529.119.3610.6712.261.63
Valve6.366.270.092.1729.5129.949.349.623.001.44
Evap6.276.190.081.9929.9430.488.7011.9527.241.79
TES32.021.610.409.9732.6141.4547.4651.417.6727.09
TES44.234.060.174.2729.8331.2418.5920.619.774.73
T11.3810.001.3834.1932.2338.43160.76223.0327.9219.22
Cooler0.480.020.4511.192.3930.750.781.4345.211185.72
Table 8. Main system performances under typical conditions.
Main PerformancesValue
CO2 mass flow rate/kg·s−129.75
Compressor input power/MW14.08
Turbine output power/MW10.00
Energy storage efficiency/%71.04
System total exergy destruction/MW4.05
Exergy efficiency/%71.21
Volume of GST/m3478,938.18
Volume of LST/m31342.50
Volume of HST/m3367.22
Volume of CST/m3339.16
Volume of HWT/m3296.53
Volume of CWT/m3239.41
Cost per unit power product/USD·GJ−140.03
Table 9. Variation of key parameters.
VariablesUnitRange
Storage pressureMPa6.5~7.1
Evaporation pressure of CO2MPa5.0~6.0
Compressor isentropic efficiency%75.0~85.0
Turbine isentropic efficiency%80.0~90.0
Table 10. Variation of key parameters [54,58].
VariablesUnitRange
Storage pressureMPa6.5~7.1
Evaporation pressure of CO2MPa5.0~6.0
Compressor isentropic efficiency%75.0~85.0
Turbine isentropic efficiency%80.0~90.0
Hot terminal temperature difference in TES2K20.0–25.0
Cold terminal temperature difference in TES2K25.0–30.0
Table 11. Parametric setting of genetic algorithm [45].
ParametersValueParametersValue
Population size200Maximum generation100
Mutation factor0.2Crossover factor0.8
Table 12. Corresponding parameters for system to achieve system optimal performance.
ParametersUnitValue
Storage pressureMPa6.6
Compressor isentropic efficiency%80.9
Turbine isentropic efficiency%90.0
Evaporation pressure of CO2MPa5.1
Hot terminal temperature difference in TES2K20.5
Cold terminal temperature difference in TES2K25.1
Table 13. Results of system main performance parameters under optimal conditions.
Main PerformancesUnitValue
Input power of compressorMW13.28
CO2 mass flow ratekg/s29.01
Energy storage efficiency%75.30
Cost per unit power productUSD/GJ41.17
Table 14. Optimal operation parameters of different energy storage technologies.
TechnologiesOperation ParametersValue
CAES [32]Turbine import temperature/K823/1098
Turbine import pressure/MPa4.2/1.1
Compressor import pressure/MPa0.1
Turbine export pressure/MPa0.1
After cooling temperature/K313
AA-CAES [59]Ambient temperature/K288.15
Ambient pressure/kPa101.3
Cavern charge pressure/MPa8
Cavern discharge pressure/MPa6
LCES [59]Compressor export pressure/MPa8
Pump1 export pressure/MPa14.13
Turbine1 export pressure/MPa1
Evaporation pressure/MPa3.415
Turbine2 import temperature/K439.787
Cold terminal temperature difference/K5.034
TC-CCES [33]LST outlet pressure/bar30
HST inlet pressure/bar180
Turbine import pressure/bar150
Expander import pressure/bar35
SC-CCES [32]Turbine import temperature/K873
Turbine import pressure/MPa20
Compressor import pressure/MPa7.5
Turbine outlet pressure/MPa8
After cooling temperature/K313
SSC-CCES [60]High temperature reheater outlet temperature/K668.15
Pressure of energy storage/MPa40
HSR throttle valve pressure drop/MPa20
Final stage expander outlet pressure/MPa8
STC-CCES [60]Outlet temperature of high temperature reheater/K668.15
Pressure of energy storage/MPa40
HSR throttle valve pressure drop/MPa20
Final stage expander outlet pressure/MPa2
TCES-HP [61]Storage pressure/MPa17
Inlet pressure of first stage turbine/MPa15
Table 15. Energy storage efficiencies of different energy storage technologies.
Systems η s t o r /%Systems η s t o r /%
CAES60.65SC-CCES73.02
AA-CAES67.22SSC-CCES67.72
LCAES56.64STC-CCES77.75
TC-CCES60.69TCES-HP66.00
Disclaimer/Publisher’s Note: The statements, opinions and data contained in all publications are solely those of the individual author(s) and contributor(s) and not of MDPI and/or the editor(s). MDPI and/or the editor(s) disclaim responsibility for any injury to people or property resulting from any ideas, methods, instructions or products referred to in the content.

