
Driving Behavior Characteristics of Merging Sections in the Urban Underground Road Junction: A Driving Simulator Study


Abstract
1. Introduction
2. Literature Review
2.1. Driving Simulator Studies in Tunnel Environments
2.2. Driving Behavior and Major Design Factor of Ramp Terminals in UUR
3. Methodology
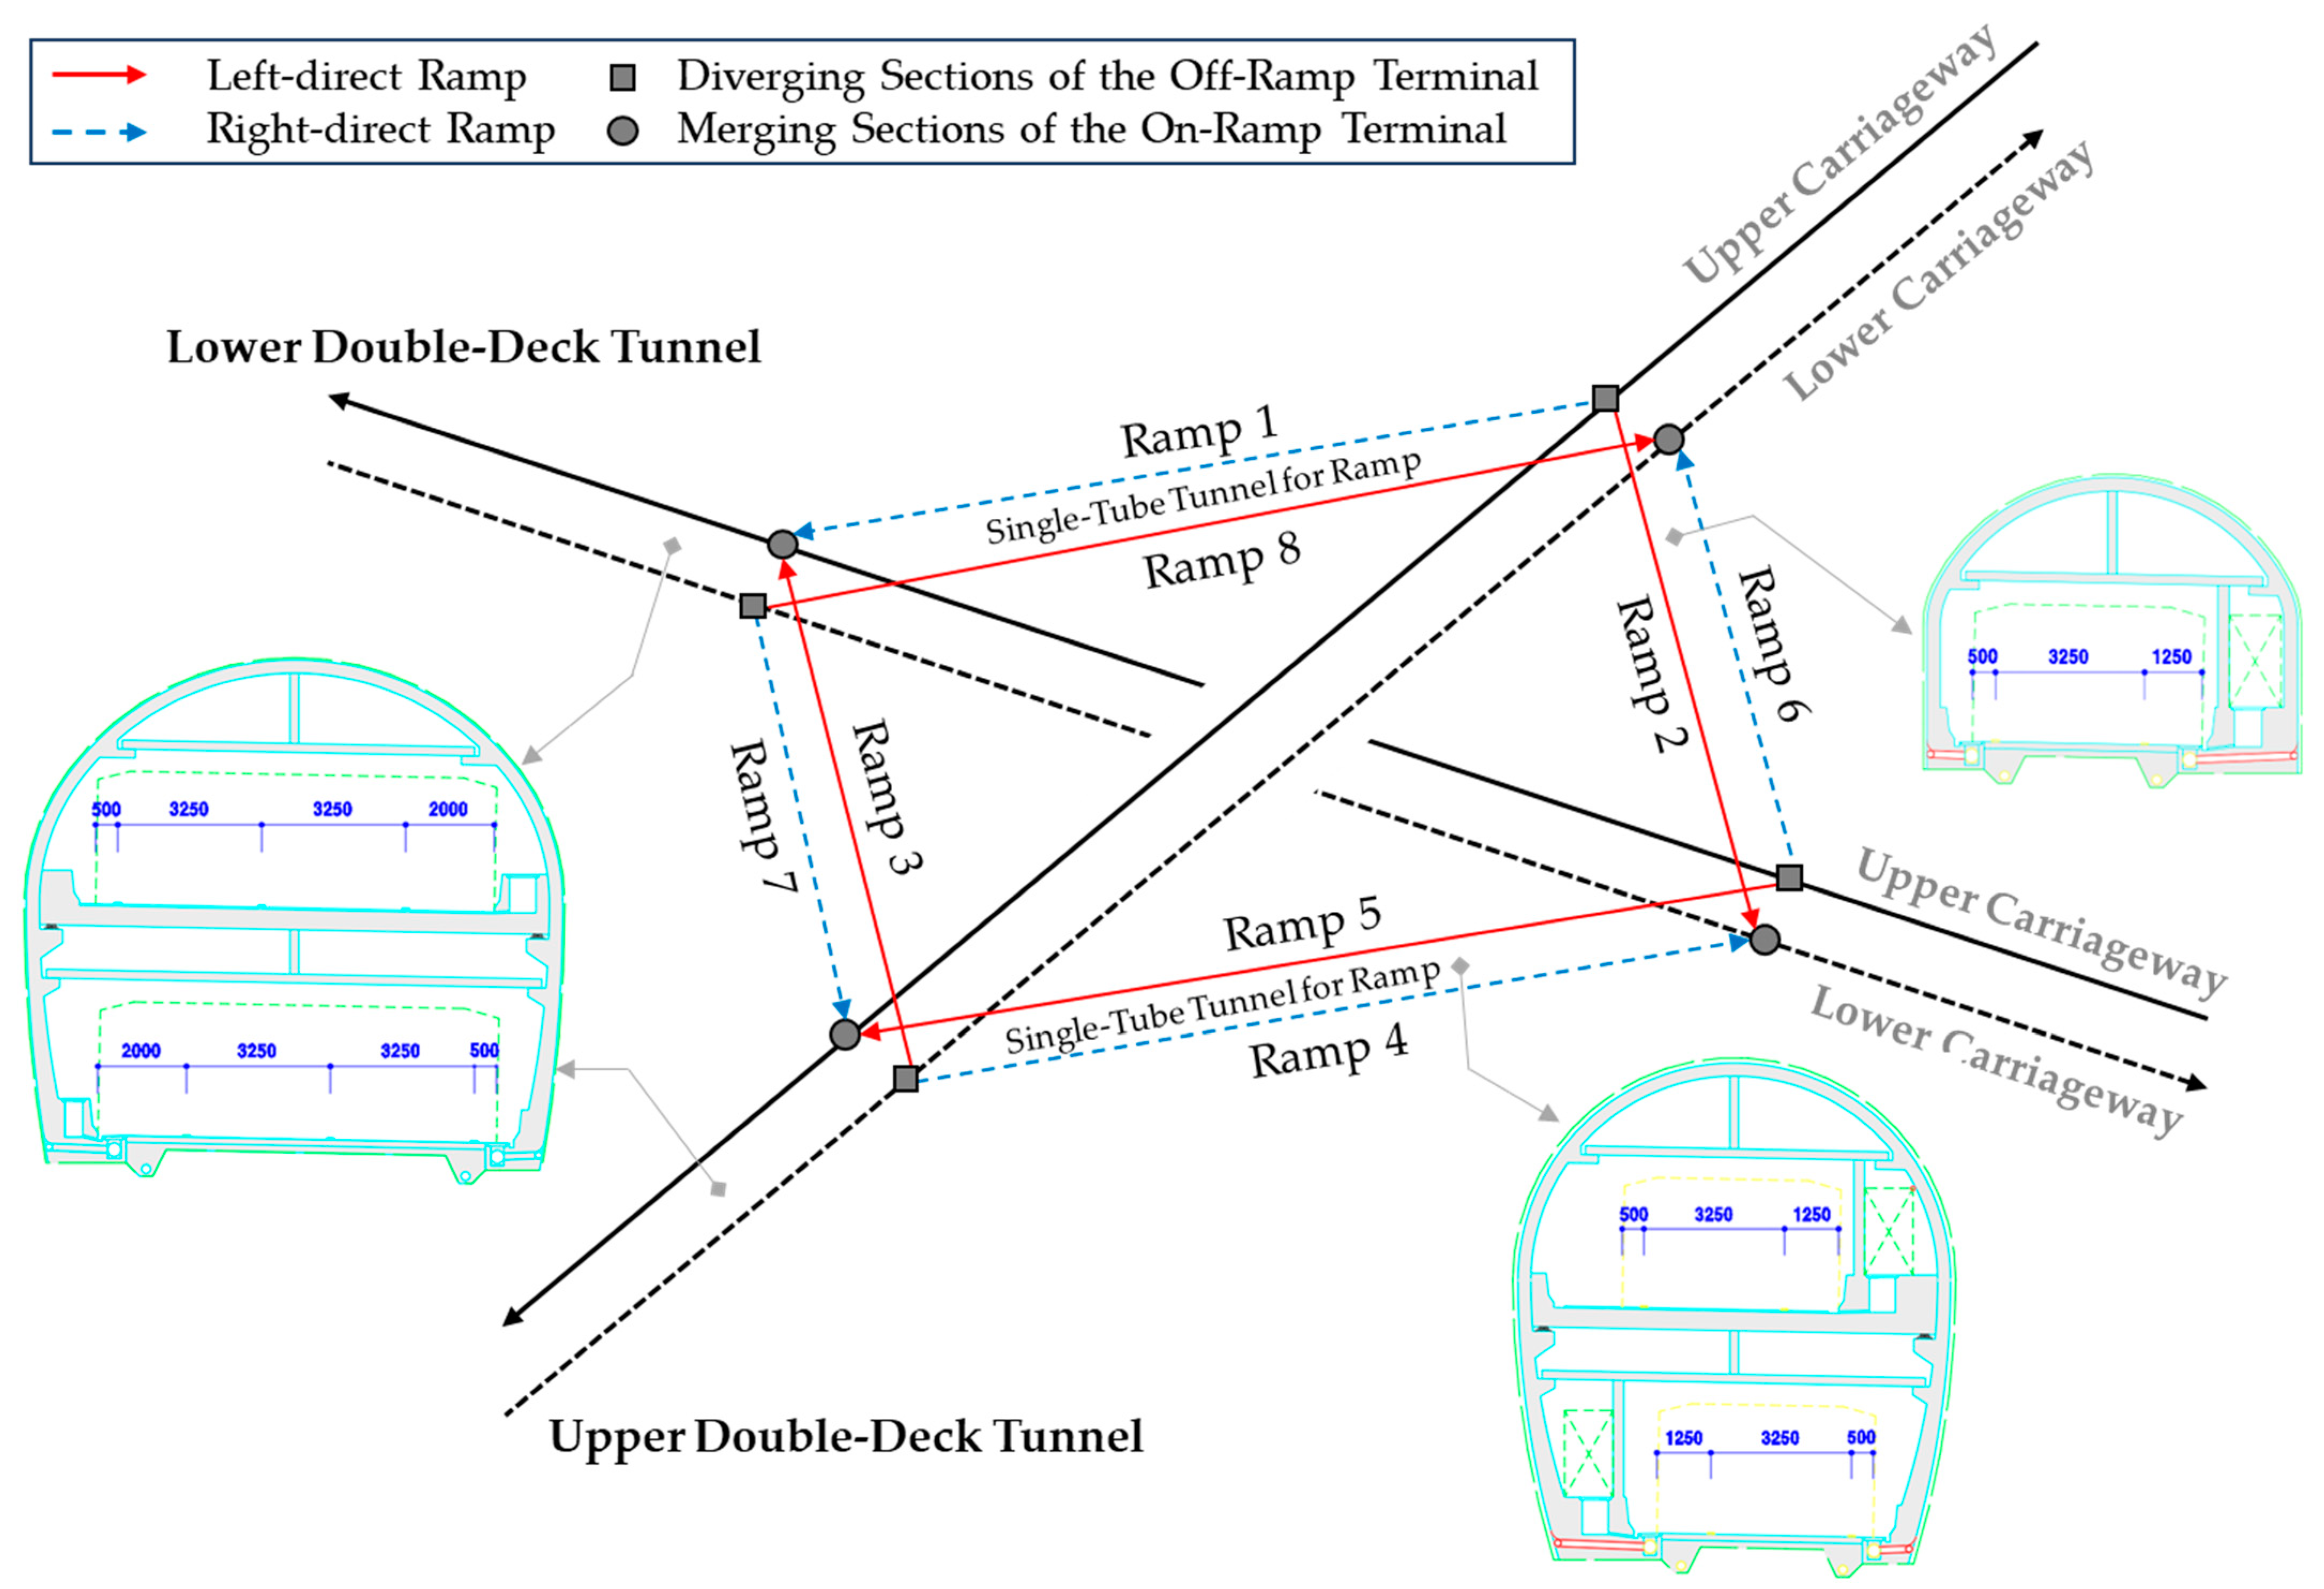
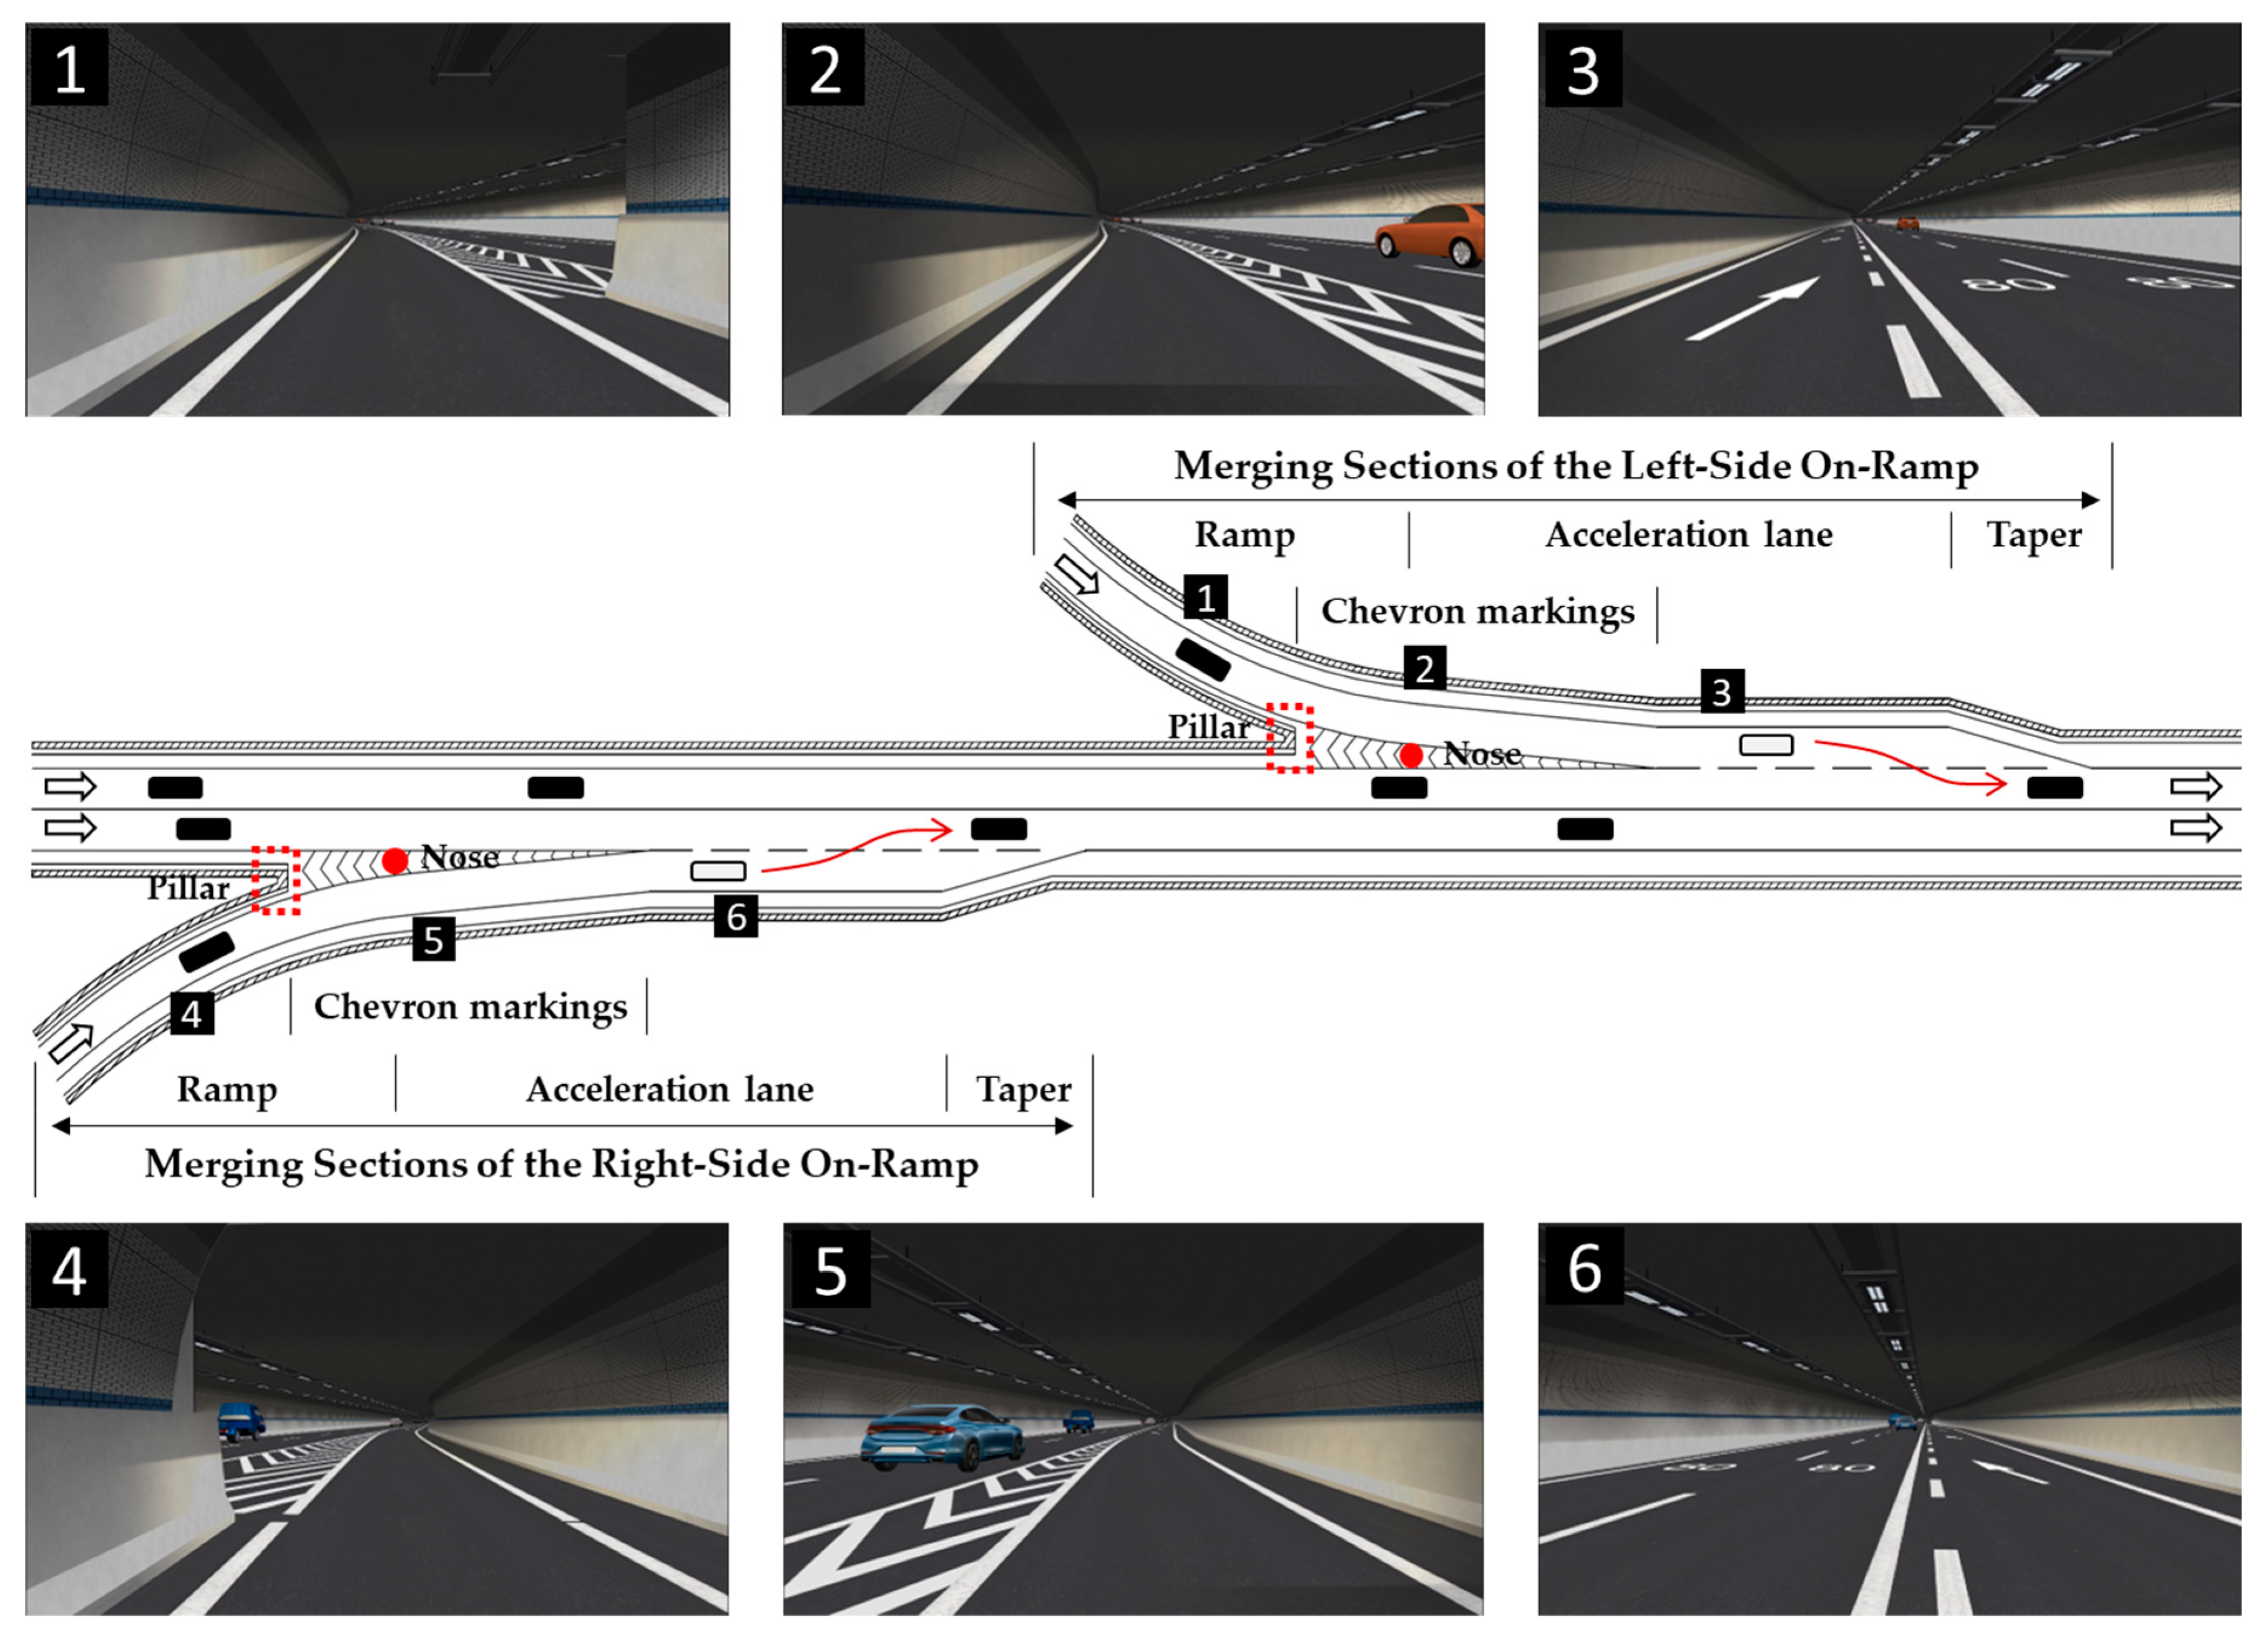
3.1. UUR Junction Based on Double-Deck Tunnels and Left-Side Merging Sections
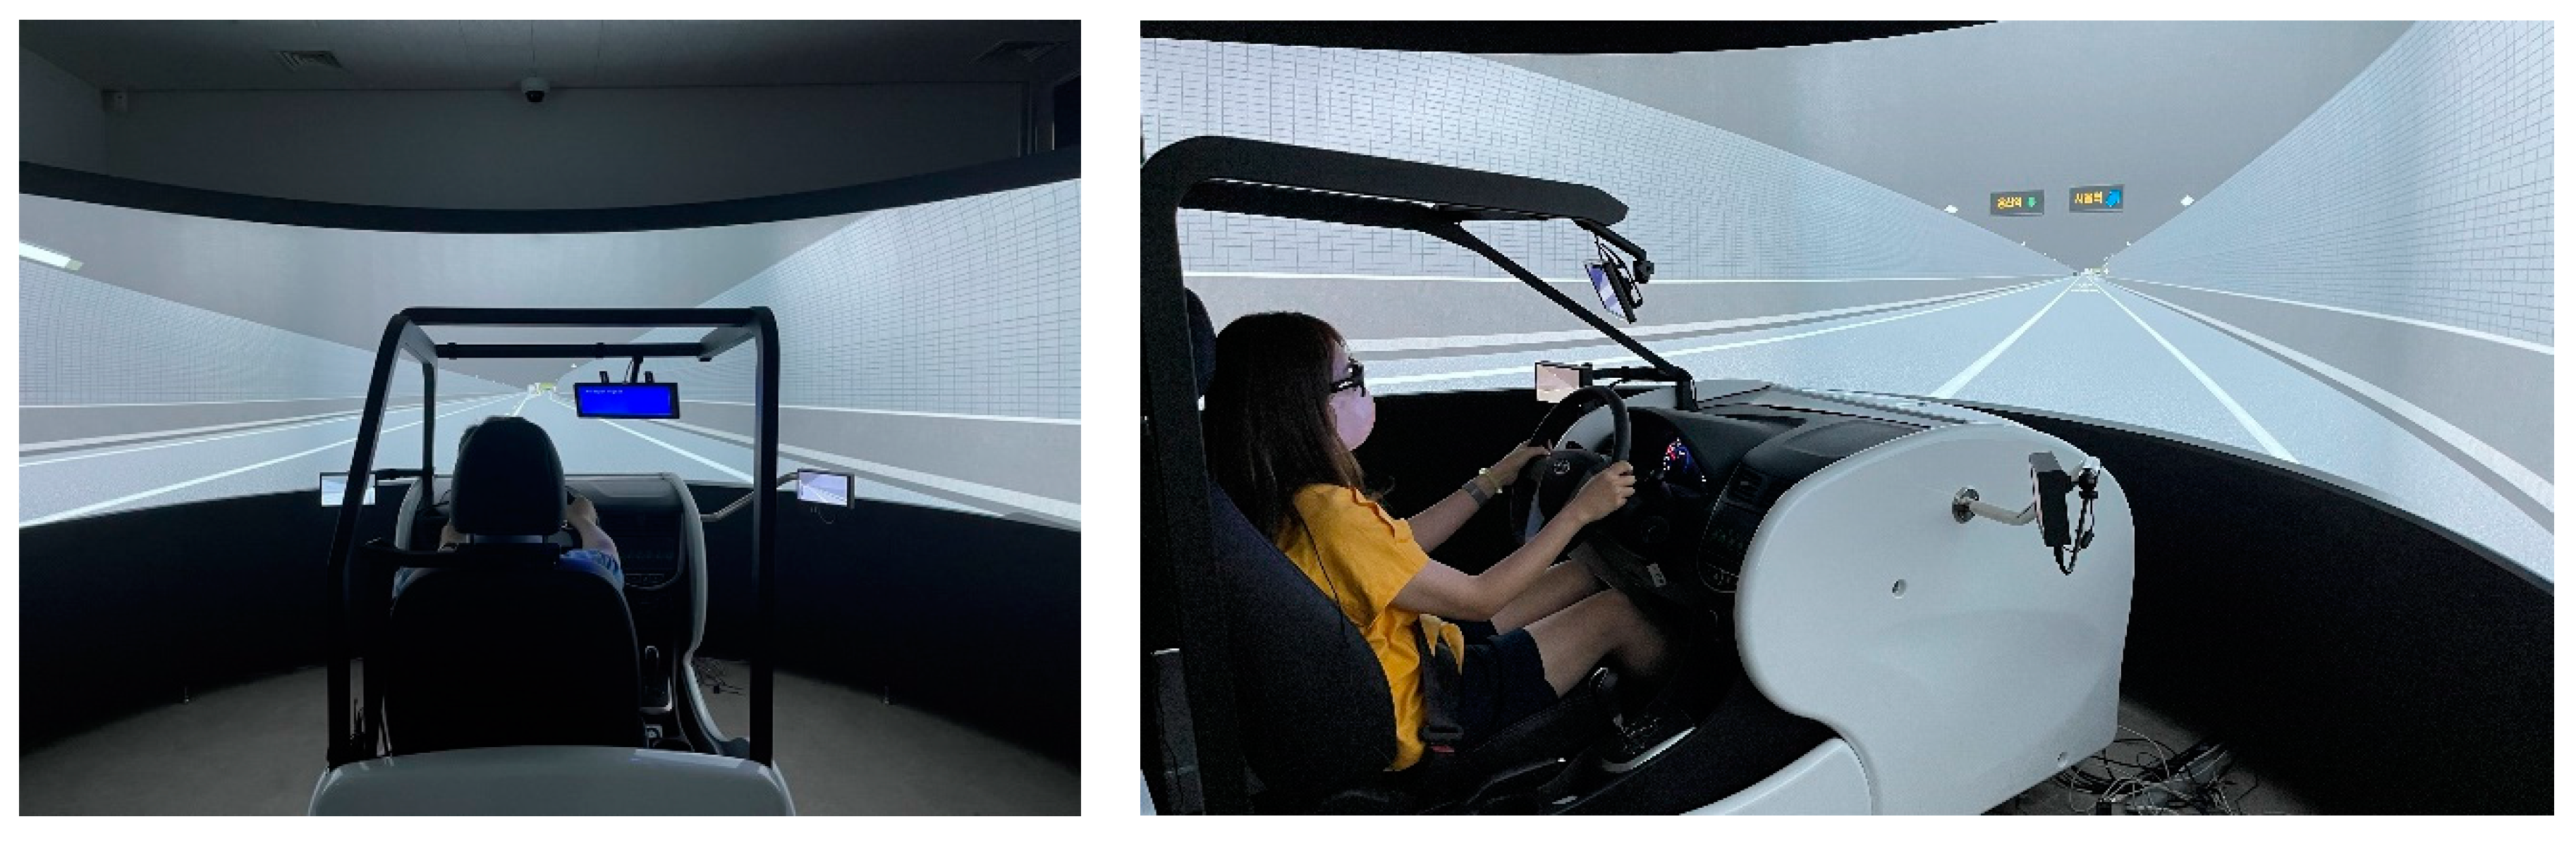
3.2. Driving Simulator Experiments
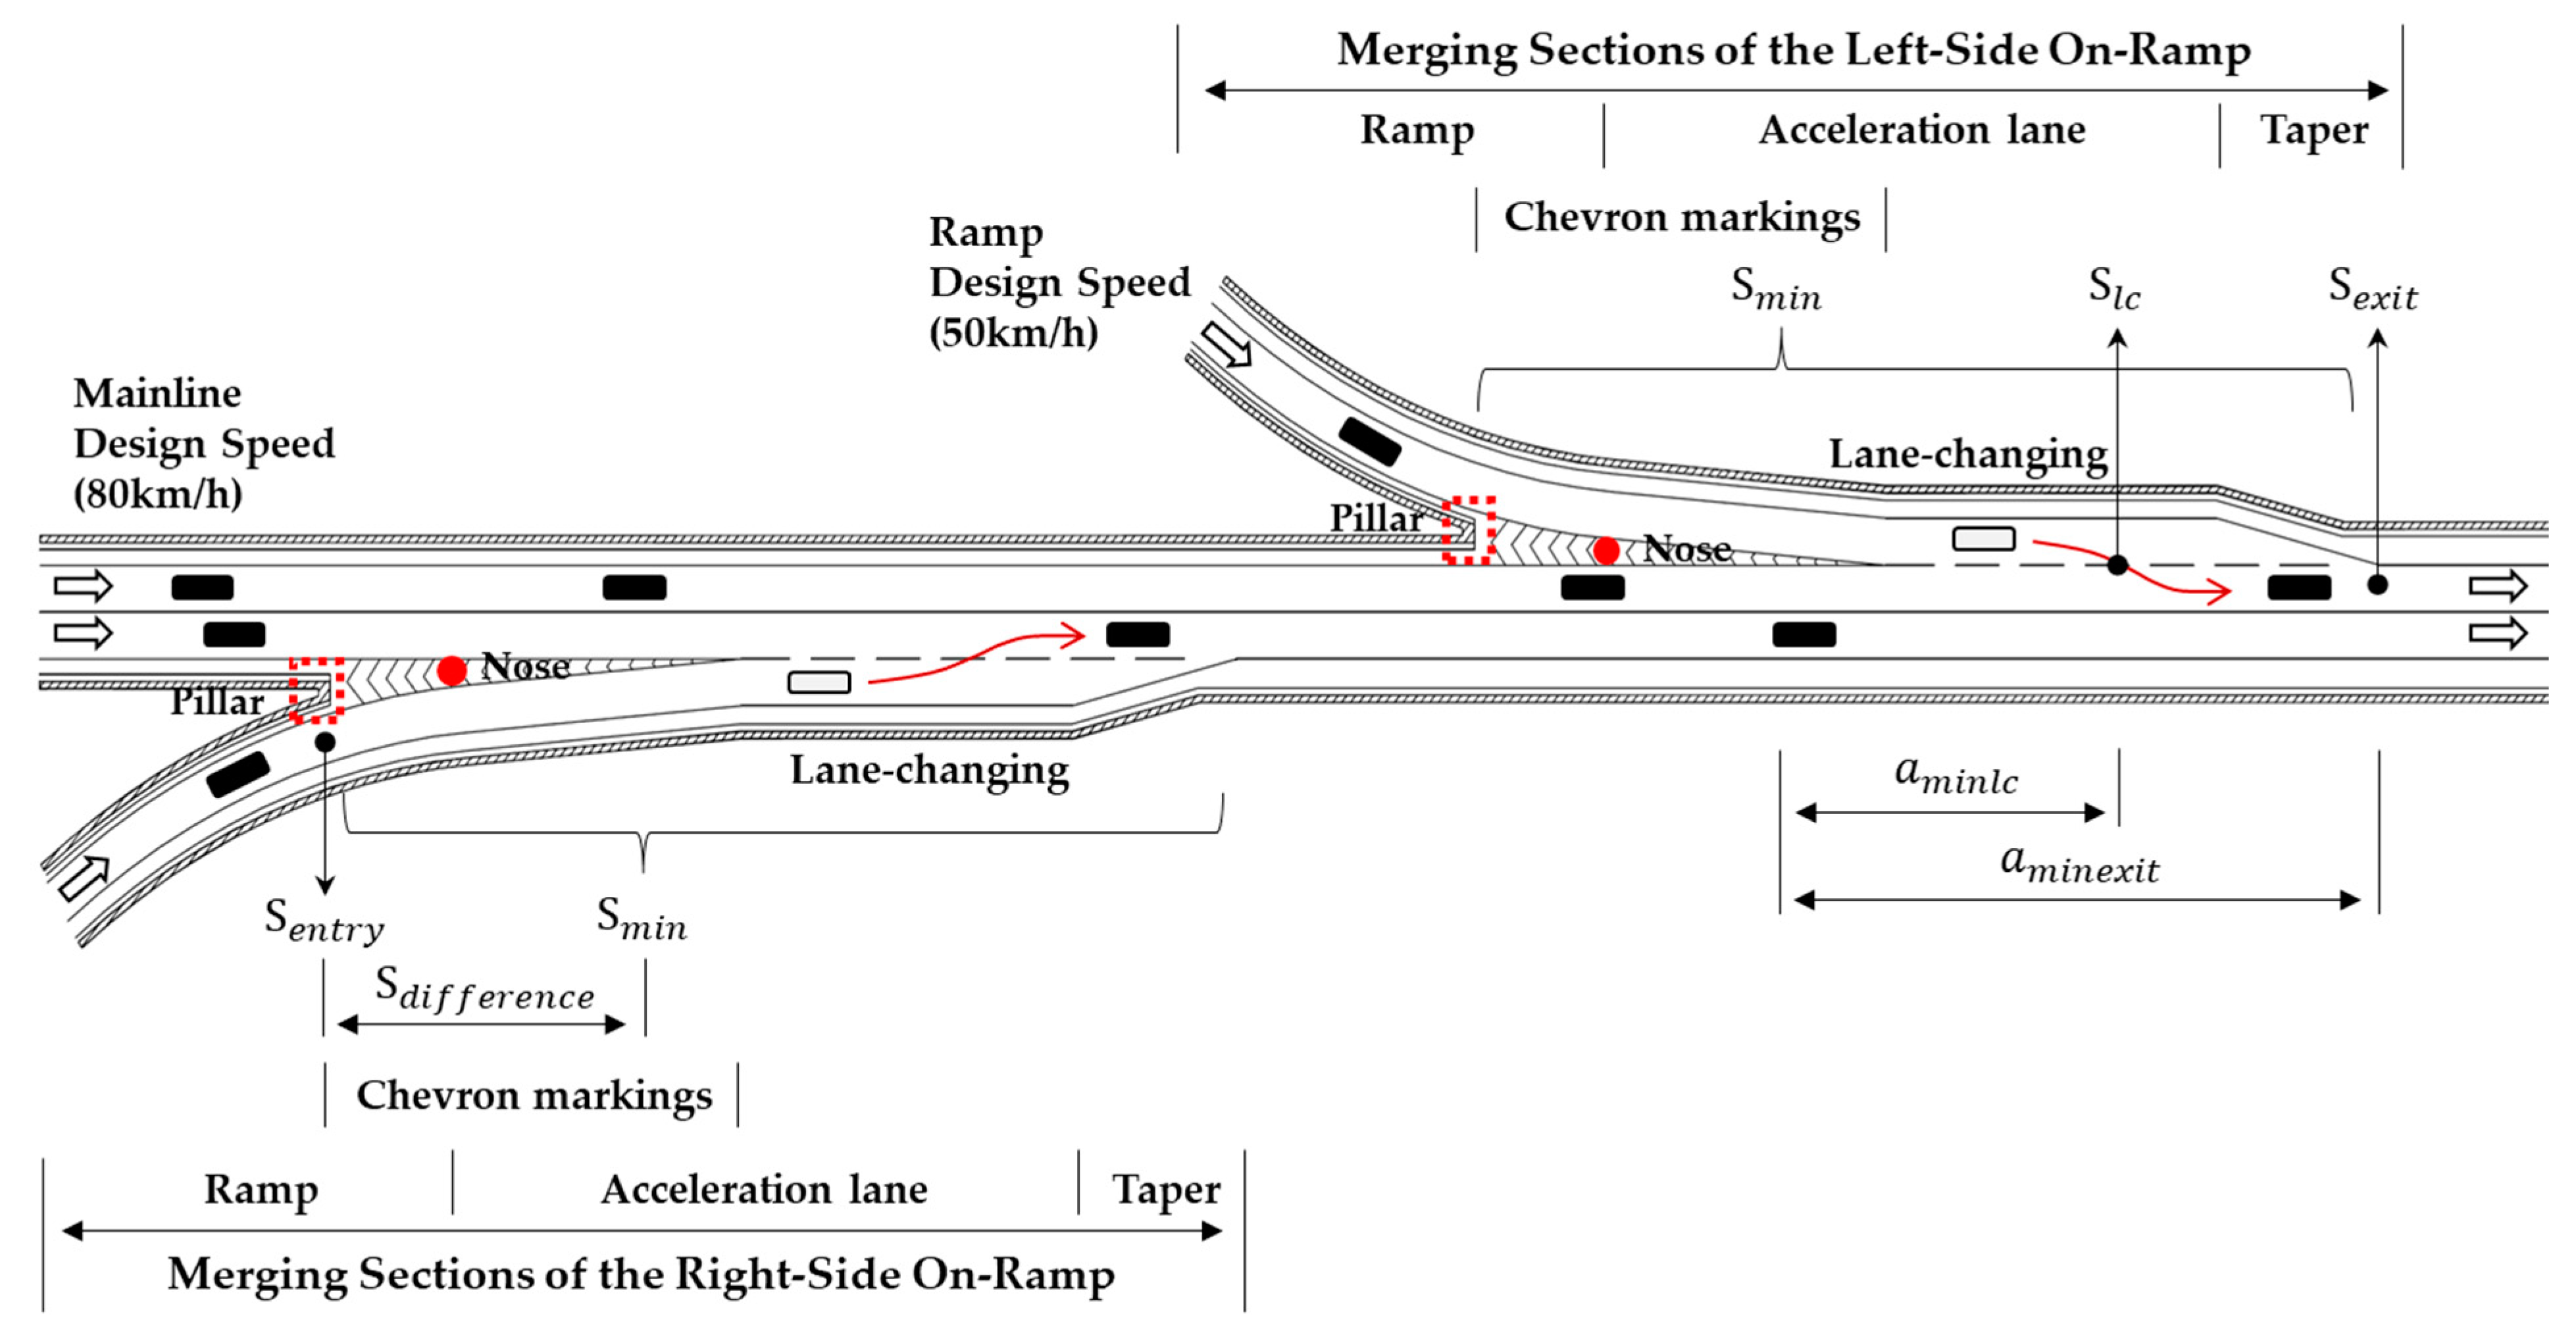
3.3. Analytical Indicators
4. Results
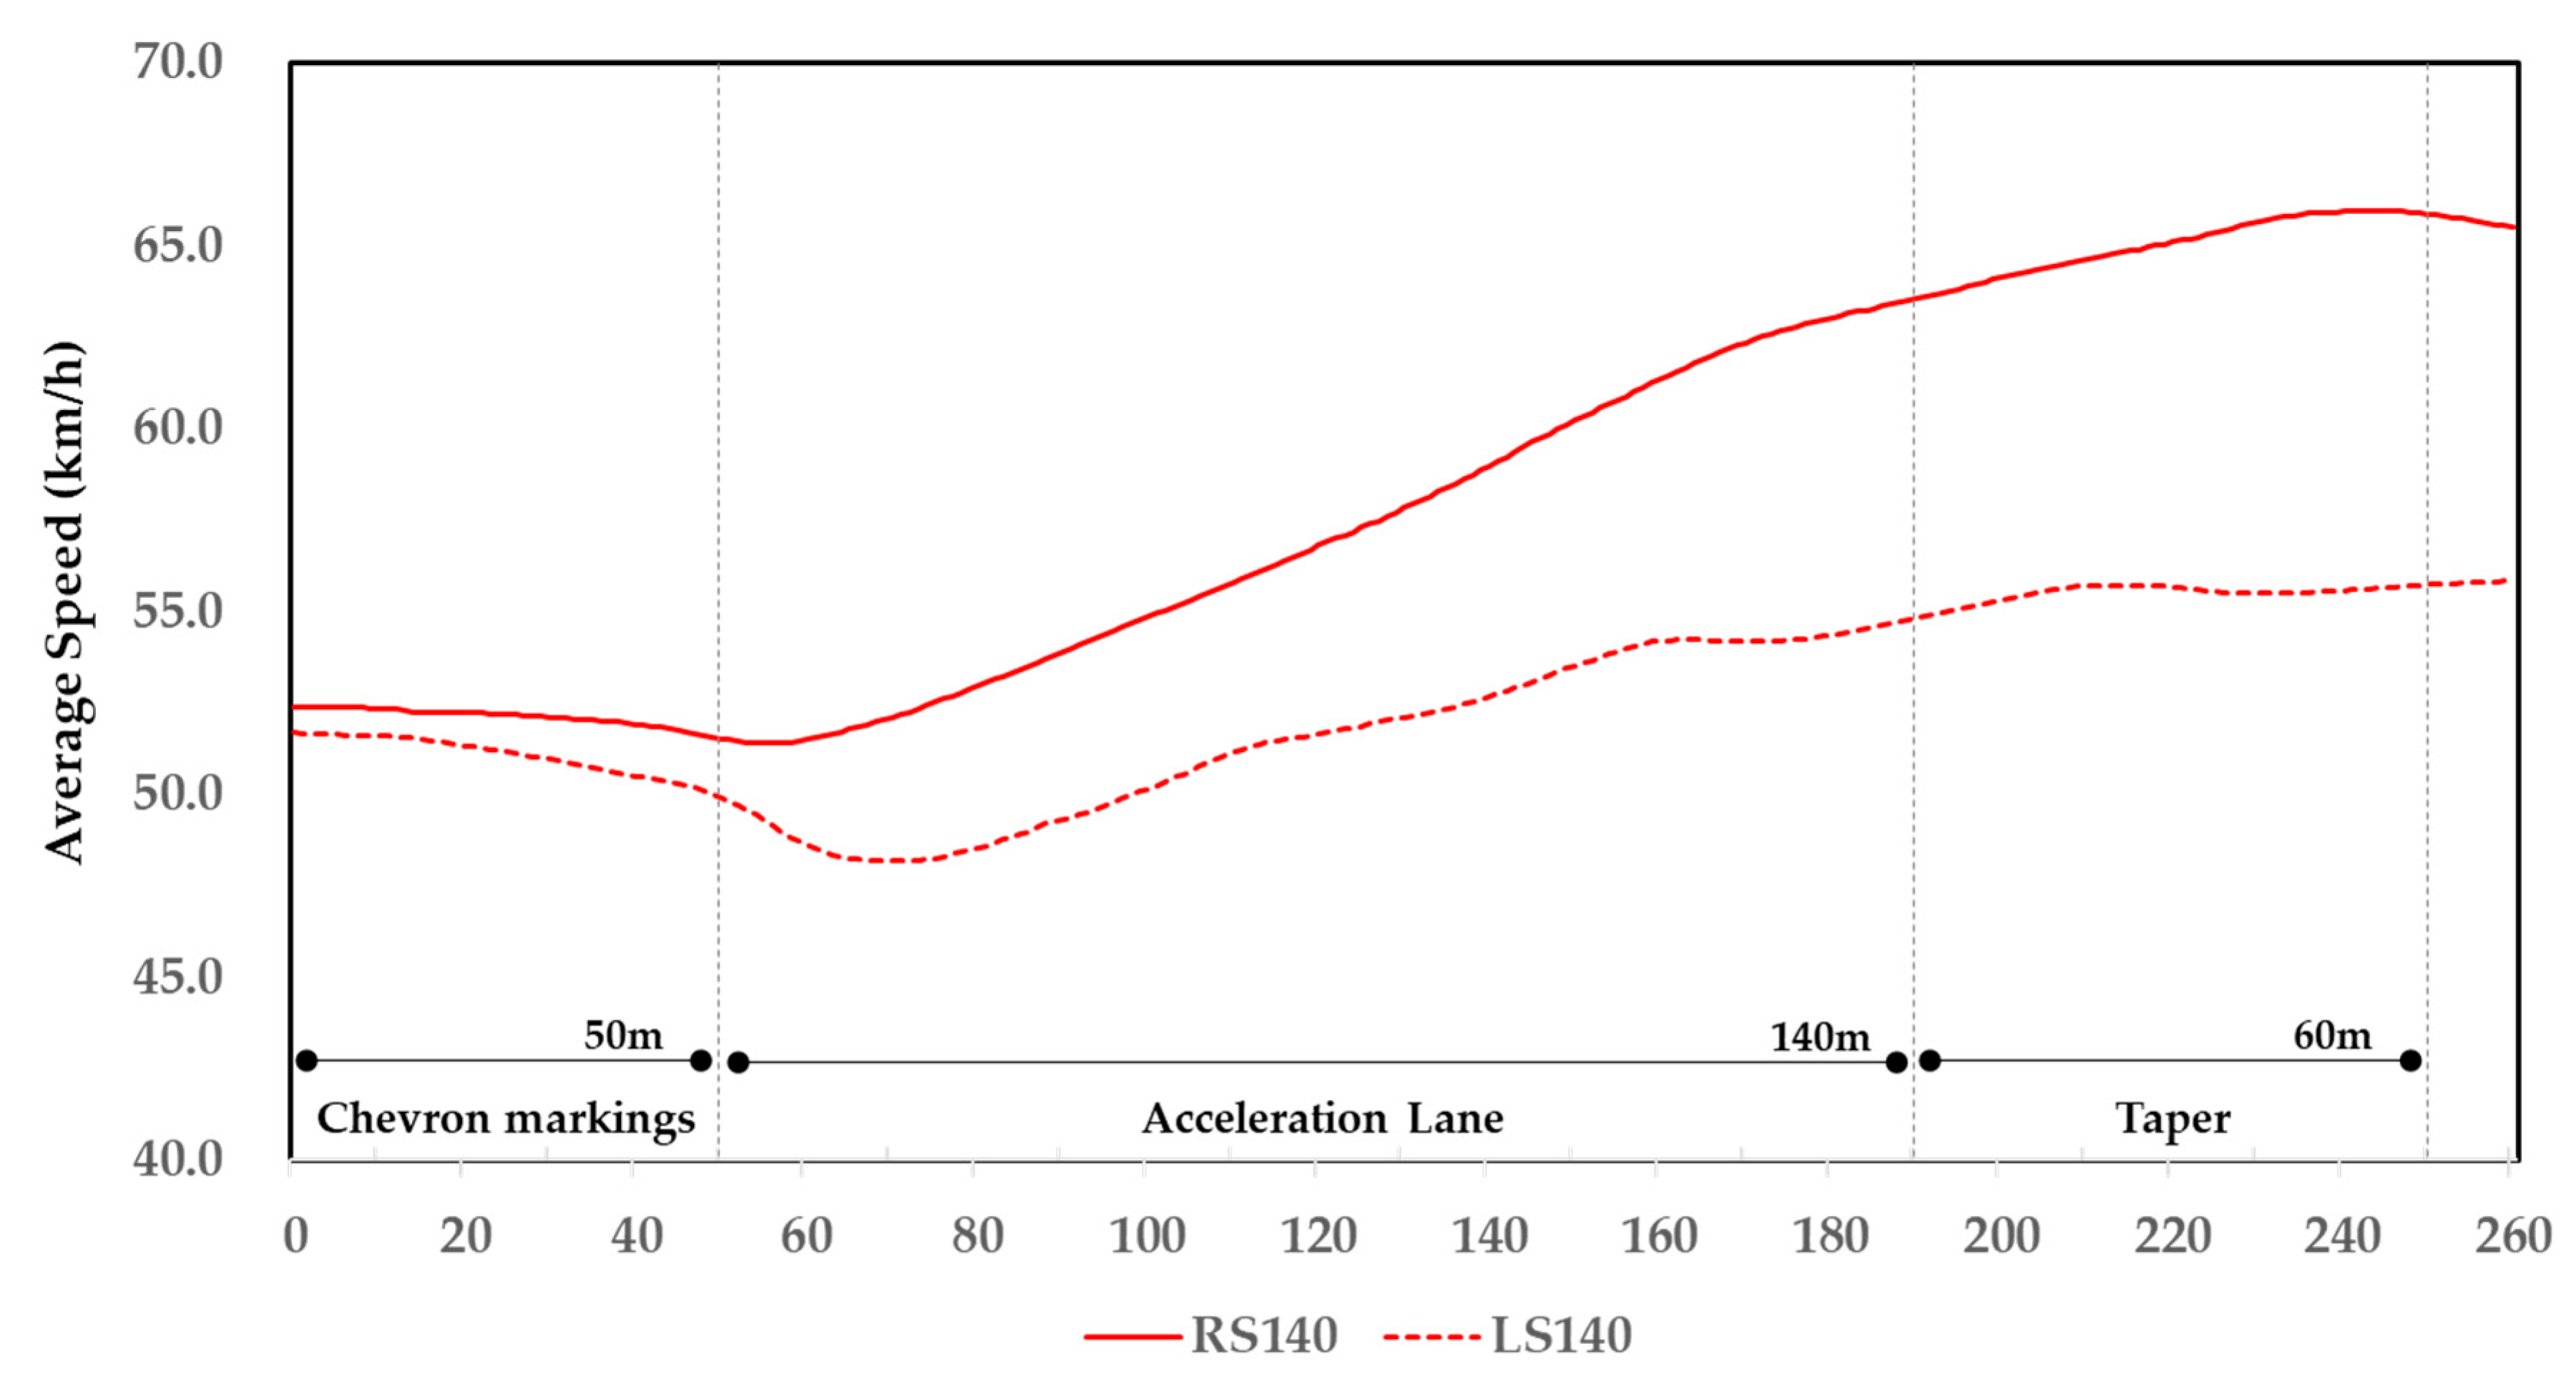
4.1. Speed Behavior
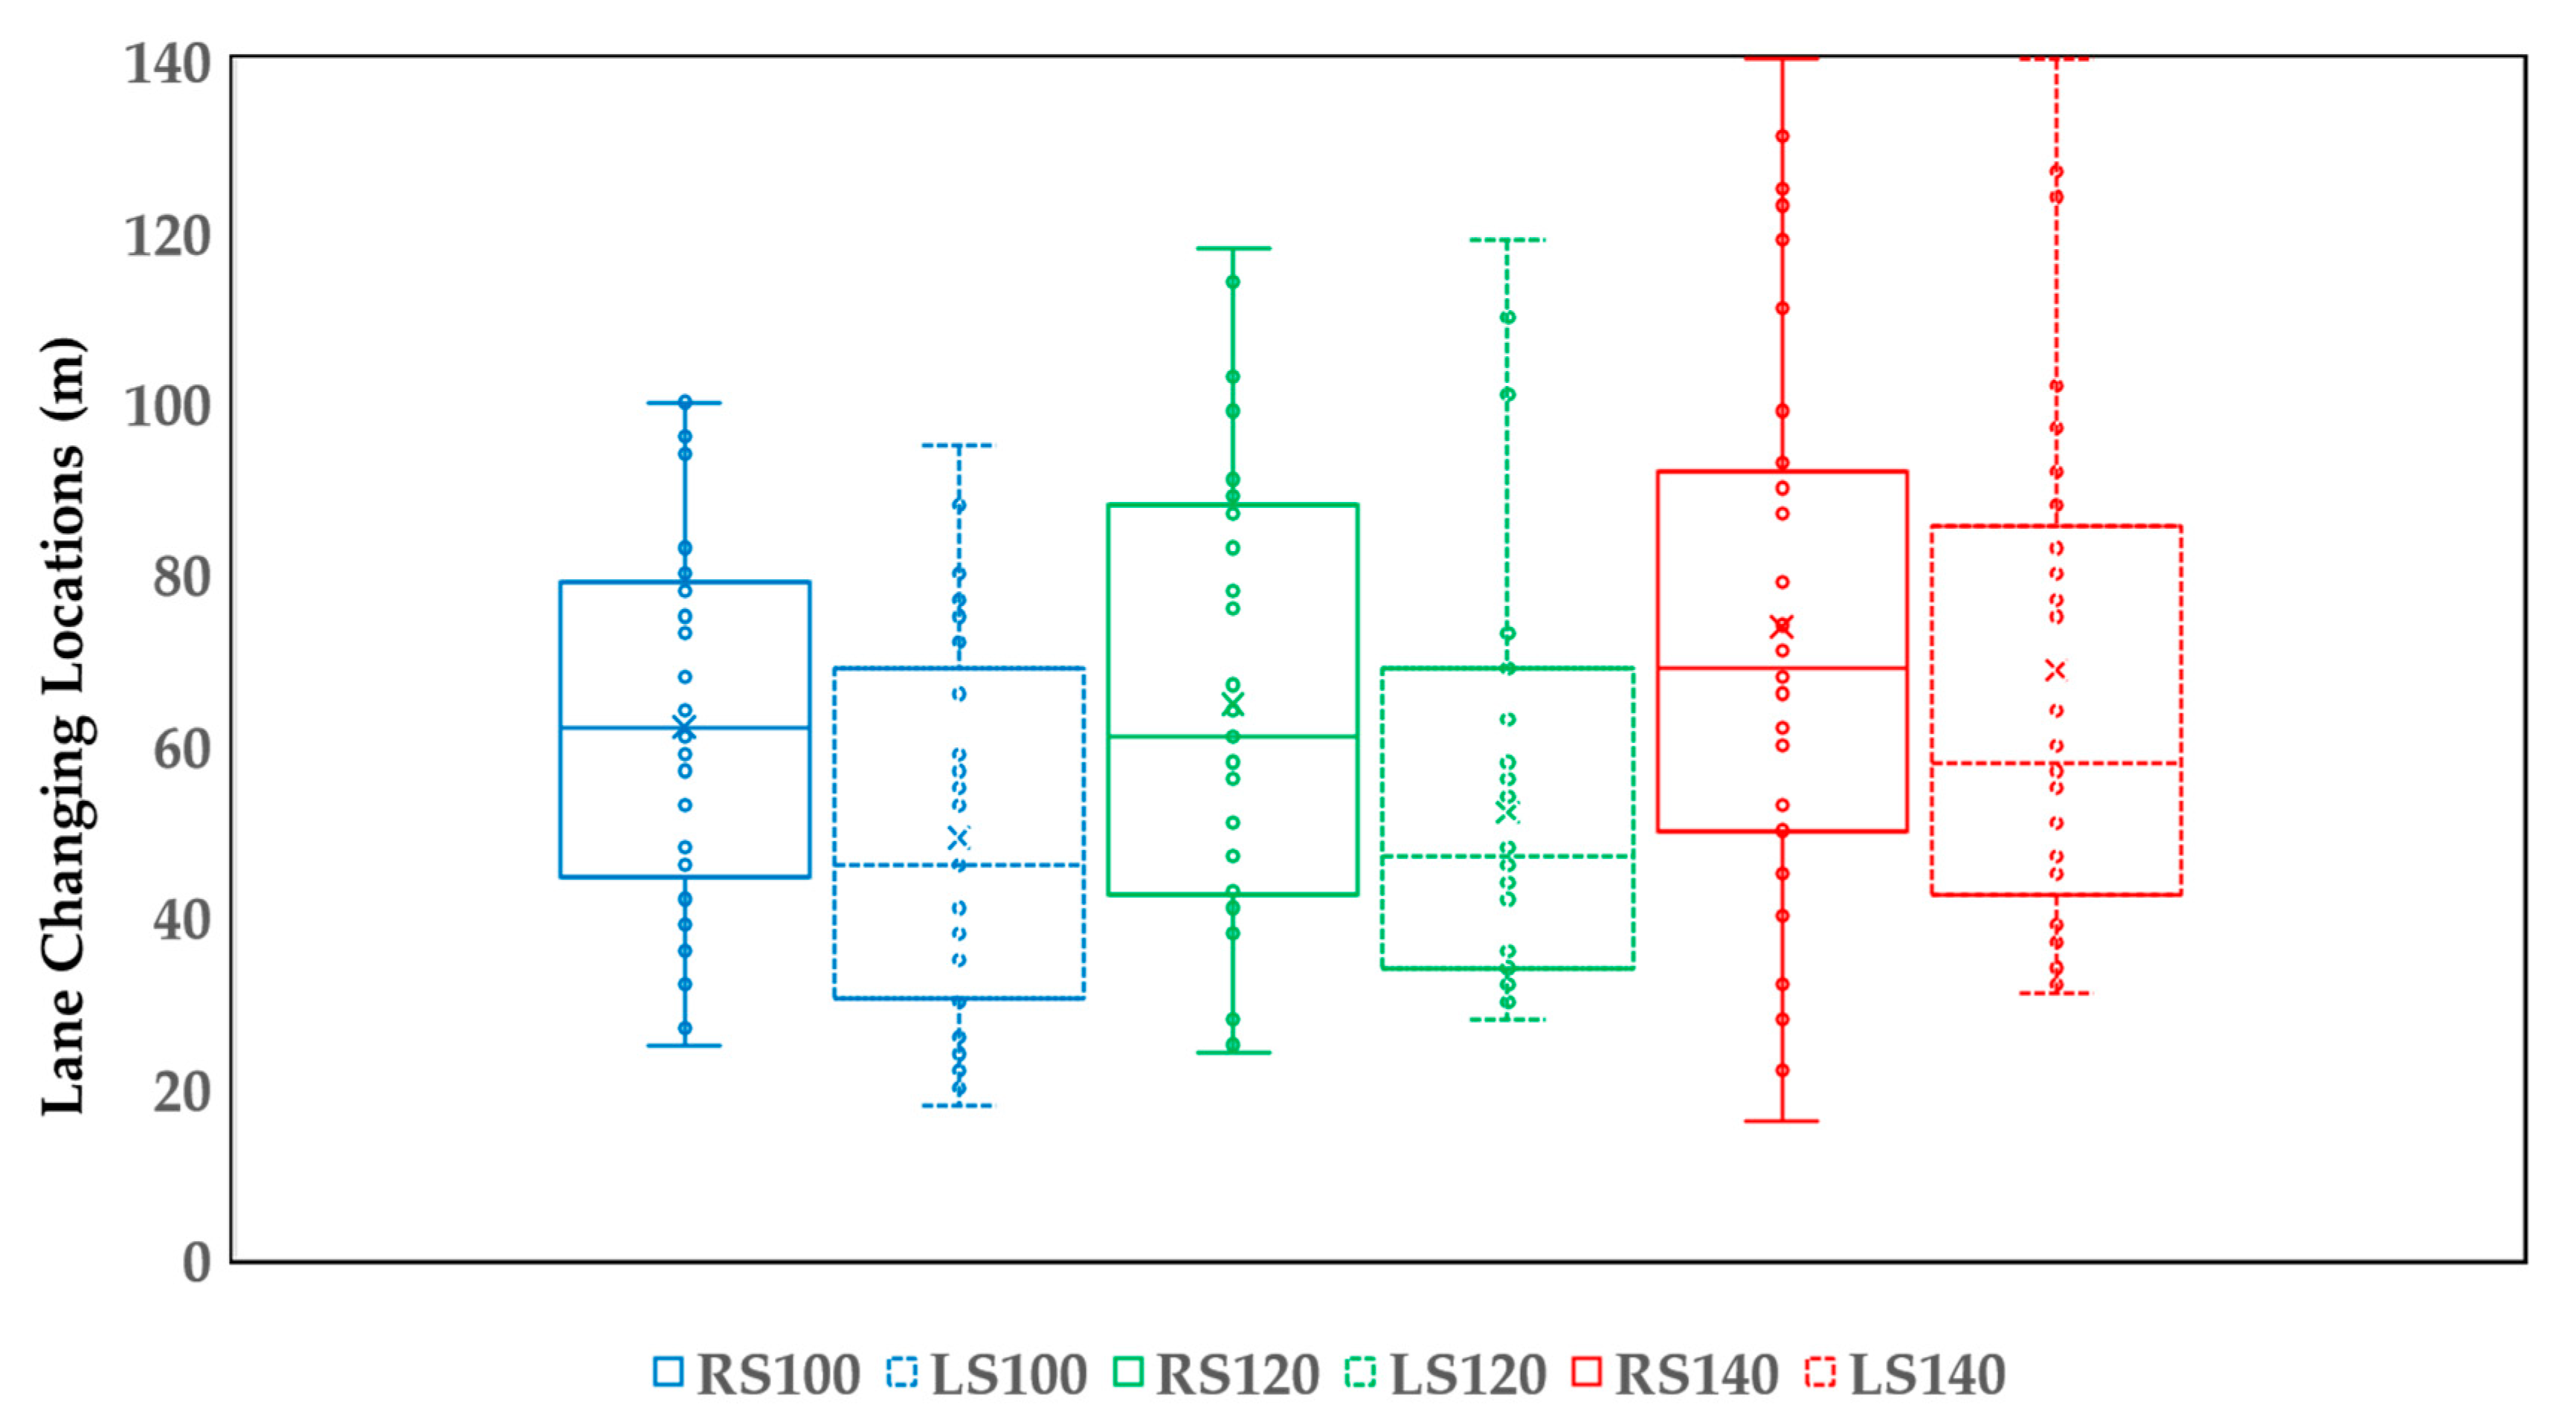
4.2. Lane Changing Behavior
4.3. Statistical Significance of Analytical Indicators
5. Discussion
6. Conclusions
Author Contributions
Funding
Institutional Review Board Statement
Informed Consent Statement
Data Availability Statement
Acknowledgments
Conflicts of Interest
References
- Cui, J.; Nelson, J.D. Underground Transport: An Overview. Tunn. Undergr. Space Technol. 2019, 87, 122–126. [Google Scholar] [CrossRef]
- Cui, J.; Allan, A.; Taylor, M.A.P.; Lin, D. The Perception of Accessibility and Ease of Orientation of Underground Pedestrian Systems: A Survey in Shanghai. Int. J. Urban Sci. 2012, 16, 301–320. [Google Scholar] [CrossRef]
- Sterling, R.; Admiraal, H.; Bobylev, N.; Parker, H.; Godard, J.-P.; Vähäaho, I.; Rogers, C.D.F.; Shi, X.; Hanamura, T. Sustainability Issues for Underground Space in Urban Areas. Proc. Inst. Civ. Eng.-Urban Des. Plan. 2012, 165, 241–254. [Google Scholar] [CrossRef]
- Sterling, R.; Nelson, P. City Resiliency and Underground Space Use. Adv. Undergr. Space Dev. 2013, 7, 43–55. [Google Scholar]
- Sterling, R. Underground Technologies for Livable Cities. Tunn. Undergr. Space Technol. 1997, 12, 479–490. [Google Scholar] [CrossRef]
- Ommati, M.; Zabihi, H. Strategic Planning for the Creation and Development of Livable Underground Spaces in Hot and Dry Climates (Case Study: Zahedan). Creat. City Des. 2021, 4, 69–78. [Google Scholar]
- Zhao, J.; Künzli, O. An Introduction to Connectivity Concept and an Example of Physical Connectivity Evaluation for Underground Space. Tunn. Undergr. Space Technol. 2016, 55, 205–213. [Google Scholar] [CrossRef]
- Ma, C.-X.; Peng, F.-L. Some Aspects on the Planning of Complex Underground Roads for Motor Vehicles in Chinese Cities. Tunn. Undergr. Space Technol. 2018, 82, 592–612. [Google Scholar] [CrossRef]
- PIARC. Road Tunnels: Complex Underground Road Networks; Report 2016.R19.EN; World Road Association: Nanterre, France, 2016. [Google Scholar]
- National Research Council; Division on Earth; Life Studies; Board on Earth Sciences; Committee on Geological; Geotechnical Engineering; Committee on Underground Engineering for Sustainable Development. Underground Engineering for Sustainable Urban Development; National Academies Press: Washington, DC, USA, 2013. [Google Scholar]
- Jeong, S.; Song, M.; Hwang, S.; Lee, D.; Kwon, W. An Investigation for Driving Behavior on the exit-ramp Terminal in urban Underground Roads using a Driving Simulator. J. Korea Inst. Intell. Transp. Syst. 2022, 21, 123–140. [Google Scholar] [CrossRef]
- Shimojo, A.; Takagi, H.; Onuma, H. A Simulation Study of Driving Performance in Long Tunnel. In Proceedings of the Pacific Rim TransTech Conference. 1995 Vehicle Navigation and Information Systems Conference Proceedings. 6th International VNIS. A Ride into the Future, Seattle, WA, USA, 30 July–2 August 1995; pp. 96–103. [Google Scholar]
- Wang, Y.-W.; Kum, K.-J.; Son, S.-N.; Yu, J.-S. A Study on Development Evaluation Modeling Internal Landscape in Tunnel Considering Human Sensitivity Engineering. Int. J. Highw. Eng. 2010, 12, 9–20. [Google Scholar]
- Zhao, L.; Jiang, H.-P.; Hu, J.-B. Driver’s Physiological and Mental Reaction in Tunnel. In Proceedings of the ICCTP 2011: Towards Sustainable Transportation Systems, Nanjing, China, 14–17 August 2011; pp. 1760–1766. [Google Scholar]
- Calvi, A.; D’amico, F. A Study of the Effects of Road Tunnel on Driver Behavior and Road Safety using Driving Simulator. Adv. Transp. Stud. 2013, 30, 59–76. [Google Scholar]
- Chen, W.; Zhao, Q.; Peng, W.; Di, S.; Sun, C.; Guo, D. Alignment Design of Underground Road: A Simulator Study. IOP Conf. Ser. Earth Environ. Sci. 2021, 787, 012116. [Google Scholar] [CrossRef]
- Yao, Q.; Liu, S.; Liu, Y. Vehicle Operation Characteristic Under Different Ramp Entrance Conditions in Underground Road: Analysis, Simulation and Modelling. AIP Conf. Proc. 2018, 1967, 040006. [Google Scholar]
- Huang, Y.; Chen, F.; Song, M.; Pan, X.; You, K. Effect Evaluation of Traffic Guidance in Urban Underground Road Diverging and Merging Areas: A Simulator Study. Accid. Anal. Prev. 2023, 186, 107036. [Google Scholar] [CrossRef] [PubMed]
- Kou, C.-C.; Machemehl, R.B. Modeling Vehicle Acceleration Deceleration Behavior during Merge Maneuvers. Can. J. Civ. Eng. 1997, 24, 350–358. [Google Scholar] [CrossRef]
- Fang, S.; Ma, J. Experimental Analysis of Driver Visual Characteristics in Urban Tunnels. Appl. Sci. 2021, 11, 4274. [Google Scholar] [CrossRef]
- Yeung, J.S.; Wong, Y.D.; Xu, H. Driver Perspectives of Open and Tunnel Expressways. J. Environ. Psychol. 2013, 36, 248–256. [Google Scholar] [CrossRef]
- Liu, Y. A Study on Merging and Diverging Area Design for Urban Underground Expressway. Procedia Eng. 2016, 165, 175–183. [Google Scholar] [CrossRef]
- Ahammed, M.A.; Hassan, Y.; Sayed, T.A. Modeling Driver Behavior and Safety on Freeway Merging Areas. J. Transp. Eng. 2008, 134, 370–377. [Google Scholar] [CrossRef]
- Suzuki, K.; Imada, K.; Matsumura, Y. A Study of Collision Risk Estimation and Users Evaluation at Merging Section of Urban Expressway in Japan. Transp. Res. Procedia 2016, 15, 783–793. [Google Scholar] [CrossRef]
- Eustace, D.; Aylo, A.; Mergia, W.Y. Crash Frequency Analysis of Left-Side Merging and Diverging Areas on Urban Freeway segments–A Case Study of I-75 through Downtown Dayton, Ohio. Transp. Res. Part C Emerg. Technol. 2015, 50, 78–85. [Google Scholar] [CrossRef]
- Elvik, R.; Christensen, P.; Amundsen, A.H. Speed and Road Accidents: An Evaluation of the Power Model. 2004. Available online: https://www.toi.no/getfile.php/131007/Publikasjoner/T%C3%98I%20rapporter/2004/740-2004/740-2004.pdf (accessed on 14 July 2024).
- Aarts, L.; Van Schagen, I. Driving Speed and the Risk of Road Crashes: A Review. Accid. Anal. Prev. 2006, 38, 215–224. [Google Scholar] [CrossRef] [PubMed]
- Blaauw, G.J.; Van der Horst, A.R.A. Lateral Positioning Behaviour of Car Drivers Near Tunnels-Final Report (Report IZF 1982 C-30); TNO Institute for Perception: Soesterberg, The Netherlands, 1982. [Google Scholar]
- Jeong, S.; Kim, S.; Lee, D.; Jung, G. An Investigation for Driving Behavior on the On-Ramp Merging Section in Urban Underground Roads Using a Driving Simulator. J. Korea Inst. Intell. Transp. Syst. 2022, 21, 97–114. [Google Scholar] [CrossRef]
- Lee, G.; Hwang, S.; Lee, D. Improvements of Warning Signs for Black Ice Based on Driving Simulator Experiments. Int. J. Environ. Res. Public Health 2022, 19, 7549. [Google Scholar] [CrossRef]
- Pan, Y.; Zhang, Q.; Zhang, Y.; Ge, X.; Gao, X.; Yang, S.; Xu, J. Lane-Change Intention Prediction using Eye-Tracking Technology: A Systematic Review. Appl. Ergon. 2022, 103, 103775. [Google Scholar] [CrossRef]


| Comparison Group | Scenarios | Mean (km/h) | S.D. (km/h) | Paired Differences | |||
|---|---|---|---|---|---|---|---|
| Mean | t | p-Value | |||||
| Right side and left side | RS100 | 3.73 | 4.09 | −6.00 | −3.99 | 0.000 * | |
| LS100 | 9.73 | 9.18 | |||||
| RS120 | 2.83 | 3.22 | −4.83 | −3.65 | 0.001 * | ||
| LS120 | 7.66 | 6.54 | |||||
| RS140 | 2.33 | 2.70 | −2.37 | −3.52 | 0.001 * | ||
| LS140 | 4.71 | 3.18 | |||||
| Length of acceleration lane | Right side | RS100 | 3.73 | 4.09 | 0.90 | 1.02 | 0.316 |
| RS120 | 2.83 | 3.22 | |||||
| RS120 | 2.83 | 3.22 | 0.50 | 0.68 | 0.502 | ||
| RS140 | 2.33 | 2.70 | |||||
| Left- side | LS100 | 9.73 | 9.18 | 2.07 | 3.09 | 0.004 * | |
| LS120 | 7.66 | 6.54 | |||||
| LS120 | 7.66 | 6.54 | 2.95 | 2.64 | 0.013 * | ||
| LS140 | 4.71 | 3.18 | |||||
| Comparison Group | Scenarios | Mean (m/s2) | S.D. (m/s2) | Paired Differences | |||
|---|---|---|---|---|---|---|---|
| Mean | t | p-Value | |||||
| Right side and left side | RS100 | 0.42 | 0.26 | −0.26 | −3.05 | 0.004 * | |
| LS100 | 0.68 | 0.43 | |||||
| RS120 | 0.46 | 0.24 | −0.04 | −0.56 | 0.577 | ||
| LS120 | 0.50 | 0.30 | |||||
| RS140 | 0.39 | 0.21 | 0.02 | 0.29 | 0.772 | ||
| LS140 | 0.37 | 0.22 | |||||
| Length of acceleration lane | Right side | RS100 | 0.42 | 0.26 | −0.04 | −0.78 | 0.443 |
| RS120 | 0.46 | 0.24 | |||||
| RS120 | 0.46 | 0.24 | 0.07 | 1.47 | 0.151 | ||
| RS140 | 0.39 | 0.21 | |||||
| Left side | LS100 | 0.68 | 0.43 | 0.18 | 3.85 | 0.000 * | |
| LS120 | 0.50 | 0.30 | |||||
| LS120 | 0.50 | 0.30 | 0.13 | 2.23 | 0.032 * | ||
| LS140 | 0.37 | 0.22 | |||||
| Comparison Group | Scenarios | Mean (m/s2) | S.D. (m/s2) | Paired Differences | |||
|---|---|---|---|---|---|---|---|
| Mean | t | p-Value | |||||
| Right side and left side | RS100 | 0.45 | 0.18 | −0.12 | −2.24 | 0.032 * | |
| LS100 | 0.57 | 0.32 | |||||
| RS120 | 0.38 | 0.14 | −0.02 | −0.49 | 0.626 | ||
| LS120 | 0.40 | 0.19 | |||||
| RS140 | 0.37 | 0.20 | 0.15 | 4.26 | 0.000 * | ||
| LS140 | 0.21 | 0.07 | |||||
| Length of acceleration lane | Right side | RS100 | 0.45 | 0.18 | 0.08 | 2.07 | 0.046 * |
| RS120 | 0.38 | 0.14 | |||||
| RS120 | 0.38 | 0.14 | 0.01 | 0.30 | 0.765 | ||
| RS140 | 0.37 | 0.20 | |||||
| Left side | LS100 | 0.57 | 0.32 | 0.18 | 5.68 | 0.000 * | |
| LS120 | 0.40 | 0.19 | |||||
| LS120 | 0.40 | 0.19 | 0.18 | 5.26 | 0.000 * | ||
| LS140 | 0.21 | 0.07 | |||||
| Comparison Group | Scenarios | Mean (m) | S.D. (m) | Paired Differences | |||
|---|---|---|---|---|---|---|---|
| Mean | t | p-Value | |||||
| Right side and left side | RS100 | 62.09 | 21.35 | 12.9 | 2.50 | 0.018 * | |
| LS100 | 49.23 | 22.69 | |||||
| RS120 | 64.74 | 26.81 | 12.6 | 2.36 | 0.024 * | ||
| LS120 | 52.17 | 22.91 | |||||
| RS140 | 73.74 | 33.06 | 5.00 | 0.64 | 0.529 | ||
| LS140 | 68.74 | 31.88 | |||||
| Length of acceleration lane | Right side | RS100 | 62.09 | 21.35 | −2.7 | −0.62 | 0.542 |
| RS120 | 64.74 | 26.81 | |||||
| RS120 | 64.74 | 26.81 | −9.0 | −1.30 | 0.204 | ||
| RS140 | 73.74 | 33.06 | |||||
| Left side | LS100 | 49.23 | 22.69 | −2.9 | −0.64 | 0.529 | |
| LS120 | 52.17 | 22.91 | |||||
| LS120 | 52.17 | 22.91 | −16.6 | −2.67 | 0.012 * | ||
| LS140 | 68.74 | 31.88 | |||||
Disclaimer/Publisher’s Note: The statements, opinions and data contained in all publications are solely those of the individual author(s) and contributor(s) and not of MDPI and/or the editor(s). MDPI and/or the editor(s) disclaim responsibility for any injury to people or property resulting from any ideas, methods, instructions or products referred to in the content. |
© 2024 by the authors. Licensee MDPI, Basel, Switzerland. This article is an open access article distributed under the terms and conditions of the Creative Commons Attribution (CC BY) license (https://creativecommons.org/licenses/by/4.0/).
Share and Cite
Jeong, S.; Lee, D. Driving Behavior Characteristics of Merging Sections in the Urban Underground Road Junction: A Driving Simulator Study. Appl. Sci. 2024, 14, 6247. https://doi.org/10.3390/app14146247
Jeong S, Lee D. Driving Behavior Characteristics of Merging Sections in the Urban Underground Road Junction: A Driving Simulator Study. Applied Sciences. 2024; 14(14):6247. https://doi.org/10.3390/app14146247
Chicago/Turabian StyleJeong, Seungwon, and Dongmin Lee. 2024. "Driving Behavior Characteristics of Merging Sections in the Urban Underground Road Junction: A Driving Simulator Study" Applied Sciences 14, no. 14: 6247. https://doi.org/10.3390/app14146247
APA StyleJeong, S., & Lee, D. (2024). Driving Behavior Characteristics of Merging Sections in the Urban Underground Road Junction: A Driving Simulator Study. Applied Sciences, 14(14), 6247. https://doi.org/10.3390/app14146247