
Evaluation of Hydrogen Generation with Hybrid Renewable Energy Sources


Abstract
1. Introduction
1.1. Background
1.2. Literature Survey
1.2.1. Steam Methane Reforming (SMR)
1.2.2. Coal Gasification
1.2.3. Waste Gasification
1.2.4. Electrolysis
- Electrolyte Optimization: Improving ionic conductivity and addressing carbonate formation in electrodes to enhance the efficiency of alkaline systems.
- Electrode Design: Focusing on optimizing the surface area and structure of electrodes, as well as ensuring durability under a high current density during hydrogen generation.
- System Integration and Scale-Up: Transitioning from laboratory-scale to industrial-scale production and integrating with renewable energy sources.
- Environmental and Economic Assessment: Conducting lifecycle analyses and exploring cost reduction strategies for hydrogen production.
- Advanced Diagnostics and Real-Time Monitoring: Developing advanced tools for real-time monitoring and diagnostics.
- Hydrogen Purity: Finding efficient methods to purify hydrogen produced through alkaline processes to meet application-specific purity standards.
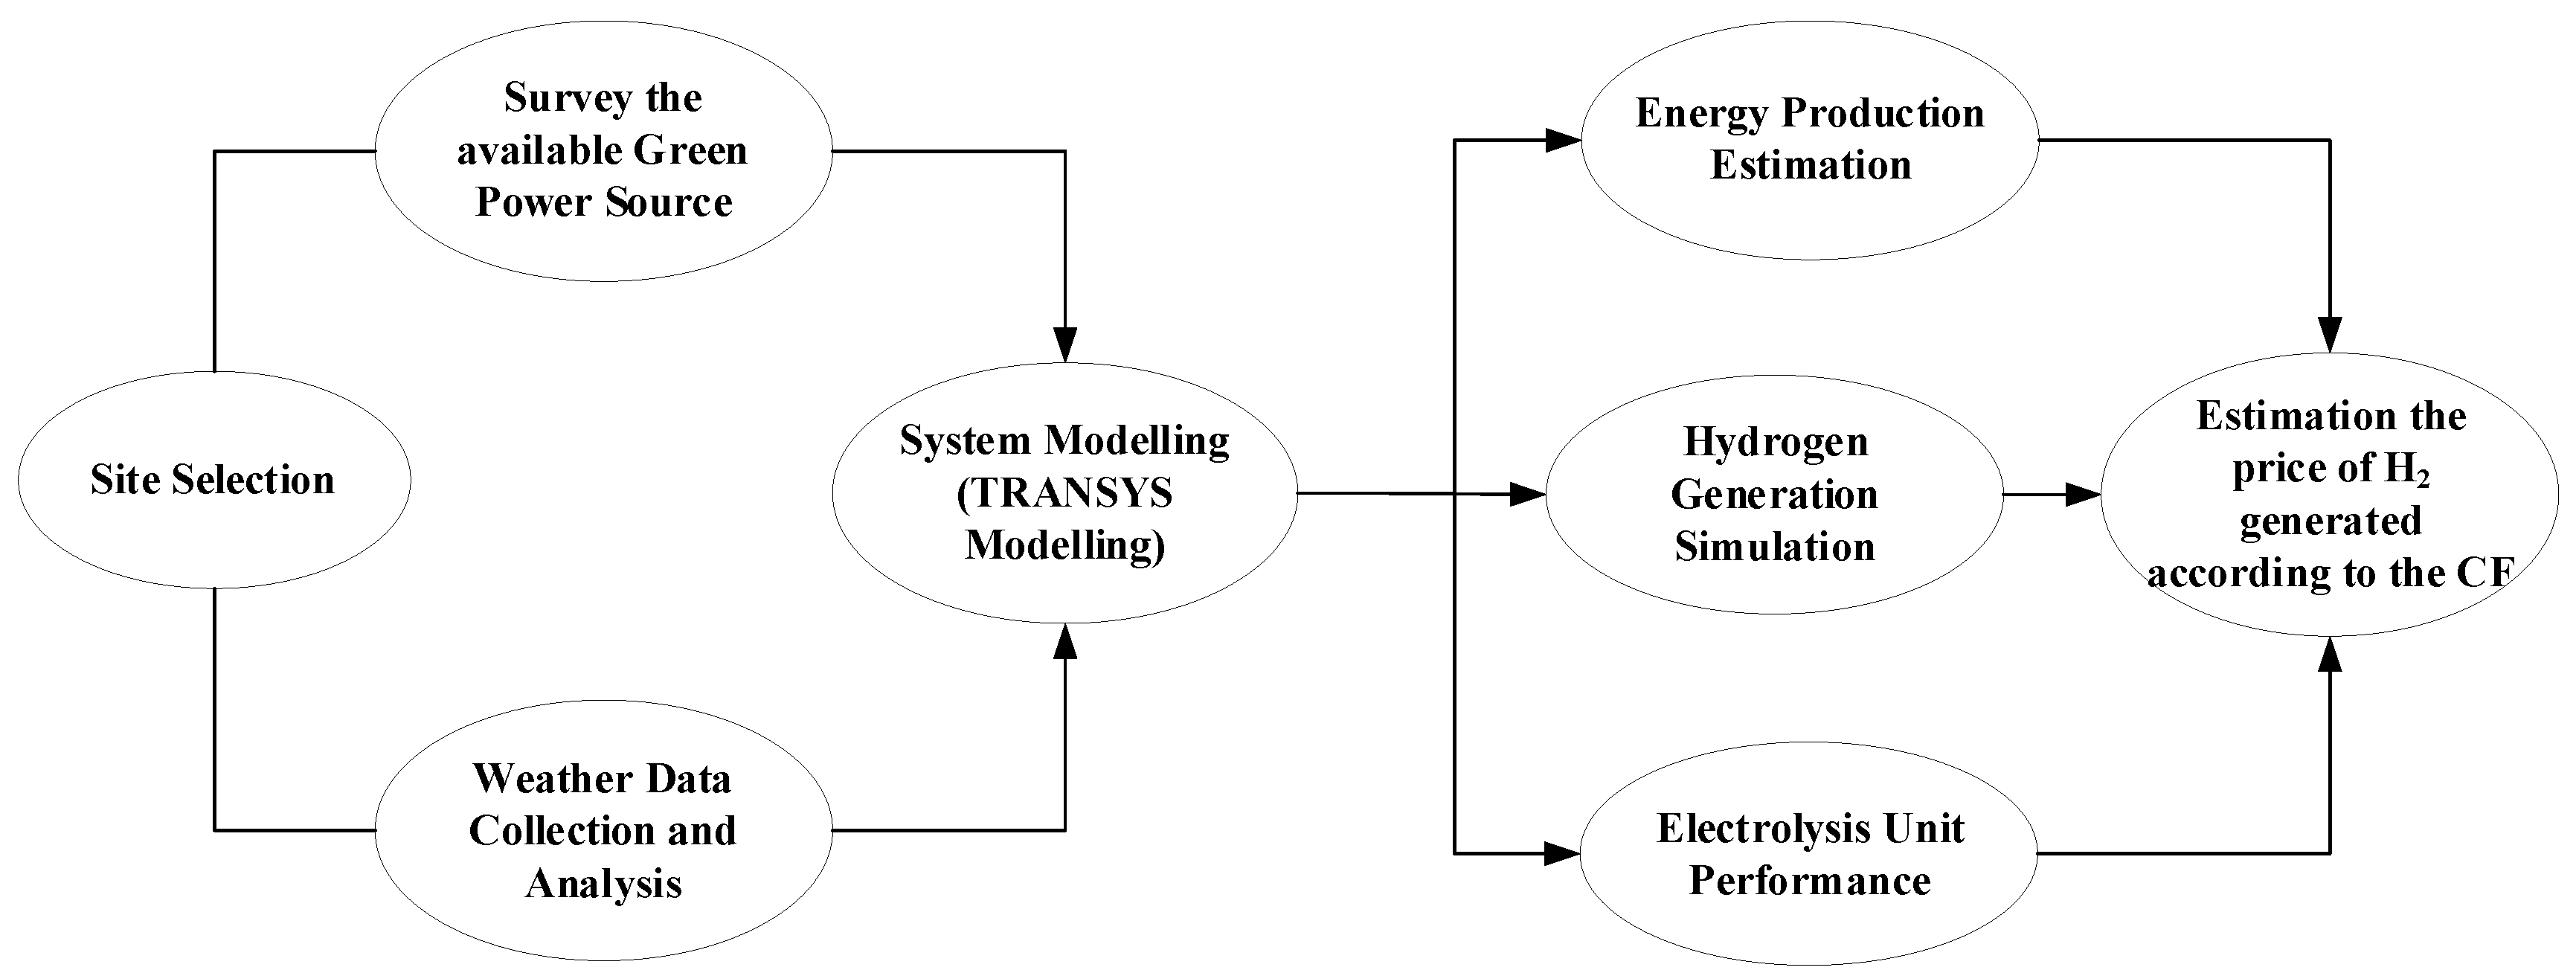
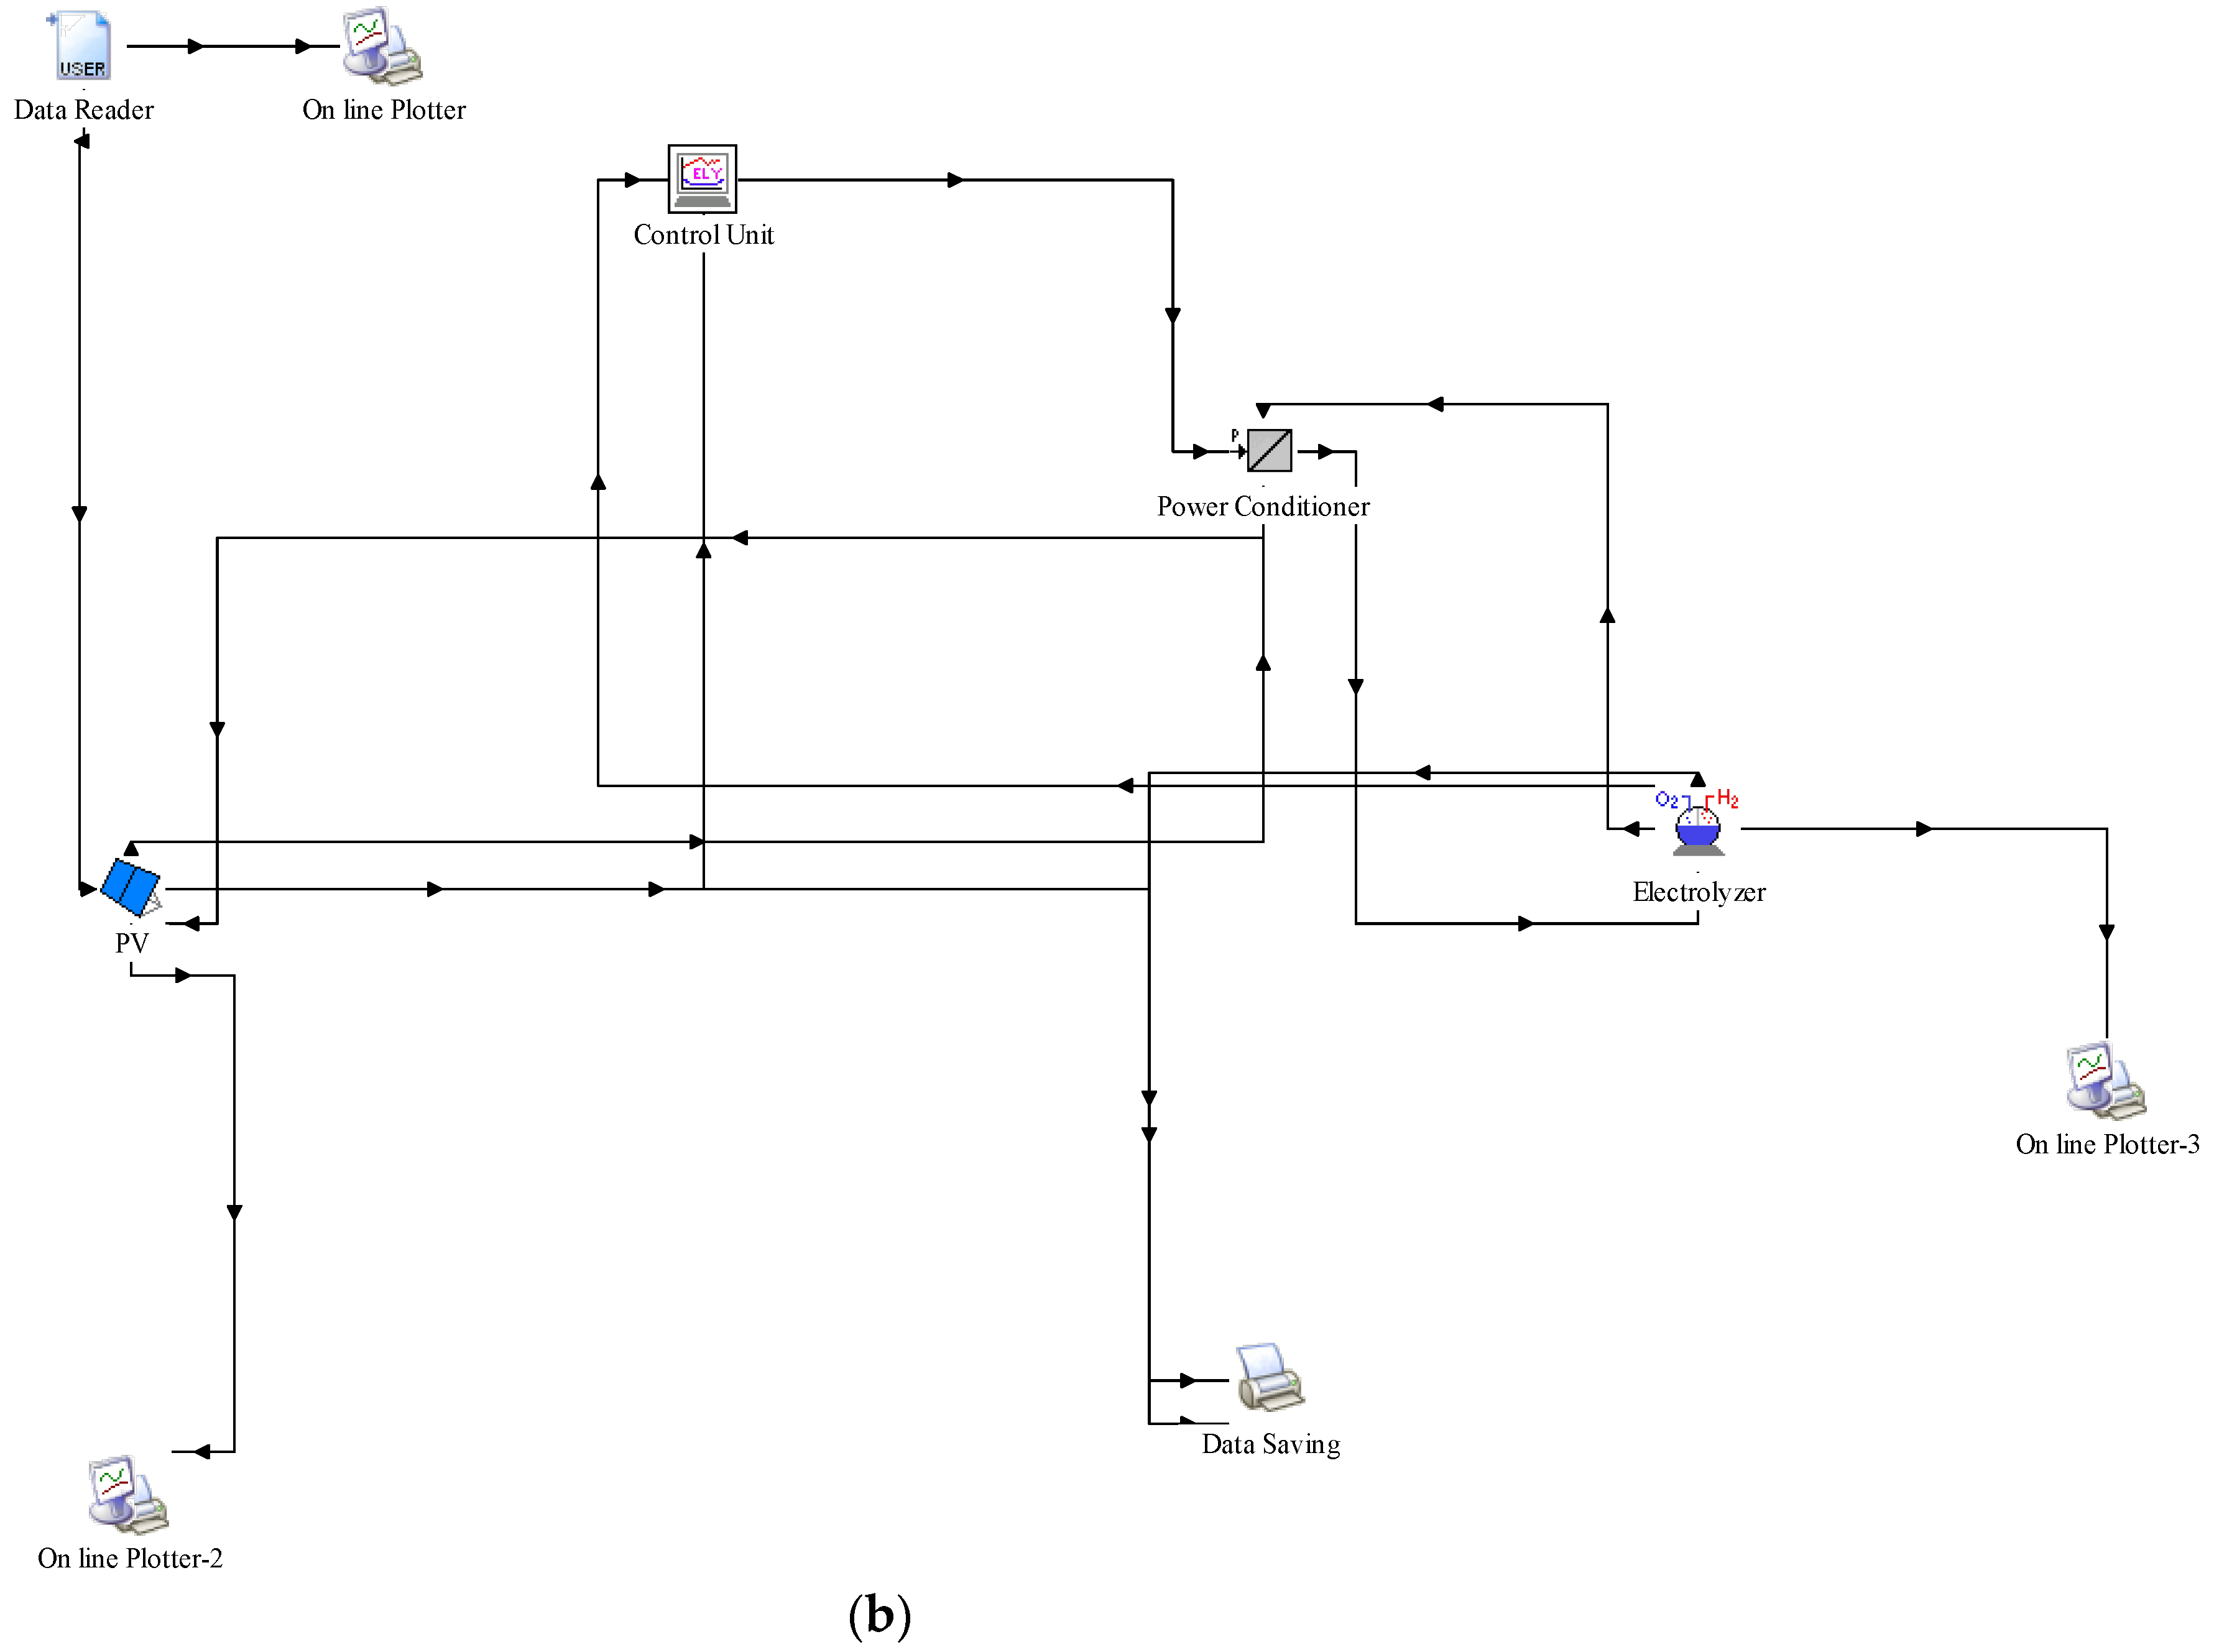
2. TRNSYS Modelling
- Components, Configuration, and Input Data
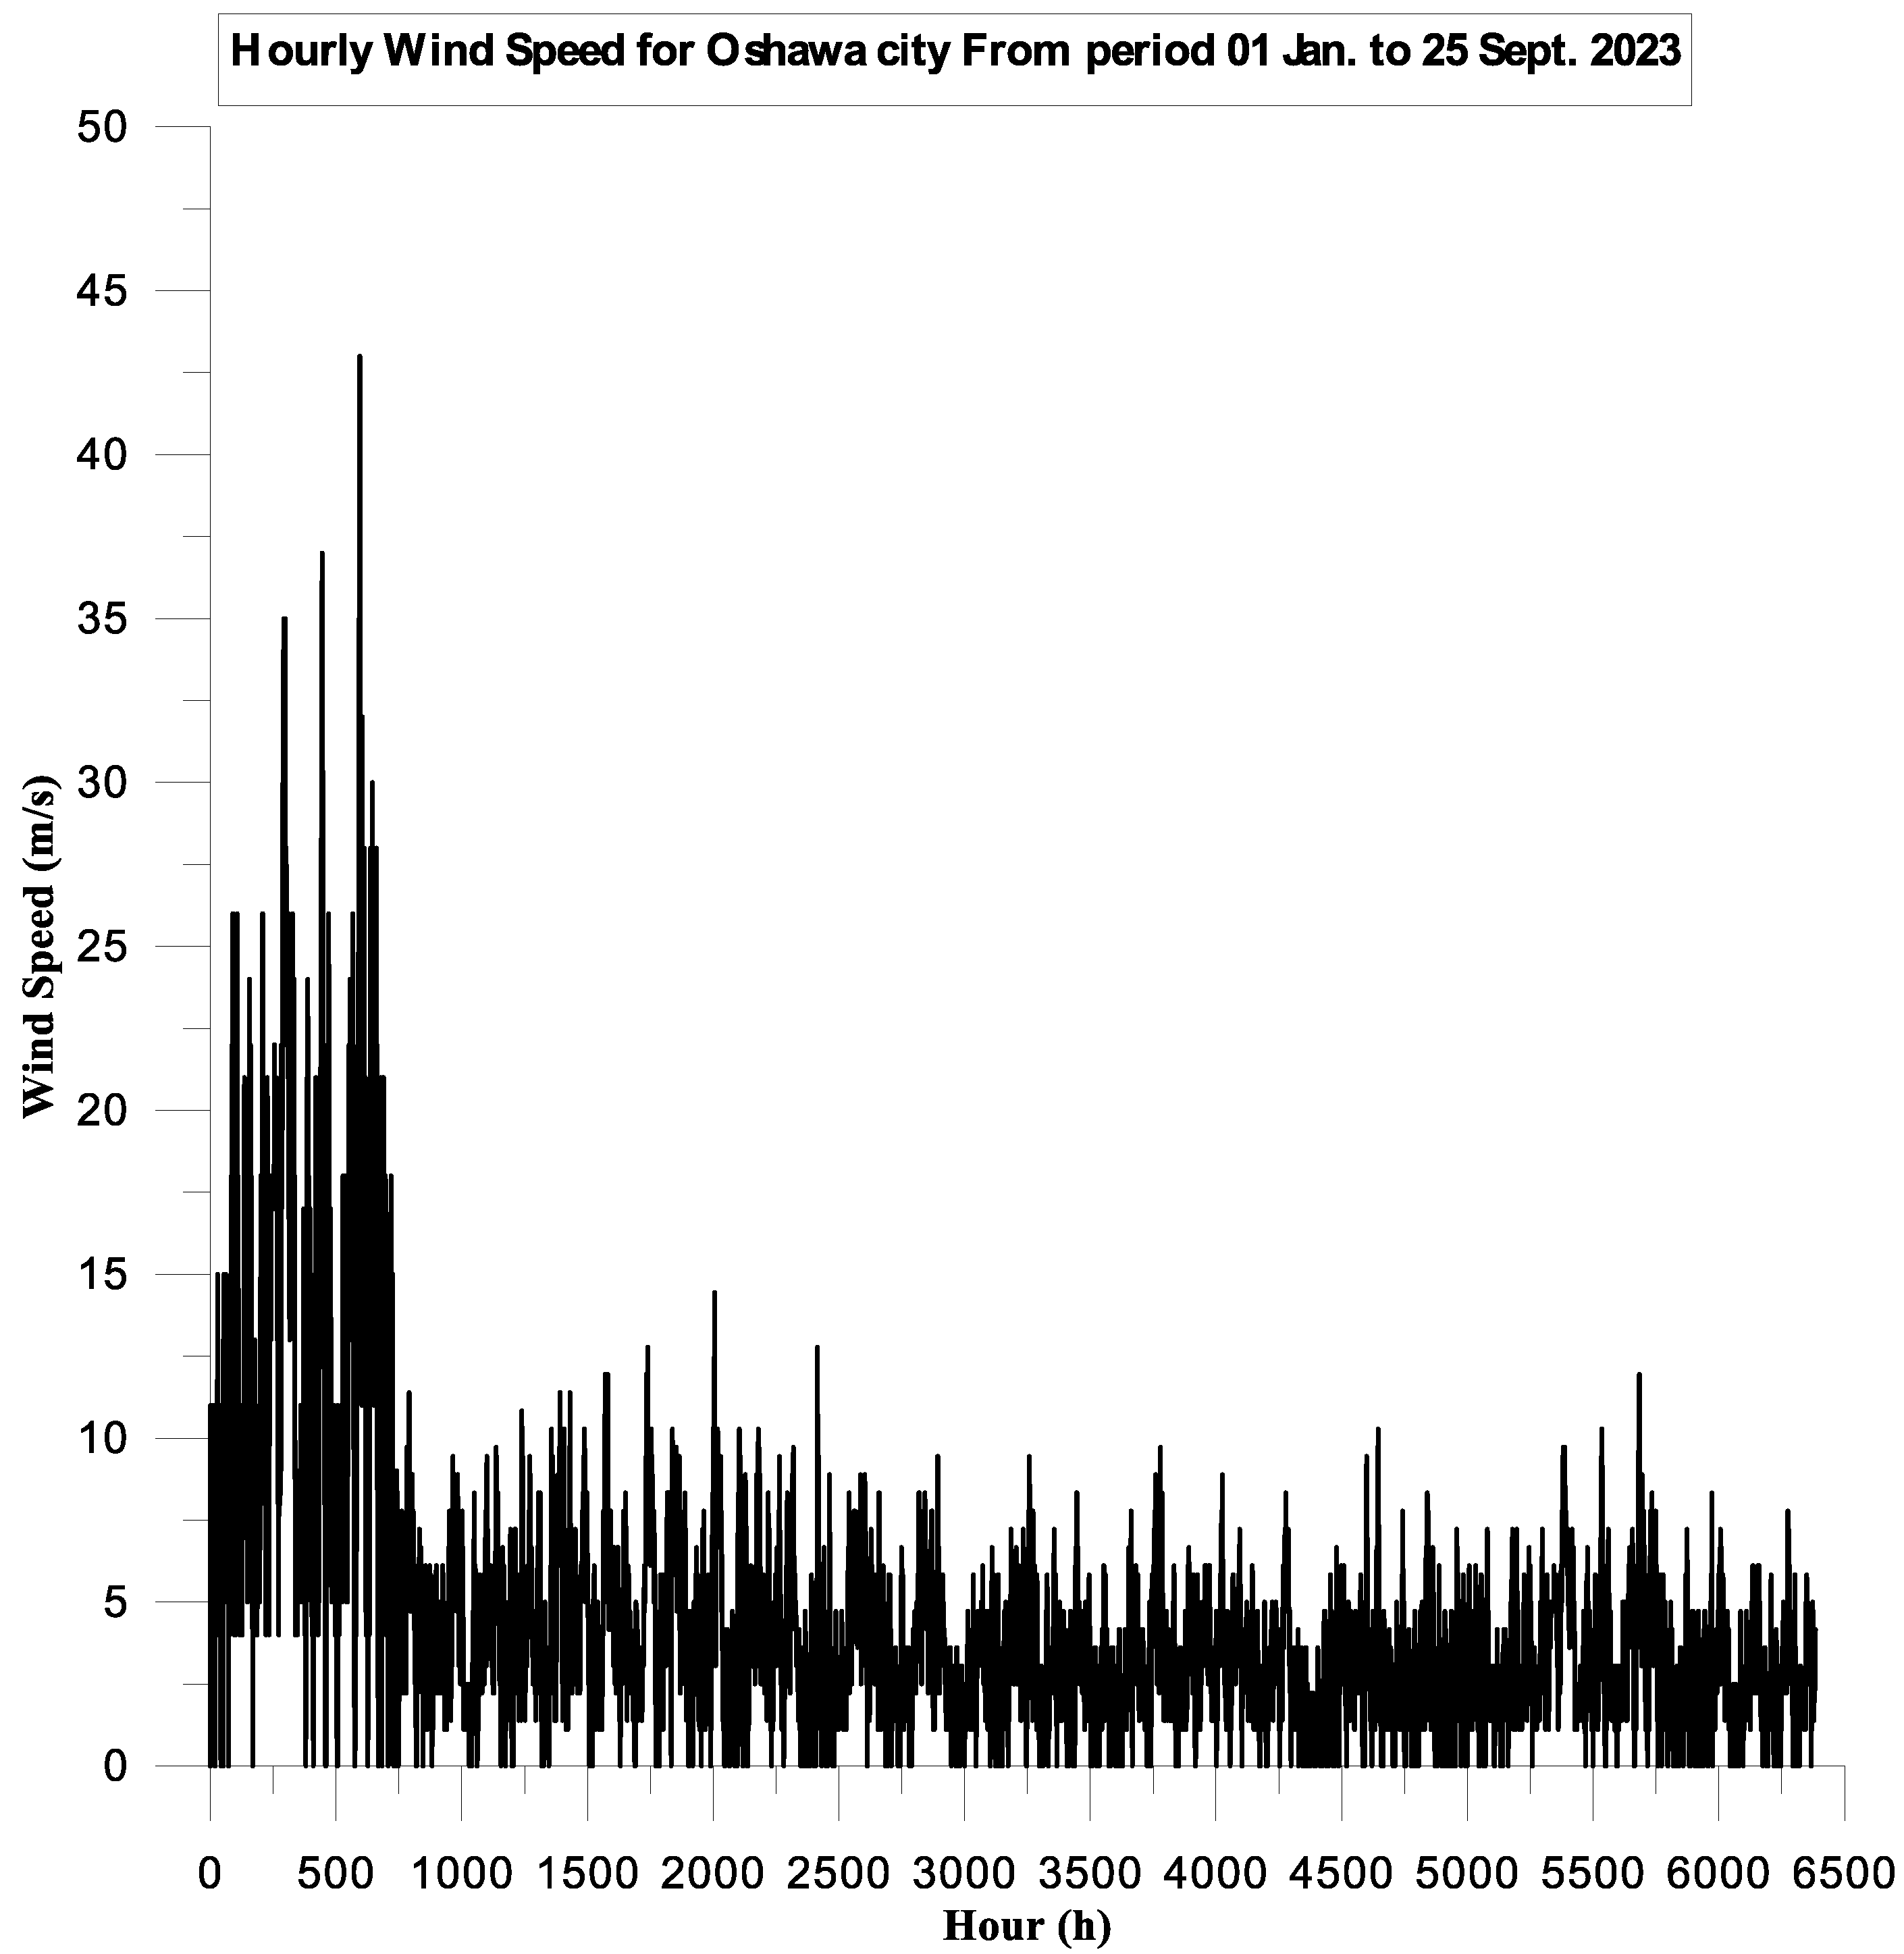
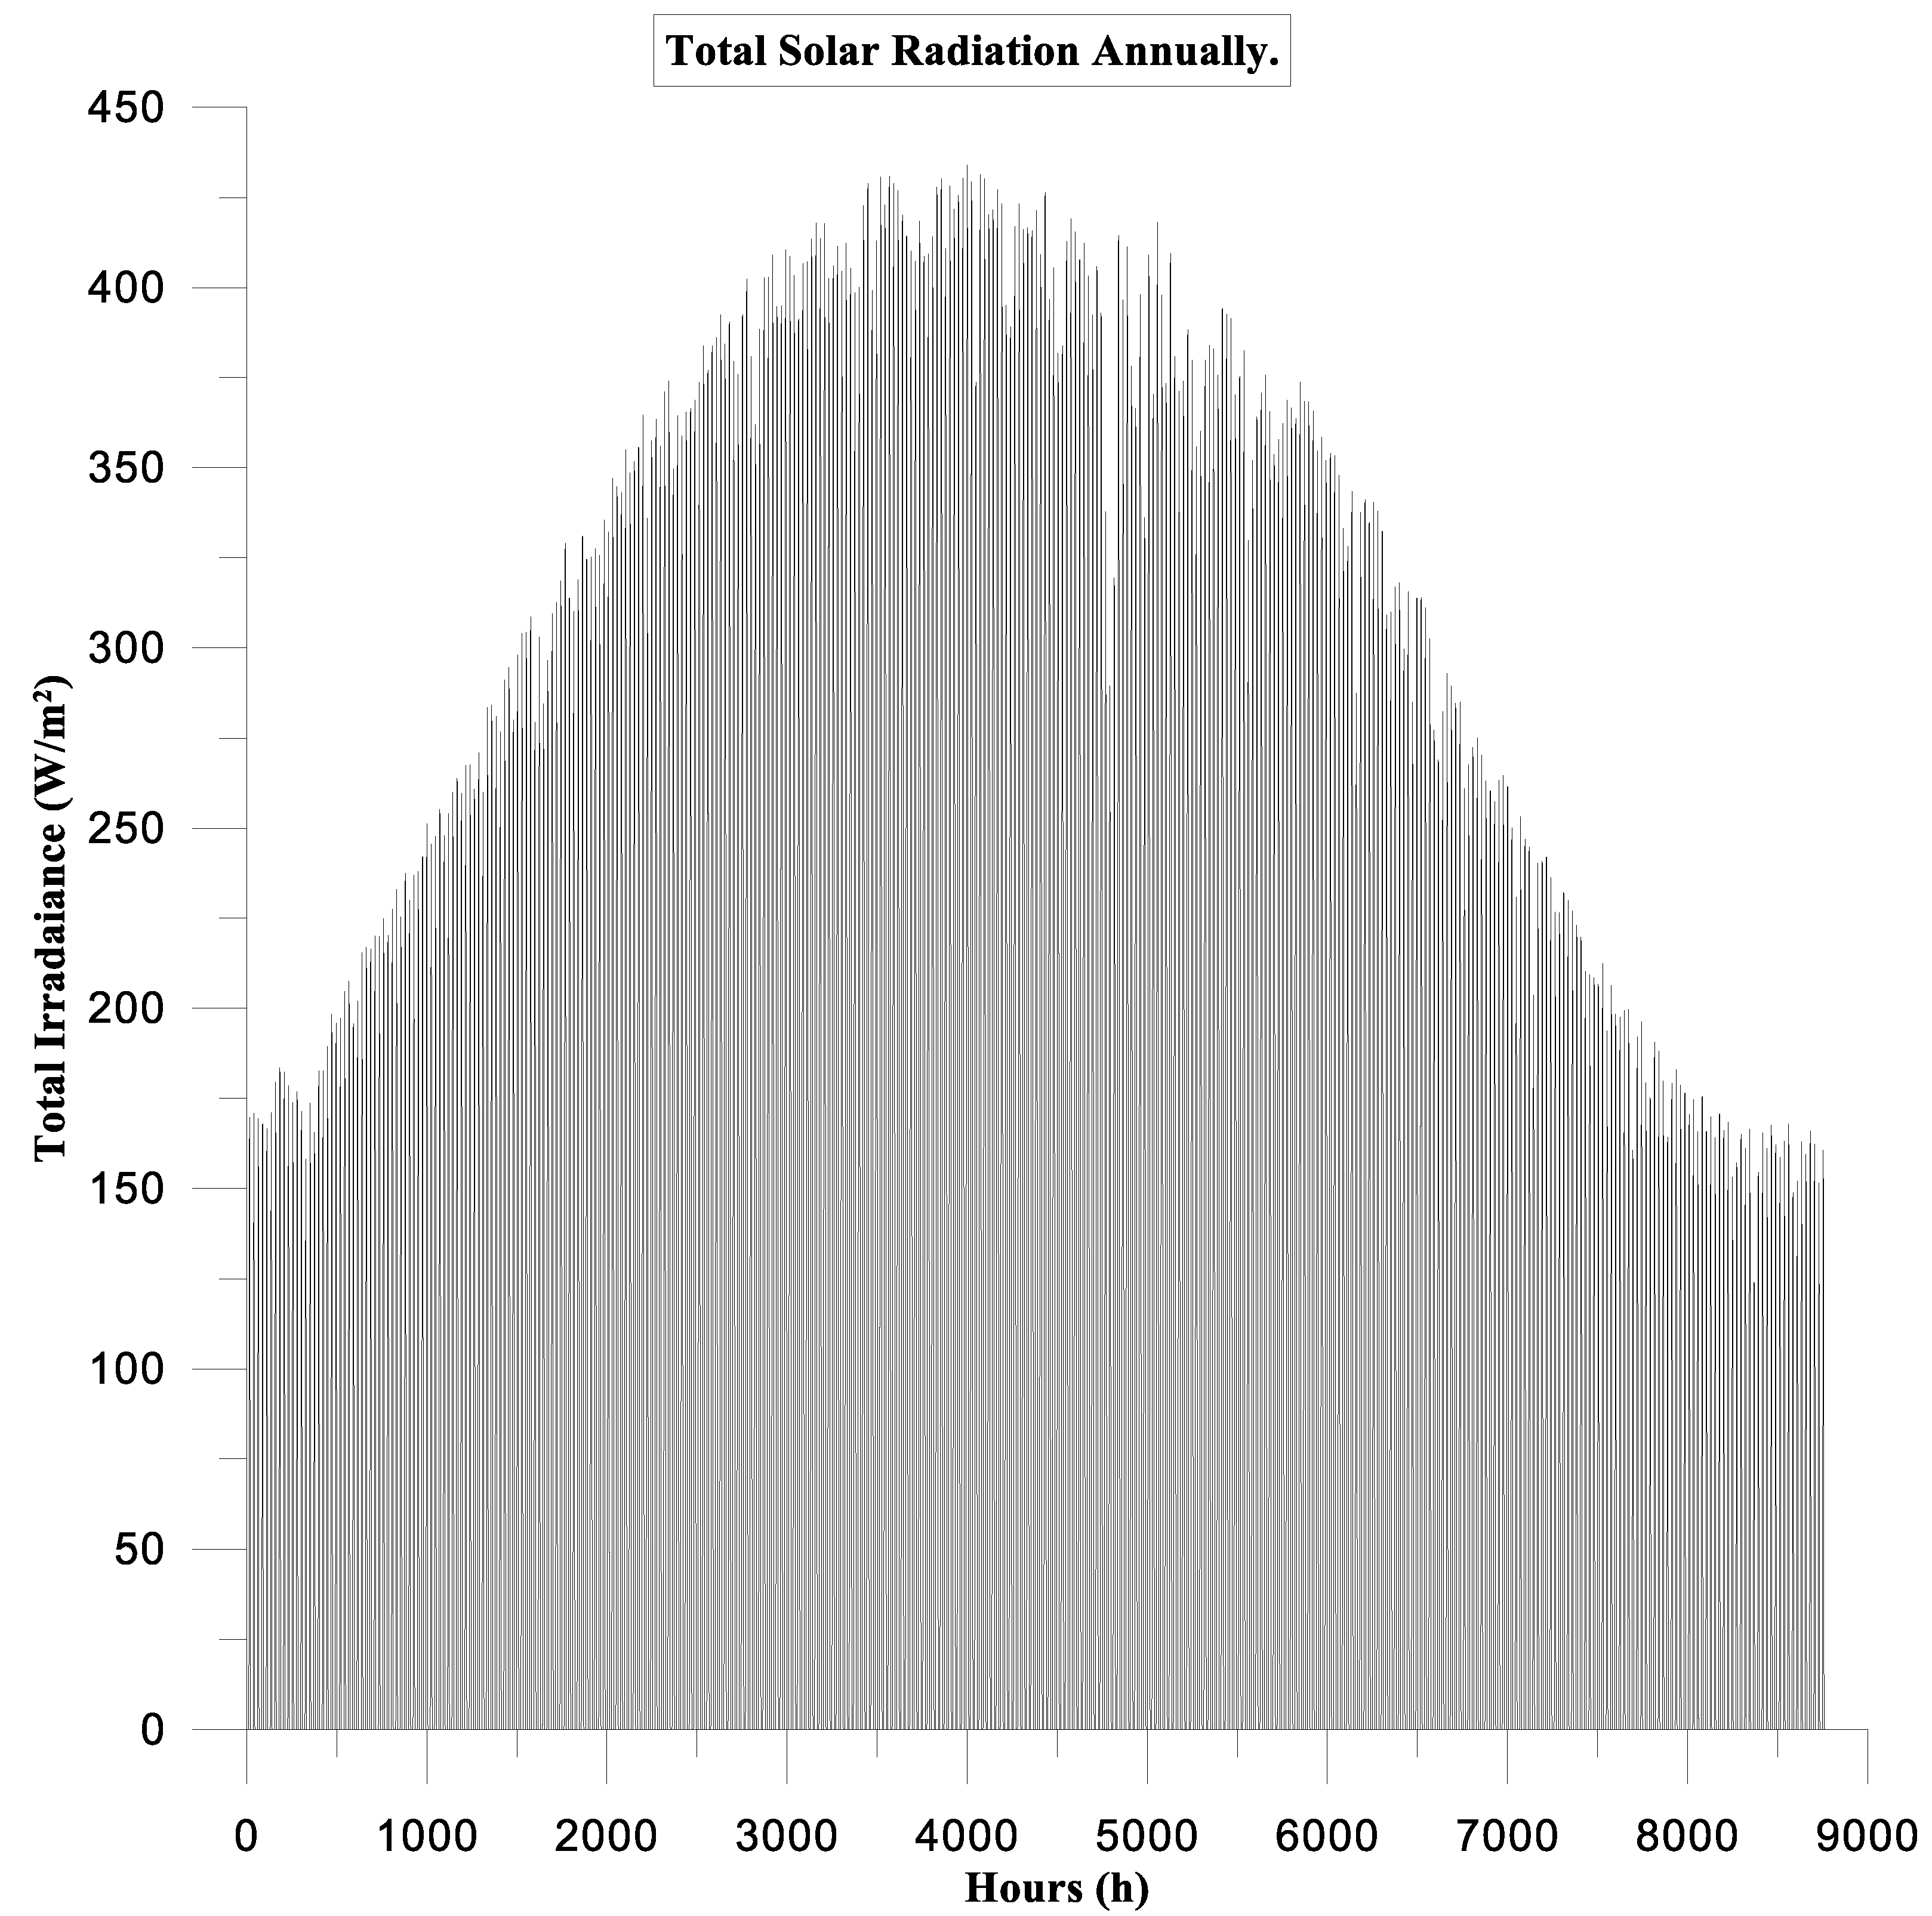
- Weather Data Import
- -
- Purpose: To import and process weather data, including solar radiation, wind speed, temperature, and other relevant meteorological parameters.
- -
- Configuration: Import weather data files.
- Solar Photovoltaic (PV) System
- -
- Function: To simulate the electrical output of a solar PV array based on incident solar radiation and cell temperature.
- -
- Configuration: Define PV module characteristics (e.g., efficiency, area, tilt angle). Connect to the weather data component to receive solar radiation input.
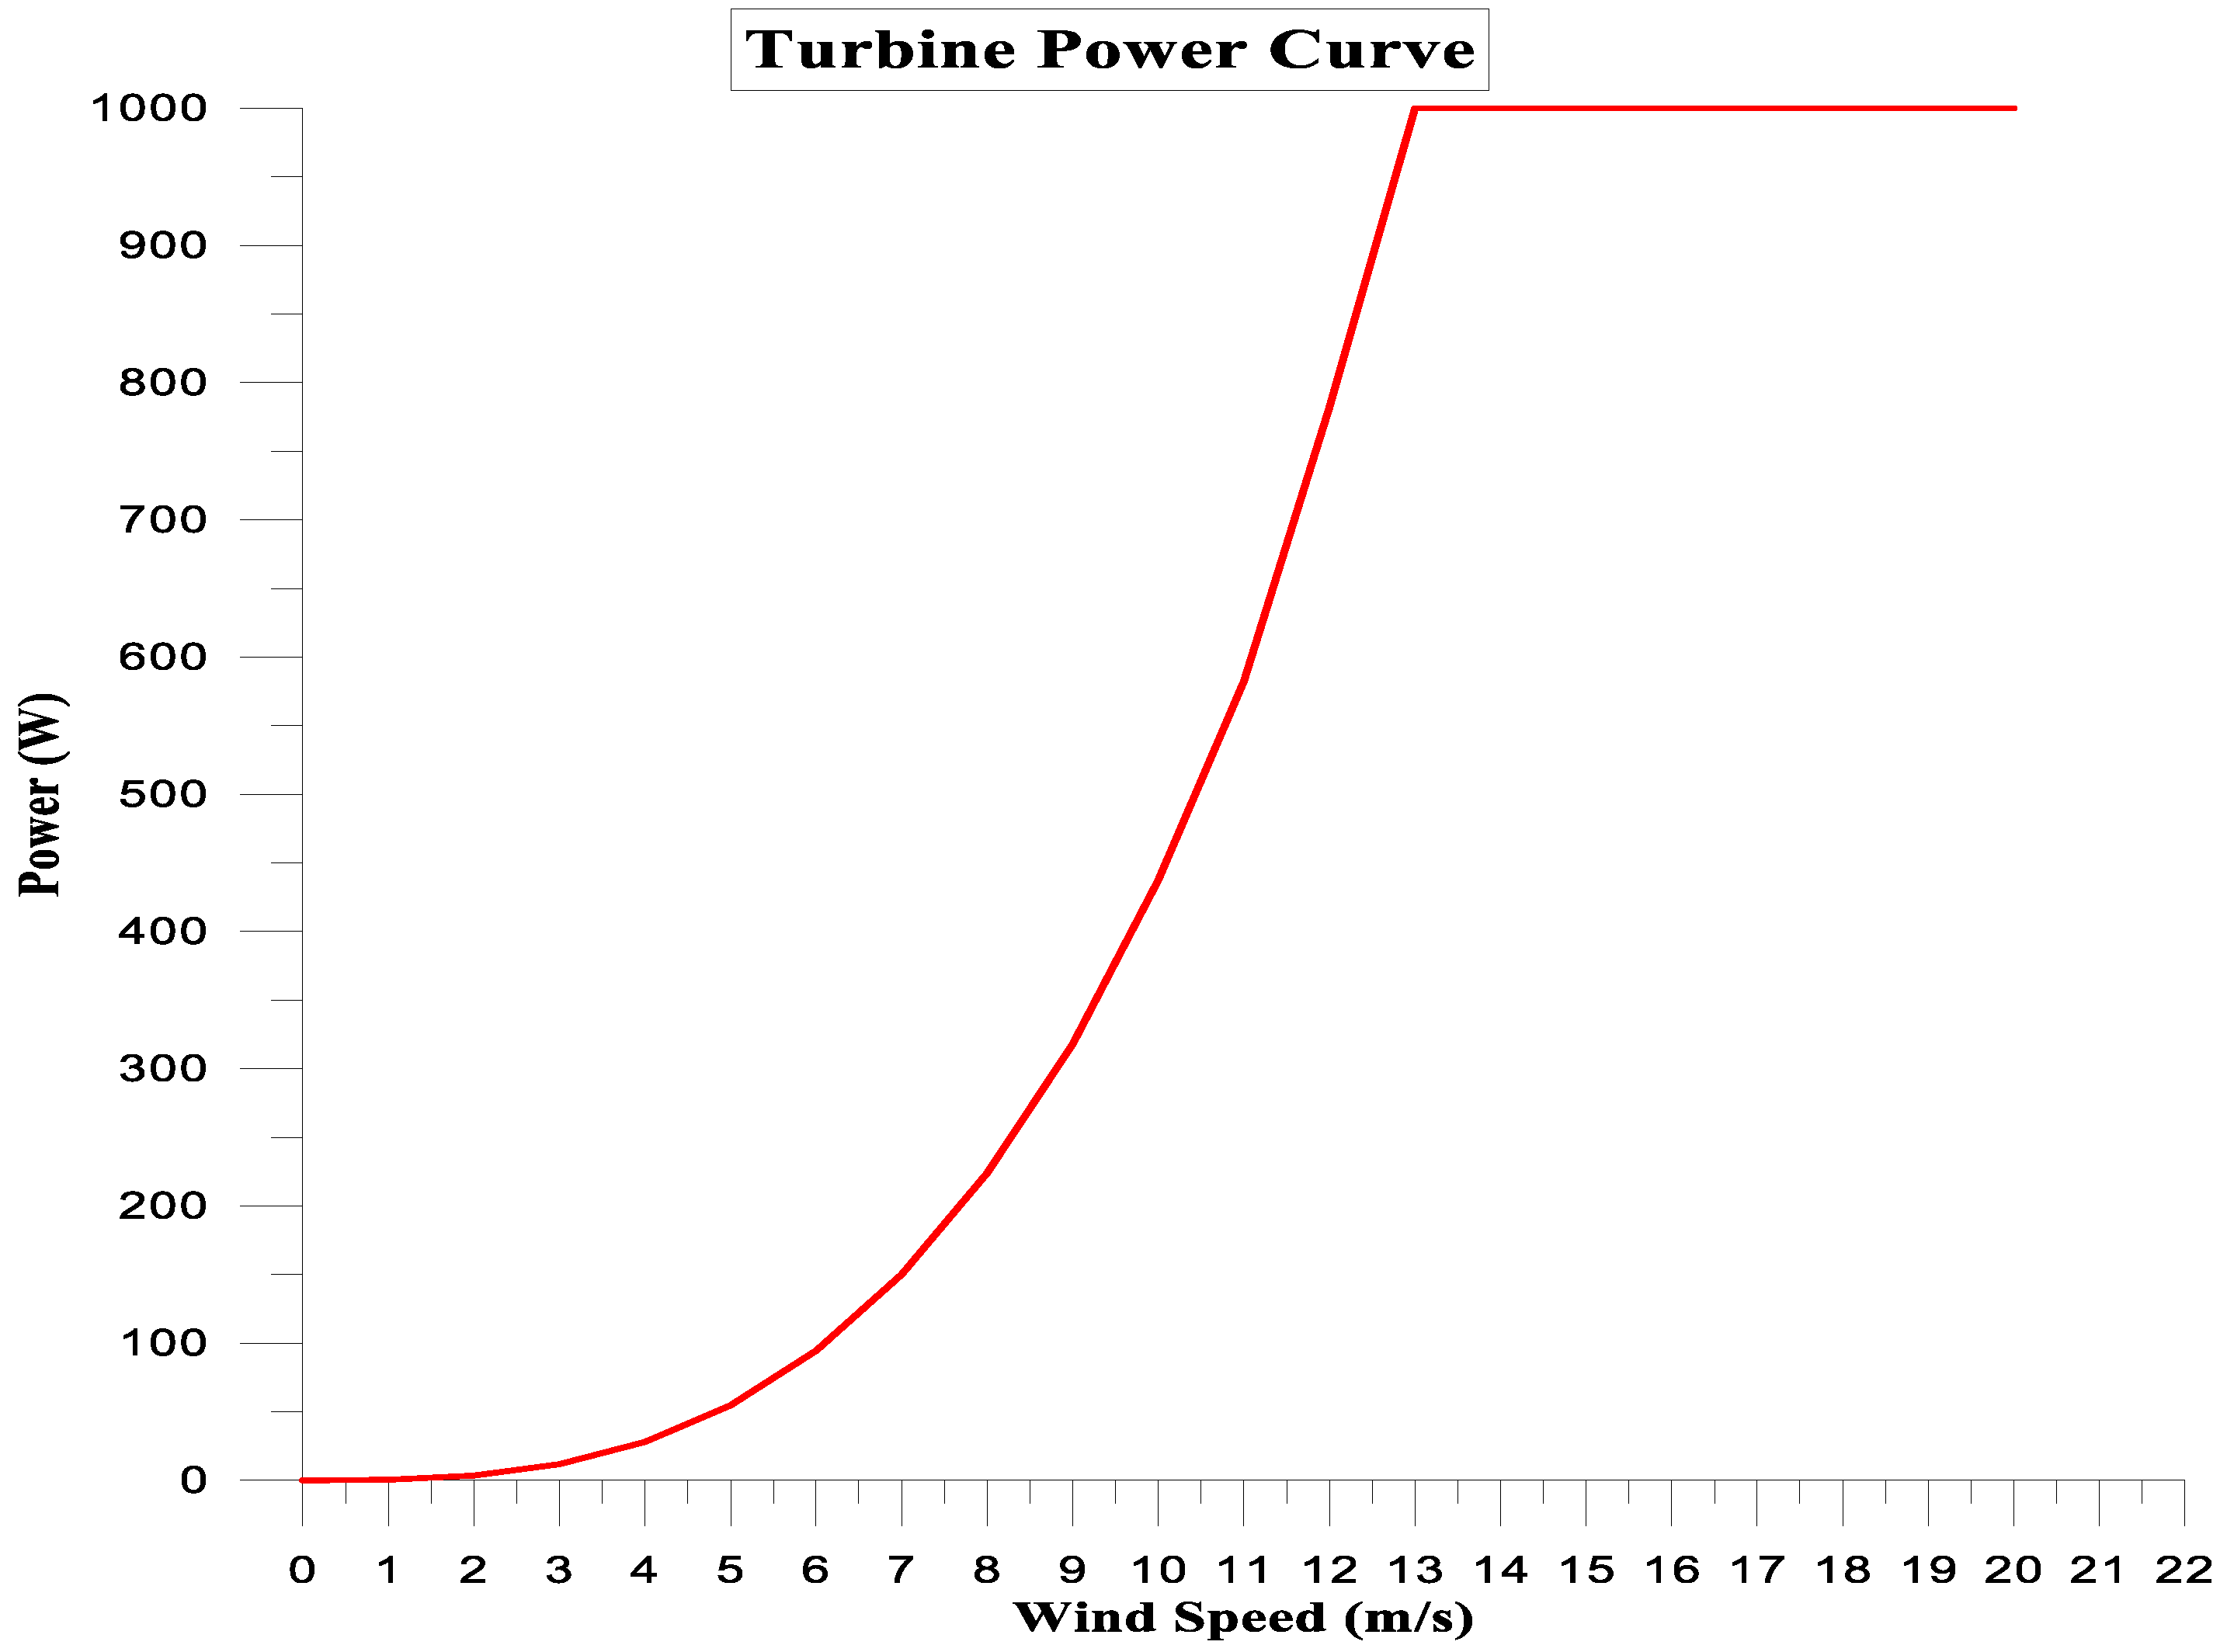
- Wind Turbine System
- -
- Function: To simulate the power output of wind turbines based on wind speed and turbine performance curves.
- -
- Configuration: Input turbine specifications (e.g., rated power, cut-in and cut-out wind speeds). Link to the weather data component for wind speed input.
- Electrolyzer
- -
- Function: To model the hydrogen production process via electrolysis, converting electricity from renewable sources into hydrogen.
- -
- Configuration: Define electrolyzer characteristics (e.g., efficiency, operating range). Connect to the PV or wind turbine systems for electricity input.
- Control Systems
- -
- Function: To manage the flow of electricity and hydrogen, ensuring optimal operation.
- -
- Configuration: Develop control algorithms to balance supply and demand.
- Simulation Setup and Execution
- System Integration
- -
- Integrate all components by defining their interactions and data flow.
- -
- Ensure proper connections between renewable energy sources, the control system, and the electrolyzer.
- Simulation Parameters
- -
- Set the simulation time step (hourly) and duration (9 months).
- -
- Configure output parameters to monitor (hydrogen production rate and system efficiency).
- Running Simulations
- -
- Execute the simulation and monitor real-time performance.
- Data Analysis and Interpretation
- Hydrogen Production Analysis
- -
- Analyze the hydrogen production rate from the electrolyzer over time.
- -
- Assess the impact of varying solar and wind inputs on hydrogen output.
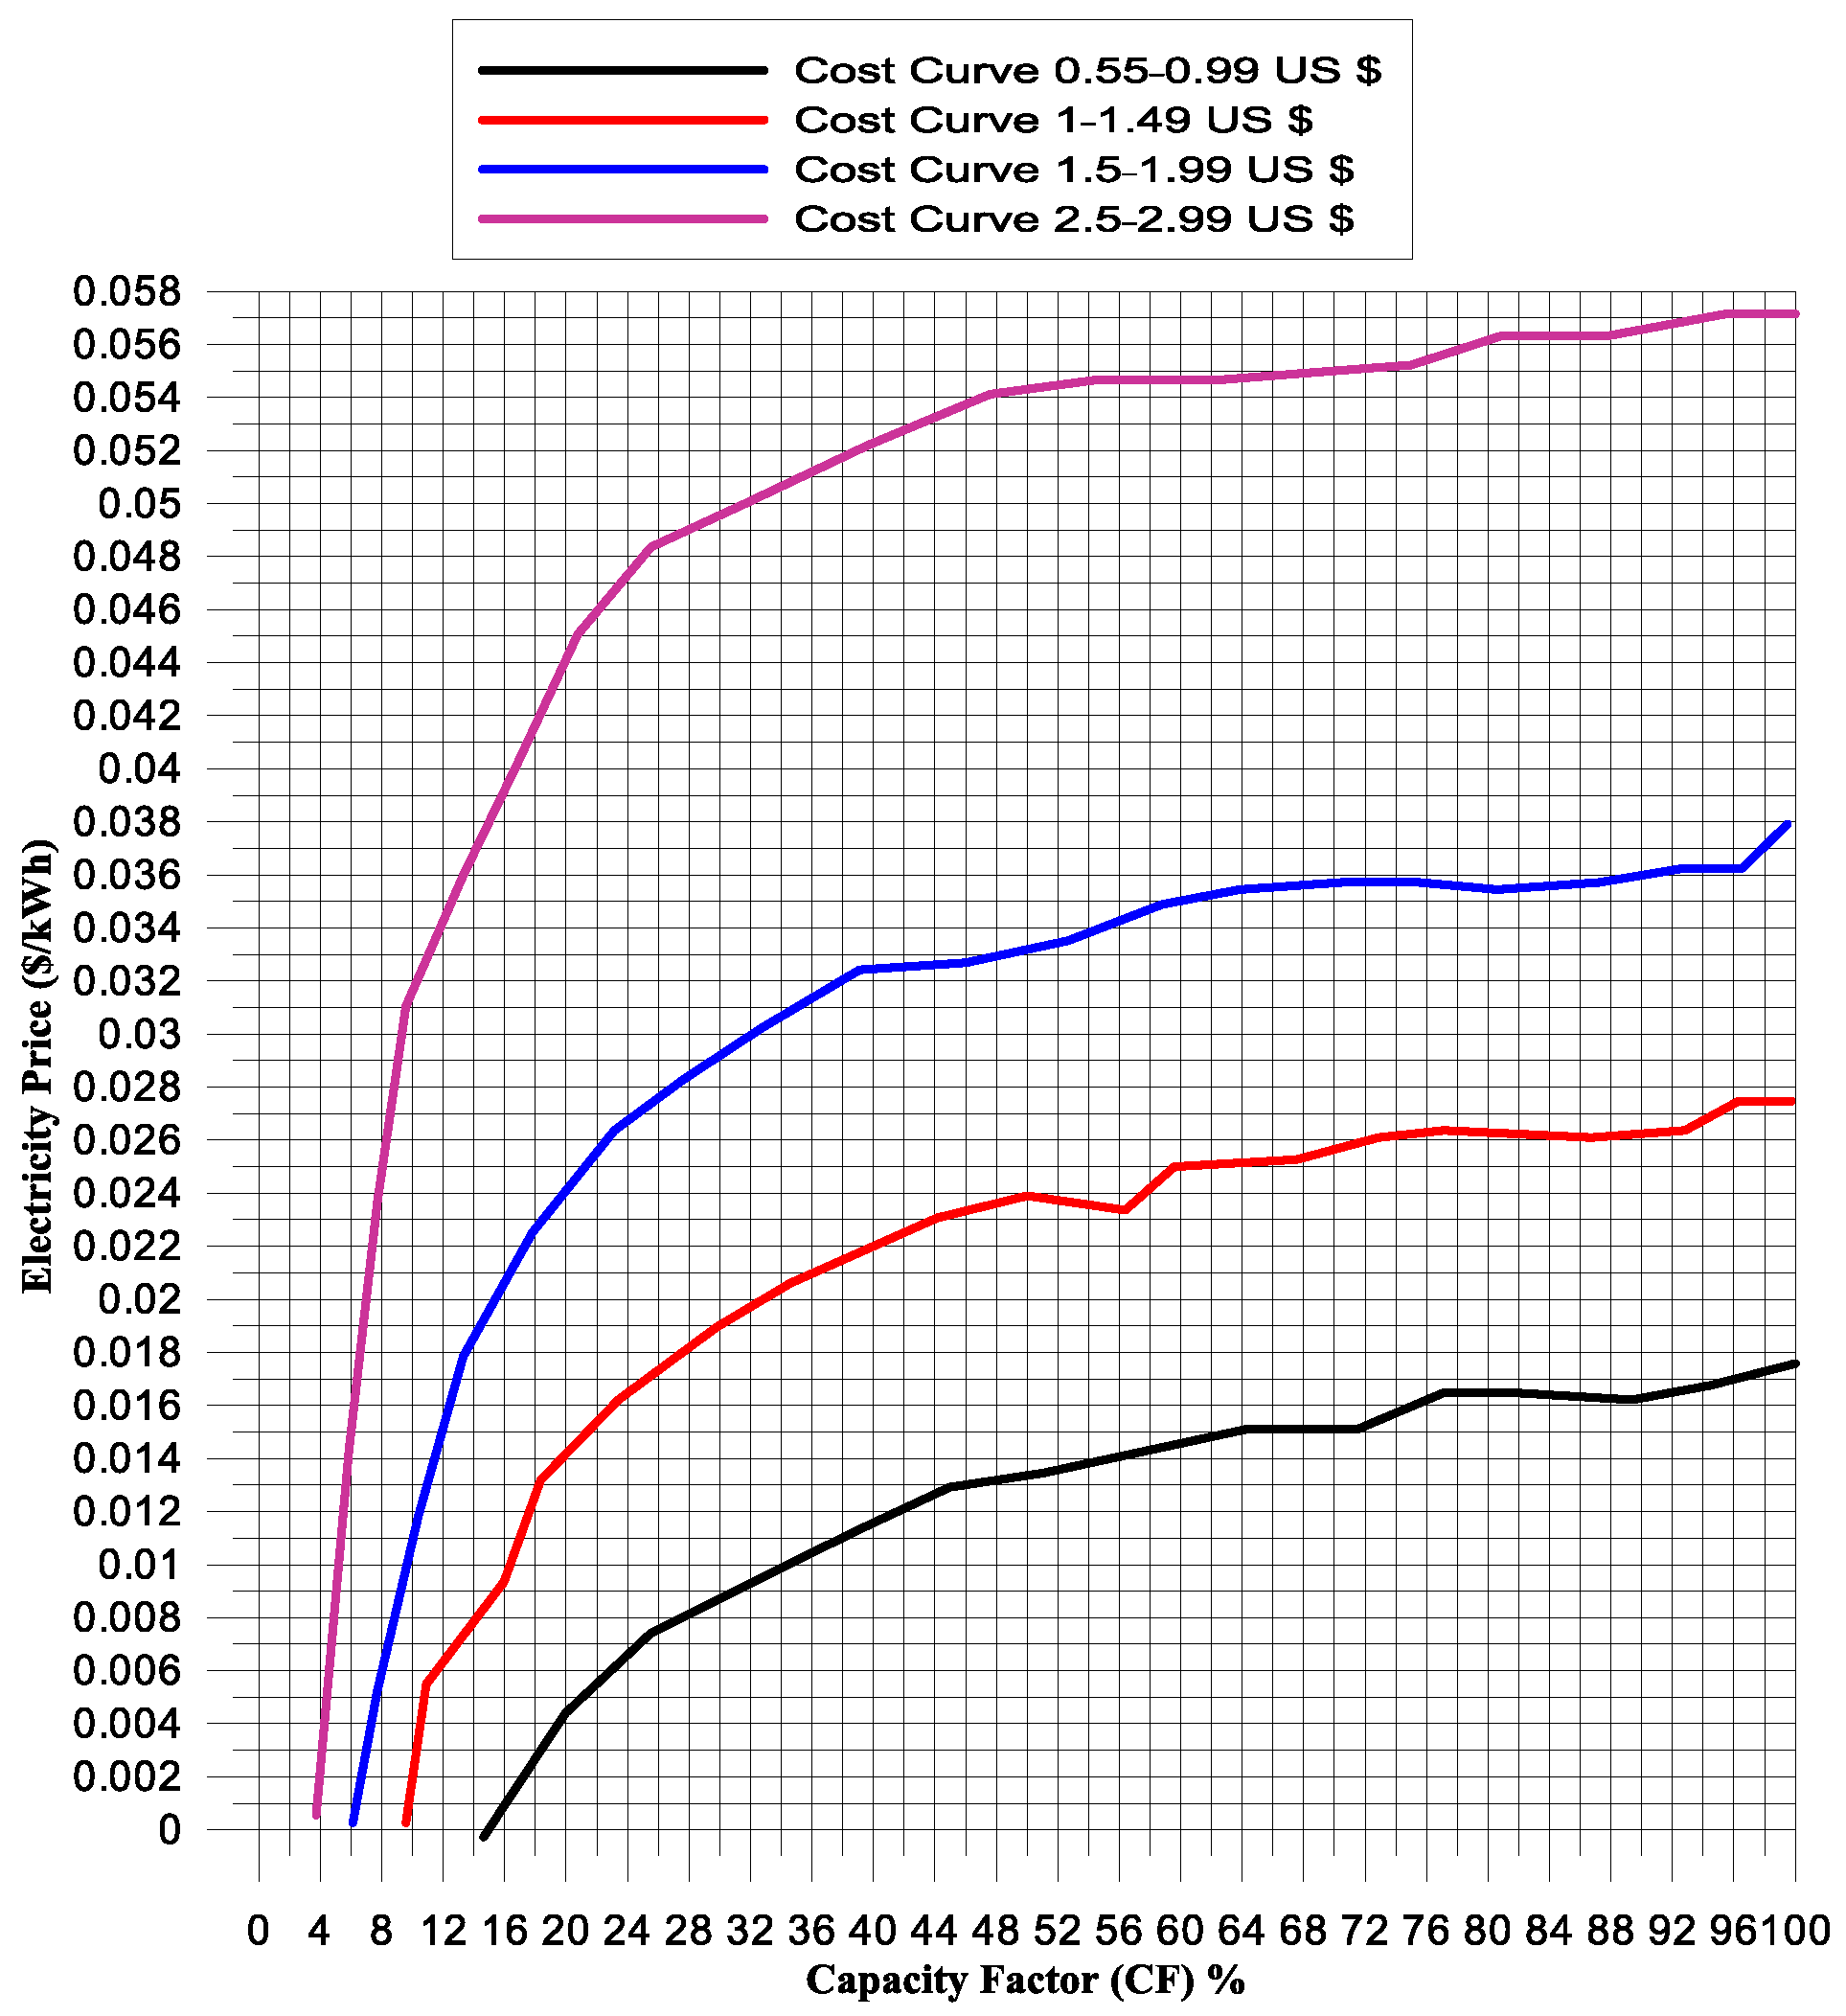
- Cost Analysis
- -
- Perform a cost analysis of hydrogen production.
- -
- Compare the cost of hydrogen generated from solar and wind energy.
- : air density (kg/m3);
- A: the swept area of the turbine blades (m2);
- v: wind speed (m/s);
- Cp: a power coefficient representing the efficiency of the turbine in extracting power from the wind.
- η: the conversion efficiency of the PV module;
- G: incident solar radiation on the module (W/m2);
- A: the area of the PV module (m2).
- Faraday’s law
- Cell Voltage
3. Results and Discussion
3.1. Turbine Power Source
3.1.1. Simulation Parameters
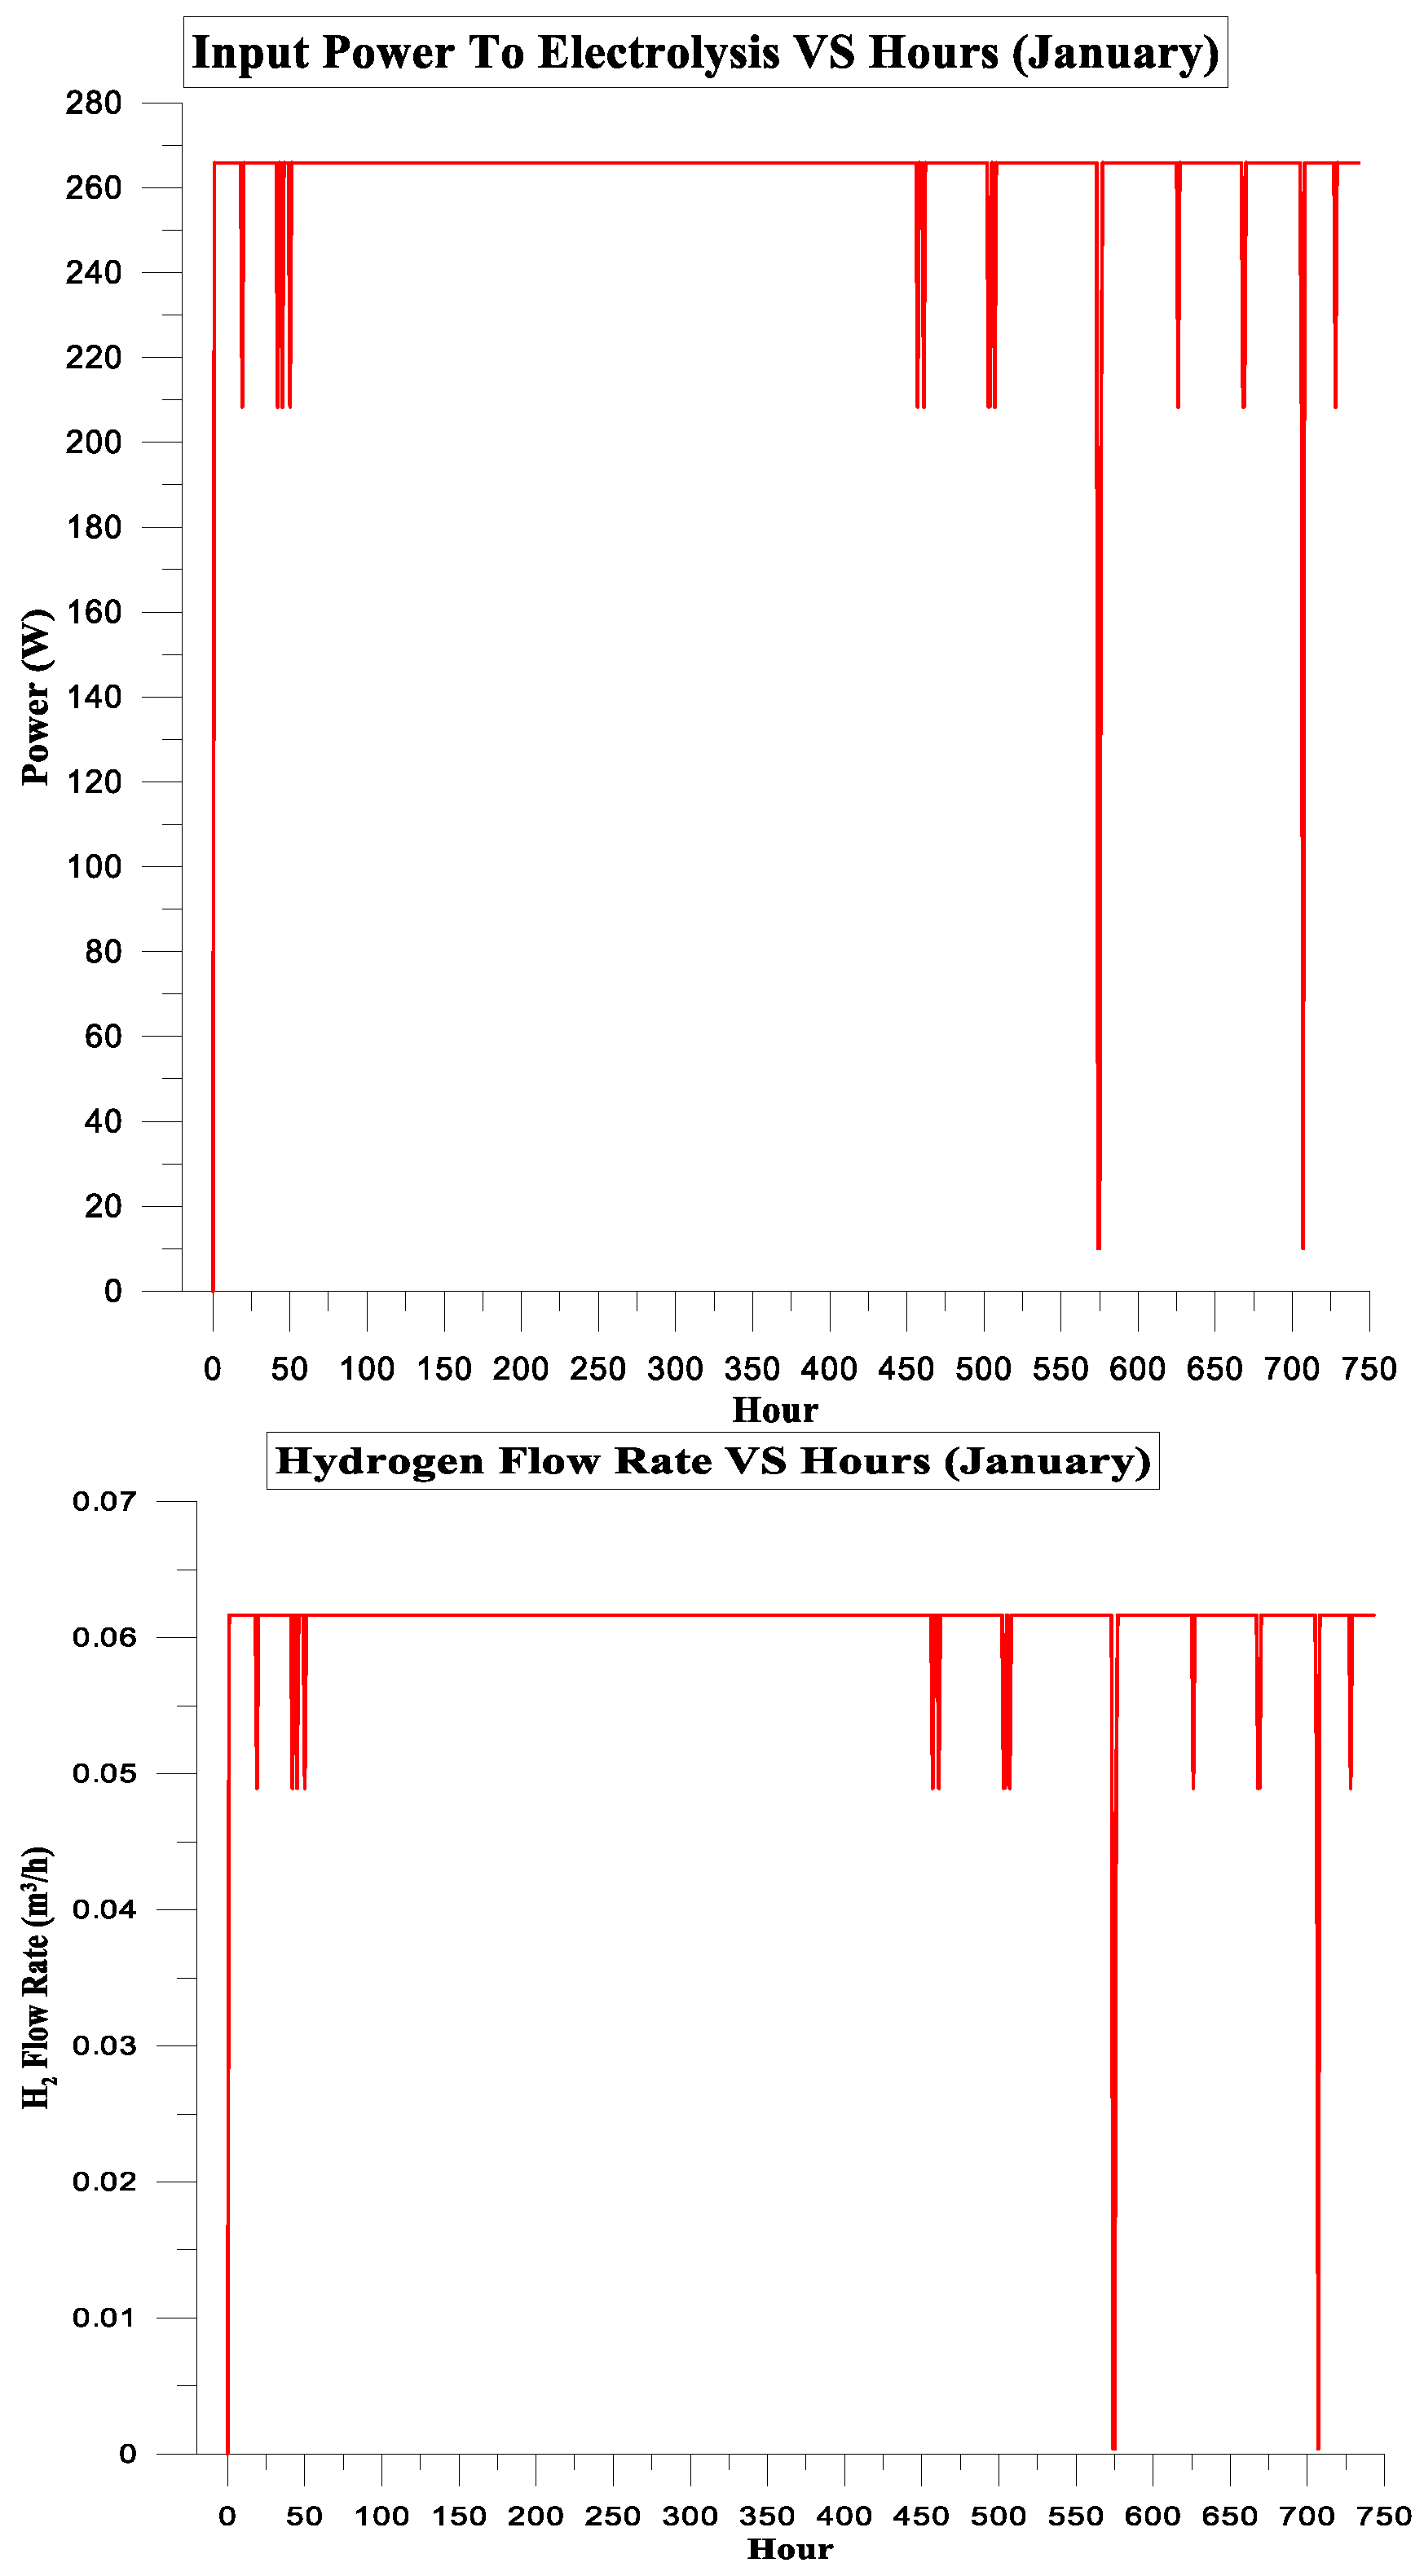
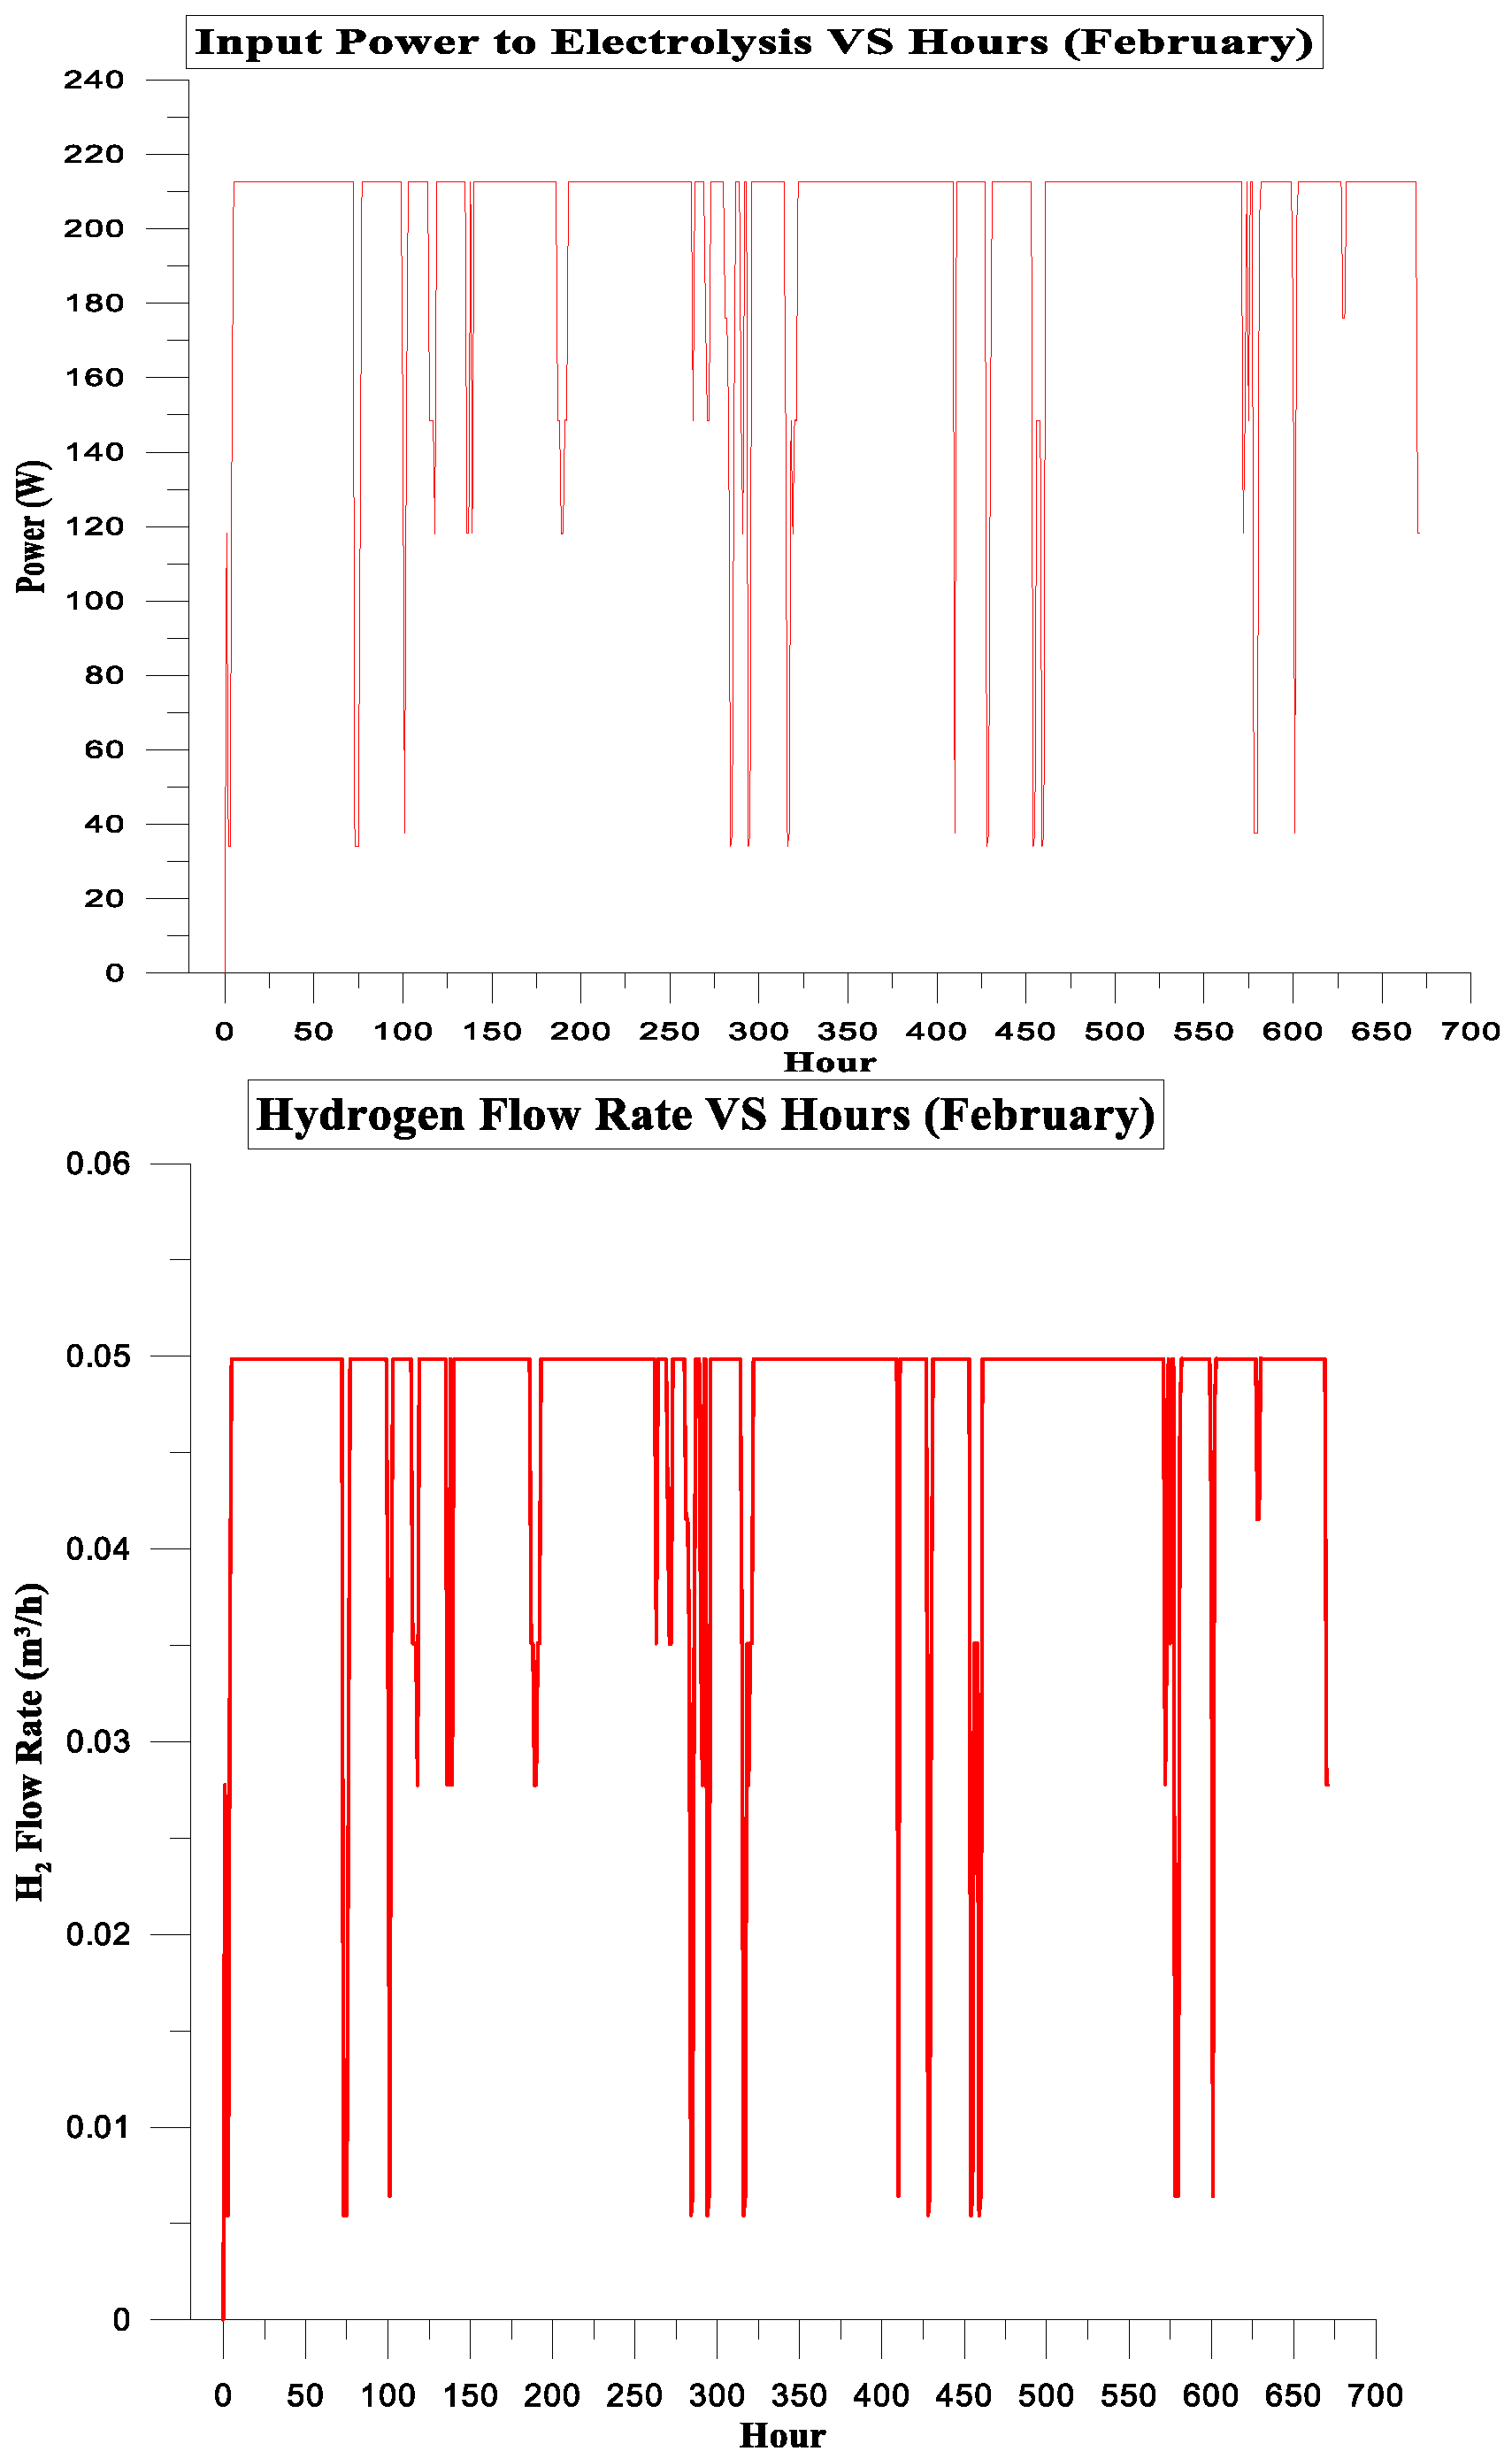
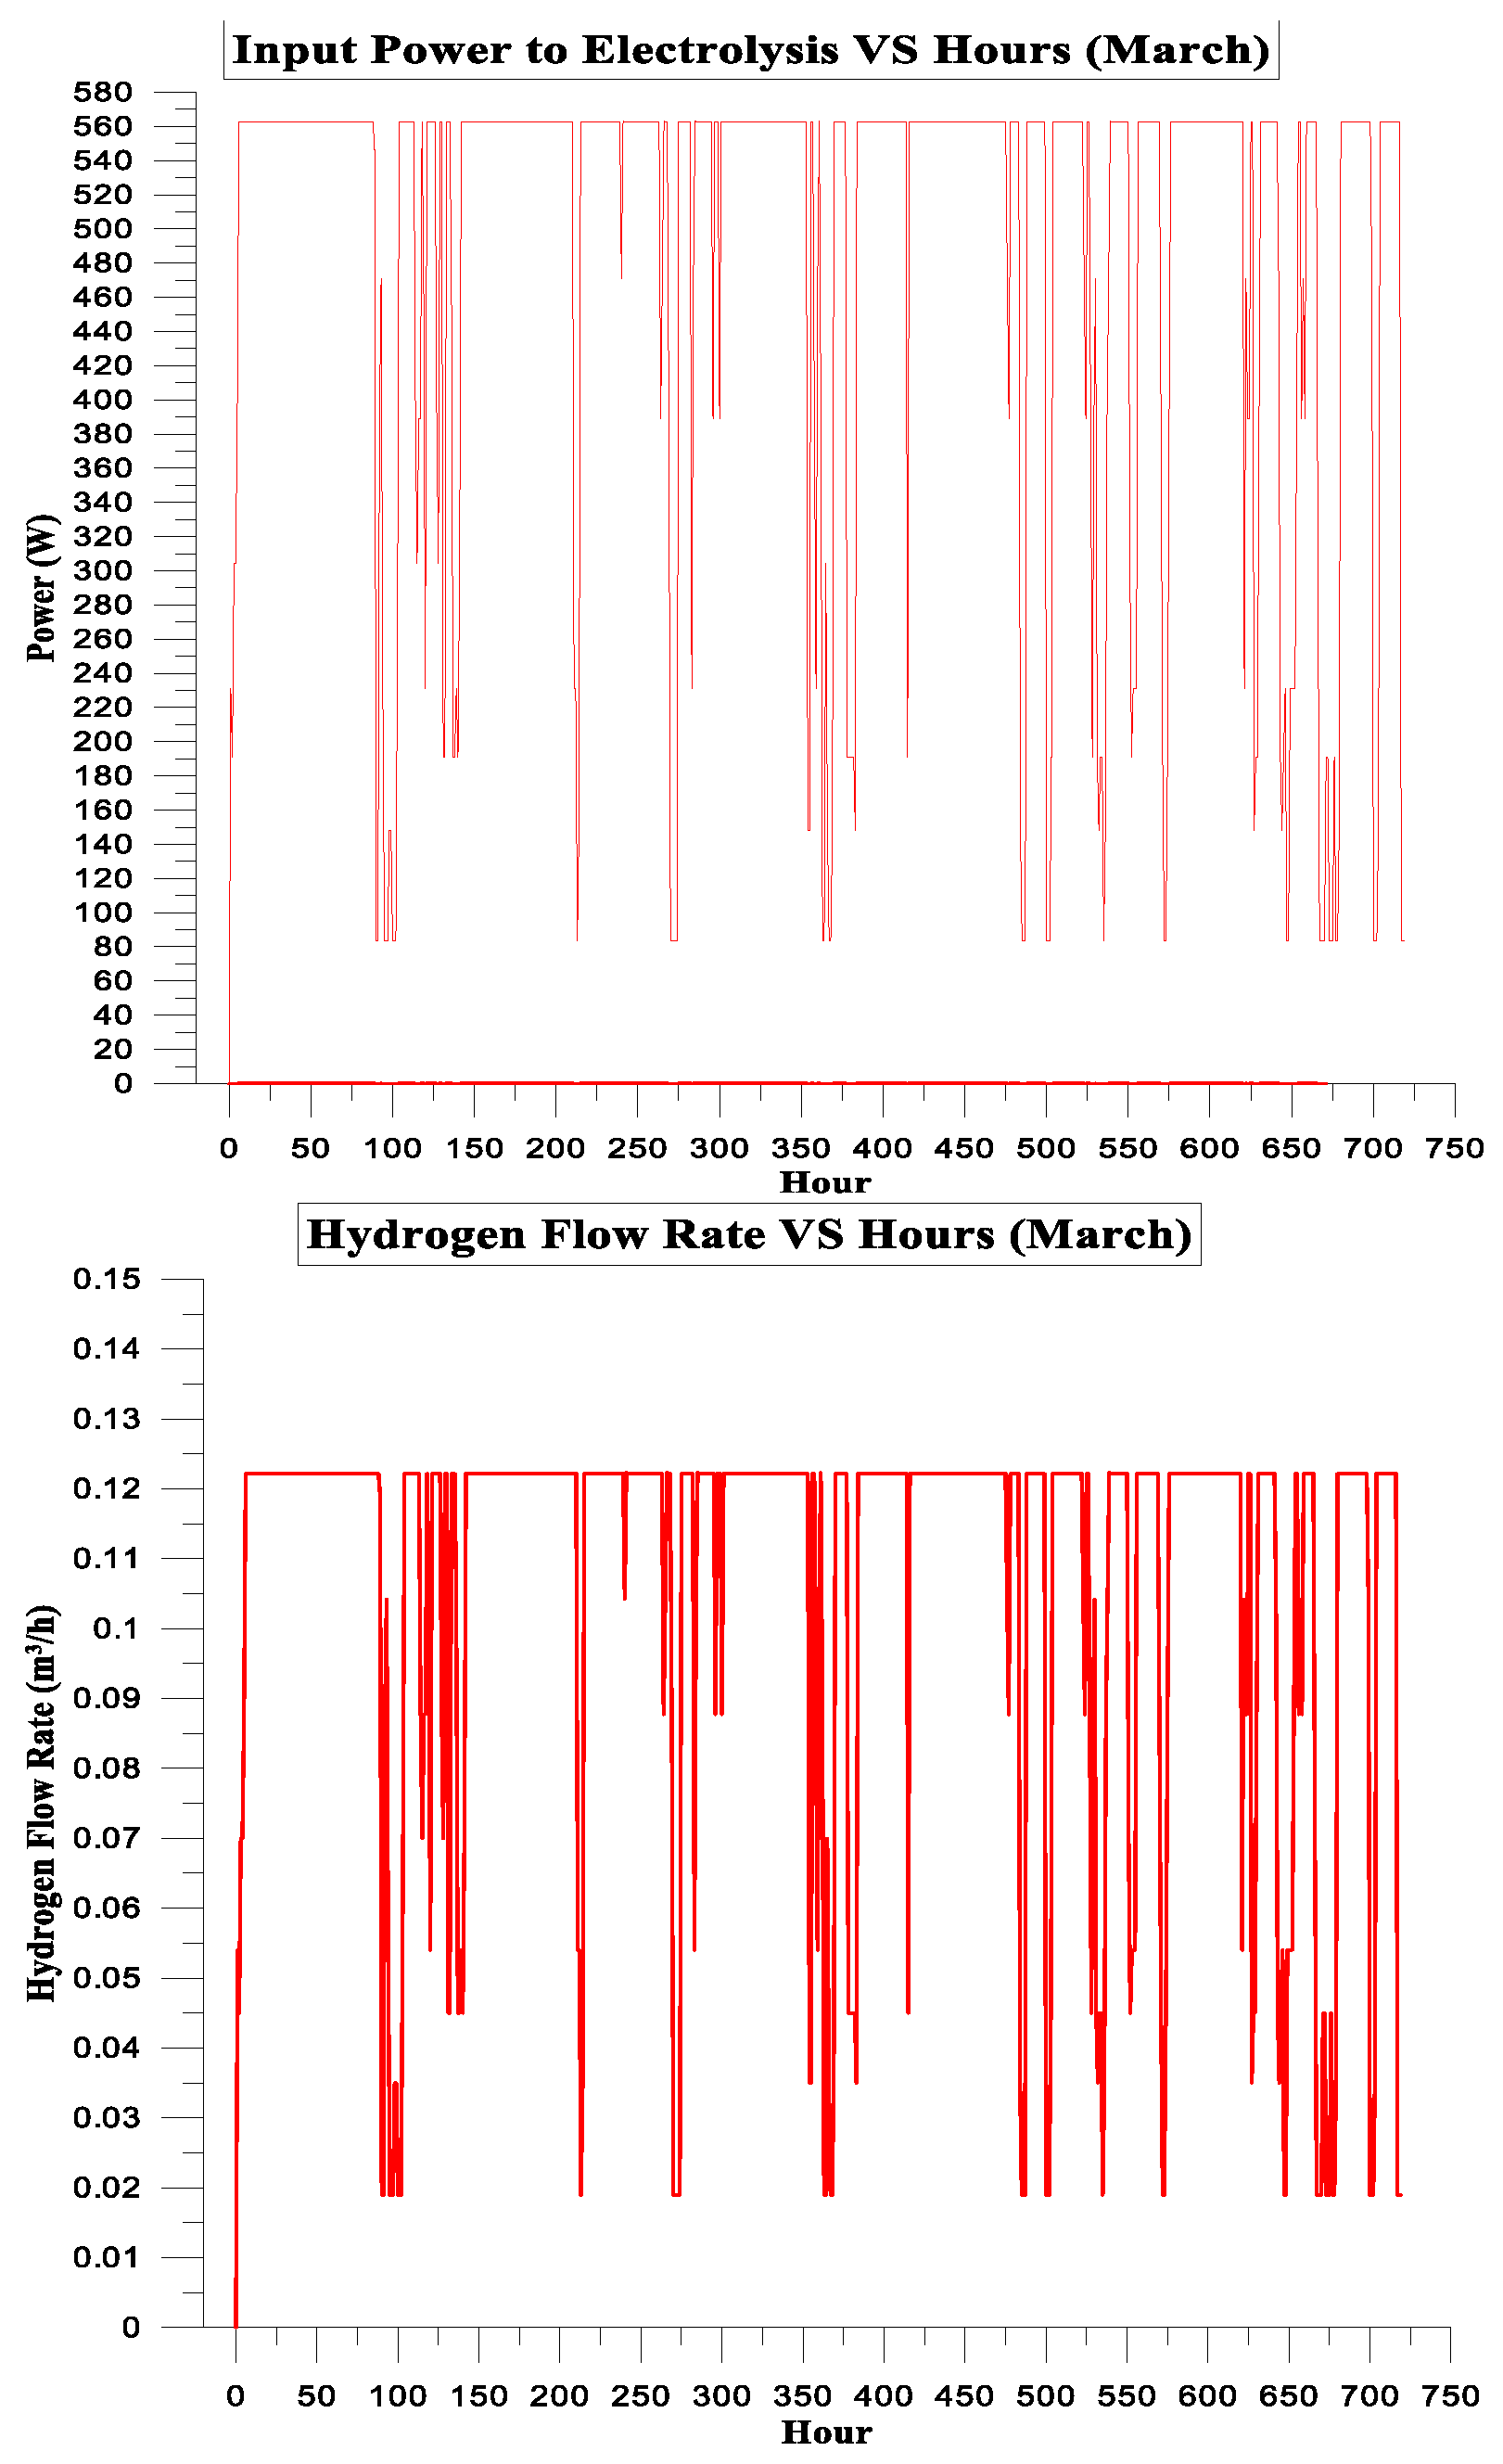
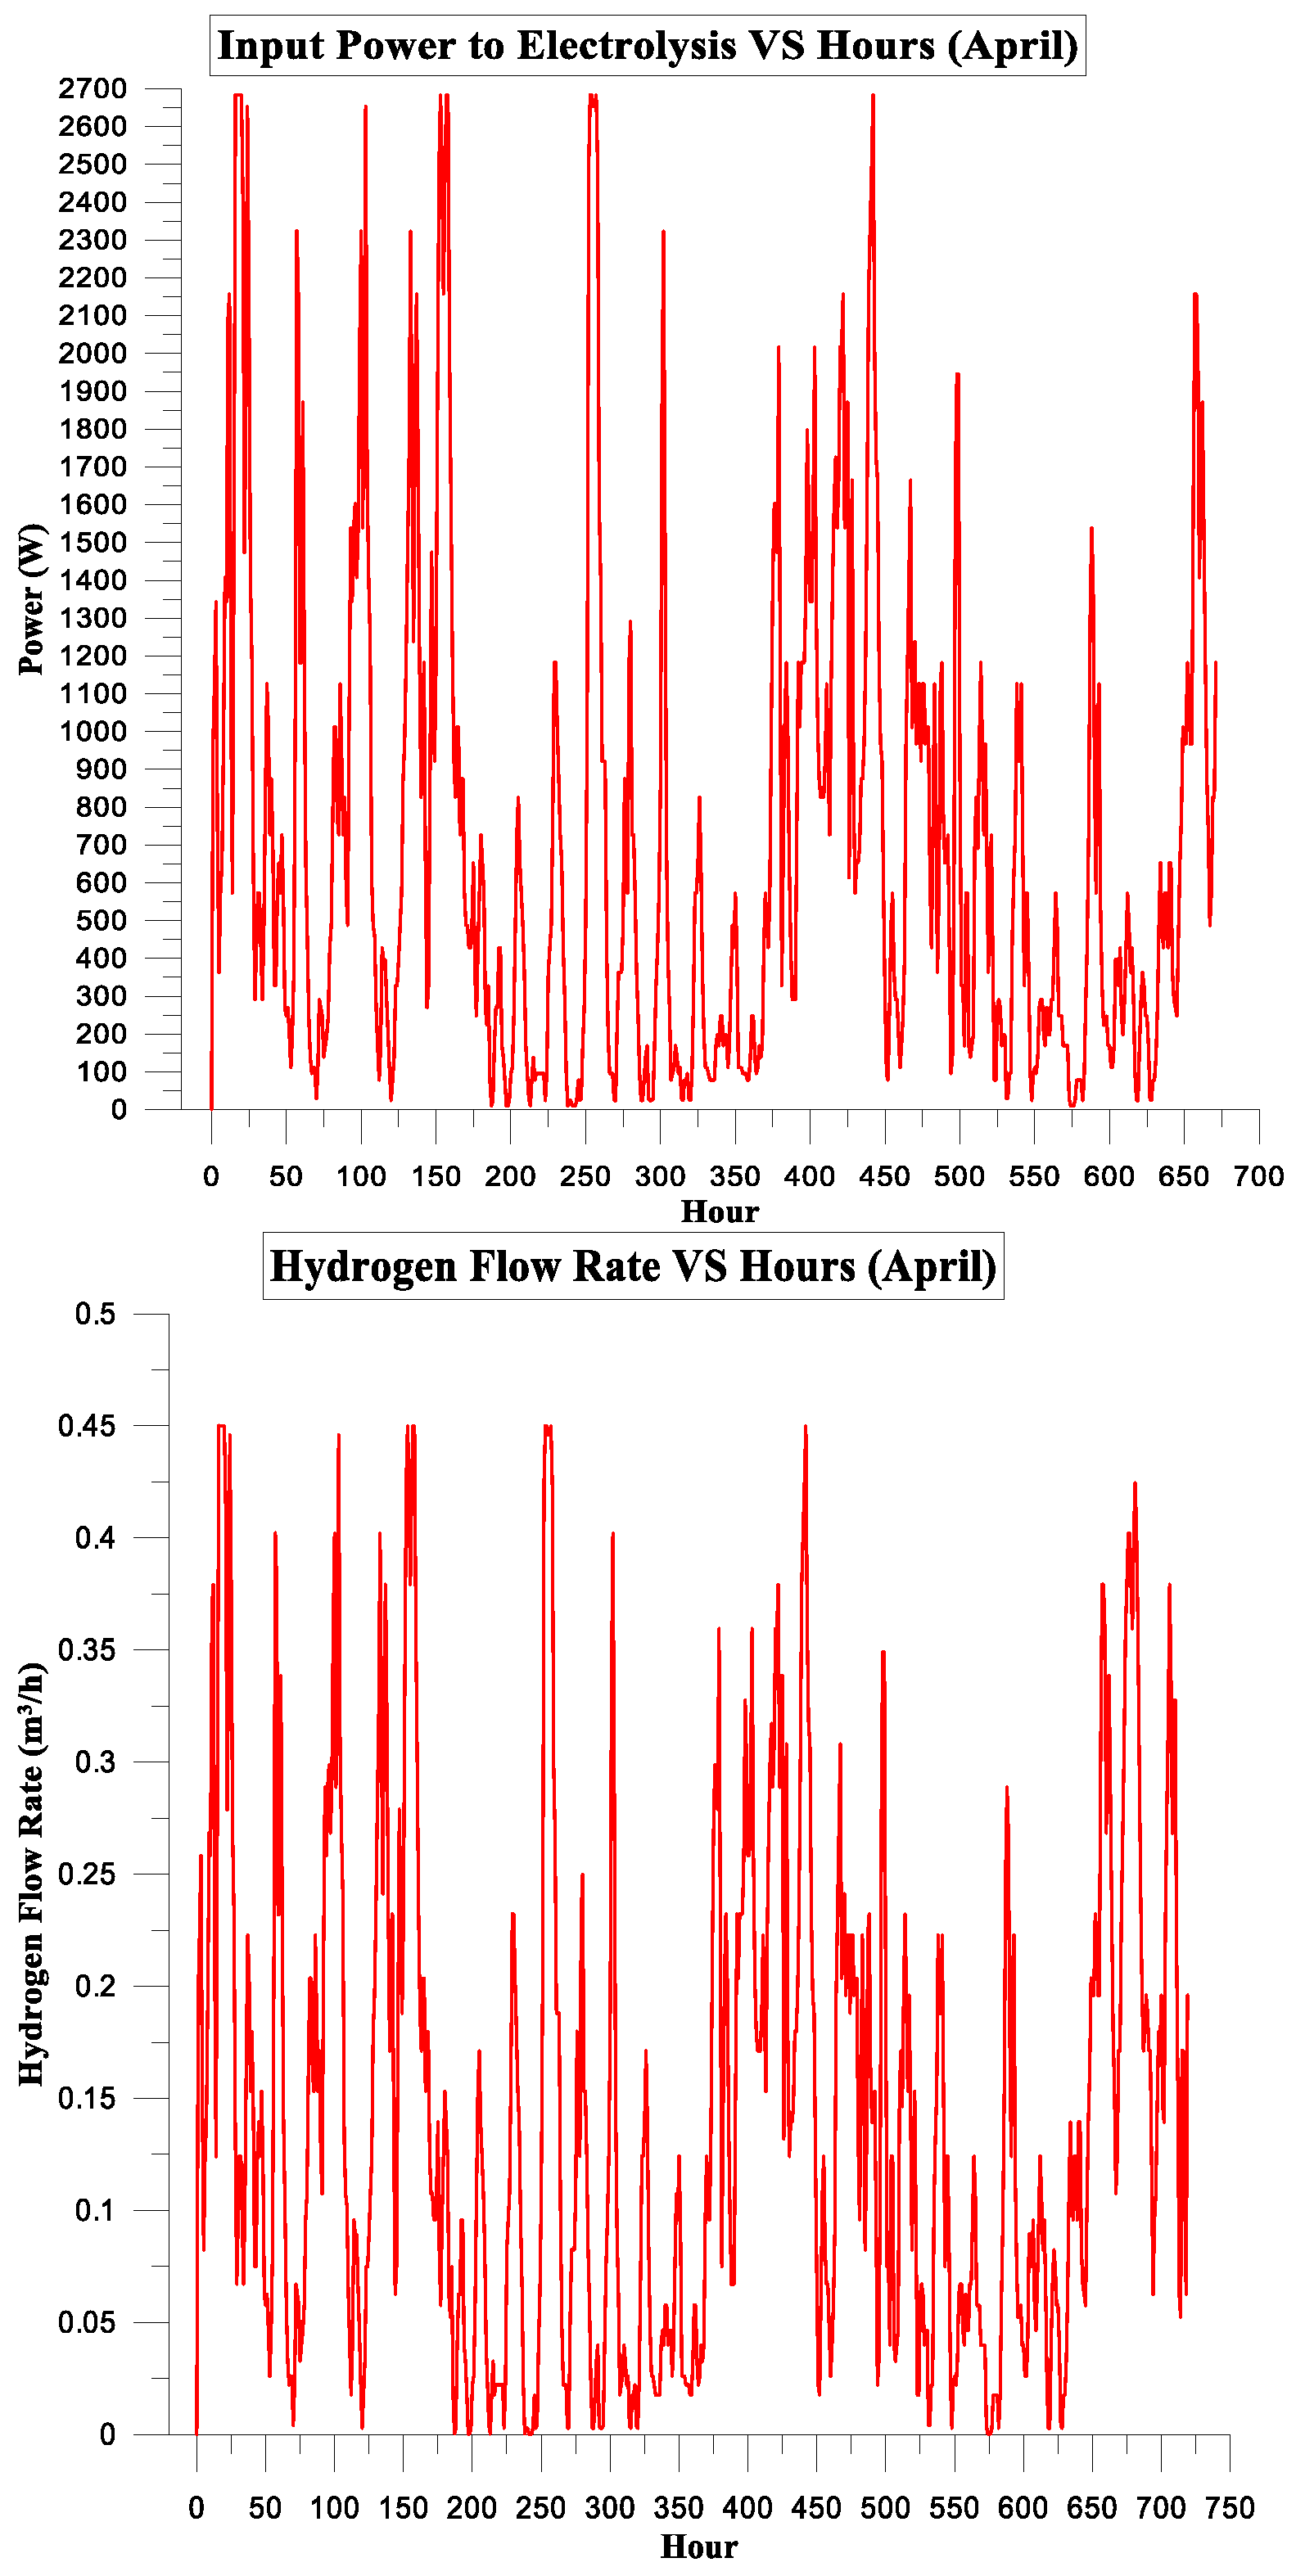
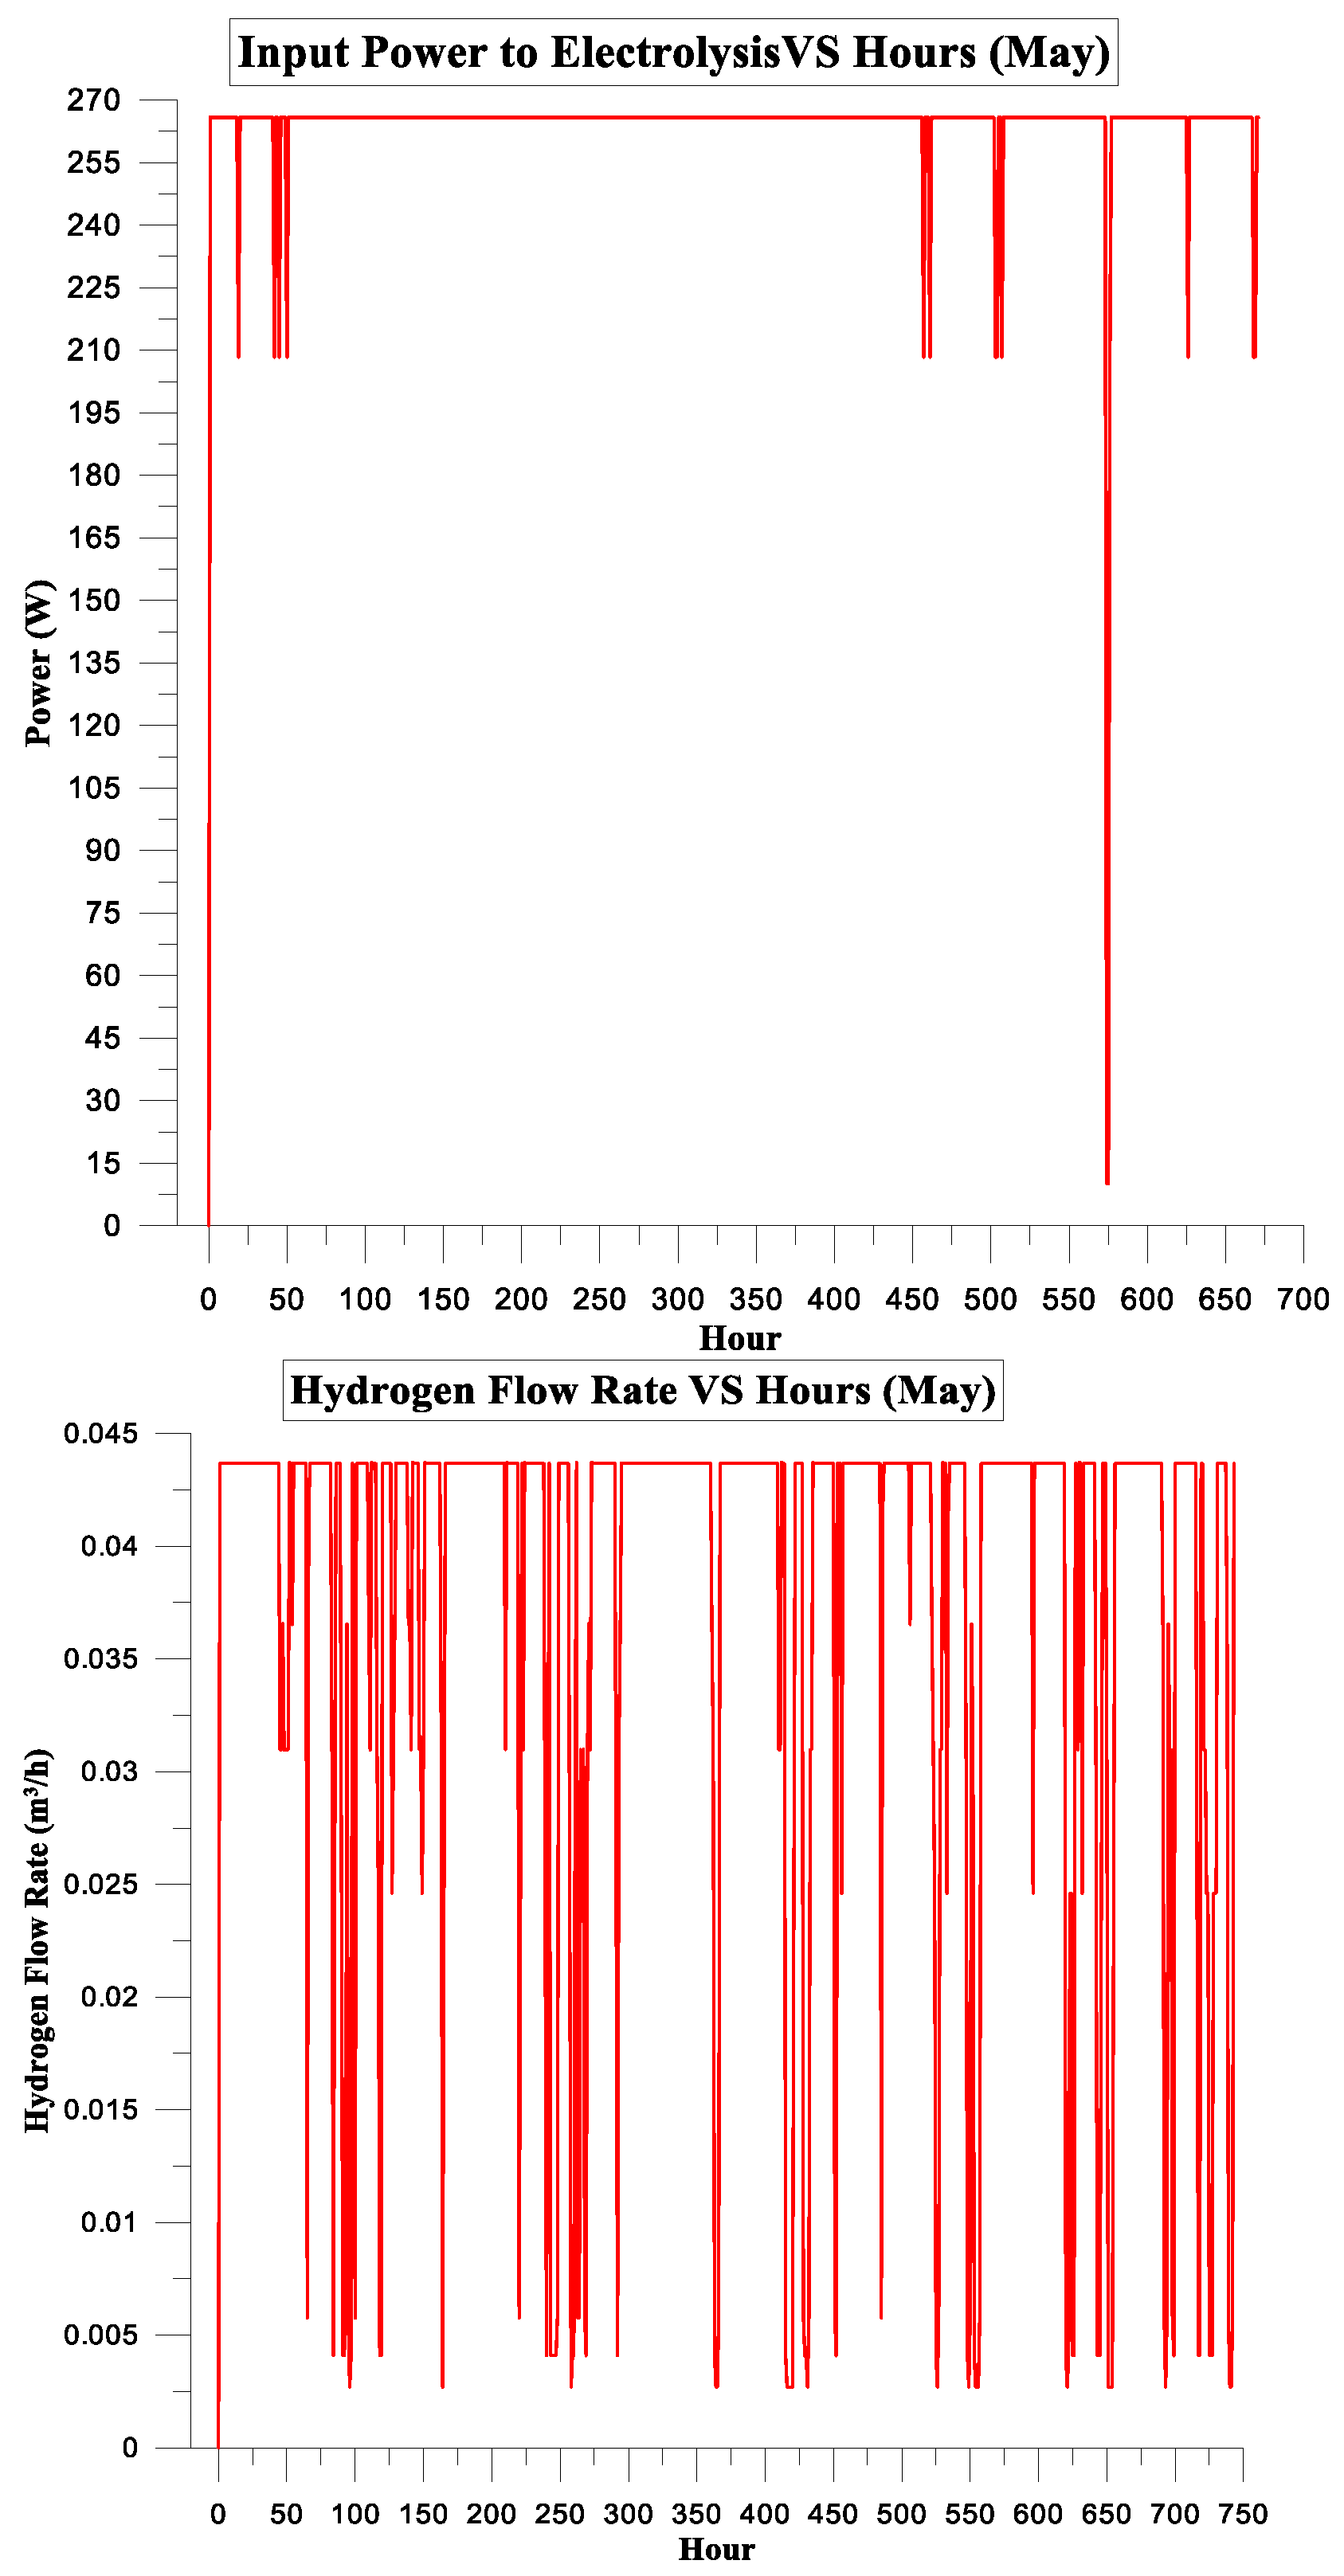
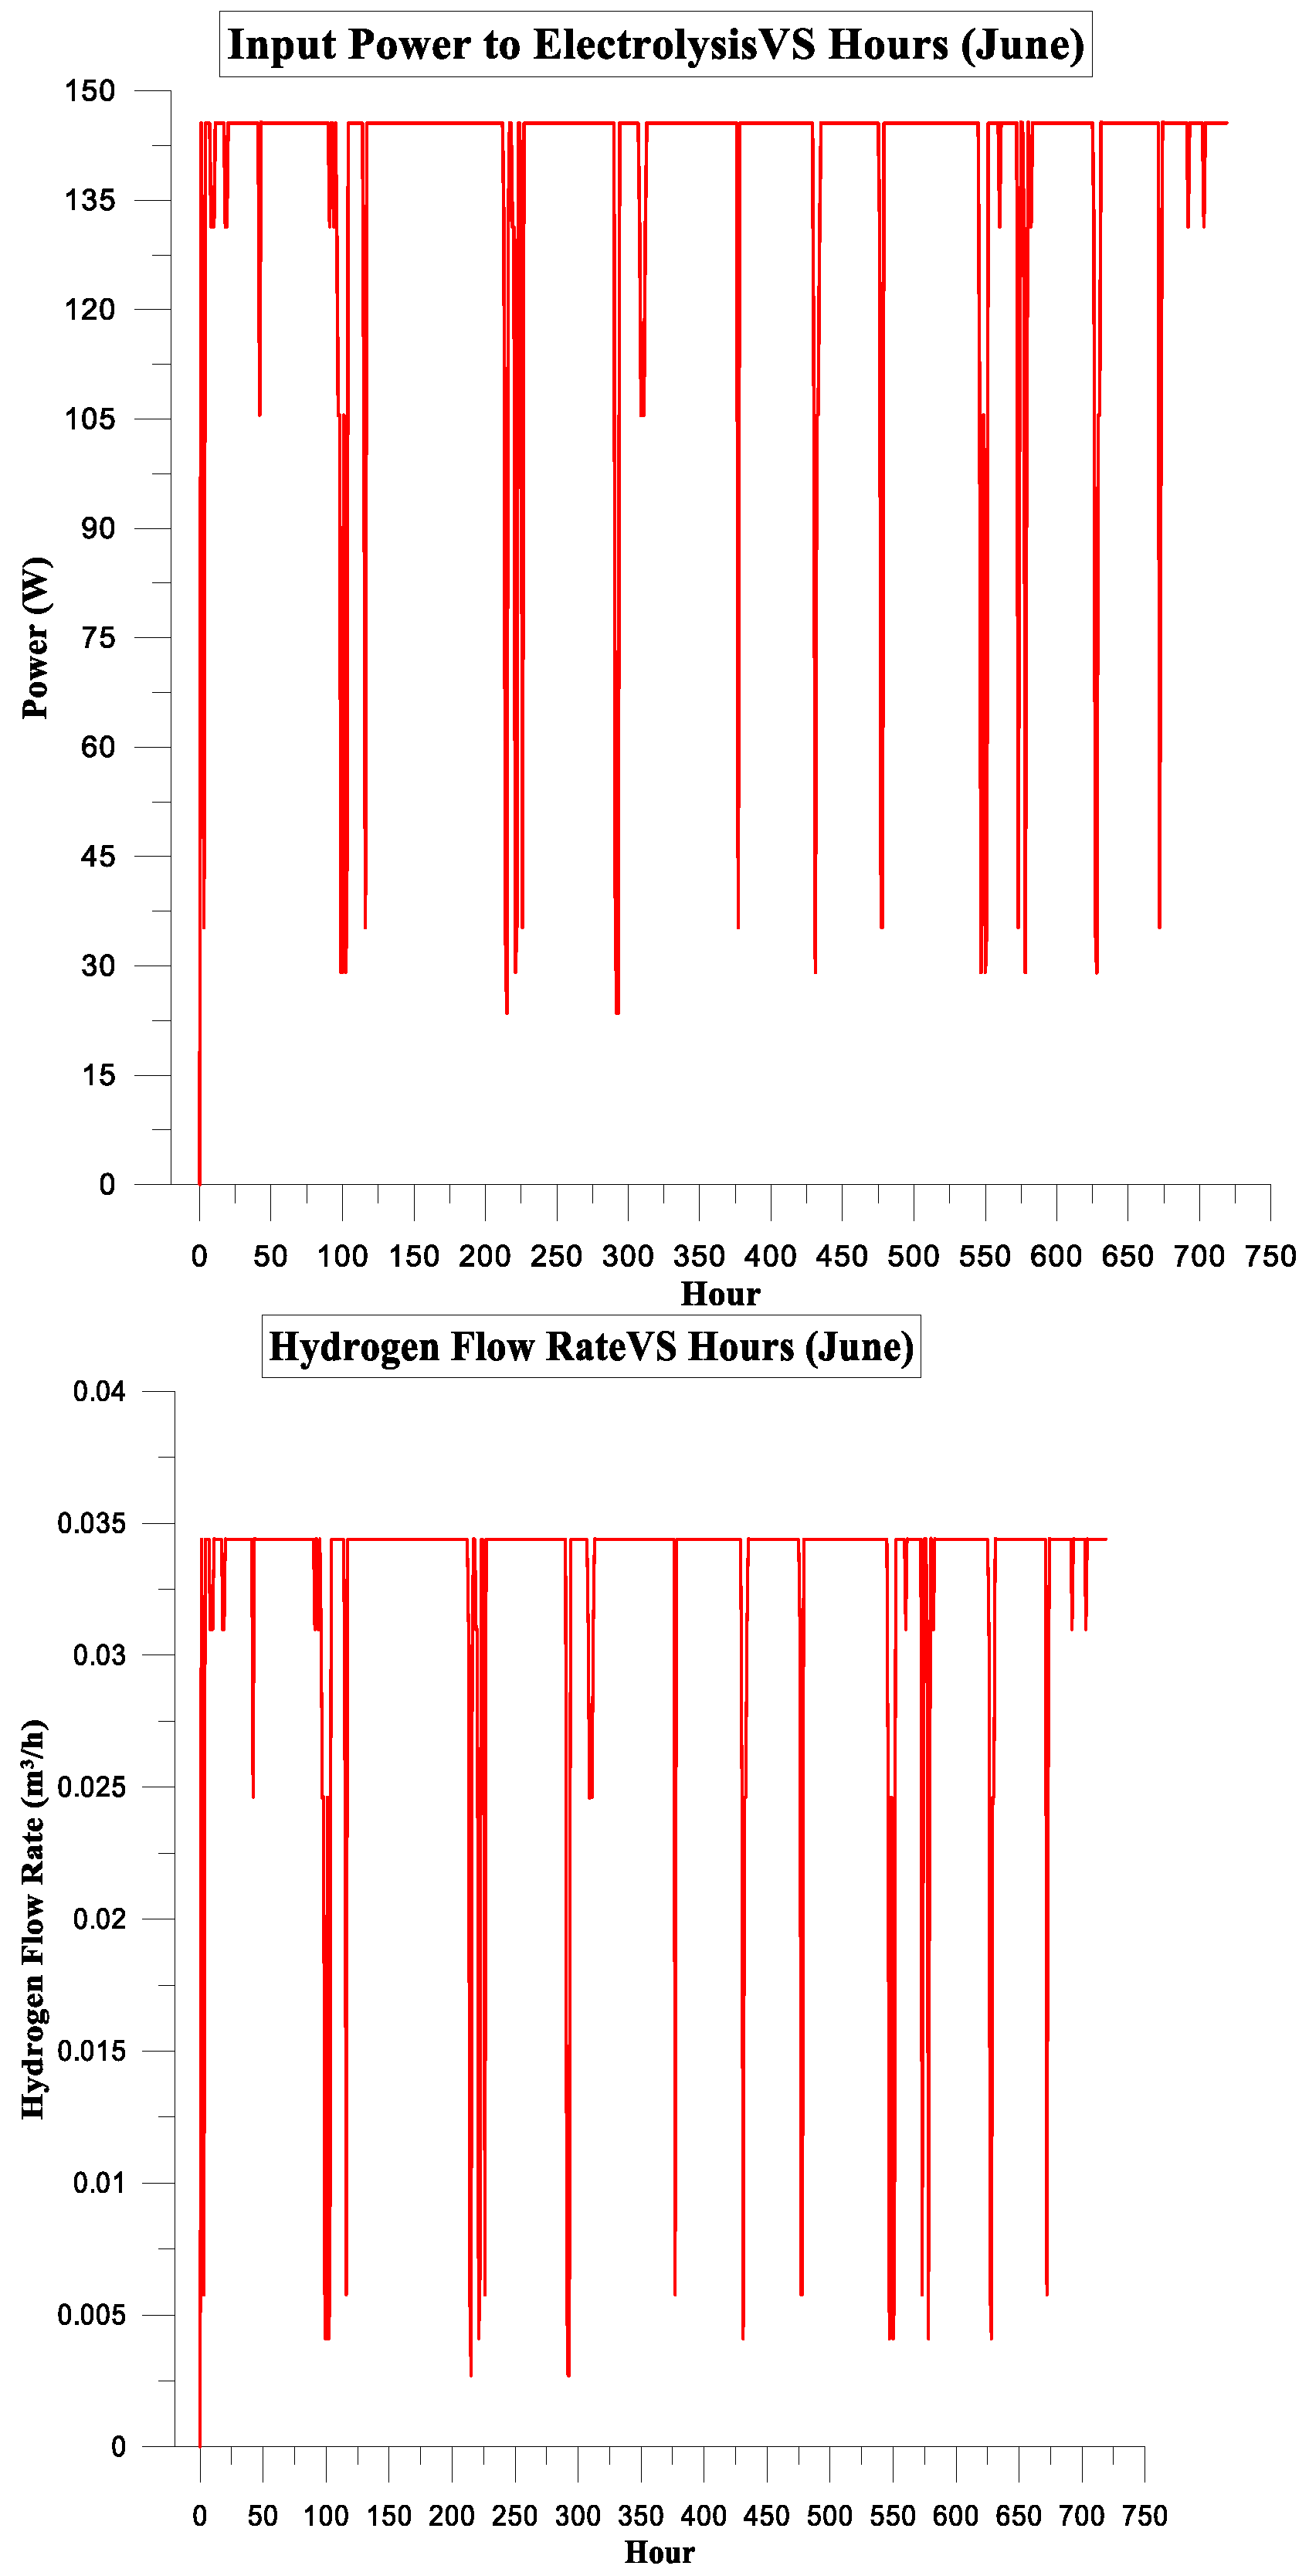
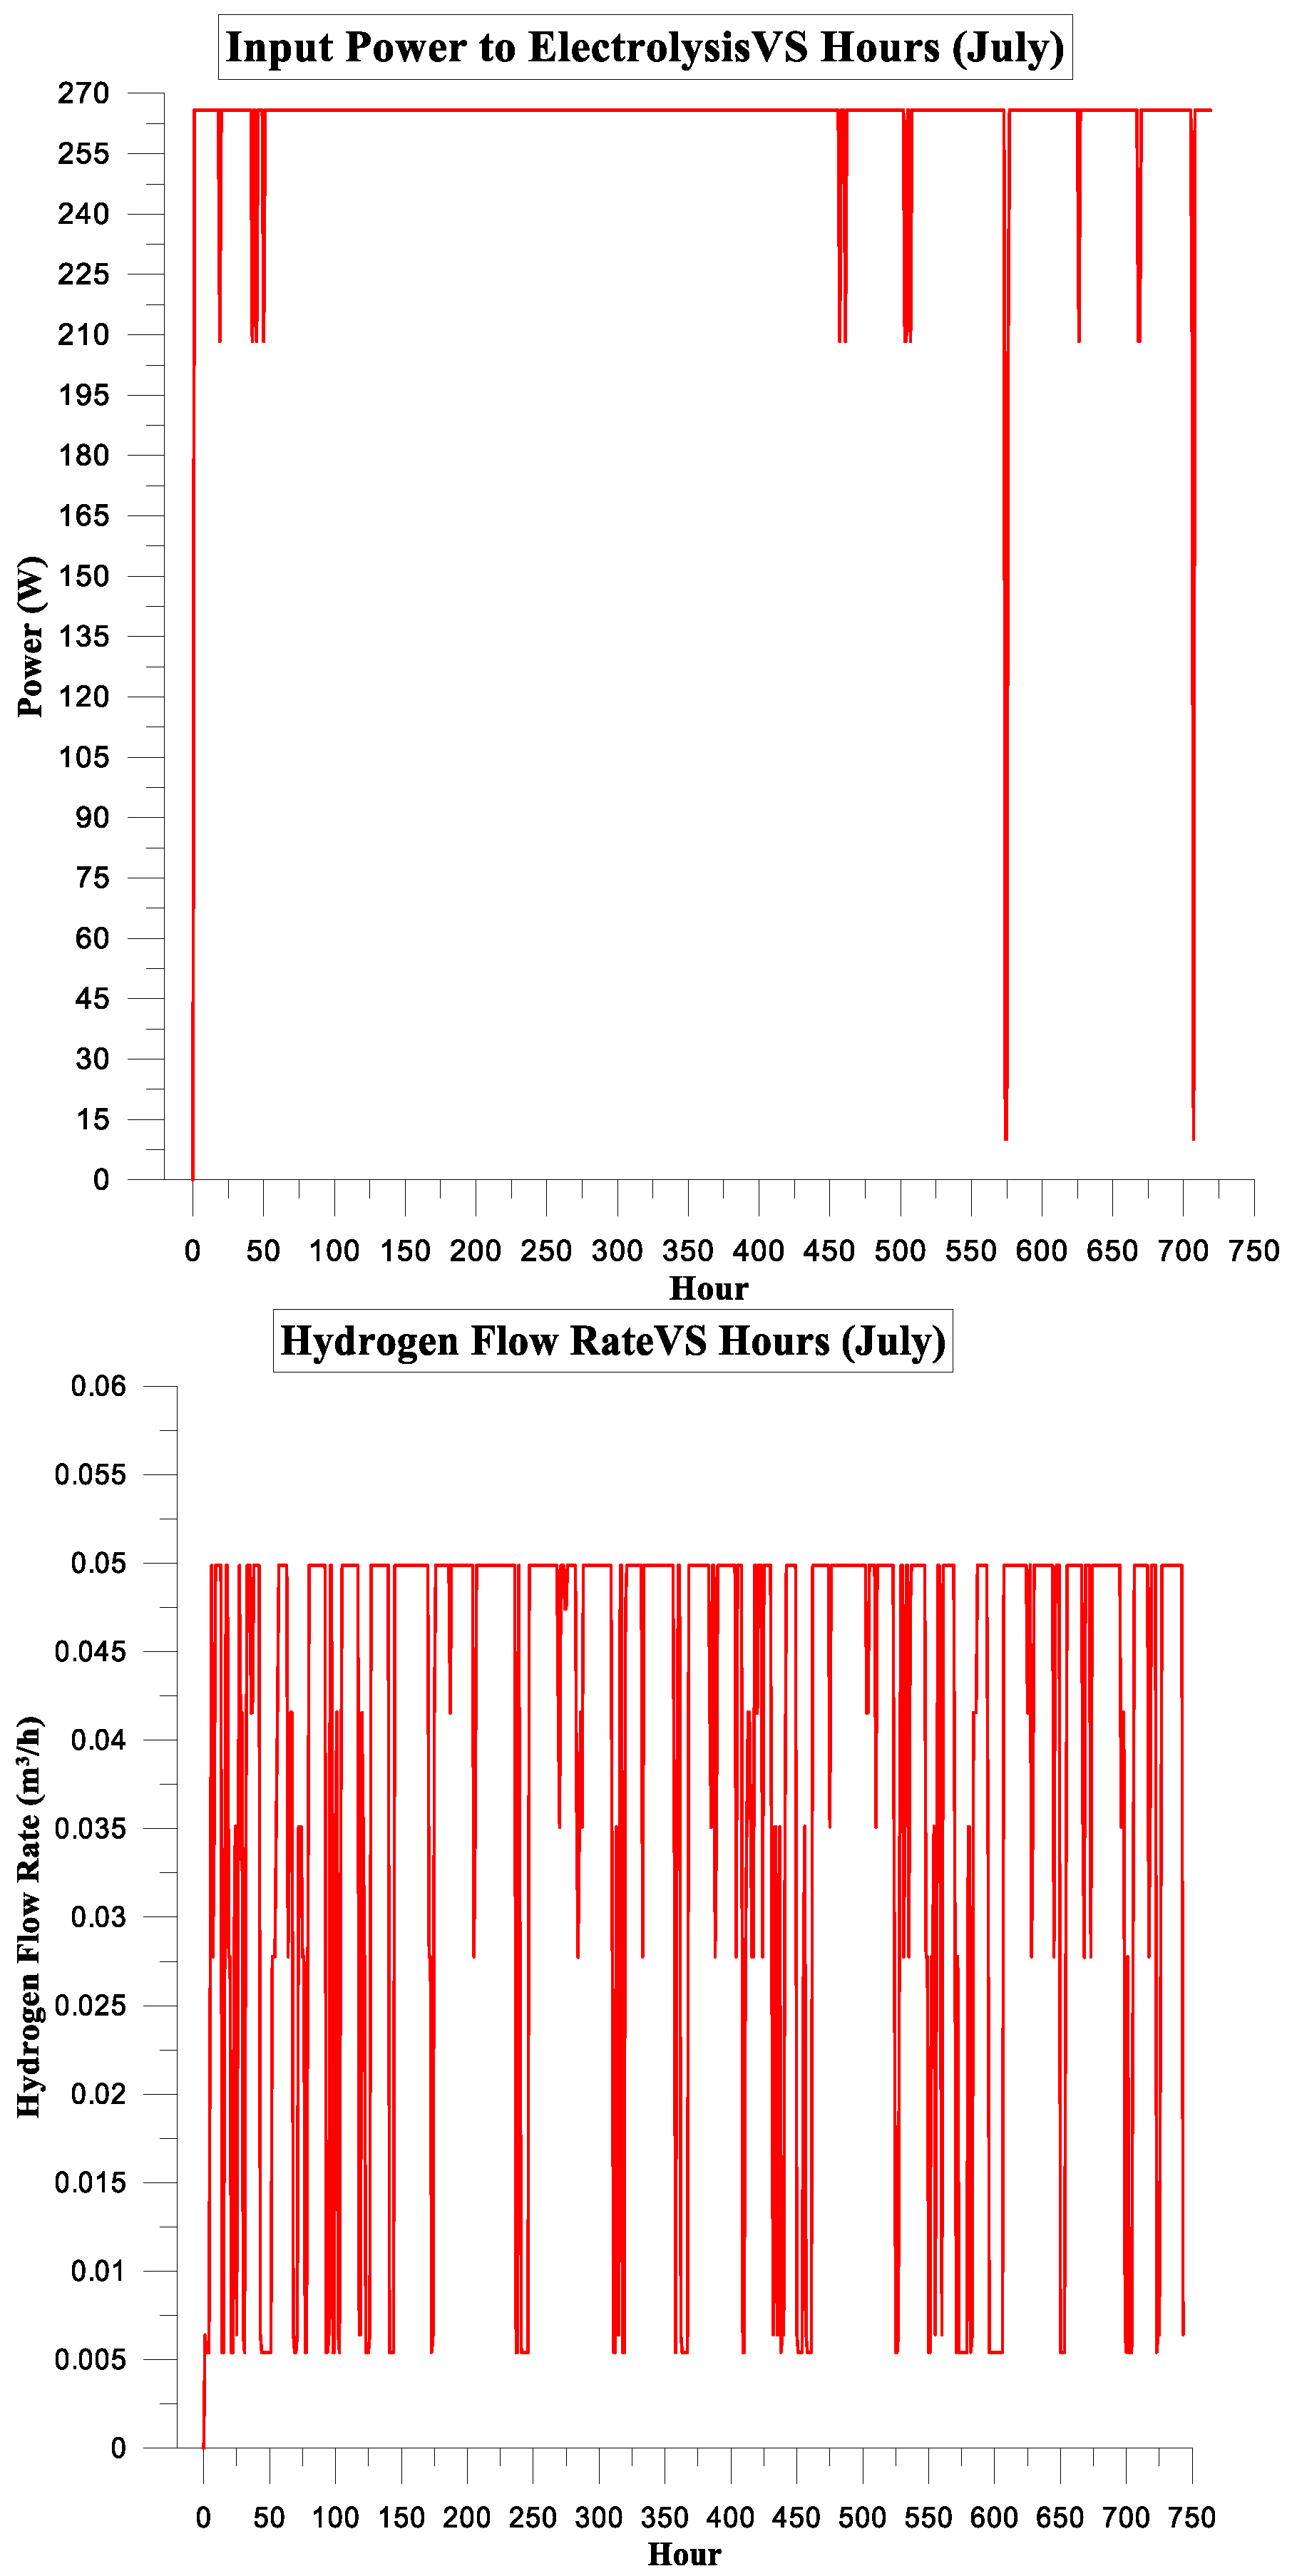
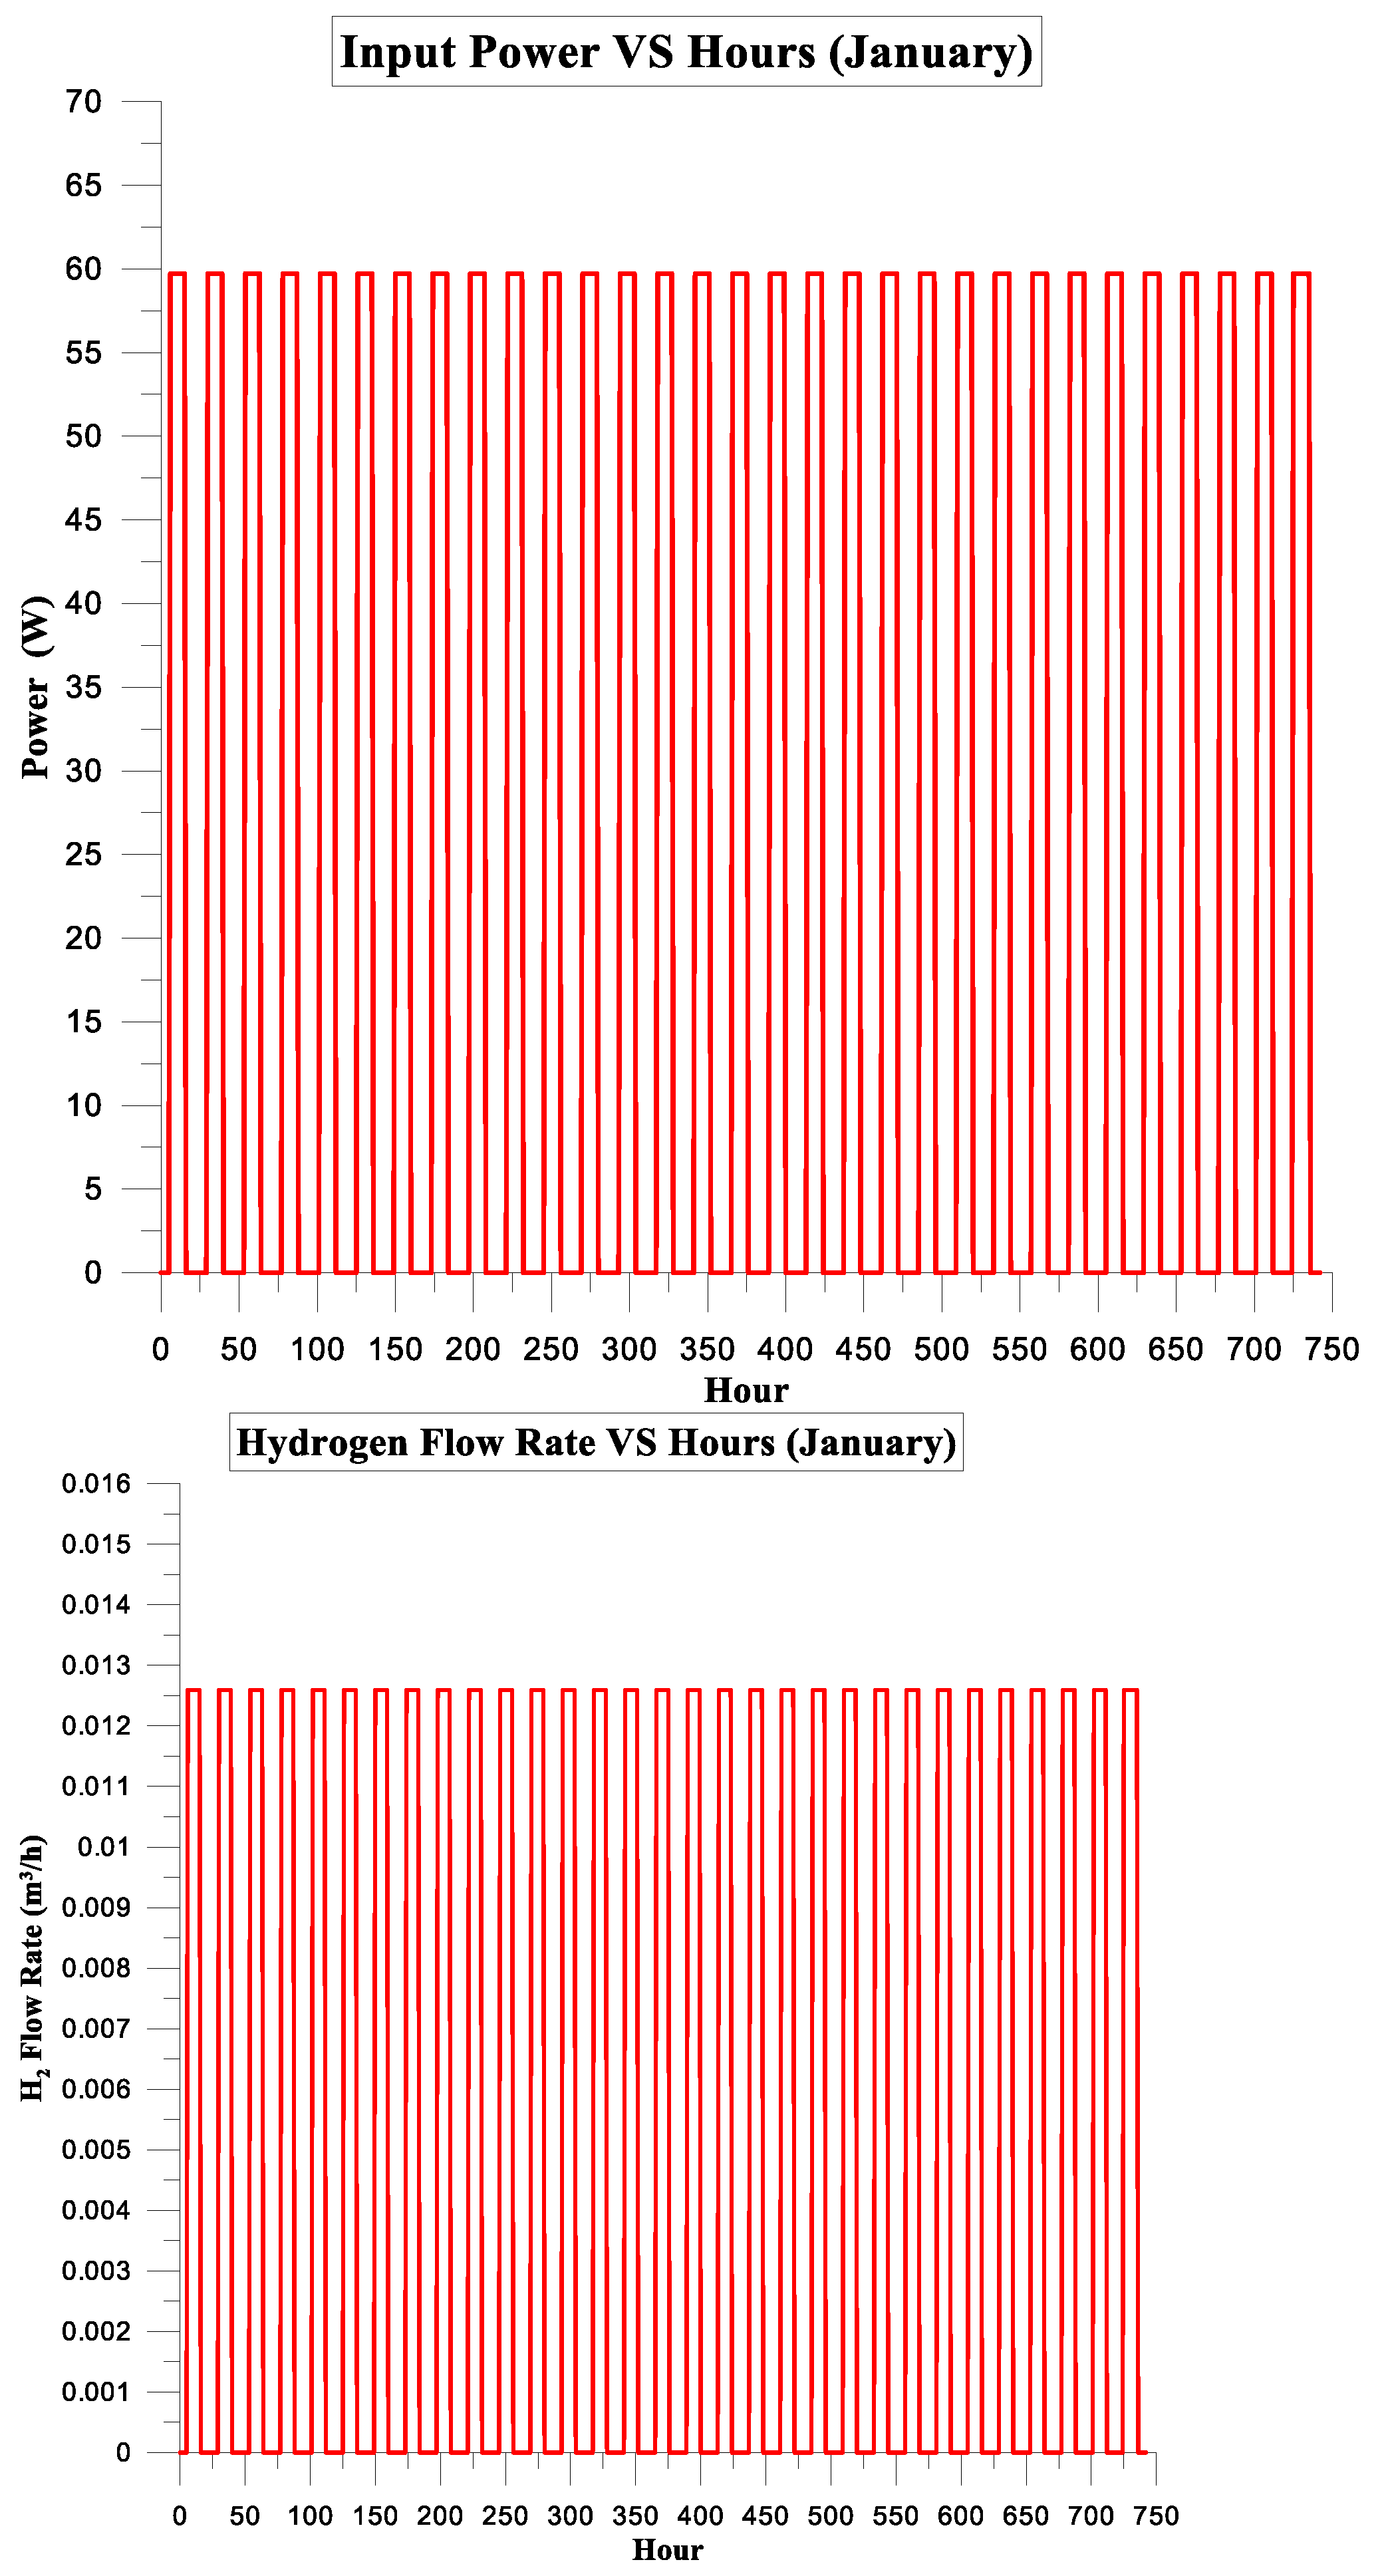
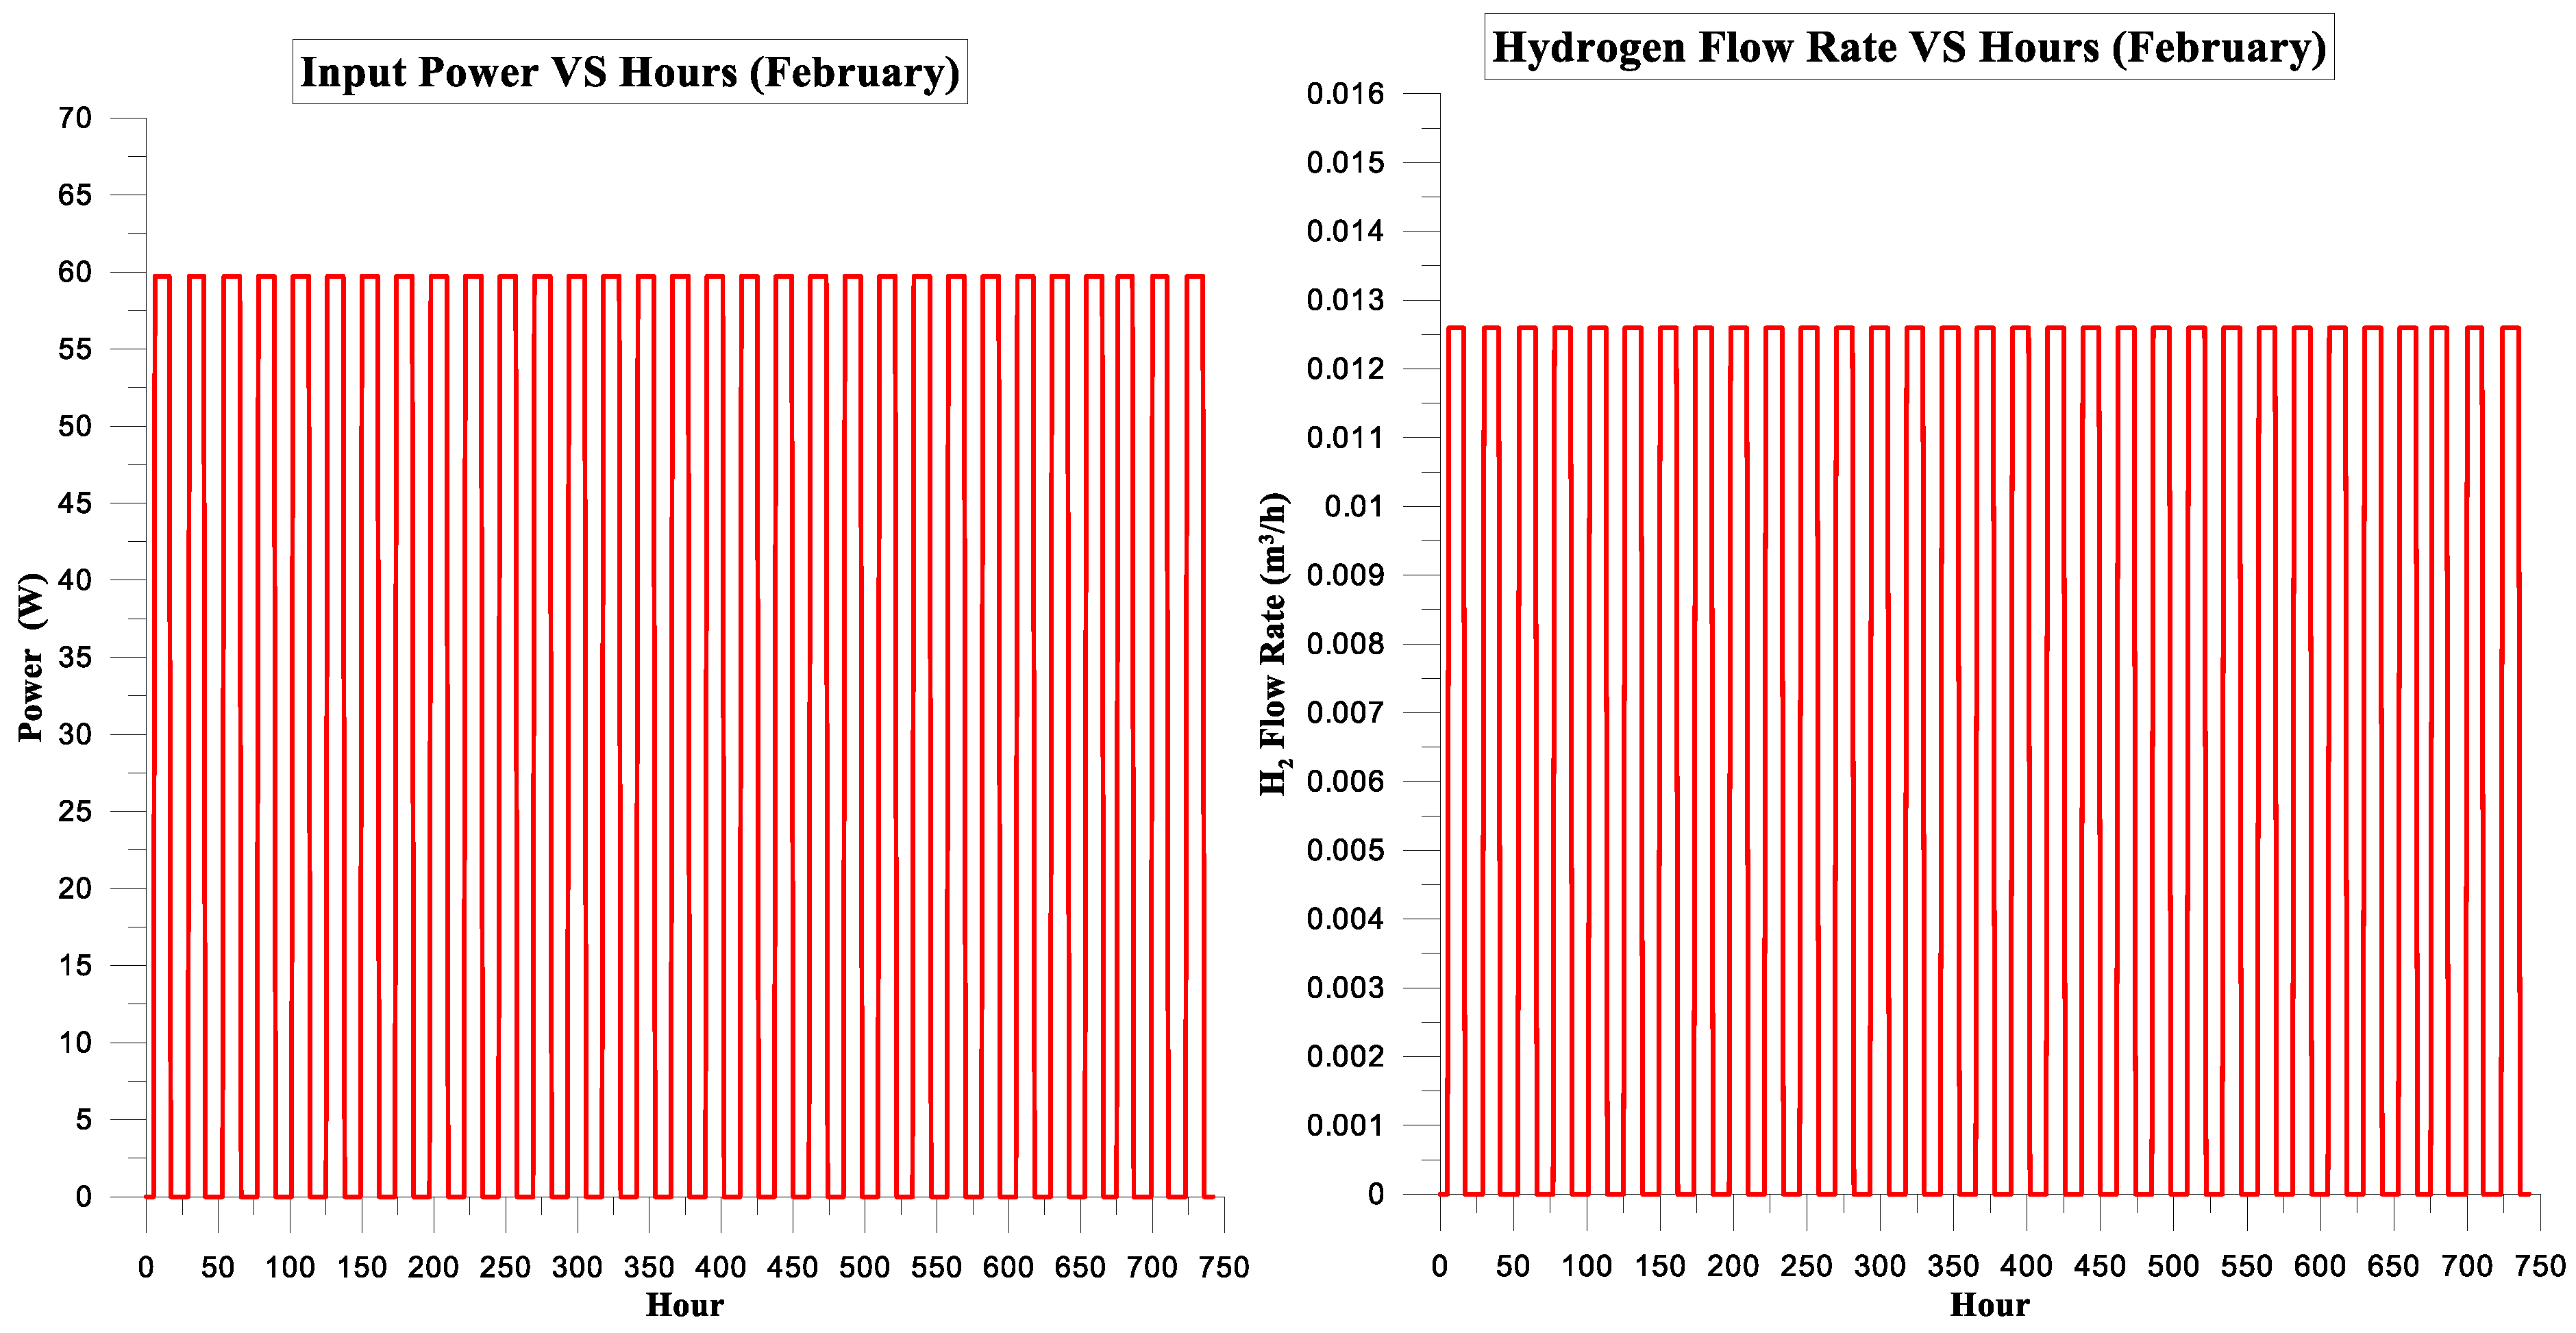
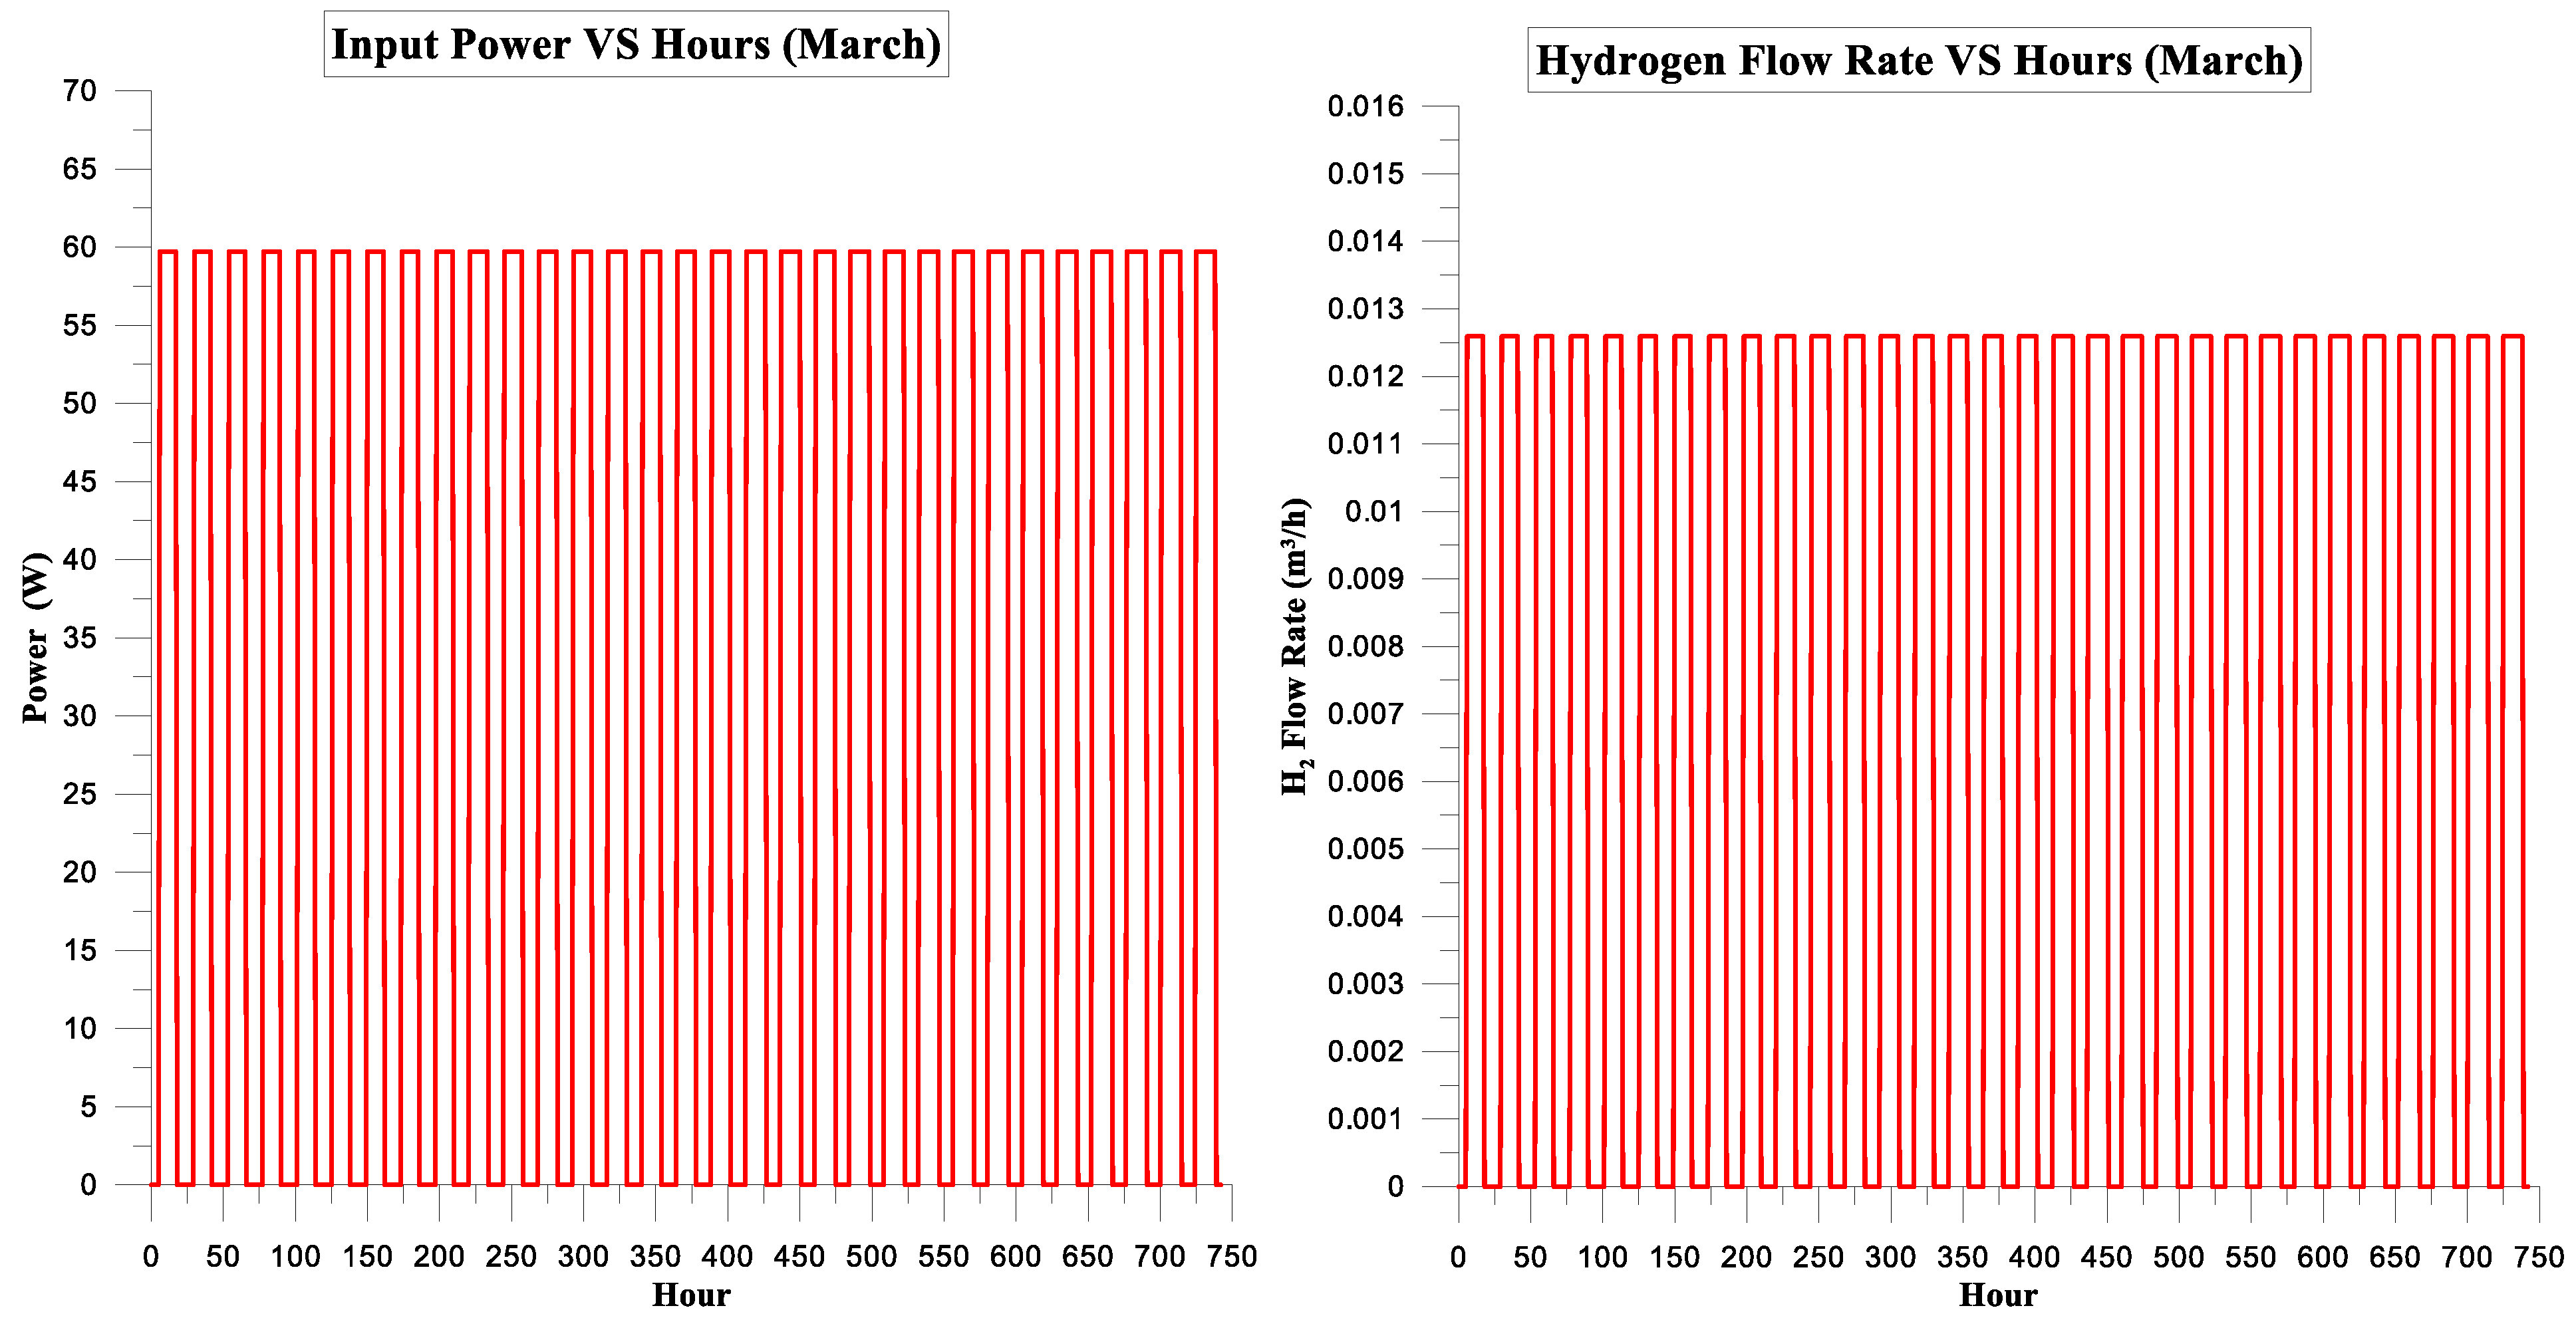
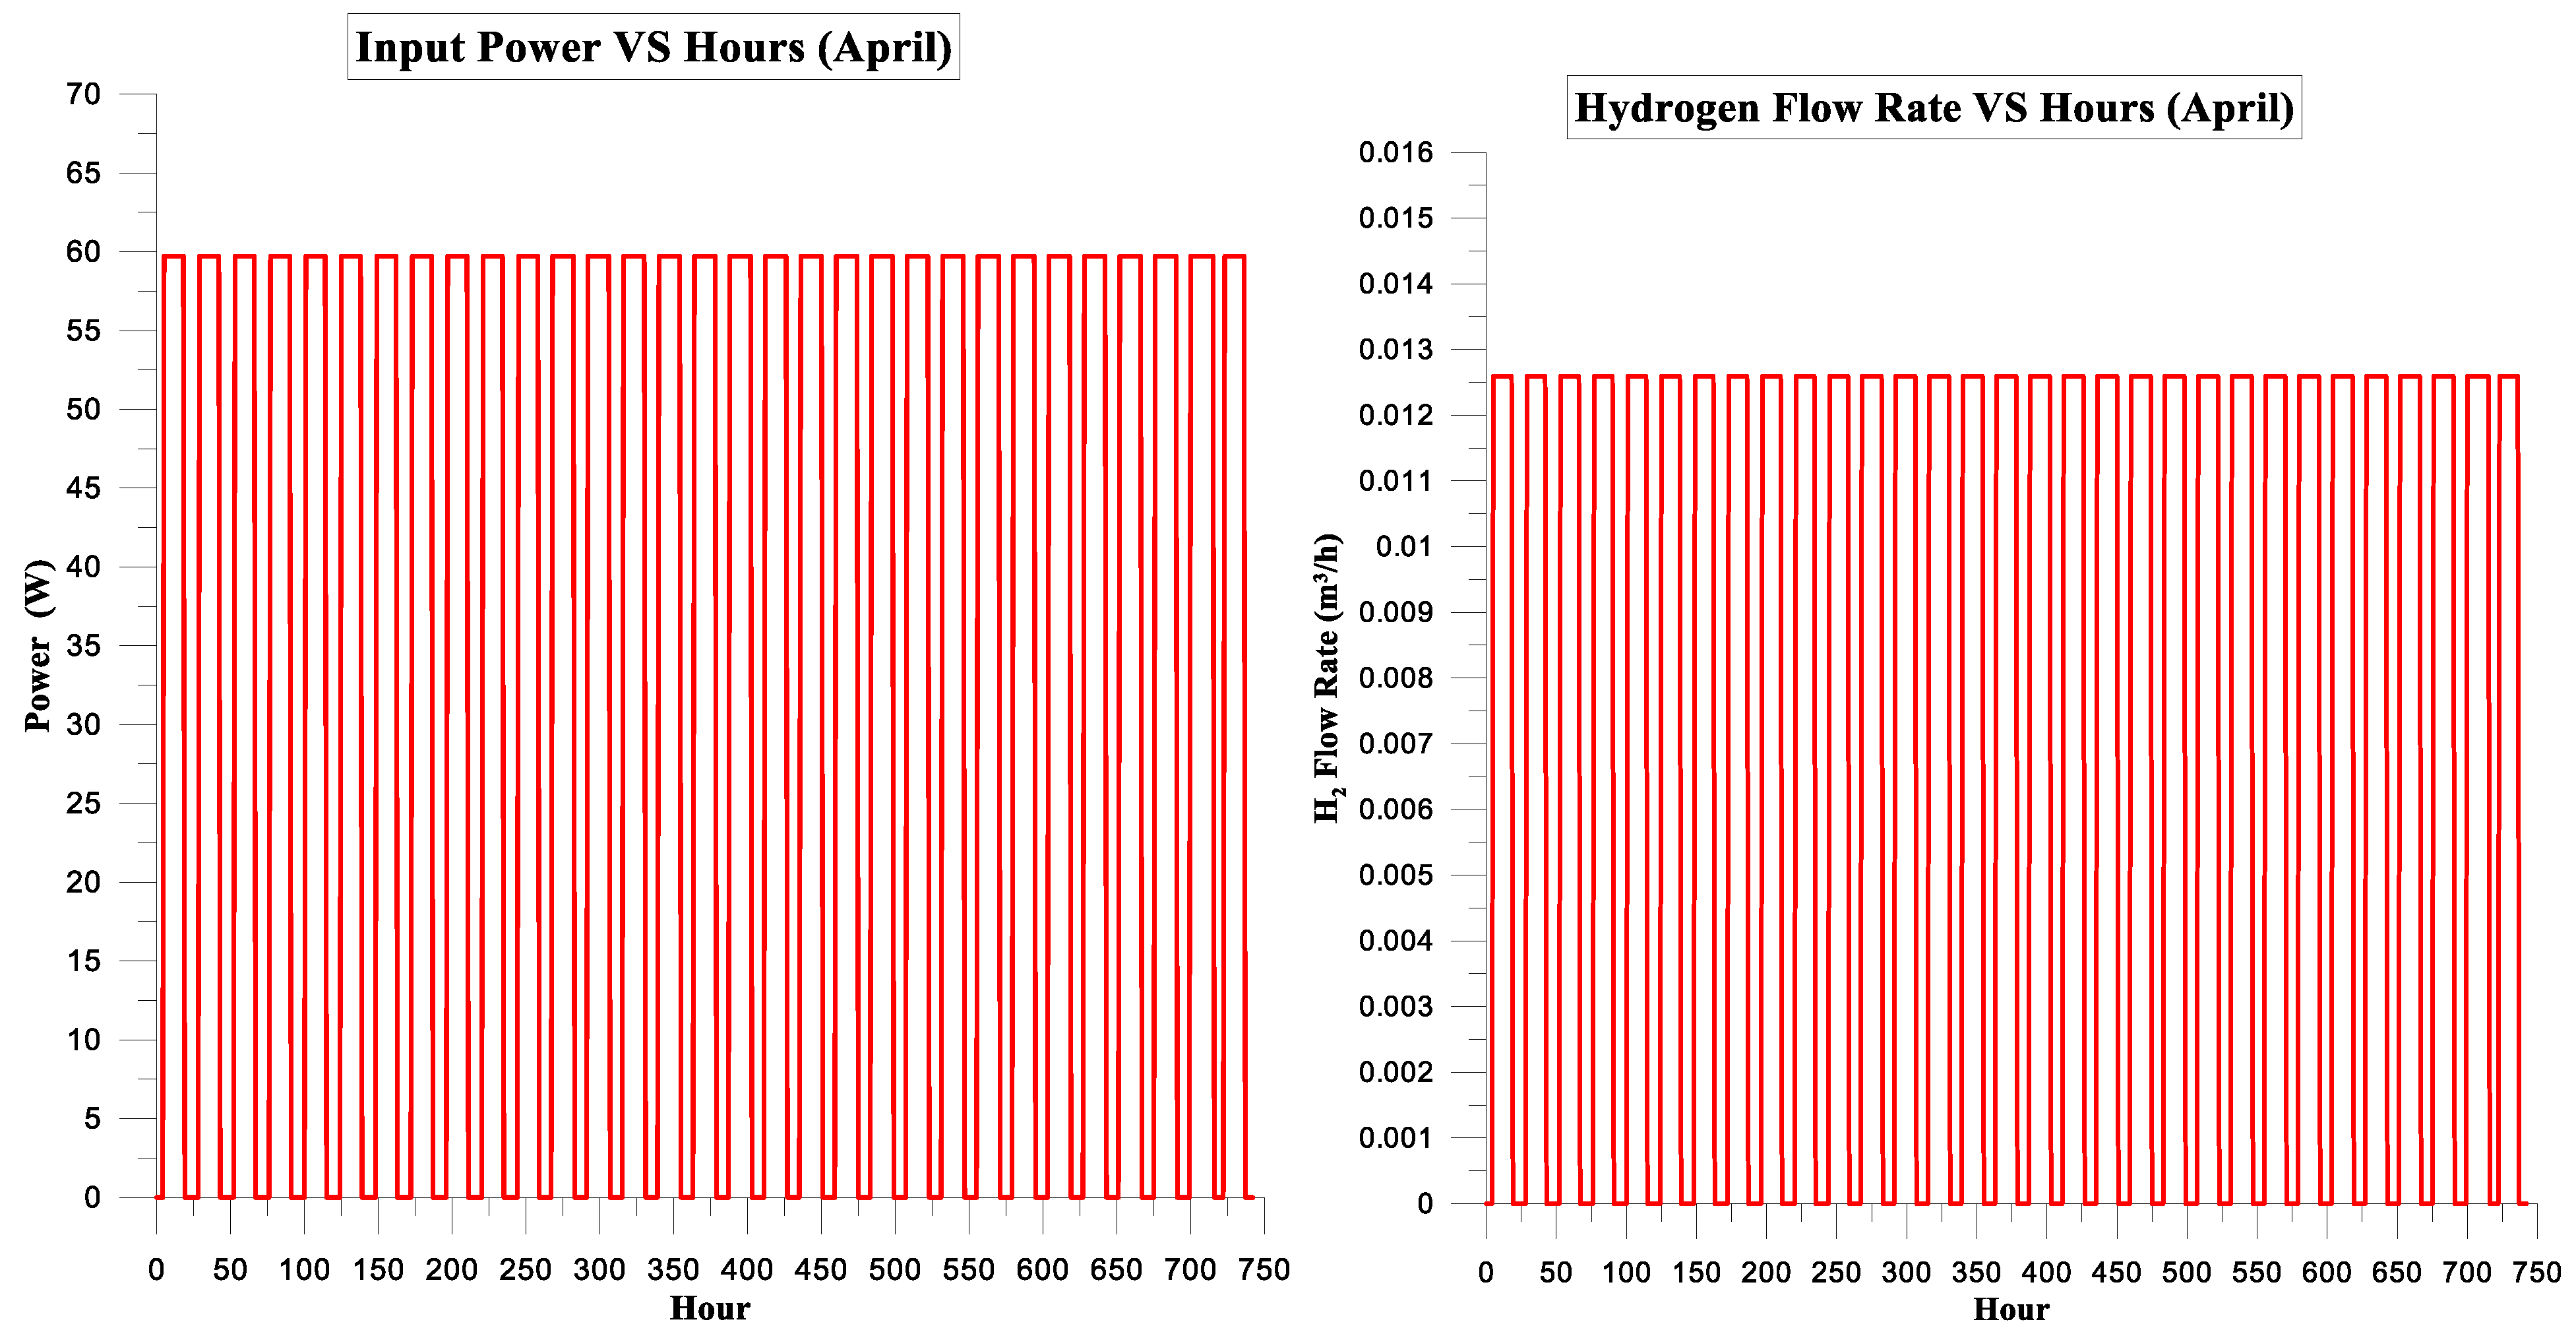
3.1.2. Simulation Results
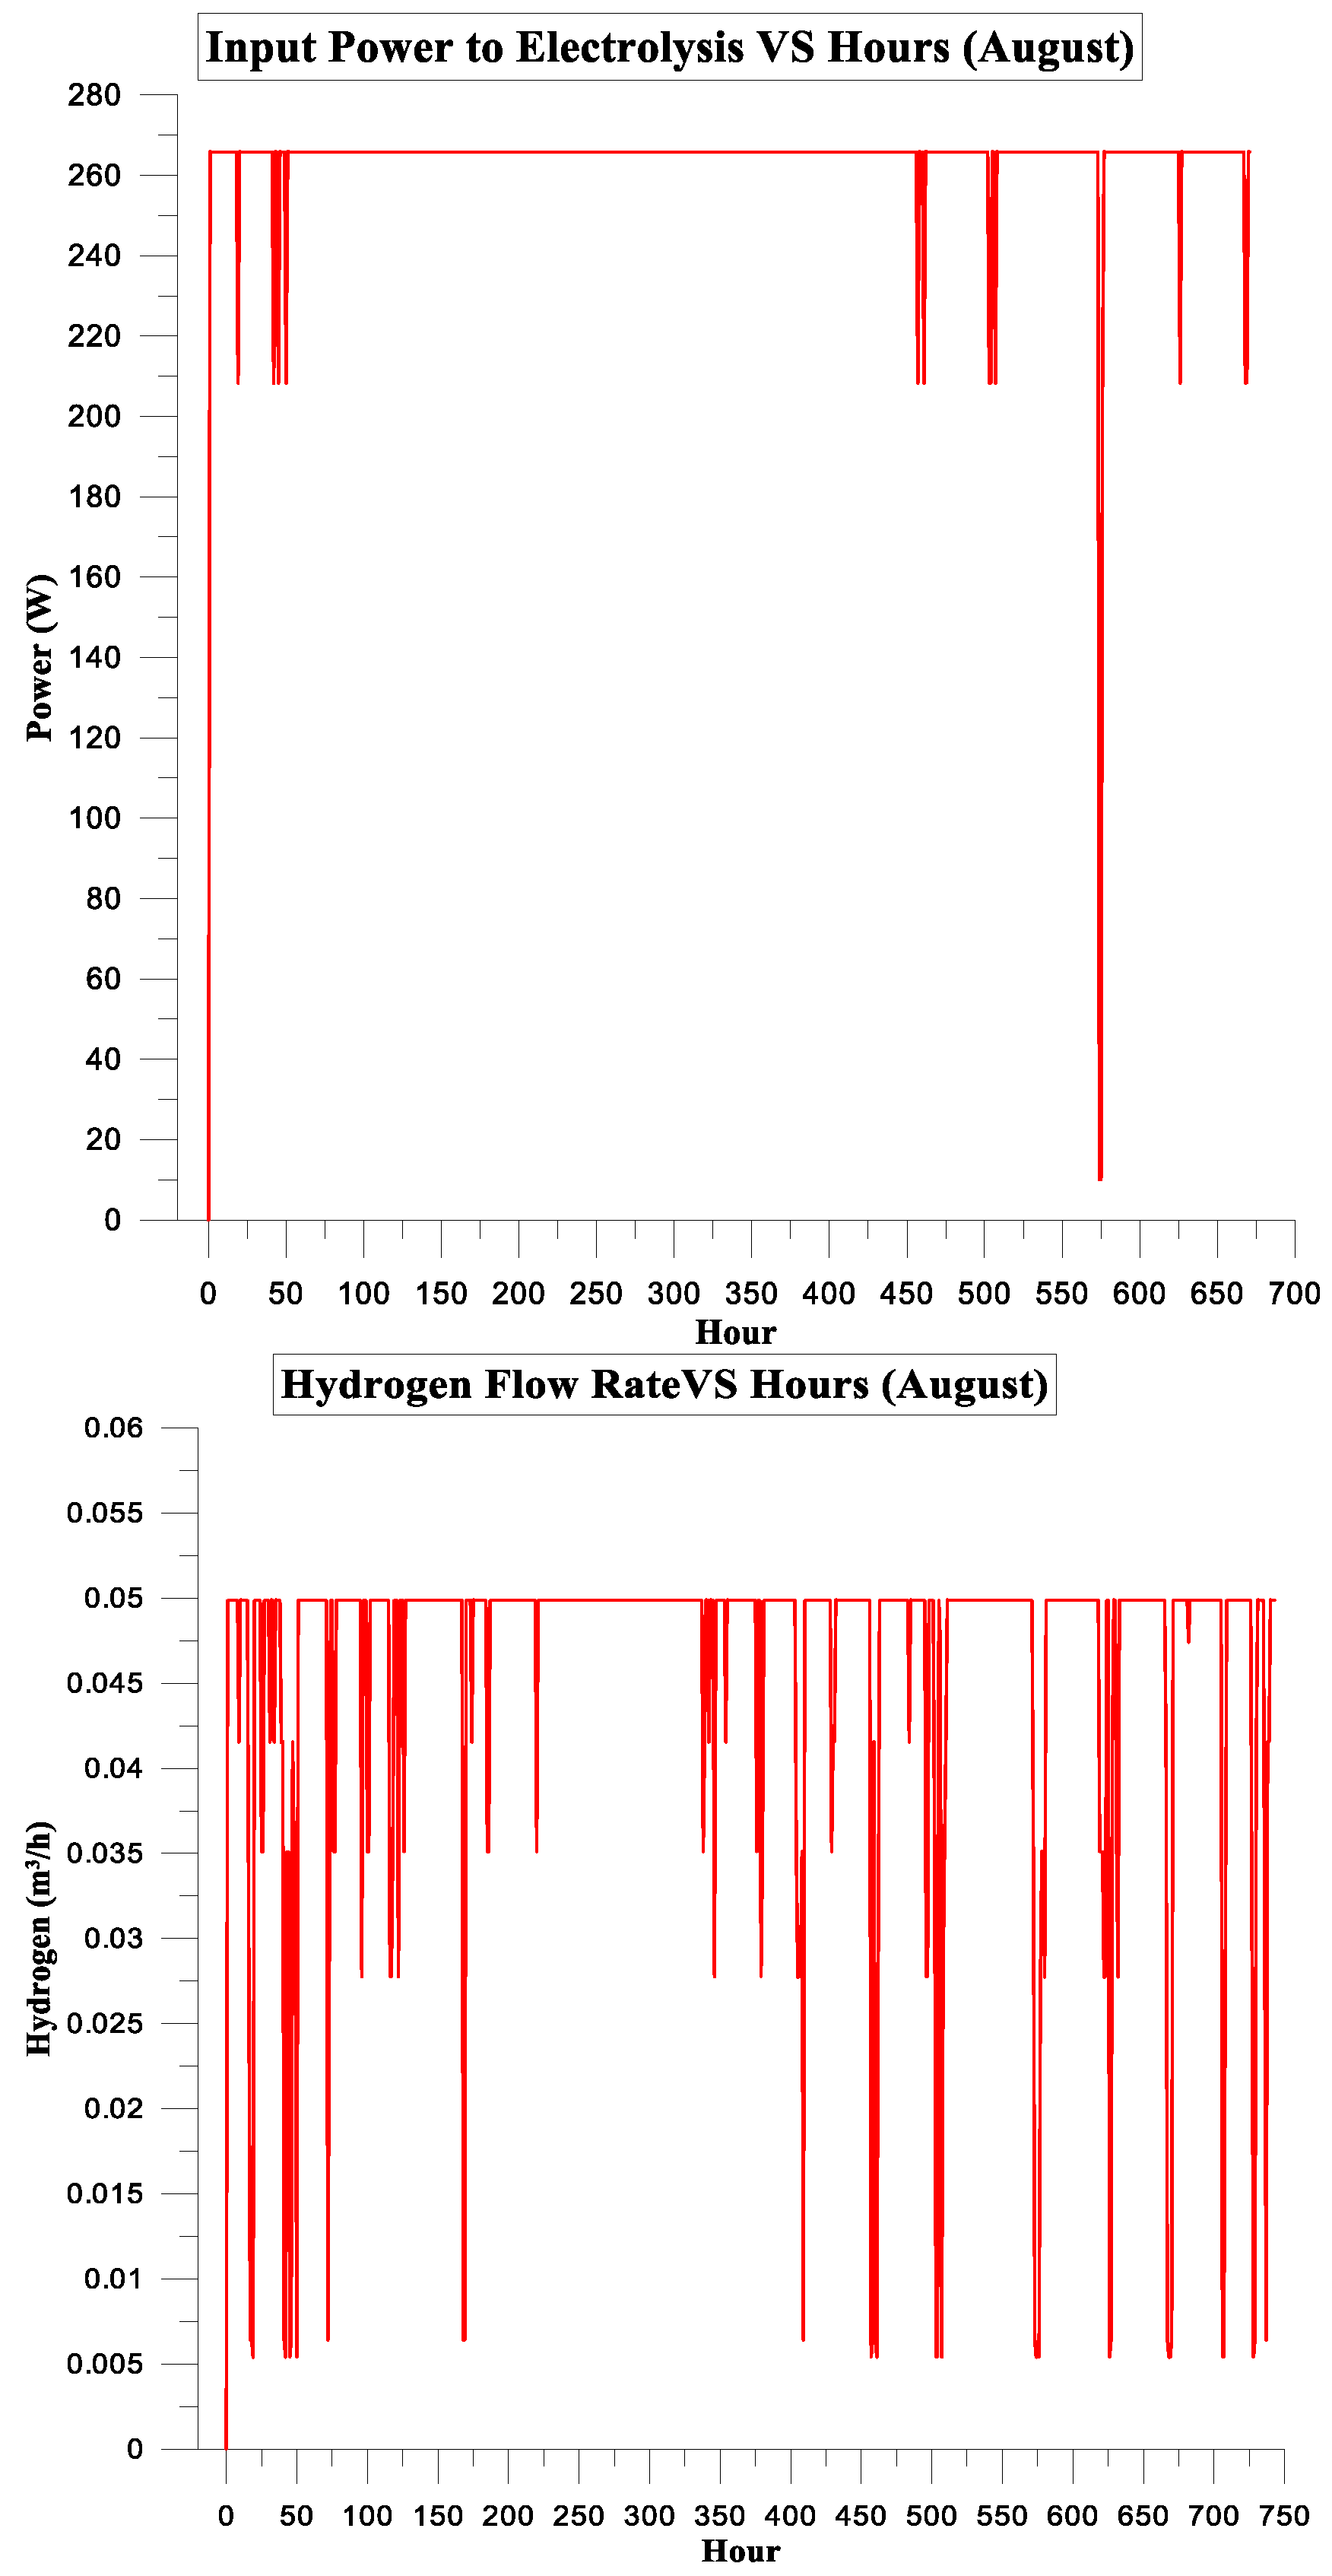
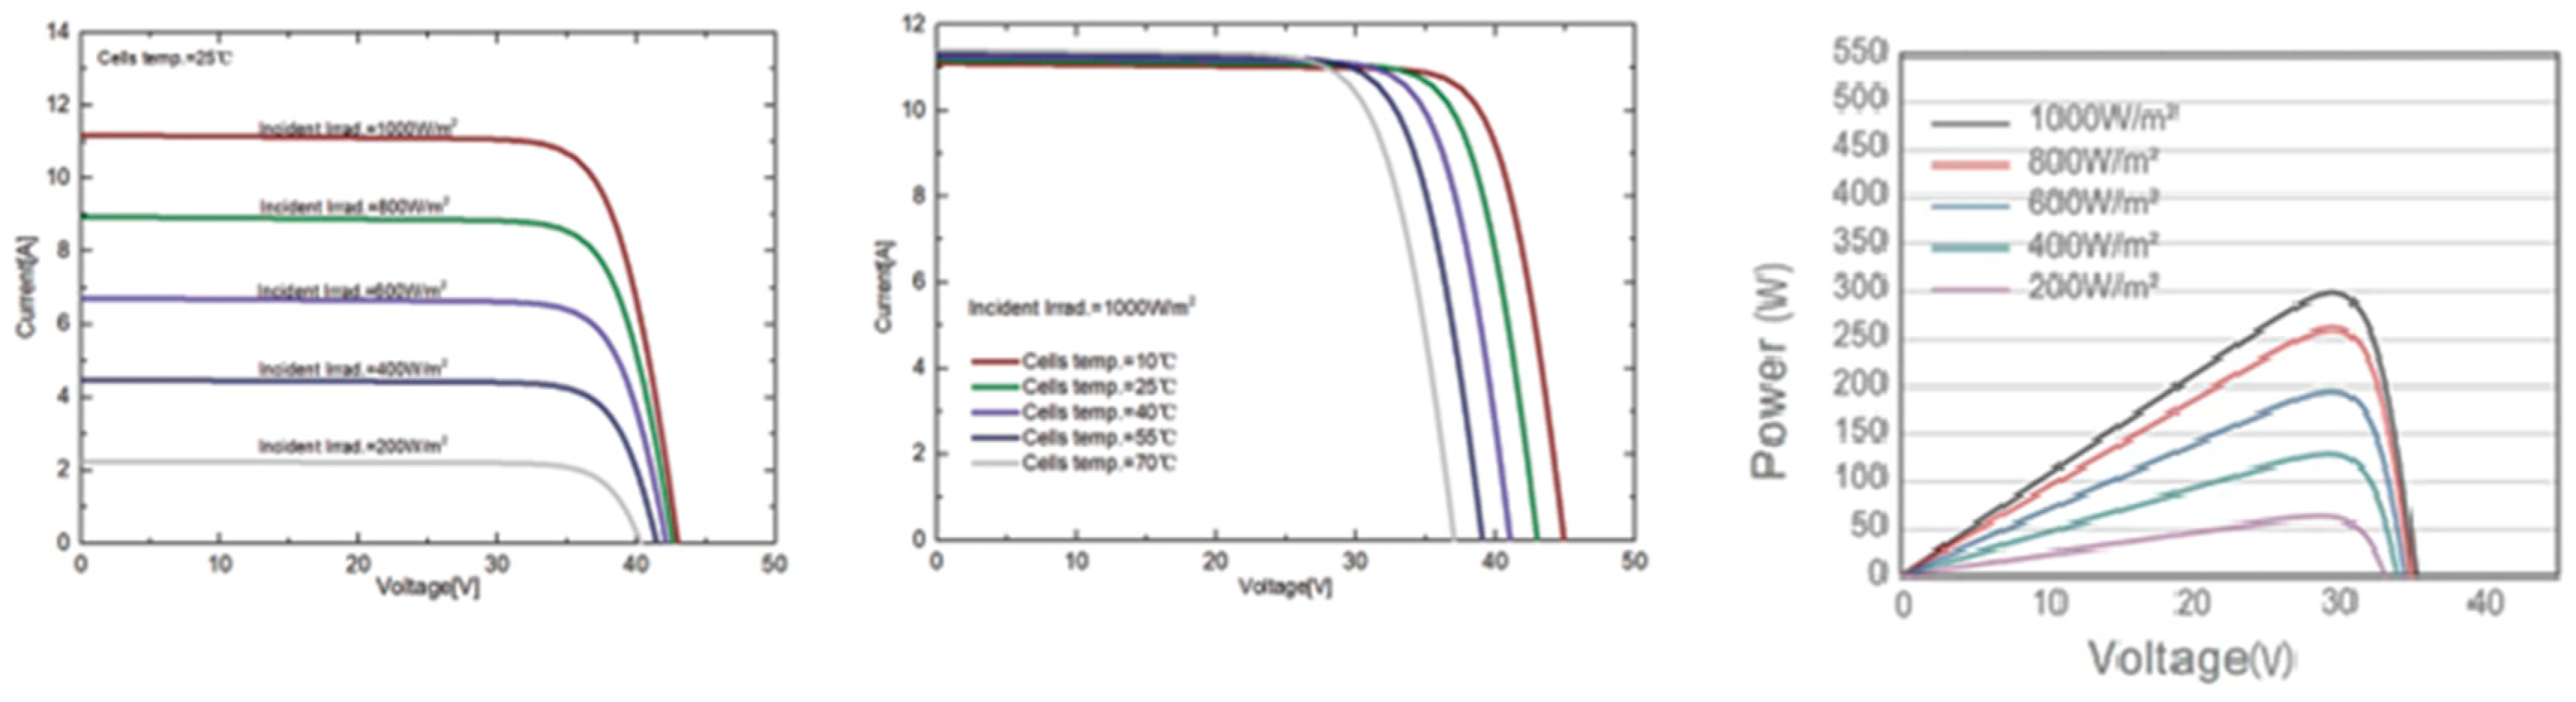
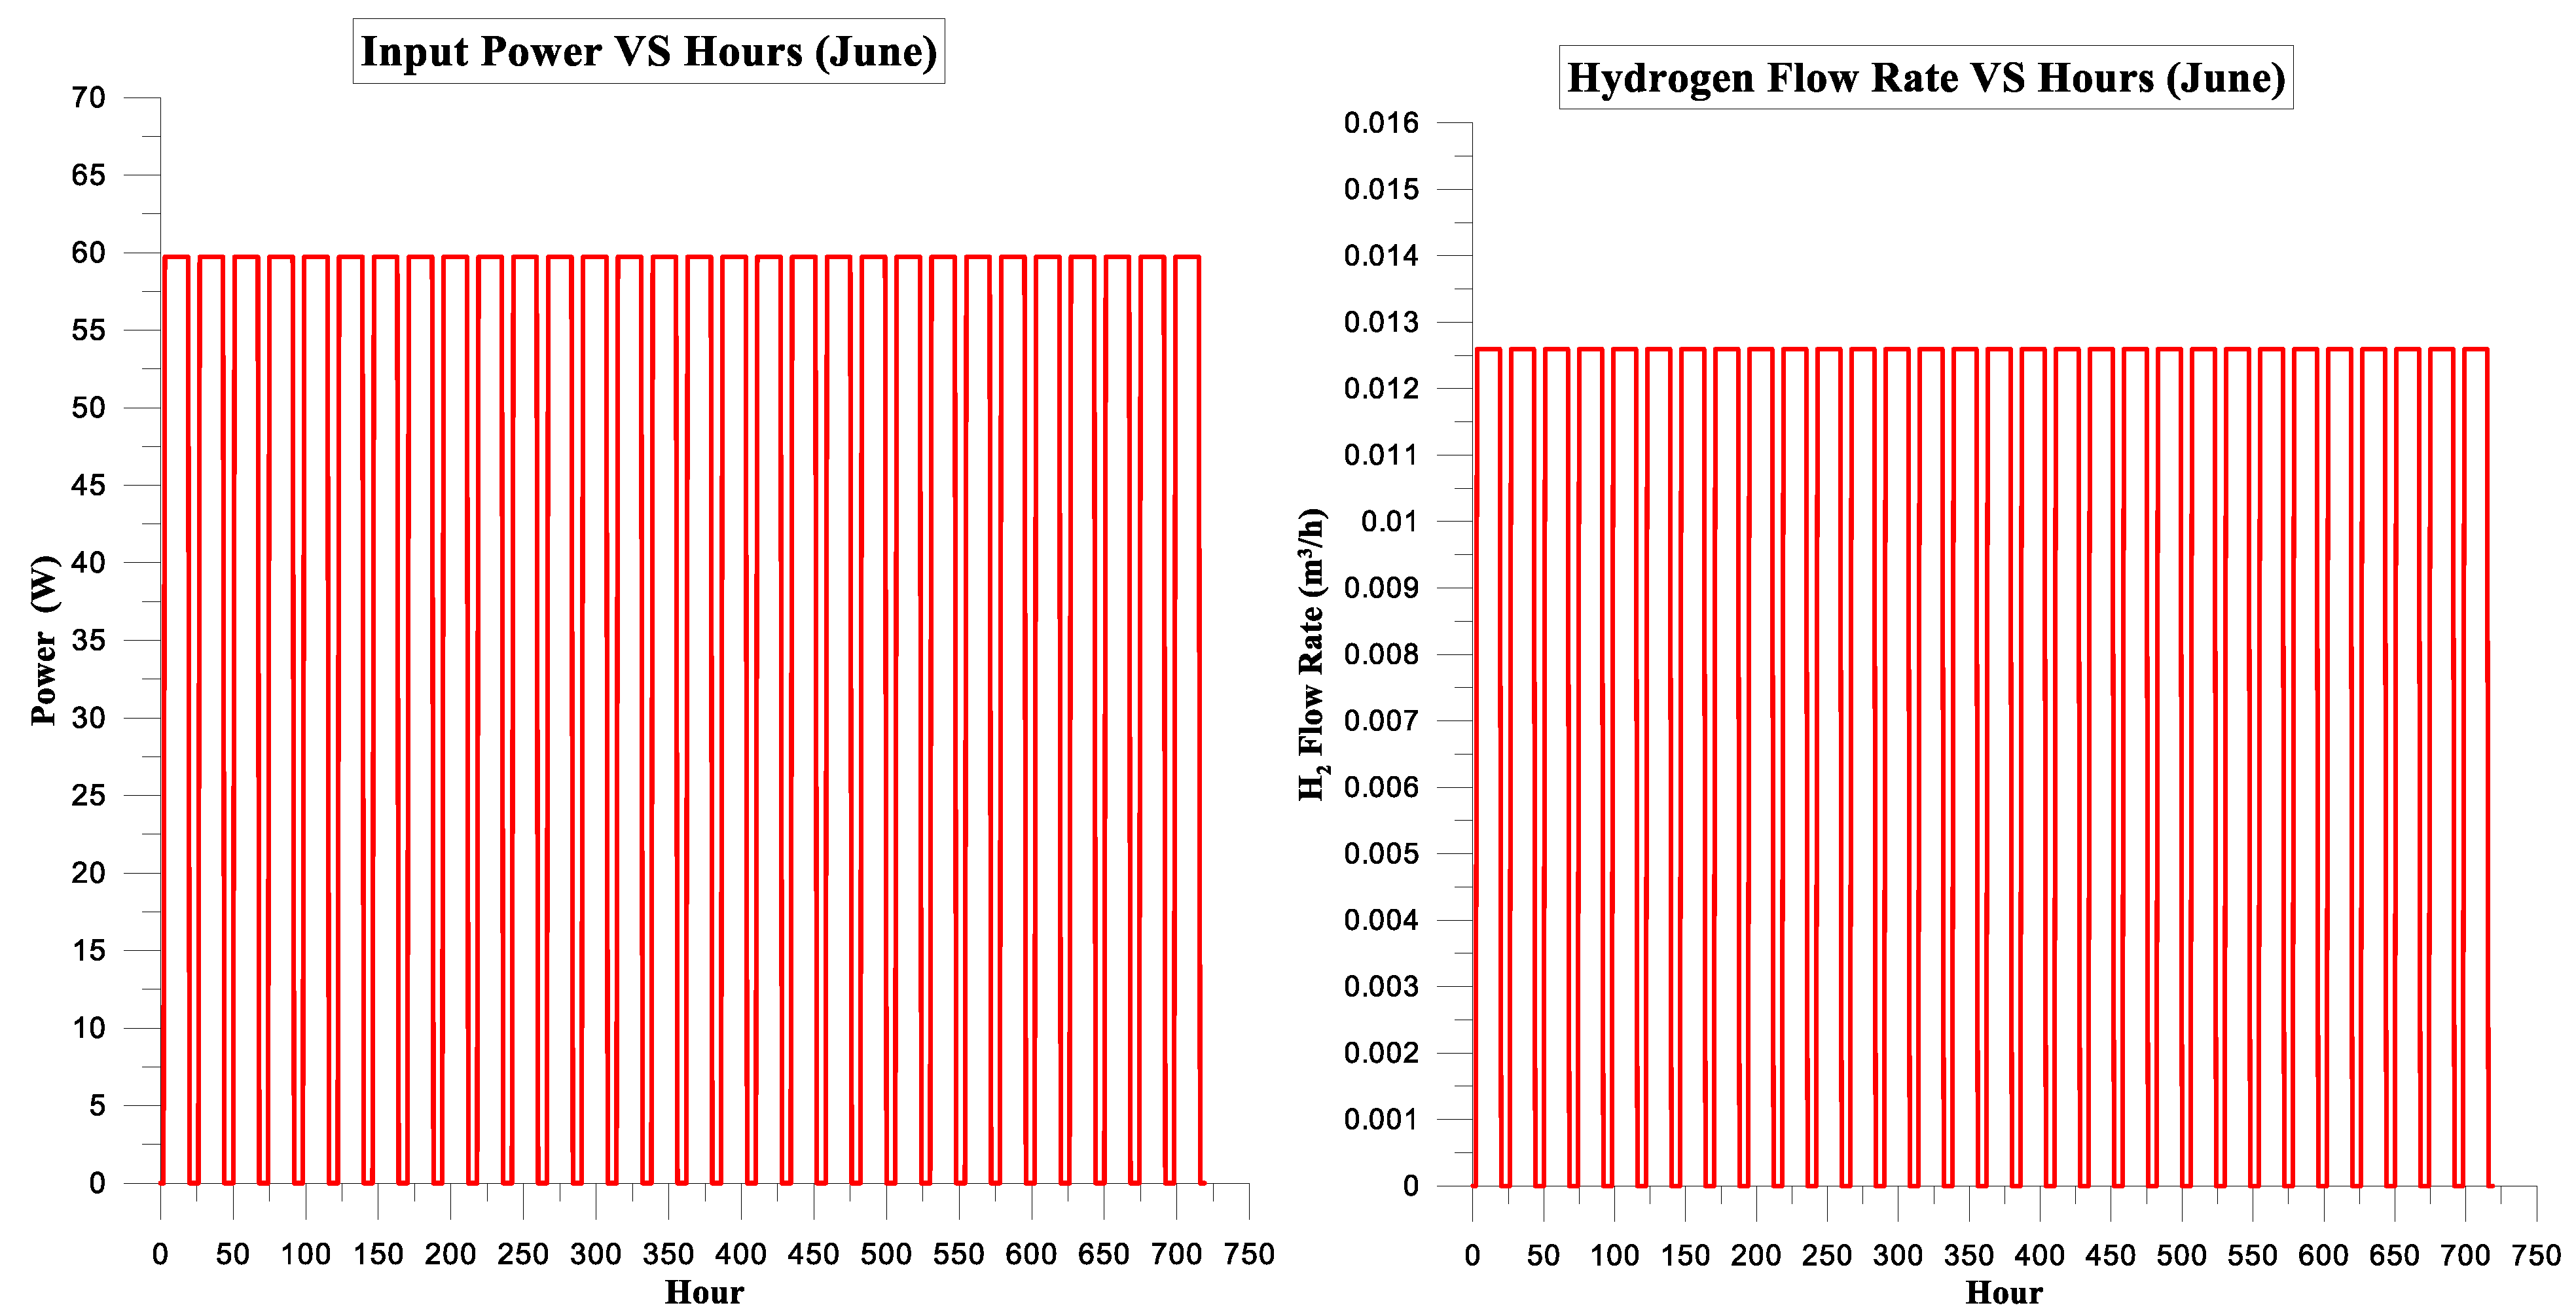
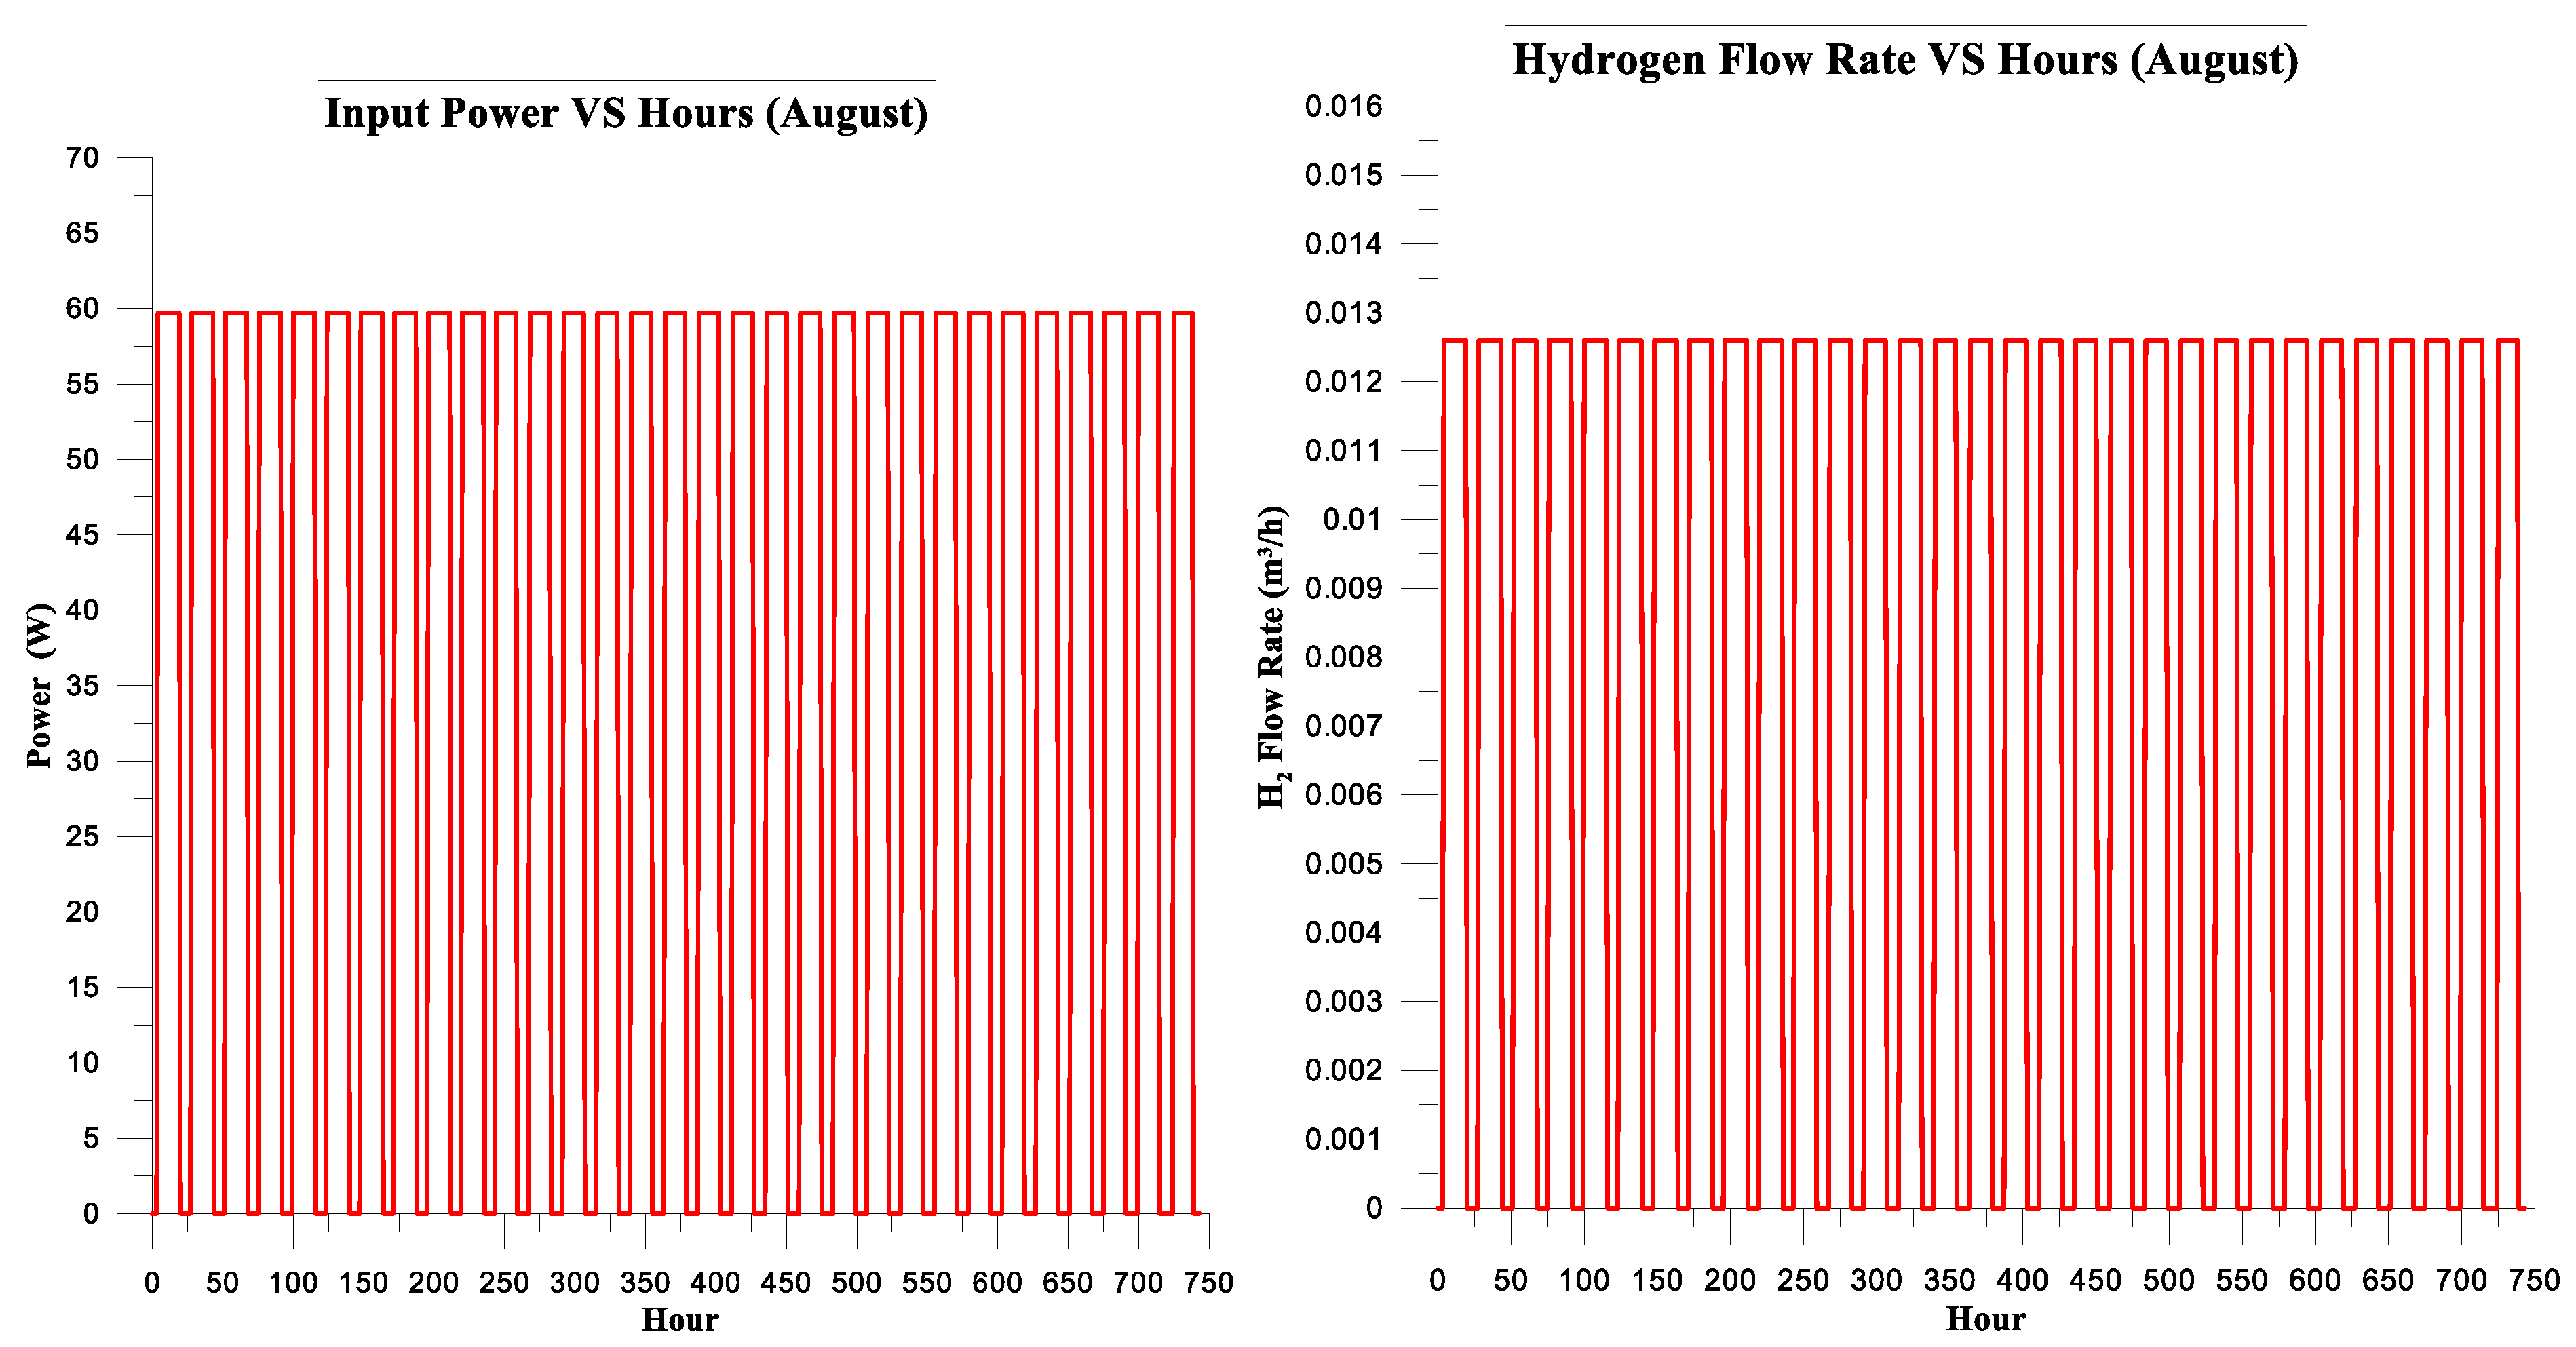
3.2. PV Panel Power Source
Simulation Parameters
4. Conclusions
- The analysis indicates that the system consistently supplies enough energy to meet the laboratory’s load demand throughout the year, potentially enabling net-zero energy operations in the Markham zone, Toronto, Canada.
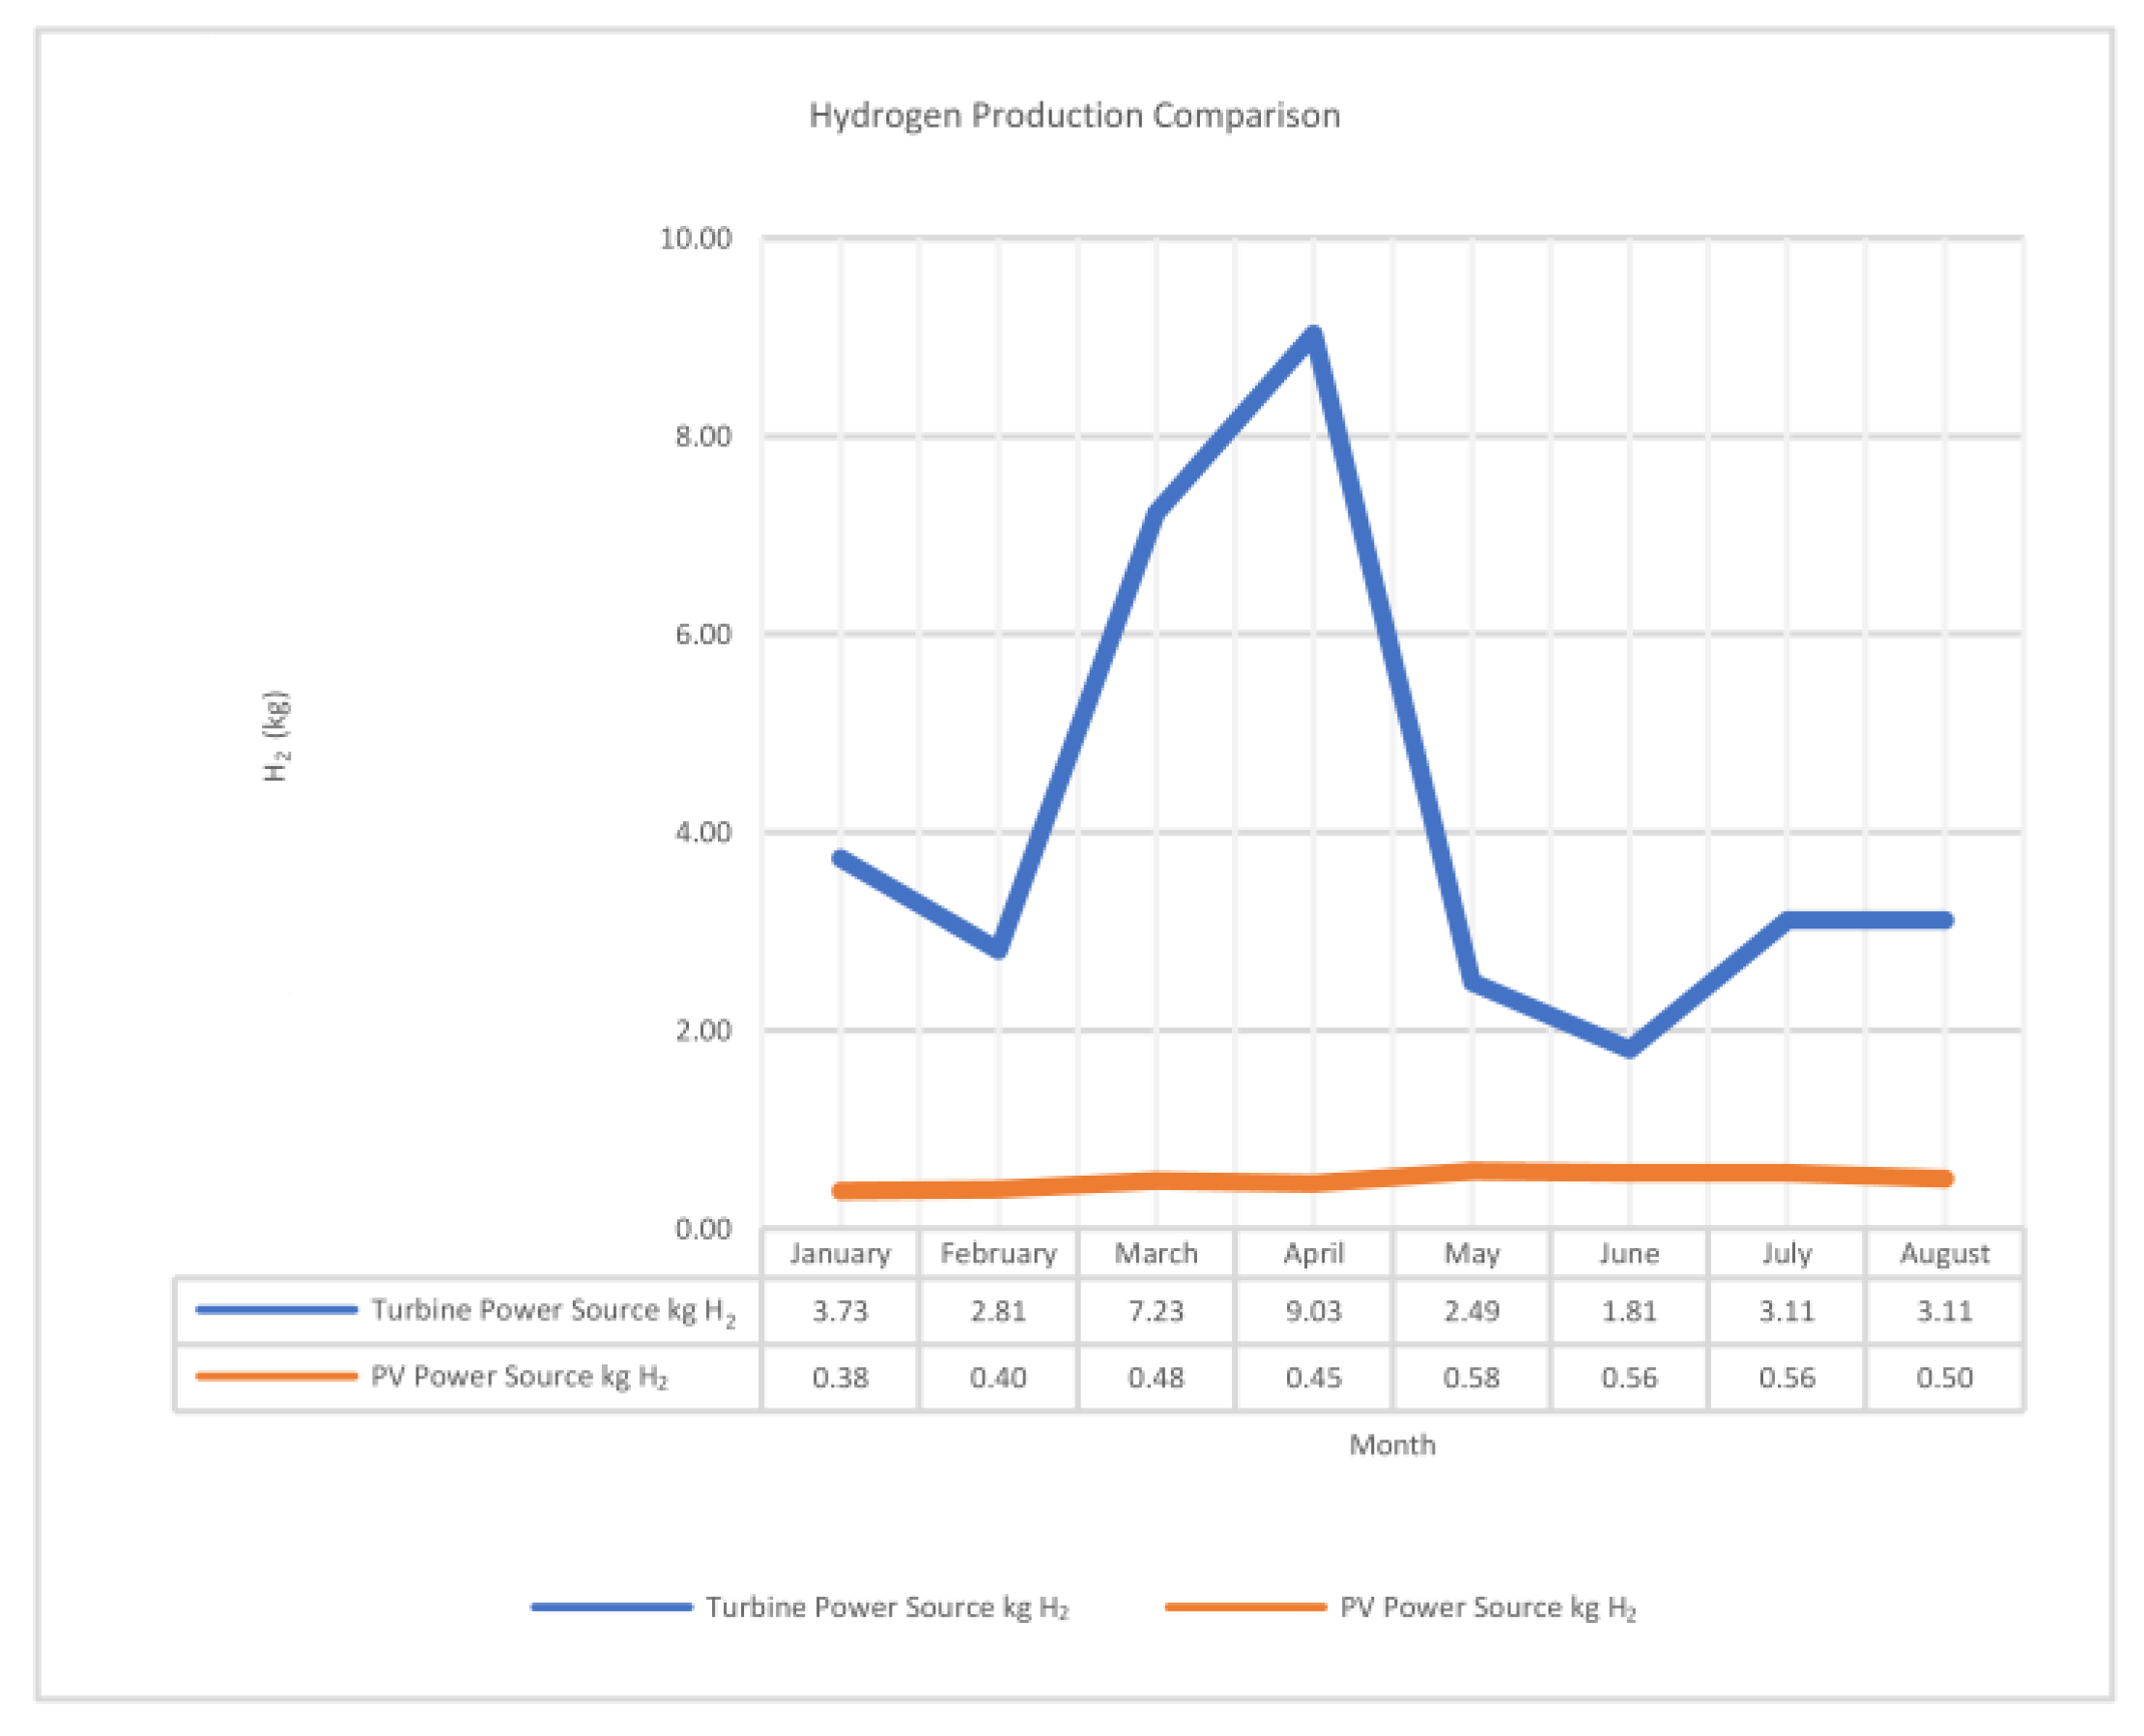
- The wind turbine exhibits an average power consumption of 224.70 kWh, generating 173.541 kWh of hydrogen with an average efficiency of 79%.
- The PV panel, on the other hand, has an average power consumption of 25.829 kWh, producing 16.38 kWh of hydrogen with an average efficiency of 63%.
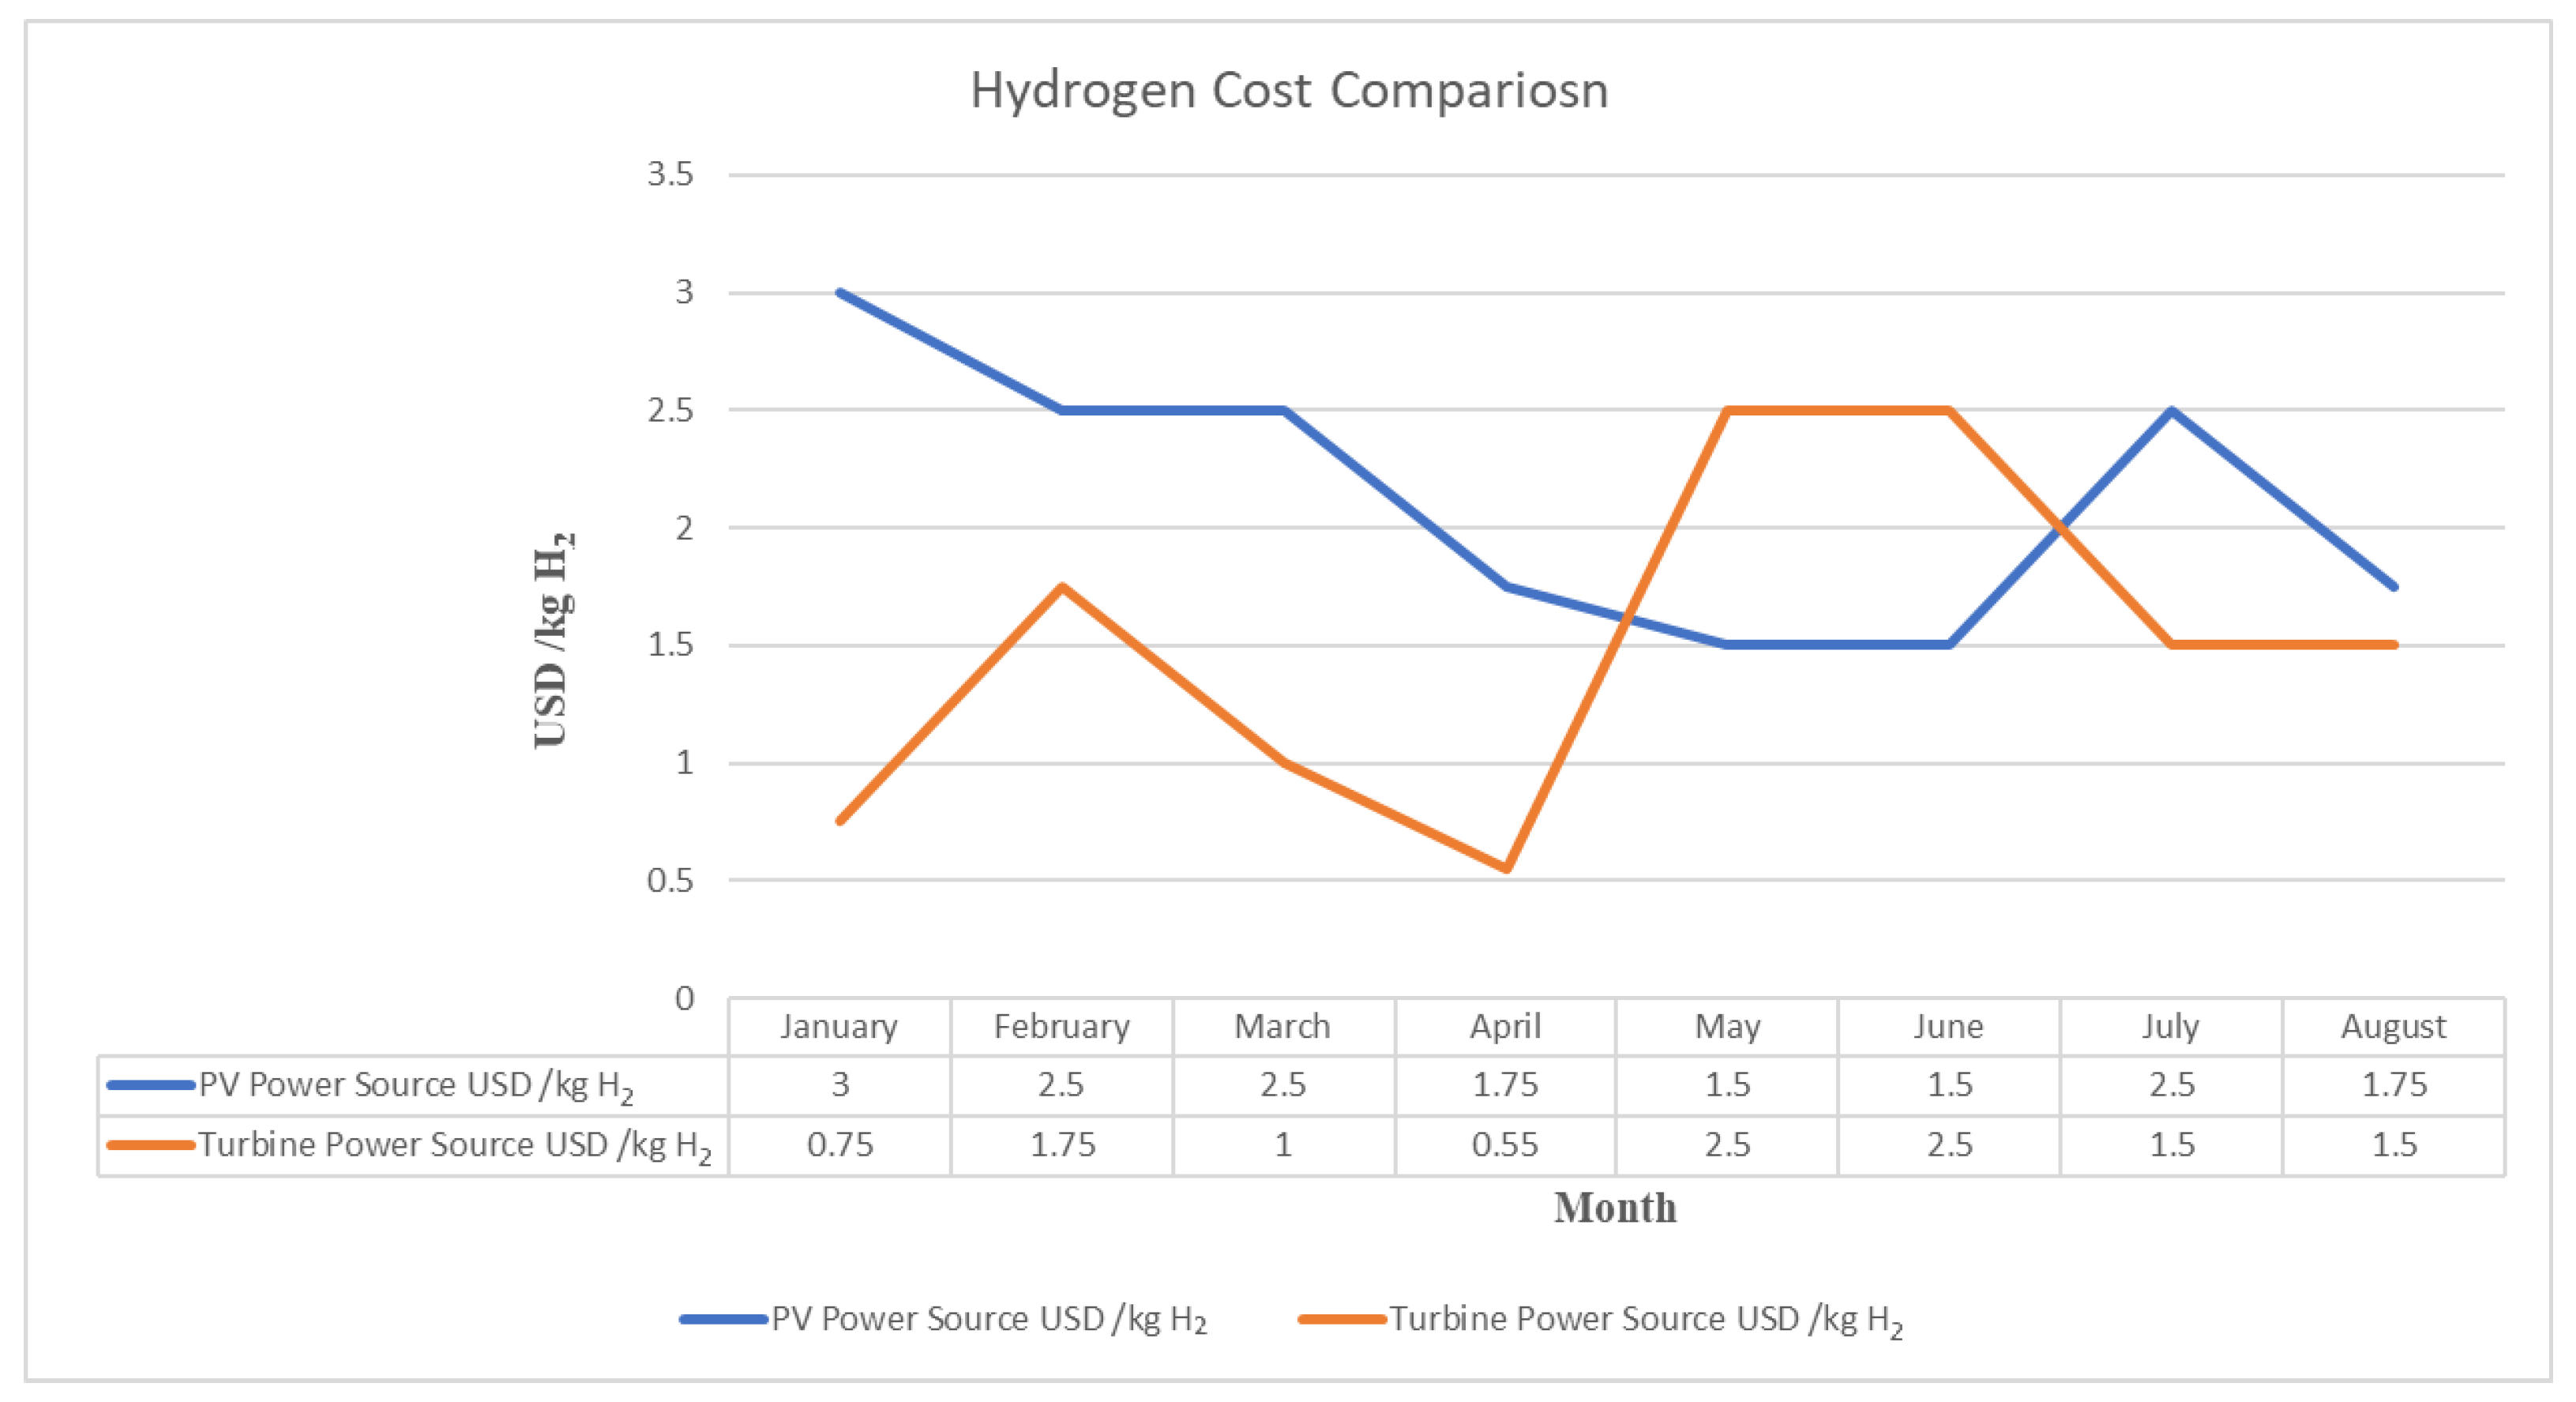
- When using the wind turbine as the power source, the maximum quantity of hydrogen generated is 9.03 kg, while it is only 0.58 kg with the PV panel power source. Additionally, the minimum cost per kilogram of hydrogen (kg H2) is USD 0.55 with the wind turbine power source, compared to USD 1.5/kg H2 with the PV panel power source.
Author Contributions
Funding
Institutional Review Board Statement
Informed Consent Statement
Data Availability Statement
Acknowledgments
Conflicts of Interest
Nomenclature
| Symbol | Meaning |
| PV | Photovoltaic panel |
| WT | Wind turbine |
| STC | Standard Test Conditions |
| CF | Capacity factor |
| Pmax | Rated Maximum Power (W) |
| Voc | Open-Circuit Voltage (V) |
| Vmp | Maximum Power Voltage (V) |
| Isc | Short-Circuit Current (A) |
| Imp | Maximum Power Current (A) |
| α | Temperature Coefficient of Isc |
| β | Temperature Coefficient of Voc |
| γ | Temperature Coefficient of Pmax |
| Rotor_Ht | Turbine rotor centre height (m) |
| Rotor_Di | Turbine rotor diameter (m) |
| Sher_Exp | Power-law exponent for vertical wind profile |
| Turb_Int | Turbulence intensity valid for this curve |
| Air_Dens | Air density (kg/m3) |
| Pwr_Ratd | Rated power of turbine (W) |
| Spd_Ratd | Rated wind speed (m/s) |
| IELY | Current through single electrolyzer stack (A) |
| PELY | Electrolyzer pressure (pa) |
| TROOM | Room temperature (°C) |
| TELY | Temperature of electrolyzer (°C) |
References
- Gutsch, M.; Leker, J. Global warming potential of lithium-ion battery energy storage systems: A review. J. Energy Storage 2022, 52, 105030. [Google Scholar] [CrossRef]
- Sani, S.B.; Celvakumaran, P.; Ramachandaramurthy, V.K.; Walker, S.; Alrazi, B.; Ying, Y.J.; Dahlan, N.Y.; Rahman, M.H.A. Energy storage system policies: Way forward and opportunities for emerging economies. J. Energy Storage 2020, 32, 101902. [Google Scholar] [CrossRef]
- Behzadi, A.; Holmberg, S.; Duwig, C.; Haghighat, F.; Ooka, R.; Sadrizadeh, S. Smart design and control of thermal energy storage in low-temperature heating and high temperature cooling systems: A comprehensive review. Renew. Sust. Energy Rev. 2022, 166, 112625. [Google Scholar] [CrossRef]
- Jafari, S.; Ameri, M. Integrating photovoltaic/linear fresnel reflector with supercritical carbon dioxide energy storage system: Energy and exergy analysis. J. Energy Storage 2022, 53, 105235. [Google Scholar] [CrossRef]
- Sharafi, M.; Elmekkawy, T.Y.; Bibeau, E.L. Optimal design of hybrid renewable energy systems in buildings with low to high renewable energy ratio. Renew. Energy 2015, 83, 1026–1042. [Google Scholar] [CrossRef]
- Hajmohammadi, M.R.; Aghajannezhad, P.; Abolhassani, S.S.; Parsaee, M. An integrated system of zinc oxide solar panels, fuel cells, and hydrogen storage for heating and cooling applications. Int. J. Hydrogen Energy 2017, 42, 19683–19694. [Google Scholar] [CrossRef]
- Møller, K.T.; Jensen, T.R.; Akiba, E.; Li, H.-W. Hydrogen—A sustainable energy carrier. Prog. Nat. Sci. Mater. Int. 2017, 27, 34–40. [Google Scholar] [CrossRef]
- Eljack, F.; Kazi, M.-K. Prospects and Challenges of Green Hydrogen Economy via Multi-Sector Global Symbiosis in Qatar. Front. Sustain. 2021, 1, 612762. [Google Scholar] [CrossRef]
- Bhattacharyya, R.; Mohan, S. Solid state storage of hydrogen and its isotopes: An engineering overview. Renew. Sustain. Energy Rev. 2015, 41, 872–883. [Google Scholar] [CrossRef]
- Capurso, T.; Stefanizzi, M.; Torresi, M.; Camporeale, S.M. Perspective of the role of hydrogen in the 21st century energy transition. Energy Convers. Manag. 2022, 251, 114898. [Google Scholar] [CrossRef]
- Schmidt, O.; Melchior, S.; Hawkes, A.; Staffell, I. Projecting the Future Levelized Cost of Electricity Storage Technologies. Joule 2019, 3, 81–100. [Google Scholar] [CrossRef]
- Wu, Q.; Li, C. Economy-environment-energy benefit analysis for green hydrogen based integrated energy system operation under carbon trading with a robust optimization model. J. Energy Storage 2022, 55, 105560. [Google Scholar] [CrossRef]
- Marocco, P.; Ferrero, D.; Lanzini, A.; Santarelli, M. The role of hydrogen in the optimal design of off-grid hybrid renewable energy systems. J. Energy Storage 2022, 46, 103893. [Google Scholar] [CrossRef]
- Behzadi, A.; Gholamian, E.; Alirahmi, S.M.; Nourozi, B.; Sadrizadeh, S. A comparative evaluation of alternative optimization strategies for a novel heliostat-driven hydrogen production/injection system coupled with a vanadium chlorine cycle. Energy Convers. Manag. 2022, 267, 115878. [Google Scholar] [CrossRef]
- Bridgwater, T. Biomass for energy. J. Sci. Food Agric. 2006, 86, 1755–1768. [Google Scholar] [CrossRef]
- Spath, P.L.; Dayton, D.C. Preliminary Screening—Technical and Economic Assessment of Synthesis Gas to Fuels and Chemicals with Emphasis on the Potential for Biomass-Derived Syngas; NREL/TP-510-34929; National Renewable Energy Lab. (NREL): Golden, CO USA, 2003. [Google Scholar]
- Layzell, D.B.; Young, C.; Lof, J.; Leary, J.; Sit, S. Towards net-zero energy systems in canada: A key role for hydrogen. Transit. Accel. Rep. 2020, 2. [Google Scholar]
- Available online: http://www.marketsandmarkets.com/industry-practice/hydrogen/hydrogen-production-cost-analysis?gclid=EAIaIQobChMInrK60ZKZgQMVrjsGAB29NQmoEAAYASAAEgLFIfD_BwE (accessed on 20 May 2024).
- Purnami, P.; Hamidi, N.; Sasongko, M.N.; Siswanto, E.; Widhiyanuriyawan, D.; Tama, I.P.; Nugroho, W.S.; Wardana, I.N.G. Enhancement of hydrogen production using dynamic magnetic field through water electrolysis. Int. J. Energy Res. 2022, 46, 7309–7319. [Google Scholar] [CrossRef]
- Environment and Climate Change Canada. Air Health Trends. 2018. Available online: https://www.canada.ca/en/environment-climate-change/services/environmental-indicators/air-health-trends.html (accessed on 25 May 2024).
- Altun, Ş.; Şükrü, M.; İlçin, K. Monohydric aliphatic alcohols as liquid fuels for using in internal combustion engines: A review. Proc. Inst. Mech. Eng. Part E J. Process Mech. Eng. 2023. [Google Scholar] [CrossRef]
- Altun, Ş.; Öner, C.; Yaşar, F.; Adin, H. Effect of n-Butanol Blending with a Blend of Diesel and Biodiesel on Performance and Exhaust Emissions of a Diesel Engine. Ind. Eng. Chem. Res. 2011, 50, 9425–9430. [Google Scholar] [CrossRef]
- Lin, M.-Y.; Hourng, L.-W.H. Effects of magnetic field and pulse potential on hydrogen production via water electrolysis. Int. J. Energy Res. 2013, 38, 106–116. [Google Scholar] [CrossRef]
- Sapountzi, F.M.; Gracia, J.M.; Weststrate, C.J.; Fredresksson, H.O.A.; Niemantsverdiet, J.W. Electrocatalysts for the generation of hydrogen, oxygen and synthesis gas. Prog. Energy Combust. Sci. 2017, 58, 1–35. [Google Scholar] [CrossRef]
- Behzadi, A.; Arabkoohsar, A.; Sadi, M.; Chakravarty, K.H. A novel hybrid solarbiomass design for green off-grid cold production, techno-economic analysis and optimization. Sol. Energy 2021, 218, 639–651. [Google Scholar] [CrossRef]
- Yi, T.; Ye, H.; Li, Q.; Zhang, C.; Ren, W.; Tao, Z. Energy storage capacity optimization of wind-energy storage hybrid power plant based on dynamic control strategy. J. Energy Storage 2022, 55, 105372. [Google Scholar] [CrossRef]
- Ishaq, H.; Dincer, I.; Naterer, G.F. Development and assessment of a solar, wind and hydrogen hybrid trigeneration system. Int. J. Hydrogen Energy 2018, 43, 23148–23160. [Google Scholar] [CrossRef]
- Nematollahi, O.; Alamdari, P.; Jahangiri, M.; Sedaghat, A.; Alemrajabi, A.A. A techno-economical assessment of solar/wind resources and hydrogen production: A case study with GIS maps. Energy 2019, 175, 914–930. [Google Scholar] [CrossRef]
- Hasan, M.M.; Genç, G. Techno-economic analysis of solar/wind power-based hydrogen production. Fuel 2022, 324, 124564. [Google Scholar] [CrossRef]
- Al-Buraiki, A.S.; Al-Sharafi, A. Hydrogen production via using excess electric energy of an off-grid hybrid solar/wind system based on a novel performance indicator. Energy Convers. Manag. 2022, 254, 115270. [Google Scholar] [CrossRef]
- Parra, D.; Gillott, M.; Walker, G.S. Design, testing and evaluation of a community hydrogen storage system for end user applications. Int. J. Hydrogen Energy 2016, 41, 5215–5229. [Google Scholar] [CrossRef]
- Izadi, A.; Shahafve, M.; Ahmadi, P. Neural network genetic algorithm optimization of a transient hybrid renewable energy system with solar/wind and hydrogen storage system for zero energy buildings at various climate conditions. Energy Convers. Manag. 2022, 260, 115593. [Google Scholar] [CrossRef]
- Wei, D.; Zhang, L.; Alotaibi, A.A.; Fang, J.; Alshahri, A.H.; Almitani, K.H. Transient simulation and comparative assessment of a hydrogen production and storage system with solar and wind energy using TRNSYS. Int. J. Hydrogen Energy 2022, 47, 26646–26653. [Google Scholar] [CrossRef]
- Mansir, I.B.; Hani, E.H.B.; Farouk, N.; AlArjani, A.; Ayed, H.; Nguyen, D.D. Comparative transient simulation of a renewable energy system with hydrogen and battery energy storage for residential applications. Int. J. Hydrogen Energy 2022, 47, 26198–26208. [Google Scholar] [CrossRef]
- Behzadi, A.; Alirahmi, S.M.; Yu, H.; Sadrizadeh, S. An efficient renewable hybridization based on hydrogen storage for peak demand reduction: A rule-based energy control and optimization using machine learning techniques. J. Energy Storage 2023, 57, 106168. [Google Scholar] [CrossRef]
- Li, D.; Guo, J.; Zhang, J.; Zhan, L.; Alizadeh, M. Numerical assessment of a hybrid energy generation process and energy storage system based on alkaline fuel cell, solar energy and Stirling engine. J. Energy Storage 2021, 39, 102631. [Google Scholar] [CrossRef]
- Wang, J.; Pan, Z.; Ge, H.; Zhao, H.; Xia, T.; Wang, B. Economic Dispatch of Integrated Electricity–Heat–Hydrogen System Considering Hydrogen Production by Water Electrolysis. Electronics 2023, 12, 4166. [Google Scholar] [CrossRef]
- Shen, Y.; Li, X.; Wang, N.; Li, L.; Hoseyni, A. Introducing and investigation of a pumped hydro-compressed air storage based on wind turbine and alkaline fuel cell and electrolyzer. Sustain. Energy Technol. Assess. 2021, 47, 101378. [Google Scholar] [CrossRef]
- Trnsys Manual. Trnsys Version 16. Available online: https://sel.me.wisc.edu/trnsys/features/trnsys16-new-features-2003-12.pdf (accessed on 24 October 2023).
- Available online: https://climate.weather.gc.ca/climate_data/hourly_data_e.html?hlyRange=2010-06-03%7C2023-09-23&dlyRange=2010-06-03%7C2023-09 (accessed on 24 October 2023).
- Chi, J.; Yu, H. Water electrolysis based on renewable energy for hydrogen production. Chin. J. Catal. 2018, 39, 390–394. [Google Scholar] [CrossRef]


| Production Process | Feedstock and Energy Source | Pros and Cons | Examples | CO2 Emissions/H2 Generation |
|---|---|---|---|---|
| GREY Produced by steam methane reformation without carbon capture and sequestration (CCS) | Feedstock: natural gas, gasified coal | Pros: lowest cost, abundant Cons: highest carbon intensity | Canada produces approximately 3 million tons of grey hydrogen per year, primarily for industrial use | 9 kg CO2e/kg H2 |
| BLUE Produced from fossil fuels by steam methane reformation, pyrolysis, or other processes with carbon capture and sequestration (CCS). | Feedstock: natural gas, coal, crude bitumen | Pros: low-cost, abundant, low CI, pyrolysis offers scale and siting flexibility Cons: SMR pathway siting is constrained by CCUS, and the feedstock is not renewable | Alberta’s Quest project | 2 to 3 kg CO2e/kg H2. |
| GREEN Produced from water by electrolysis using renewable electricity such as hydroelectricity, wind, or solar. | Feedstock: water Energy source: renewable electricity | Pros: lowest carbon intensity, scalable Cons: highest cost, opportunity cost-competitive with electrification demand | Air Liquide’s 20 MW electrolyzer plant in Becancour, projects developing in BC to support hydrogen fuelling network | 0.8 (wind) to 3.4 (solar) kg CO2e/kg H2 |
| NUCLEAR Produced from water by electrolysis or high temperatures from nuclear energy | Feedstock: water Energy source: uranium/nuclear electricity | Pros: low carbon intensity Cons: limited availability and siting constraints | Feasibility study planned in Bruce County |
| Process | Advantages | Disadvantages | Efficiency |
|---|---|---|---|
| Steam reforming | Hydrogen yield is generally higher than 50% at T > 600 °C. Relative stability during transition operation. | Potential high level of carbonaceous material formation. COX Production Unsteady yield. An External Heat transfer device is required, therefore resulting in system complexity and potentially higher cost. | 75–86 |
| Coal gasification | Coal gasification is a cleaner, less polluting method of coal processing. It releases less carbon when burned, and other polluting gases, such as CO2, can be easily separated. The syngas derived from coal gasification can also be further treated to create fuels like gasoline and diesel. | H2 production with value-added product (coke and oil) production. Coal gasification is a process that consumes more energy and water than traditional methods. | 61–74 |
| Waste gasification | Waste reduction, low-cost substrate, low pollutant generation, commercialized stage. | Impurities, unstable rate of H2 production, geographical suitability | 35–45 |
| Electrolysis | Commercialized and greener technology. O2 is a by-product costly process. | Stationary technology, high cost | 72–80 |
| Low-Temperature Electrolysis | High-Temperature Electrolysis | |||||
| Alkaline (OH−) Electrolysis | Proton-Exchange (H+) Electrolysis | Oxygen Ion (O2−) Electrolysis | ||||
| Charge carrier | OH− | OH− | H+ | H+ | O2− | O2− |
| Temperature | 20–80 °C | 20–200 °C | 20–200 °C | 500–1000 °C | 500–1000 °C | 750–900 °C |
| Electrolyte | Liquid | Solid (polymer) | Solid (polymer) | Solid (ceramic) | Solid (ceramic) | Solid (ceramic) |
| Anodic reaction | 4OH− → 2H2 + O2 + 4e | 4OH− → 4H2 + O2 + 4e | 2H2O → 2H2 + O2 + 4e | 2H2O → 2H2 + O2 + 4e | O2− → ½ O2 + 2e | O2− → ½ O2 + 2e |
| Anodes | Ni > Co > Fe | Ni-based | Ir O2, Ru O2 | Perovskites with protonic–electronic conductivity | La Sr1-xMnO3+Y-stabilized ZrO2 | La Sr1-xMnO3+Y-stabilized ZrO2 |
| Cathodic Reaction | 2H2O + 4e → 4OH + 2H2 | 2H2O + 4e → 4OH + 2H2 | 4H+ + 4e → 2H2 | 4H+ + 4e → 2H2 | H2O + 2e → 2H2+ O2 | H2O + 2e → H2+ O2 CO2 + 2e → CO+ O2 |
| Cathodes | Ni alloys | Ni, Ni-Fe, NiFe2O4 | Pt/C, MoS2 | Ni-ceramets | Ni-YSZ | Ni-YSZ |
| Efficiency | 59–70% | 68–82% | Up to 100% | Up to 100% | ||
| Applicability | Commercial | Laboratory scale | Near-term commercialization | Laboratory scale | Demonstration | Laboratory scale |
| Advantages | Low capital cost, relatively stable, mature technology | Combination of alkaline and H+ PEM electrolysis | Compact design, fast response/startup, high-purity H2 | Enhanced kinetics and thermodynamics: lower energy demand, low capital cost | Direct production of syngas | |
| Disadvantages | Corrosive electrolyte, gas permission, slow dynamics | Low OH− conductivity in polymeric membranes | High-cost polymeric membrane, acids: noble metals | Mechanically unstable electrodes (cracking), safety issues: improper sealing | ||
| Challenges | Improved durability/reliability and oxygen evolution | Improved electrolyte | Reduction noble-metal utilization | Microstructural changes in the electrodes: delamination, blocking of TPBs, passivation | C deposition, microstructural changes in electrolytes | |
| No. | Specification | Value | Description |
| 1 | Rotor_Ht | 2 | Rotor centre height, metres |
| 2 | Rotor_Di | 1 | Rotor diameter, metres |
| 3 | Sensr_Ht | 6 | Sensor height for data pairs given below, metres (often rotor centre height) |
| 4 | Sher_Exp | 0.16 | Power-law exponent for vertical wind profile |
| 5 | Turb_Int | 0.1 | Turbulence intensity valid for this curve |
| 6 | Air_Dens | 1.225 | Power curve air density, kg/m3 |
| 7 | Pwr_Ratd | 318 | Rated power of turbine, W |
| 8 | Spd_Ratd | 9 | Rated wind speed, m/s |
| 9 | Nominal turbine efficiency | 0.35 |
| No. | Specification | Value | Description |
| 1 | Unit Area | 0.066 | Total area of unit (m2) |
| 2 | N cells | 2 | |
| 3 | IELY | 4 | Current through single electrolyzer stack (A) |
| 4 | PELY | 1 | Electrolyzer pressure (atm) |
| 5 | TROOM | 20 | Room temperature (°C) |
| 6 | TELY | 50 | Temperature of electrolyzer (°C) |
| Rated Maximum Power (Pmax) [W] | 525 | 530 | 535 | 540 | 545 |
| Open-Circuit Voltage (Voc) [V] | 49.15 | 49.3 | 49.45 | 49.6 | 49.75 |
| Maximum Power Voltage (Vmp) [V] | 41.15 | 41.31 | 41.47 | 41.64 | 41.8 |
| Short-Circuit Current (Isc) [A] | 13.65 | 13.72 | 13.79 | 13.86 | 13.93 |
| Maximum Power Current (Imp) [A] | 12.76 | 12.83 | 12.9 | 12.97 | 13.04 |
| Module Efficiency [%] | 20.3 | 20.5 | 20.7 | 20.9 | 21.1 |
| Power Tolerance | 0~+5 W | ||||
| Temperature Coefficient of Isc (α_Isc) | 0.046%/°C | ||||
| Temperature Coefficient of Voc (β_Voc) | −0.277%/°C | ||||
| Temperature Coefficient of Pmax (γ_Pmp) | −0.351%/°C | ||||
| STC | Irradiance 1000 W/m2, cell temperature 25 °C, AM1.5G | ||||
| Cell Maximum Efficiency | Mono 21.3% | ||||
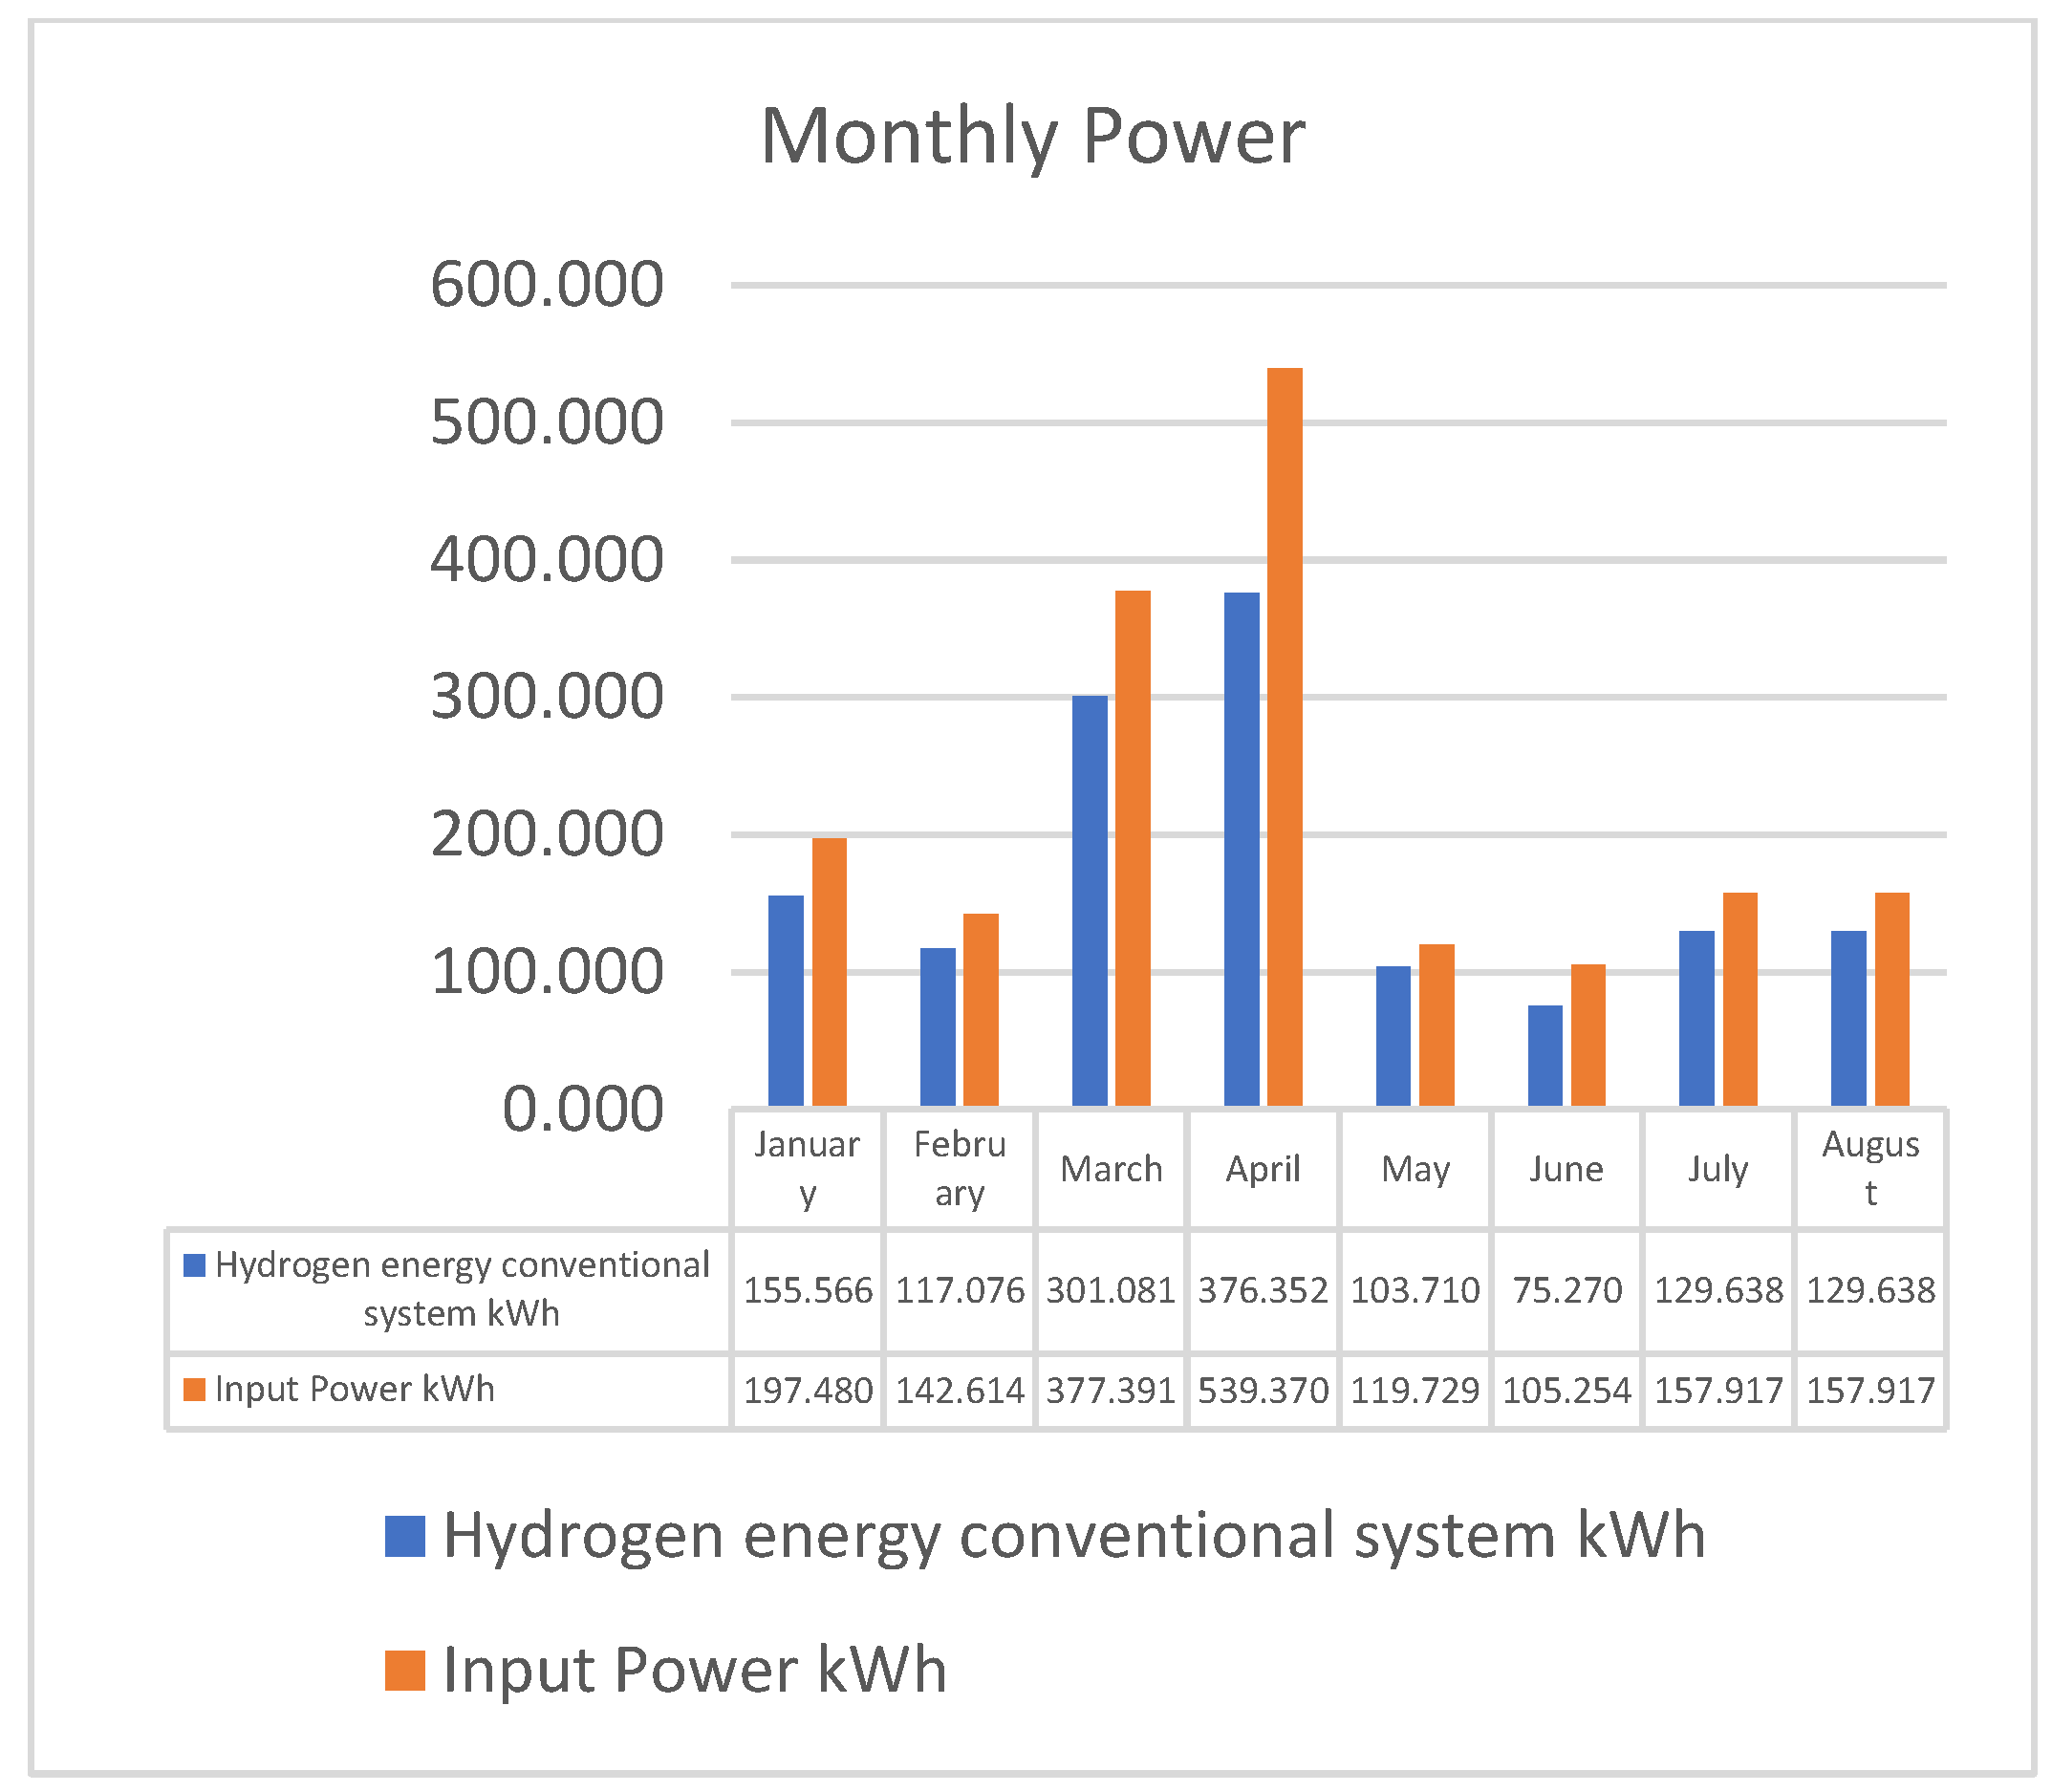
| Month | Input Power kWh | Hydrogen Energy kWh | Electrolysis Efficiency | CF | kg H2 | USD/kg H2 |
|---|---|---|---|---|---|---|
| January | 197.480 | 155.566 | 79% | 7% | 3.733575 | 0.75 |
| February | 142.614 | 117.076 | 82% | 5% | 2.8098125 | 1.75 |
| March | 377.391 | 301.081 | 80% | 14% | 7.22595 | 1 |
| April | 539.370 | 376.352 | 70% | 19% | 9.0324375 | 0.55 |
| May | 119.729 | 103.710 | 87% | 4% | 2.48905 | 2.5 |
| June | 105.254 | 75.270 | 72% | 4% | 1.8064875 | 2.5 |
| July | 157.917 | 129.638 | 82% | 6% | 3.1113125 | 1.5 |
| August | 157.917 | 129.638 | 82% | 6% | 3.1113125 | 1.5 |
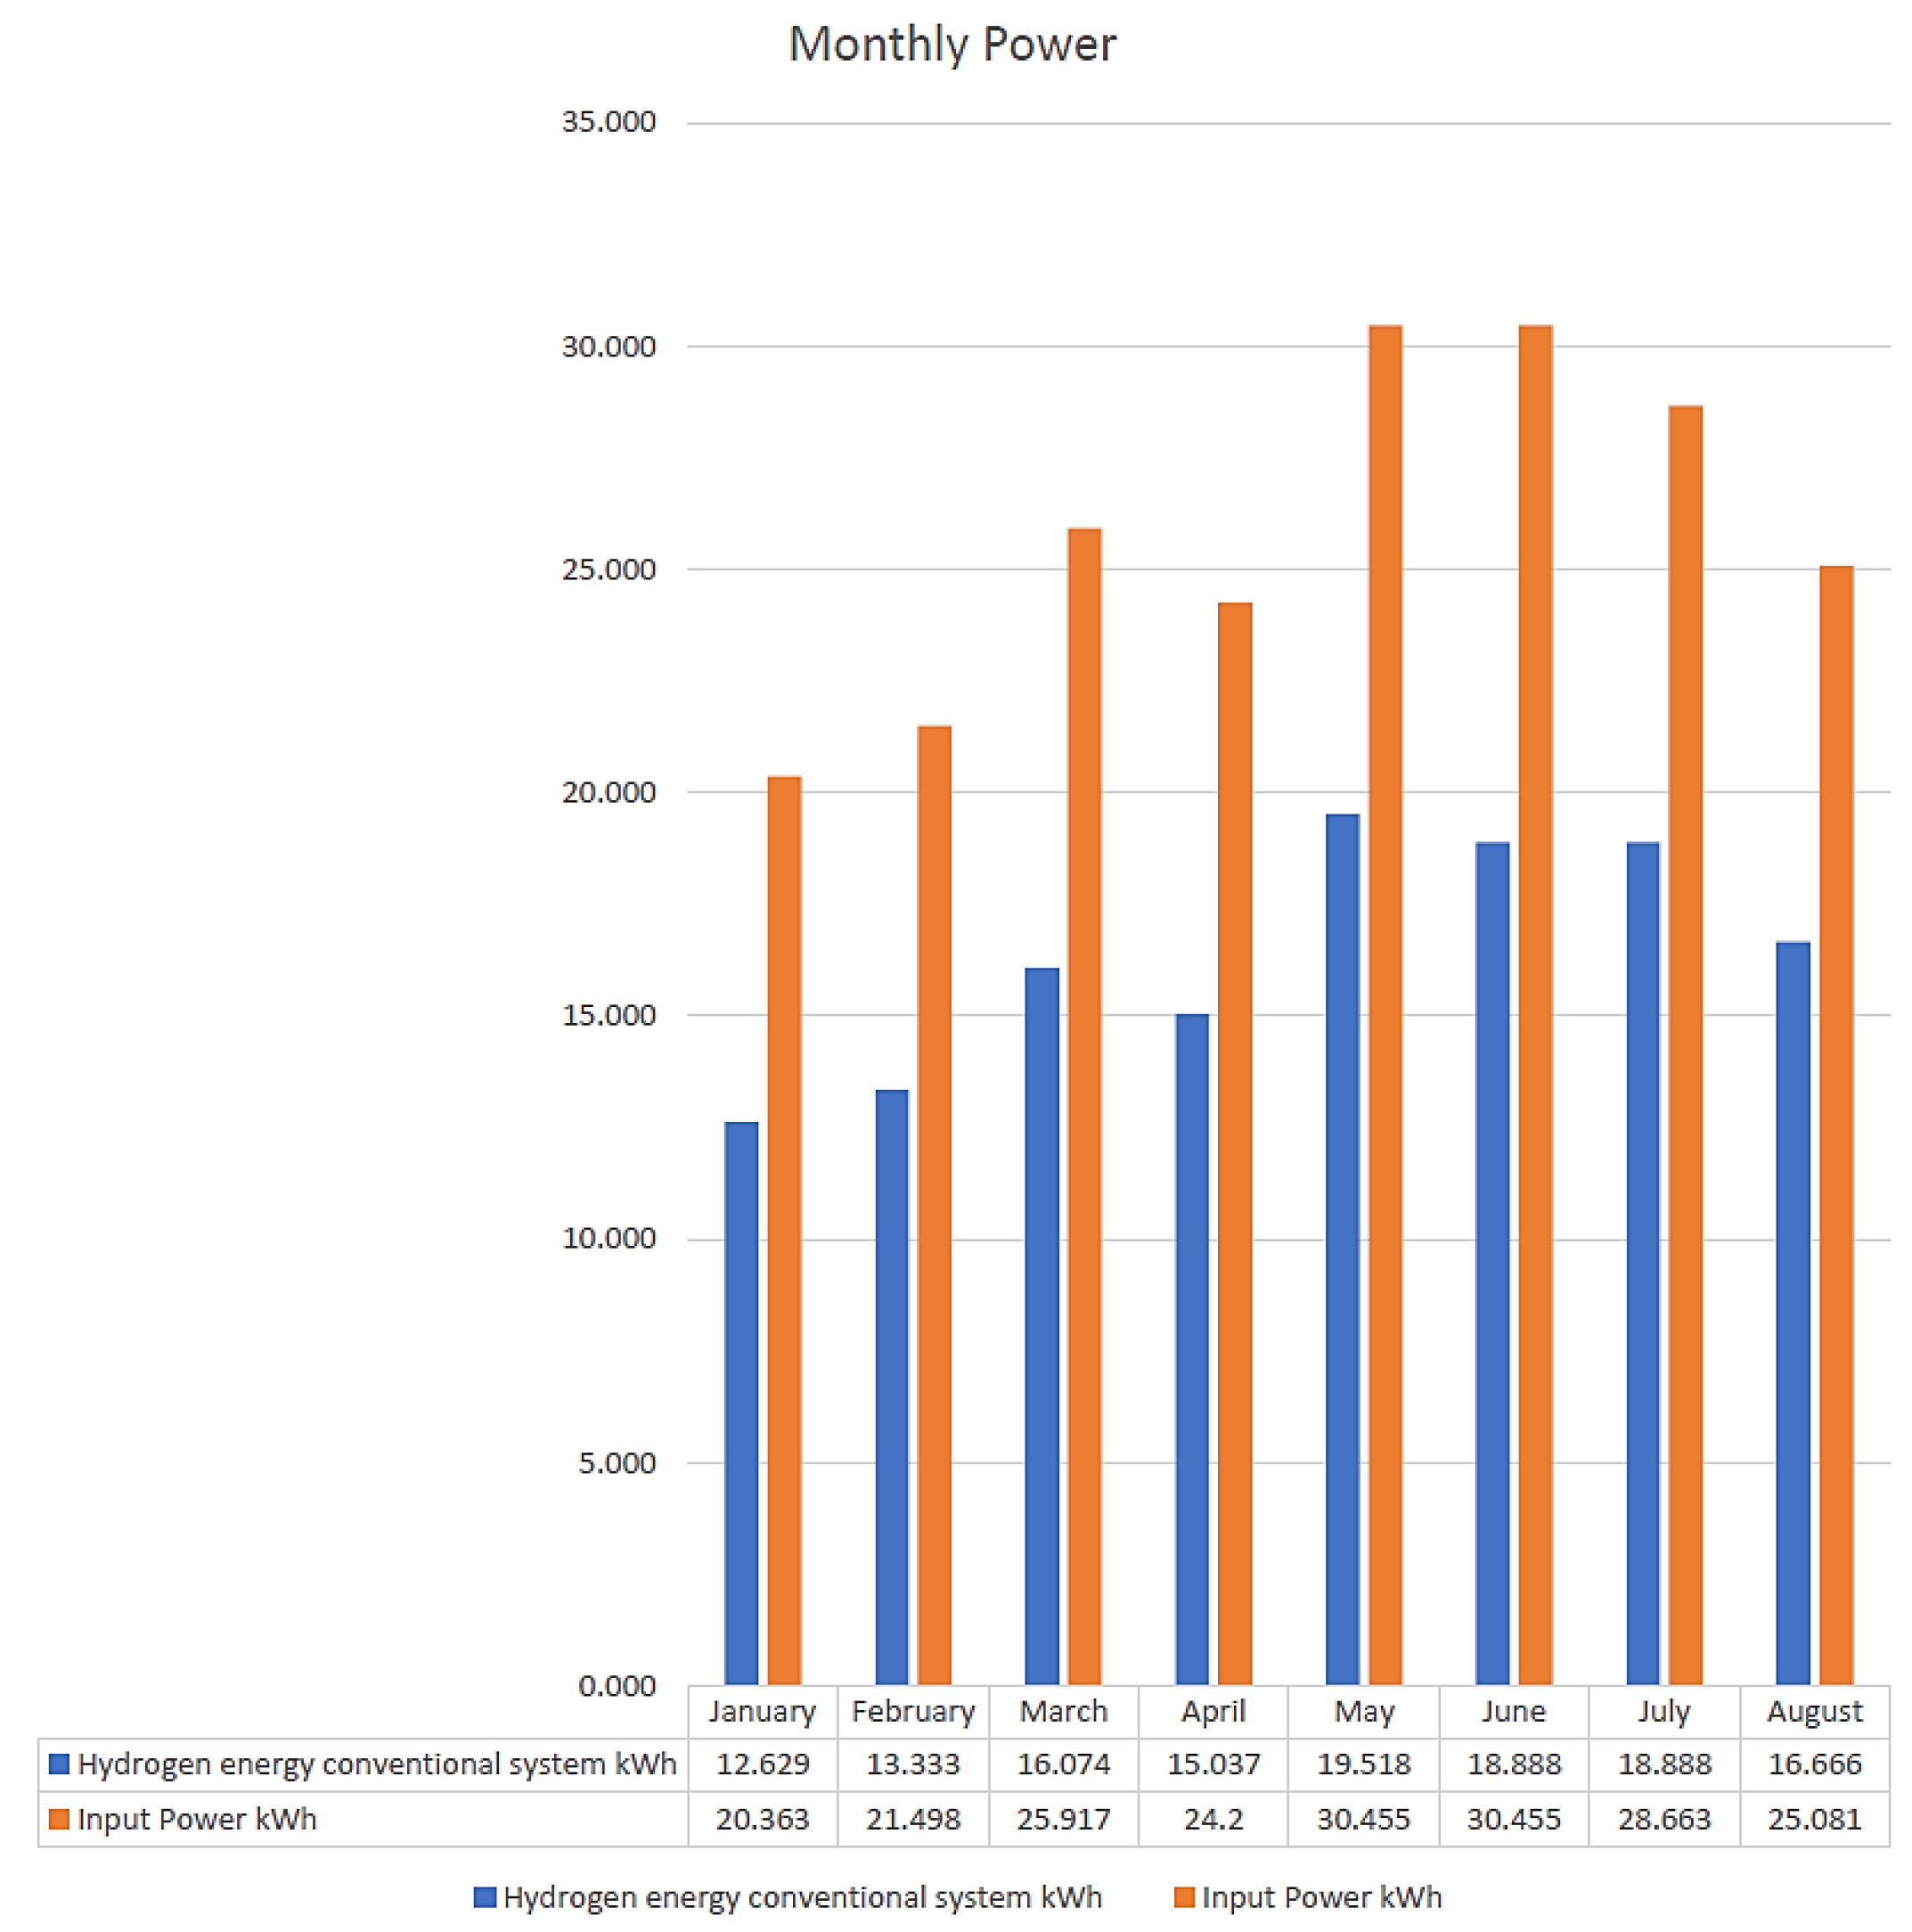
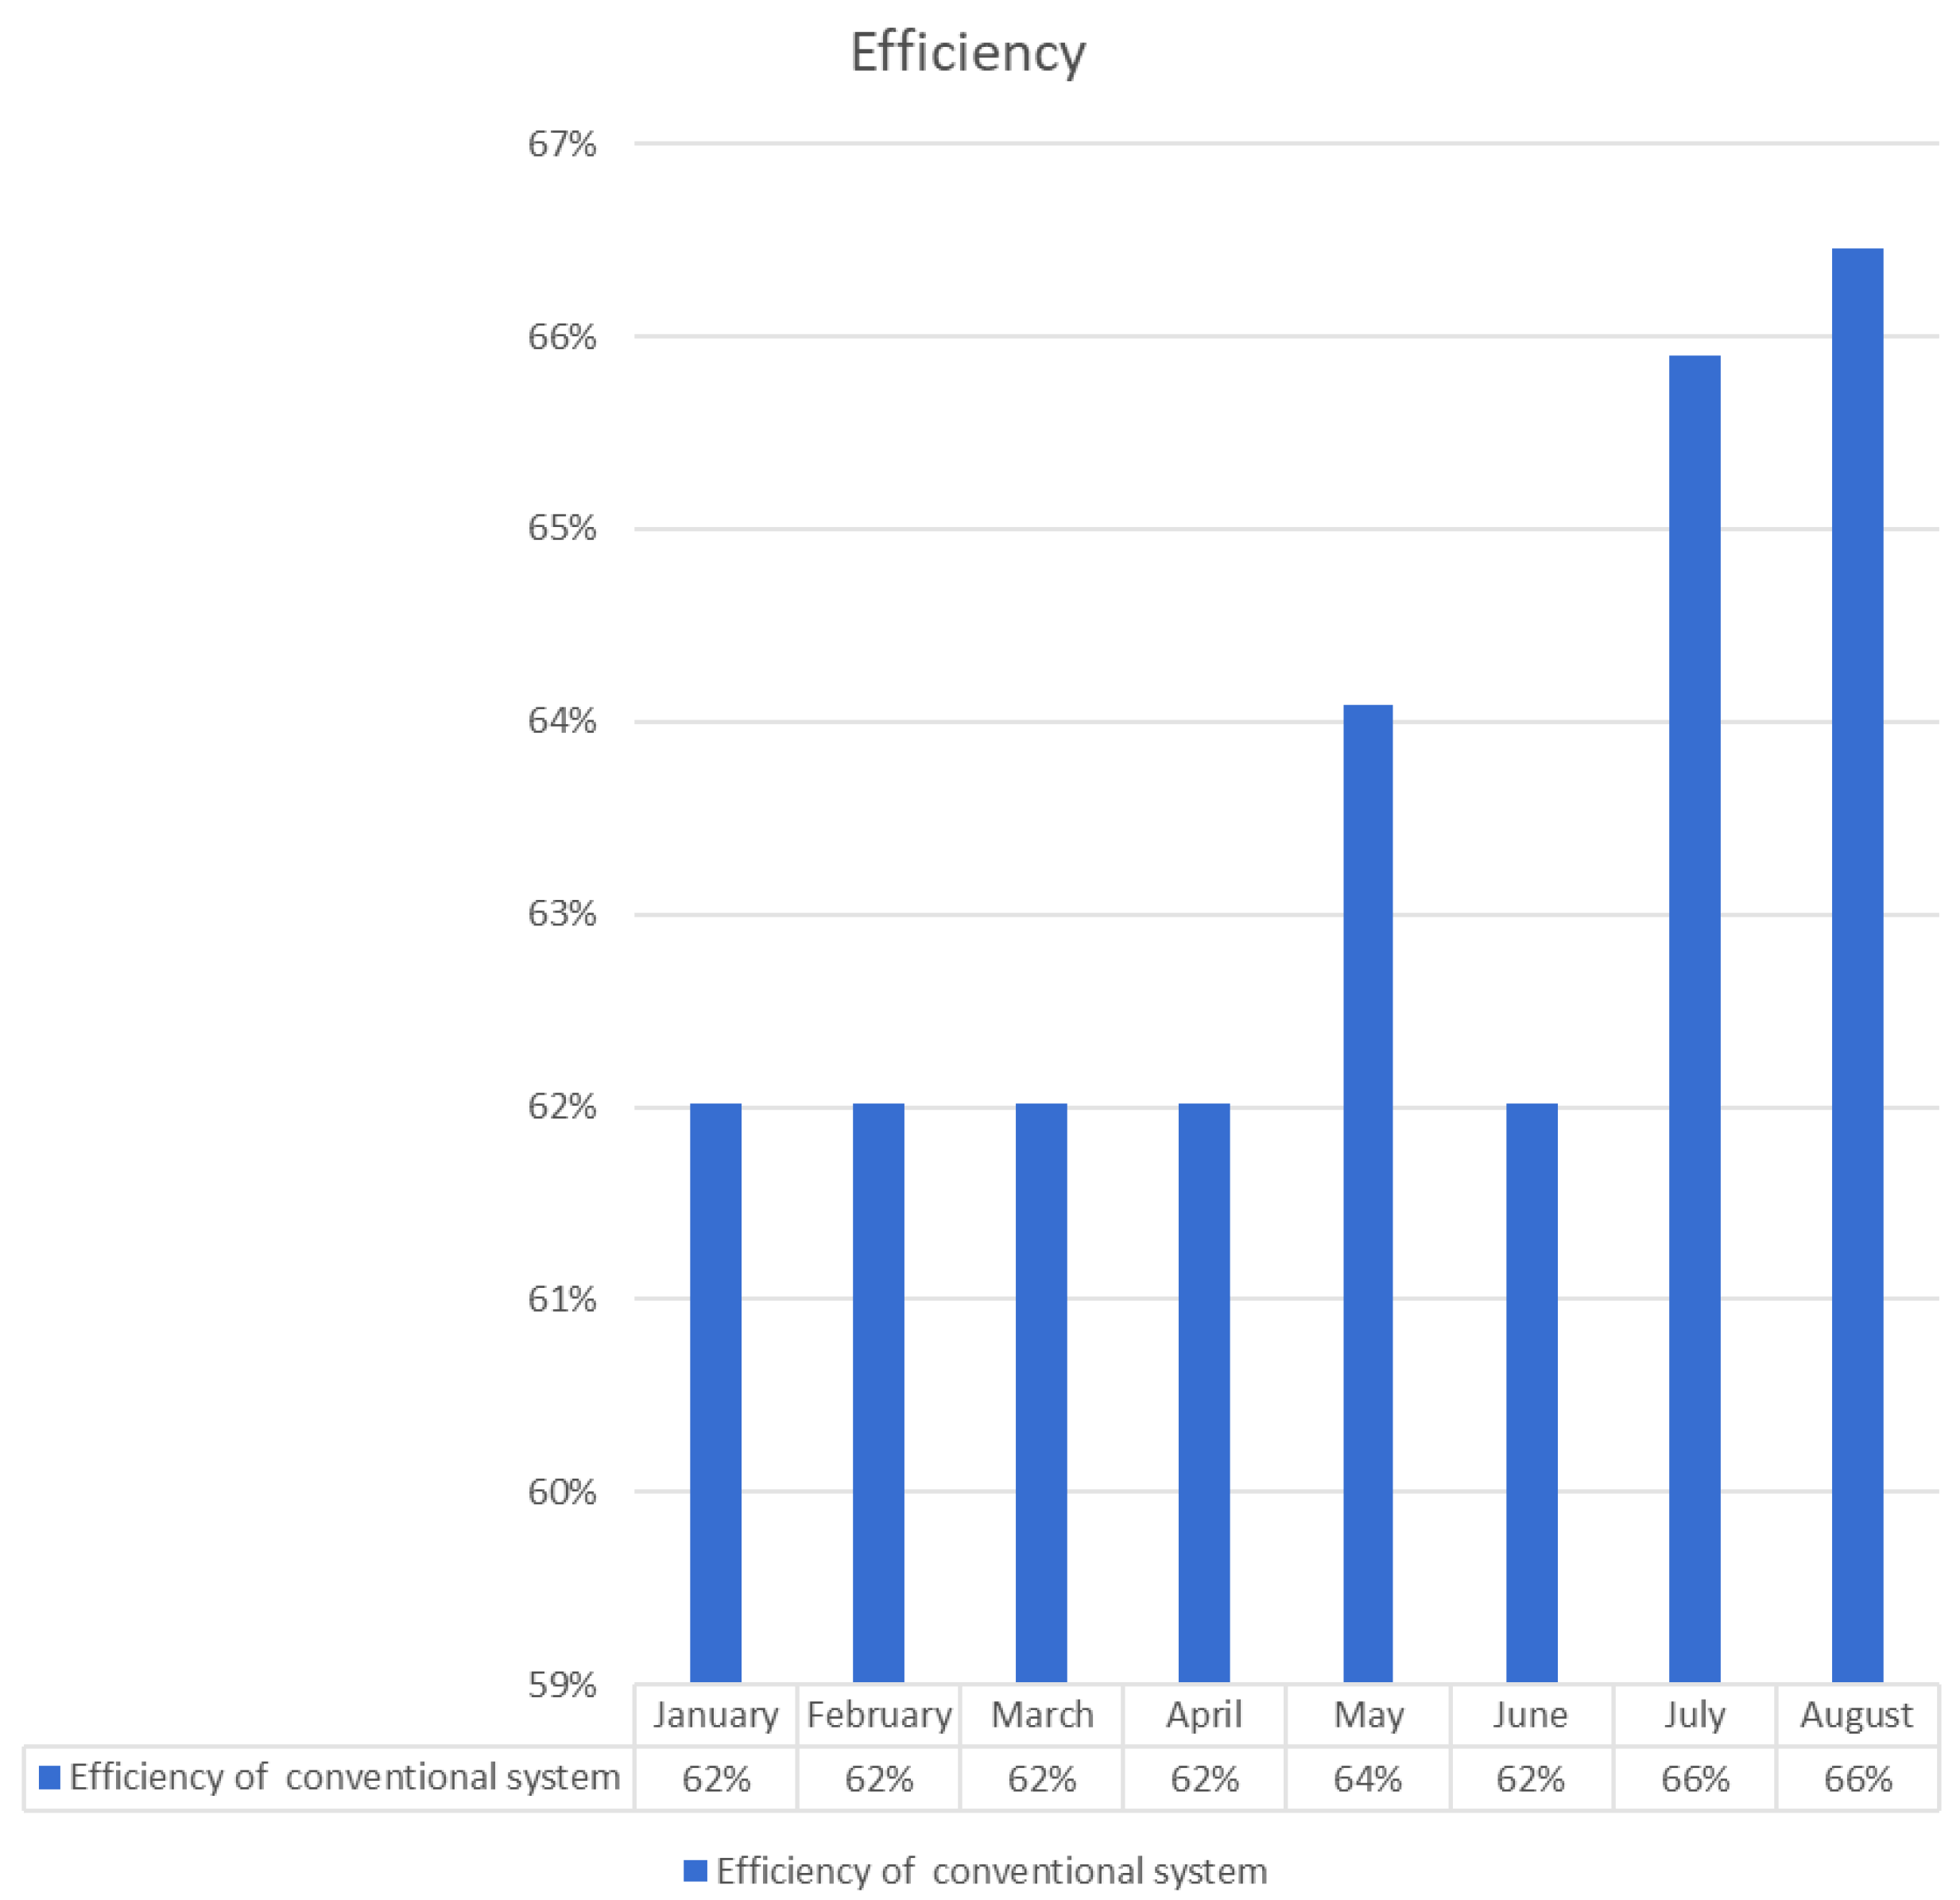
| Month | Input Power kWh | Hydrogen Energy Conventional System kWh | Electrolysis Efficiency of Conventional System | CF | kg H2 | USD/kg H2 |
|---|---|---|---|---|---|---|
| January | 20.363 | 12.629 | 62% | 2% | 0.38 | 3 |
| February | 21.498 | 13.333 | 62% | 4% | 0.40 | 2.5 |
| March | 25.917 | 16.074 | 62% | 4% | 0.48 | 2.5 |
| April | 24.2 | 15.037 | 62% | 5% | 0.45 | 1.75 |
| May | 30.455 | 19.518 | 64% | 6% | 0.58 | 1.5 |
| June | 30.455 | 18.888 | 62% | 6% | 0.56 | 1.5 |
| July | 28.663 | 18.888 | 66% | 4% | 0.56 | 2.5 |
| August | 25.081 | 16.666 | 66% | 5% | 0.50 | 1.75 |
Disclaimer/Publisher’s Note: The statements, opinions and data contained in all publications are solely those of the individual author(s) and contributor(s) and not of MDPI and/or the editor(s). MDPI and/or the editor(s) disclaim responsibility for any injury to people or property resulting from any ideas, methods, instructions or products referred to in the content. |
© 2024 by the authors. Licensee MDPI, Basel, Switzerland. This article is an open access article distributed under the terms and conditions of the Creative Commons Attribution (CC BY) license (https://creativecommons.org/licenses/by/4.0/).
Share and Cite
Ramadan, A.; Gabbar, H.A. Evaluation of Hydrogen Generation with Hybrid Renewable Energy Sources. Appl. Sci. 2024, 14, 6235. https://doi.org/10.3390/app14146235
Ramadan A, Gabbar HA. Evaluation of Hydrogen Generation with Hybrid Renewable Energy Sources. Applied Sciences. 2024; 14(14):6235. https://doi.org/10.3390/app14146235
Chicago/Turabian StyleRamadan, A., and Hossam A. Gabbar. 2024. "Evaluation of Hydrogen Generation with Hybrid Renewable Energy Sources" Applied Sciences 14, no. 14: 6235. https://doi.org/10.3390/app14146235
APA StyleRamadan, A., & Gabbar, H. A. (2024). Evaluation of Hydrogen Generation with Hybrid Renewable Energy Sources. Applied Sciences, 14(14), 6235. https://doi.org/10.3390/app14146235