Article

Experimental and Theoretical Investigation of Thermal Parameters Influencing the Freezing Process of Ice Cream

by
Ömer Alp Atici
*,†,‡ and
Derya Burcu Özkan
Department of Mechanical Engineering, Faculty of Mechanical Engineering, Yildiz Technical University, 34349 Istanbul, Turkey
*
Author to whom correspondence should be addressed.
Current address: Barbaros Boulevard, Block A, Floor 2, Beşiktaş, 34349 Istanbul, Turkey.
These authors contributed equally to this work.
Appl. Sci. 2024, 14(14), 6194; https://doi.org/10.3390/app14146194
Submission received: 4 June 2024 / Revised: 5 July 2024 / Accepted: 8 July 2024 / Published: 16 July 2024
(This article belongs to the Topic Advanced Heat and Mass Transfer Technologies)

Abstract

:
Freezing time stands out as the most critical parameter in ice cream production, significantly influencing the final product’s quality and production efficiency. Therefore, it is essential to accurately estimate the freezing time based on ice cream recipes. This research paper focuses on determining the thermal properties of ice cream samples by leveraging insights from previous studies. Moreover, a new specific heat correlation is proposed to account for the latent heat effect of water during the freezing process. The results demonstrated that the new specific heat correlation aligns well with established formulas from previous research as well as experimental results with maximum 2.5% deviation. To validate the accuracy of the proposed numerical model, experimental studies were compared with numerical results for the first time in the context of ice cream freezing inside a mold. Additionally, a parametric analysis was conducted using numerical modelling to discern the relative importance of various production process parameters. Notably, the glycol–water mixture temperature emerged as the most influential parameter affecting freezing time, while the amount of air inside the ice cream was identified as the least significant factor.

1. Introduction

The freezing process of ice cream plays a crucial role in determining the final product’s quality and production efficiency. While numerous studies exist in the literature correlating the thermal properties of various foods, only a few specifically focus on ice cream. Notably, much of the literature emphasizes the thermal properties of meat, such as the work by Lind [1], who investigated the thermal conductivity, specific heat, and ice content of dough and meat. Similarly, Sanz et al. [2] correlated specific heat, conductivity, and thermal diffusivity values for meat during cooling and freezing processes. Studies on juices, like those by Simion et al. [3] and Telis Romela et al. [4], have explored thermal conductivity and capacity based on dry matter content and temperature, highlighting the significant influence of water content on properties. Magerramov [5] examined the heat capacities of apple, cherry, and raspberry juices, while Magerramov et al. [6] extended this research to include peach and plum juices’ thermal conductivity. However, the literature on ice cream’s thermal properties is relatively limited. Cogne et al. [7] conducted a comprehensive study comparing literature derivations with experimental results, particularly focusing on ice cream’s heat capacity. Sudhir and Ashis [8] explored ice cream’s thermal conductivity, though challenges with the porosity of ice cream’s structure hindered their study. Heldman et al. [9] examined how the composition of ice cream mixes, varying between sucrose and corn syrup solids, impacts the refrigeration requirements during freezing. Higher sucrose content led to increased refrigeration needs, as measured by the combined contributions of the sensible heat of the unfrozen mix and the latent heat of ice formation. In this research, literature data are utilized to calculate the thermal conductivity, density, and initial freezing temperature of ice cream. A new correlation is developed for specific heat, considering the addition of the latent heat of water. Beyond thermal properties, modeling the freezing process is vital to understand production parameter effects on freezing time. Bongers [10] developed a mathematical model for ice cream freezers, while Boccardi et al. [11] determined heat transfer coefficients of scrape surface heat exchangers. Imran et al. [12] also developed a mathematical model to investigate flow rates, stream function, pressure, and forces on the blades of a scrape surface heat exchanger. Masauda et al. [13] investigated the agitation speed of the freezer during the ice cream freezing process and obtained ice cream’s rheological properties and air bubble size and distribution. In contrast, this study investigates ice cream freezing inside molds, a common production method. Chen et al. [14] numerically modeled ice cream freezing but did not compare their results with experiments. This study compares numerical and experimental results, exploring important production process parameters’ effects on ice cream freezing such as the freezing medium of ice cream, initial ice cream temperature before freezing, and aeration amount. Optimizing freezing time is critical for energy consumption, production speed, and final product quality. Overall, understanding ice cream’s freezing processes and optimizing freezing times are paramount in ice cream production.

2. Materials and Methods

2.1. Calculation of Thermal Properties

As discussed in the introduction part, there are several correlations for the heat capacity of foods, but only a few studies can be found specifically for ice cream freezing in the literature [14,15,16]. In the next subsections, each of the thermal property calculations will be discussed deeply and comparatively with the previous research data and the best model will be tested in order to be correlated with each property.

2.1.1. Initial Freezing Temperature

In order to model the freezing process, first of all, ice cream’s initial freezing temperature point must be determined. In Leighton’s [17] study, ice cream’s initial freezing temperature was calculated according to the recipe’s sugar and salt content.
A = ( M S N F x 0.545 + S ) 100 W
In Equation (1), M S N F represents the mass fraction of the amount of milk solid non-fat, and S represents the mass fraction of the amount of sucrose. W represents the mass fraction of the amount of water in the recipe. A is the amount of sugar dissolved in 100 g of water, and freezing point depression can be calculated according to research data. On the other hand, due to the existence of milk solid non-fats, there will be salt inside the recipe, and there will be a freezing point depression because of the salt. In Equation (2), B represents the freezing point depression value in Celsius.
B = M S N F x 2.37 W
Once the value of the freezing point depression coming from sucrose is found, A, it will be added together with B, and the total freezing point depression will be found.
Another freezing point calculation method was found by [18], and this correlation is valid for the liquid juice group, which can be the base of ice cream.
T f = 120.47 + 327.35 X w o 176.49 X w o 2
However, most ice cream mixtures contain more ingredients that affect the freezing point in addition to sugar and salt. In this study, the initial freezing temperature is calculated according to an alternative method that is described in detail by Goff and Hartel [19]. Every ingredient’s sucrose equivalent was correlated according to Equation (4).
S E = ( M S N F x 0.545 ) + ( W S x 0.765 ) + S + ( 10 D E C S S x 0.2 ) + ( 36 D E C S S x 0.6 ) + ( 0.42 C S S x 0.8 ) + ( 62 D E C S S x 1.2 ) + ( H F C S x 1.8 ) + ( F x 1.9 )
In Equation (4), S E represents the sucrose equivalence, W S represents the amount of whey solids, D E represents the dextrose equivalence, C S S indicates the amount of corn syrup as a percentage according to the total mass. H F C S represents the amount of high fructose corn syrup, F represents the amount of fructose as a percentage according to the total mass. According to sucrose equivalent value, freezing temperature can be found in Table 1. In this study, the initial freezing point is calculated according to Equation (4) and Table 1.

2.1.2. Thermal Conductivity

Another important thermal property is thermal conductivity. Heat transfer coefficient is found according to Cogne et al.’s study [7]. First of all, only the ingredient’s heat transfer coefficient effects are taken into account in Equation (5).
λ c p a r a = j ε j λ j
λ represents the conductivity, c represents the continuum phase for the ingredients, i.e., the liquid phase of the ice cream mixture. j represents the number of ingredients, and ε is described in Equation (6).
ε j = X j ρ c ρ j ρ c = 1 j X j ρ j
ρ represents the density of the mixture. To be able to find the heat transfer coefficient for ice cream, ice also needs to be considered in the heat transfer coefficient formulations. To do that, Equation (7) from [7] is used.
λ m i x = λ c p a r a 1 ε i c e + ε i c e F λ i c e λ c p a r a 1 ε i c e + ε i c e F F = 1 3 i = 1 3 [ 1 + ( λ i c e λ c p a r a 1 ) g i ] 1
The g values are g 1 = g 2 = 1/11, g 3 = 9/11, respectively. Finally, air must be included in the heat transfer coefficient formulation to finalize the heat transfer coefficient correlation.
λ I C ( T ) = λ m i x ( T ) 2 λ m i x ( T ) + λ a i r 2 ε a i r ( λ m i x ( T ) λ a i r ) 2 λ m i x ( T ) + λ a i r + ε a i r ( λ m i x ( T ) λ a i r )
λ represents the heat transfer coefficient and λ I C represents the ice cream thermal conductivity coefficient.

2.1.3. Specific Heat

Another important parameter is the heat capacity. Heat capacity correlations were created in previous studies and these correlations were used in this study and compared with experimental results. Specific heat must be calculated for two temperature ranges. First of all, specific heat must be calculated for temperatures above the freezing point, for which we have a very general expression. Each of the ingredients’ specific heat should be added according to their mass fractions inside the mixture, as shown in Equation (9).
C u = j X j C p j
There are several specific heat correlations in the literature for temperatures below the freezing point, and the most important ones will be discussed here. Firstly, a weight-additive model was used for the heat capacity correlation and this correlation was proposed in Cogne et al.’s study [7].
C p = j X j C p j L f ( T f ) d X i c e ( T ) d T
In Equation (10), j represents the ingredients of the ice cream recipe. X j represents each ingredient’s mass ratio. C p j represents each ingredient’s heat capacity, X i c e represents the ice formation ratio in total mass. T f represents the initial freezing temperature. d X i c e ( T ) / d T is represented in [20] and the equation is shown in (11).
X i c e T = ( X w X b ) ( 1 T f T )
X b is the mass fraction of the bound water and can be calculated according to the mass fraction of protein, X p .
X b = 0.4 X p
The latent heat of water is also taken into account at the weight-additive heat capacity correlation, represented as L f in Equation (10). T represents the ice cream temperature and, in this formulation, it is in Celsius units.
L f = ( 333.802 + 2.1165 T ) x 1000
The other two main heat capacity correlations were studied in Schwartzberg’s [15] and Chen’s [16] research papers. Schwartzberg’s equation is shown as Equation (14) and Chen’s equation is shown as Equation (15).
C I C = C u + ( X b X w o ) Δ C + E X s R T 0 2 M w T 2 0.8 Δ C
C I C = 1.55 + 1.26 X s ( X w o X b ) L f T f T 2
These equations’ validity is discussed in the literature, and according to Chang and Toi [21], Schwartzberg’s [15] specific heat correlation performed best; however, there were large variations near the freezing points. In this study, it is suggested to include the latent heat of the water parameter in the specific heat equation. In Chen’s study [16], the latent heat of water is taken into account, but the correlation is empirical, so a new specific heat correlation is proposed. The specific heat formulation is derived from an enthalpy formulation and can be written as Equation (16).
H T = C I C = C s X s + C w X w + C i c e X i c e + H w X w T + H i c e X i c e T
If the below changes are made and written in Equation (16), the new equation will be shown as Equation (20).
X i c e = X w
Δ H T = H w H i c e
X i c e = X w o X w
C I C = C s X s + C w X w + C i c e X i c e + H w X w T Δ H T
The mass fraction of water according to temperature is an important term for this equation and can be written as Equation (21).
X w T = a w T X w a w
Water activity changes according to temperature and water amount changes according to water activity can be written as follows in Equations (22) and (23).
1 a w = L M w R T T 0 ( T 0 T )
X w b X s + E X s a w 1 a w
If Equations (22) and (23) take into account Equation (21) and all the terms written in Equation (20), proposed formula will shown as Equation (24).
C I C = C s X s + C i c e X w o X w ( C w C i c e ) + X s T 0 2 R L M s 1 ( T 0 T ) 2 L 0.5 ( C w C i c e ) ( T 0 T )
Δ H T should be written as ( L 0.5 ( C w C i c e ) ( T 0 T ) according to [15], and E represents the ratio of the relative molecular masses of water and solids, M w and M s , which equal to 18.01 kg/kmol and 342.3 kg/kmol, respectively. L is the latent heat of pure water, which is equal to 334 kJ/kg.
It is important to check the validity of the proposed specific heat correlation, considering other specific heat correlations. From ASHRAE, 2006 [22], the composition of a chocolate ice cream mixture is shown in Table 2.
Water, protein, fat, carbohydrates, and ashes have individual specific heat values that can be found at the Choi and Okos [23] study. According to the literature and proposed specific heat formulations, specific heat results are compared in Table 3. The specific heat value is determined at a selected temperature of −35 °C.
It is shown that the proposed formulation also has a very good agreement with the literature data. It is known that specific heat values change according to temperature, and proposed specific heat correlations and other literature-specific heat values are compared according to the given chocolate ice cream composition. Specific heat calculations and comparisons for each correlation can be found in Figure 1.

2.2. Numerical and Experimental Studies

In this study, the freezing of ice cream inside molds was investigated. First, the proposed specific heat correlation was validated by comparing experimental results with numerical simulation results. After validating the numerical studies, a parametric analysis of freezing conditions was conducted. The effects of the glycol–water mixture temperature, the initial ice cream temperature, and the air volume within the ice cream were compared in the numerical studies.
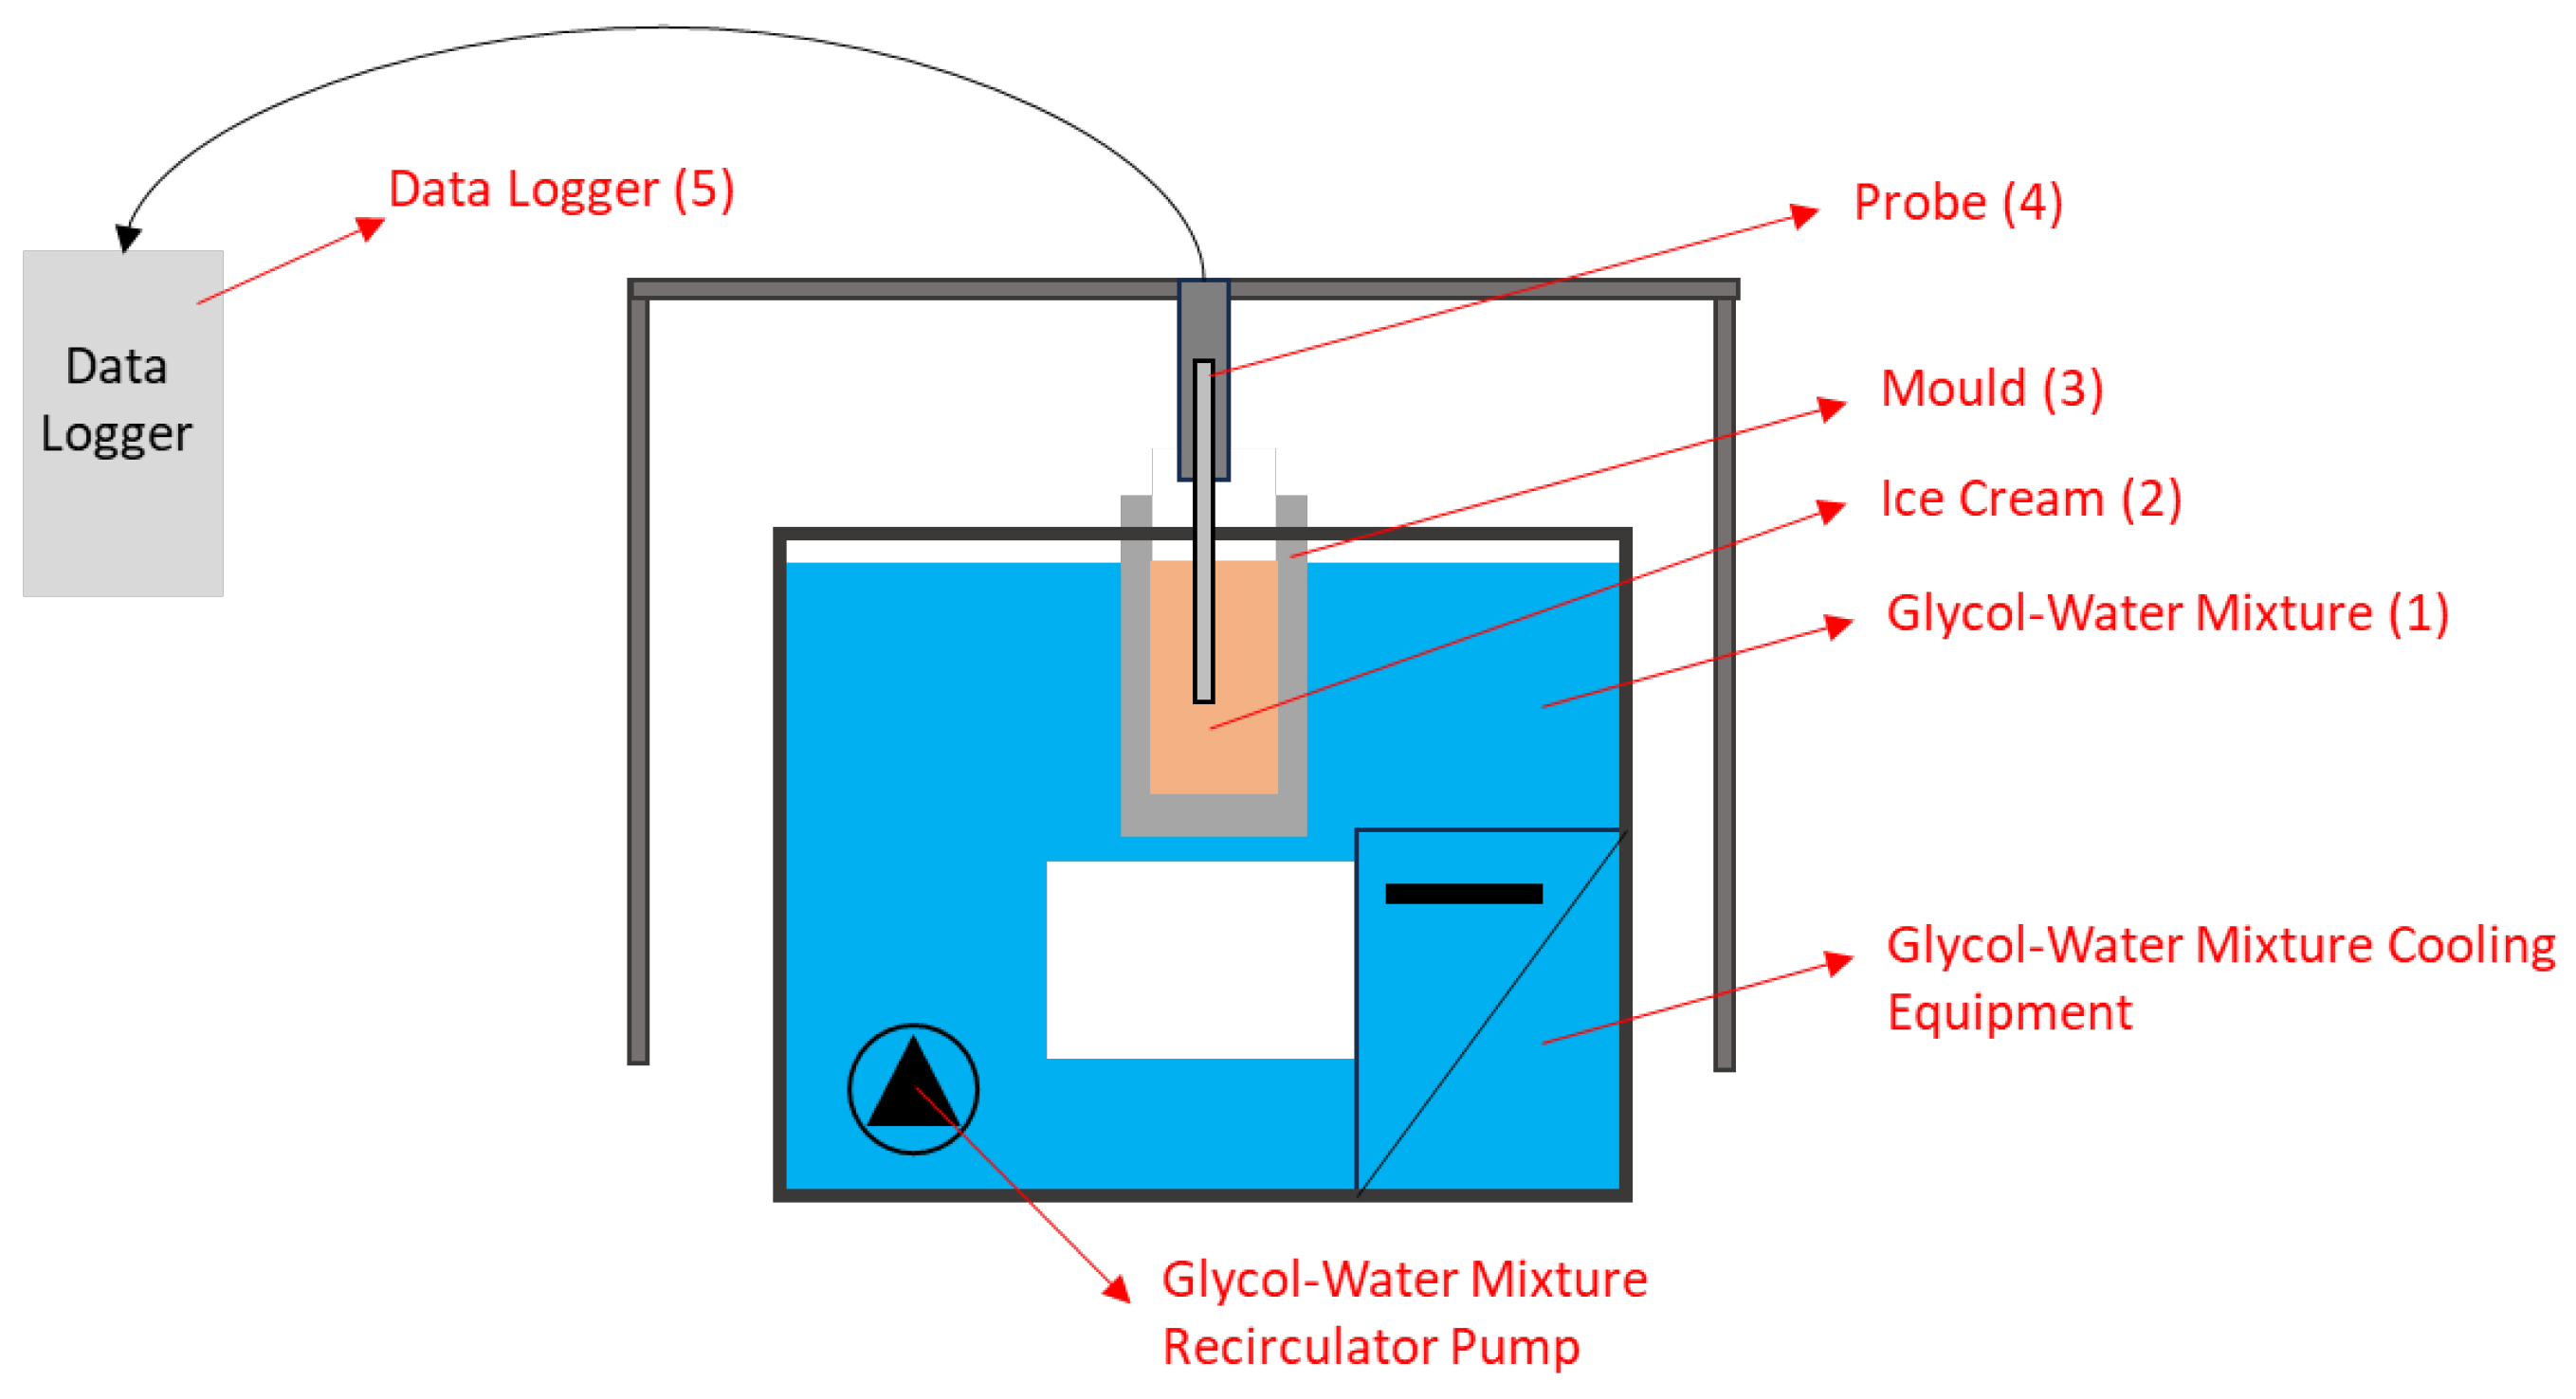
During the experimental studies, the mold was placed in the glycol–water mixture, and the temperature of the glycol–water mixture was adjusted to −34 °C. The temperature of the ice cream was collected only from one point, located at the center point of the ice cream, which was measured by a PT100 probe with 0.05 °C accuracy, and temperature data were collected every second. A schematic experimental setup visual can be found in Figure 2.
Real experimental setup and equipment visuals can be found in Figure 3.
To simulate real production conditions during experimental studies, the ice cream mixture was aerated to 30% of its volume using cooling mixer equipment. This basic equipment is a type of scraped surface heat exchanger, which we used to cool down the ice cream mixture. Since it was exposed to the environment, it was observed that the ice cream mixture became aerated by 30% during the beating process. The aerated ice cream mixture was then poured into the mold at 4 °C, and the temperature at the center of the ice cream was measured for 10 min, with data collected every second.
As mentioned before, numerical modelling was also developed using commercial software, Academic Ansys Thermal Transient Tool. The thermal properties of ice cream were uploaded according to the temperature points in the software.
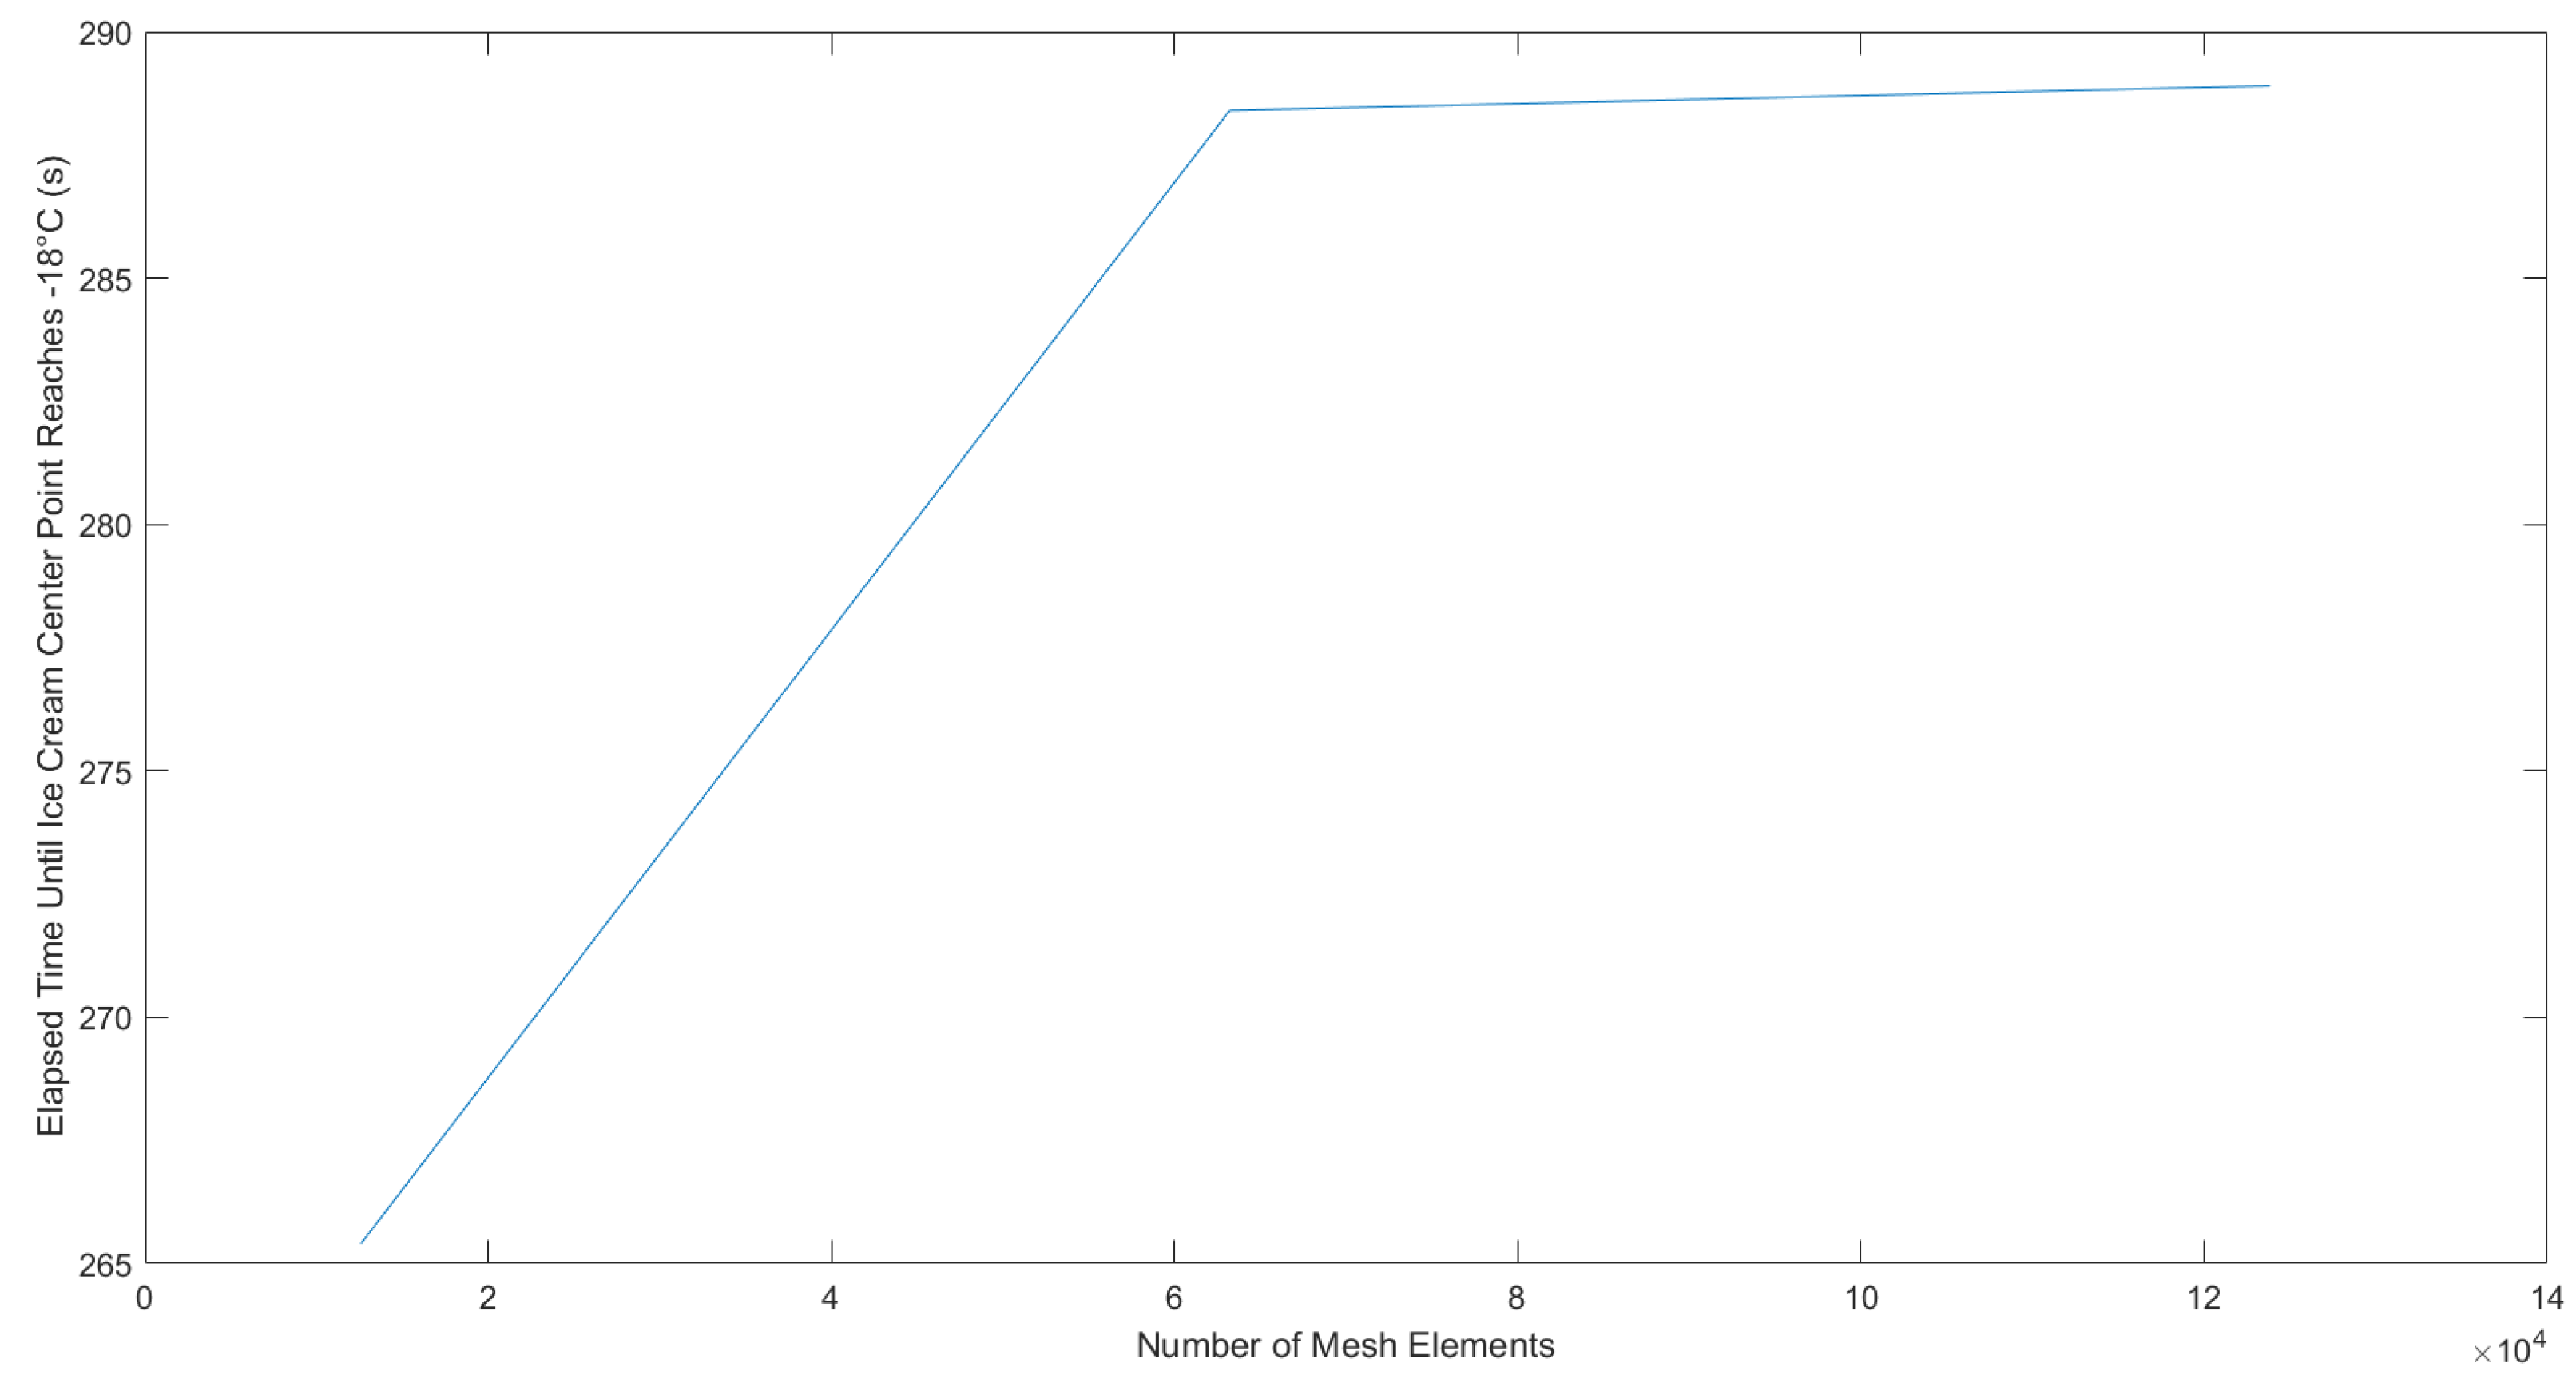
Before starting simulations, a mesh independence study was conducted to compare numerical results using 12,576, 63,210, and 123,845 elements. It was found that there was no difference between elapsed time until the ice cream center temperature reached −18 °C using 63,210 and 123,845 elements, indicating that exceeding 63,210 elements is unnecessary for this numerical analysis and would unnecessarily lead to a longer solution time and heavier computer performance load. A mesh independence study can be found in Figure 4.
The tetrahedron mesh type was used, and the 63,210 elements were created to solve the problem. The average skewness was 0.25, which is considered to be good quality for meshing in general applications. Boundary layer inflation is placed between the ice cream and mold to simulate heat transfer better between the two boundary layers. Mesh elements and boundary layer meshing visuals can be found in Figure 5.
The Ansys Transient Thermal Tool solves the three-dimensional time-dependent heat transfer equation in an explicit form. Three-dimensional time-dependent heat transfer formulation can be found in Equation (25).
T t = α 2 T x 2 + 2 T y 2 + 2 T z 2 + q
q represents the heat generation that is not applicable this research and α represents the thermal diffusivity, which is shown in Equation (26).
α = λ ρ c p
The ice cream sample’s side and bottom surfaces are in direct contact with a pre-cooled mold. In the simulation, it is assumed that there is perfect thermal conduction between the ice cream and the mold, with no resistance. The mold itself is in contact with a glycol–water mixture, maintaining a constant temperature at its contact surfaces, the boundary conditions of which can be written in the Equations between (27), (31).
T ( x , y , 0 , t ) = T 0
T ( x , 0 , z , t ) = T 0
T ( x , y , L , t ) = T 0
T ( 0 , y , z , t ) = T 0
T ( L , y , z , t ) = T 0
T 0 represents the glycol–water mixture temperature. Only the ice cream’s upper surface is in contact with the ambient temperature, and there is a convection heat transfer boundary condition that can be written as in Equation (32)
k T z | z = L , t = h T ( x , y , L , t ) T
h represents the convection coefficient and T represents the ambient temperature.

3. Results

3.1. Calculation of Experimental Ice Cream Sample Thermal Properties

As can be understood from the thermal property equations, the ingredient inside the recipe is very important. In this study, the experimental recipe contains 68.3% water, 18% sucrose, 7.9% skimmed milk powder, 5.4% vegetable fat, and 0.5% stabilizer and emulsifier.
According to the recipe, the mass fraction of dry matter, X s , is 31.268% and the heat capacity of dry matter, C s , is 1256 J kg−1 °C−1. The mass fraction of water, X w , is 68.732%. The heat capacity of water, C w , is 4187 J kg−1 °C−1. The mass fraction of bound water, b, is 8%. The heat capacity of ice, C p i c e , is 2040 J kg−1 °C−1. The molecular weight of water, M w , is 0.018 kg mol−1 and the molecular weight of dry matter is considered to be 0.55 kg mol−1. The perfect gas constant, R, is 8.3145 J mol−1 °C−1. The initial freezing temperature of water, T 0 , is considered to be 273 K and the freezing point of this ice cream recipe is found, according to (4) and Table 1, to be −2.28 °C.
Studies related to the determination of the amount of bound water have been summarized in [24]. According to this study, viscosity enhancers in ice cream bind water, which is referred to as bound water, and no longer allow the dissolution of components such as sugar. It has been found that the amount of bound water in ice cream ranges from 8.02% to 8.19%.
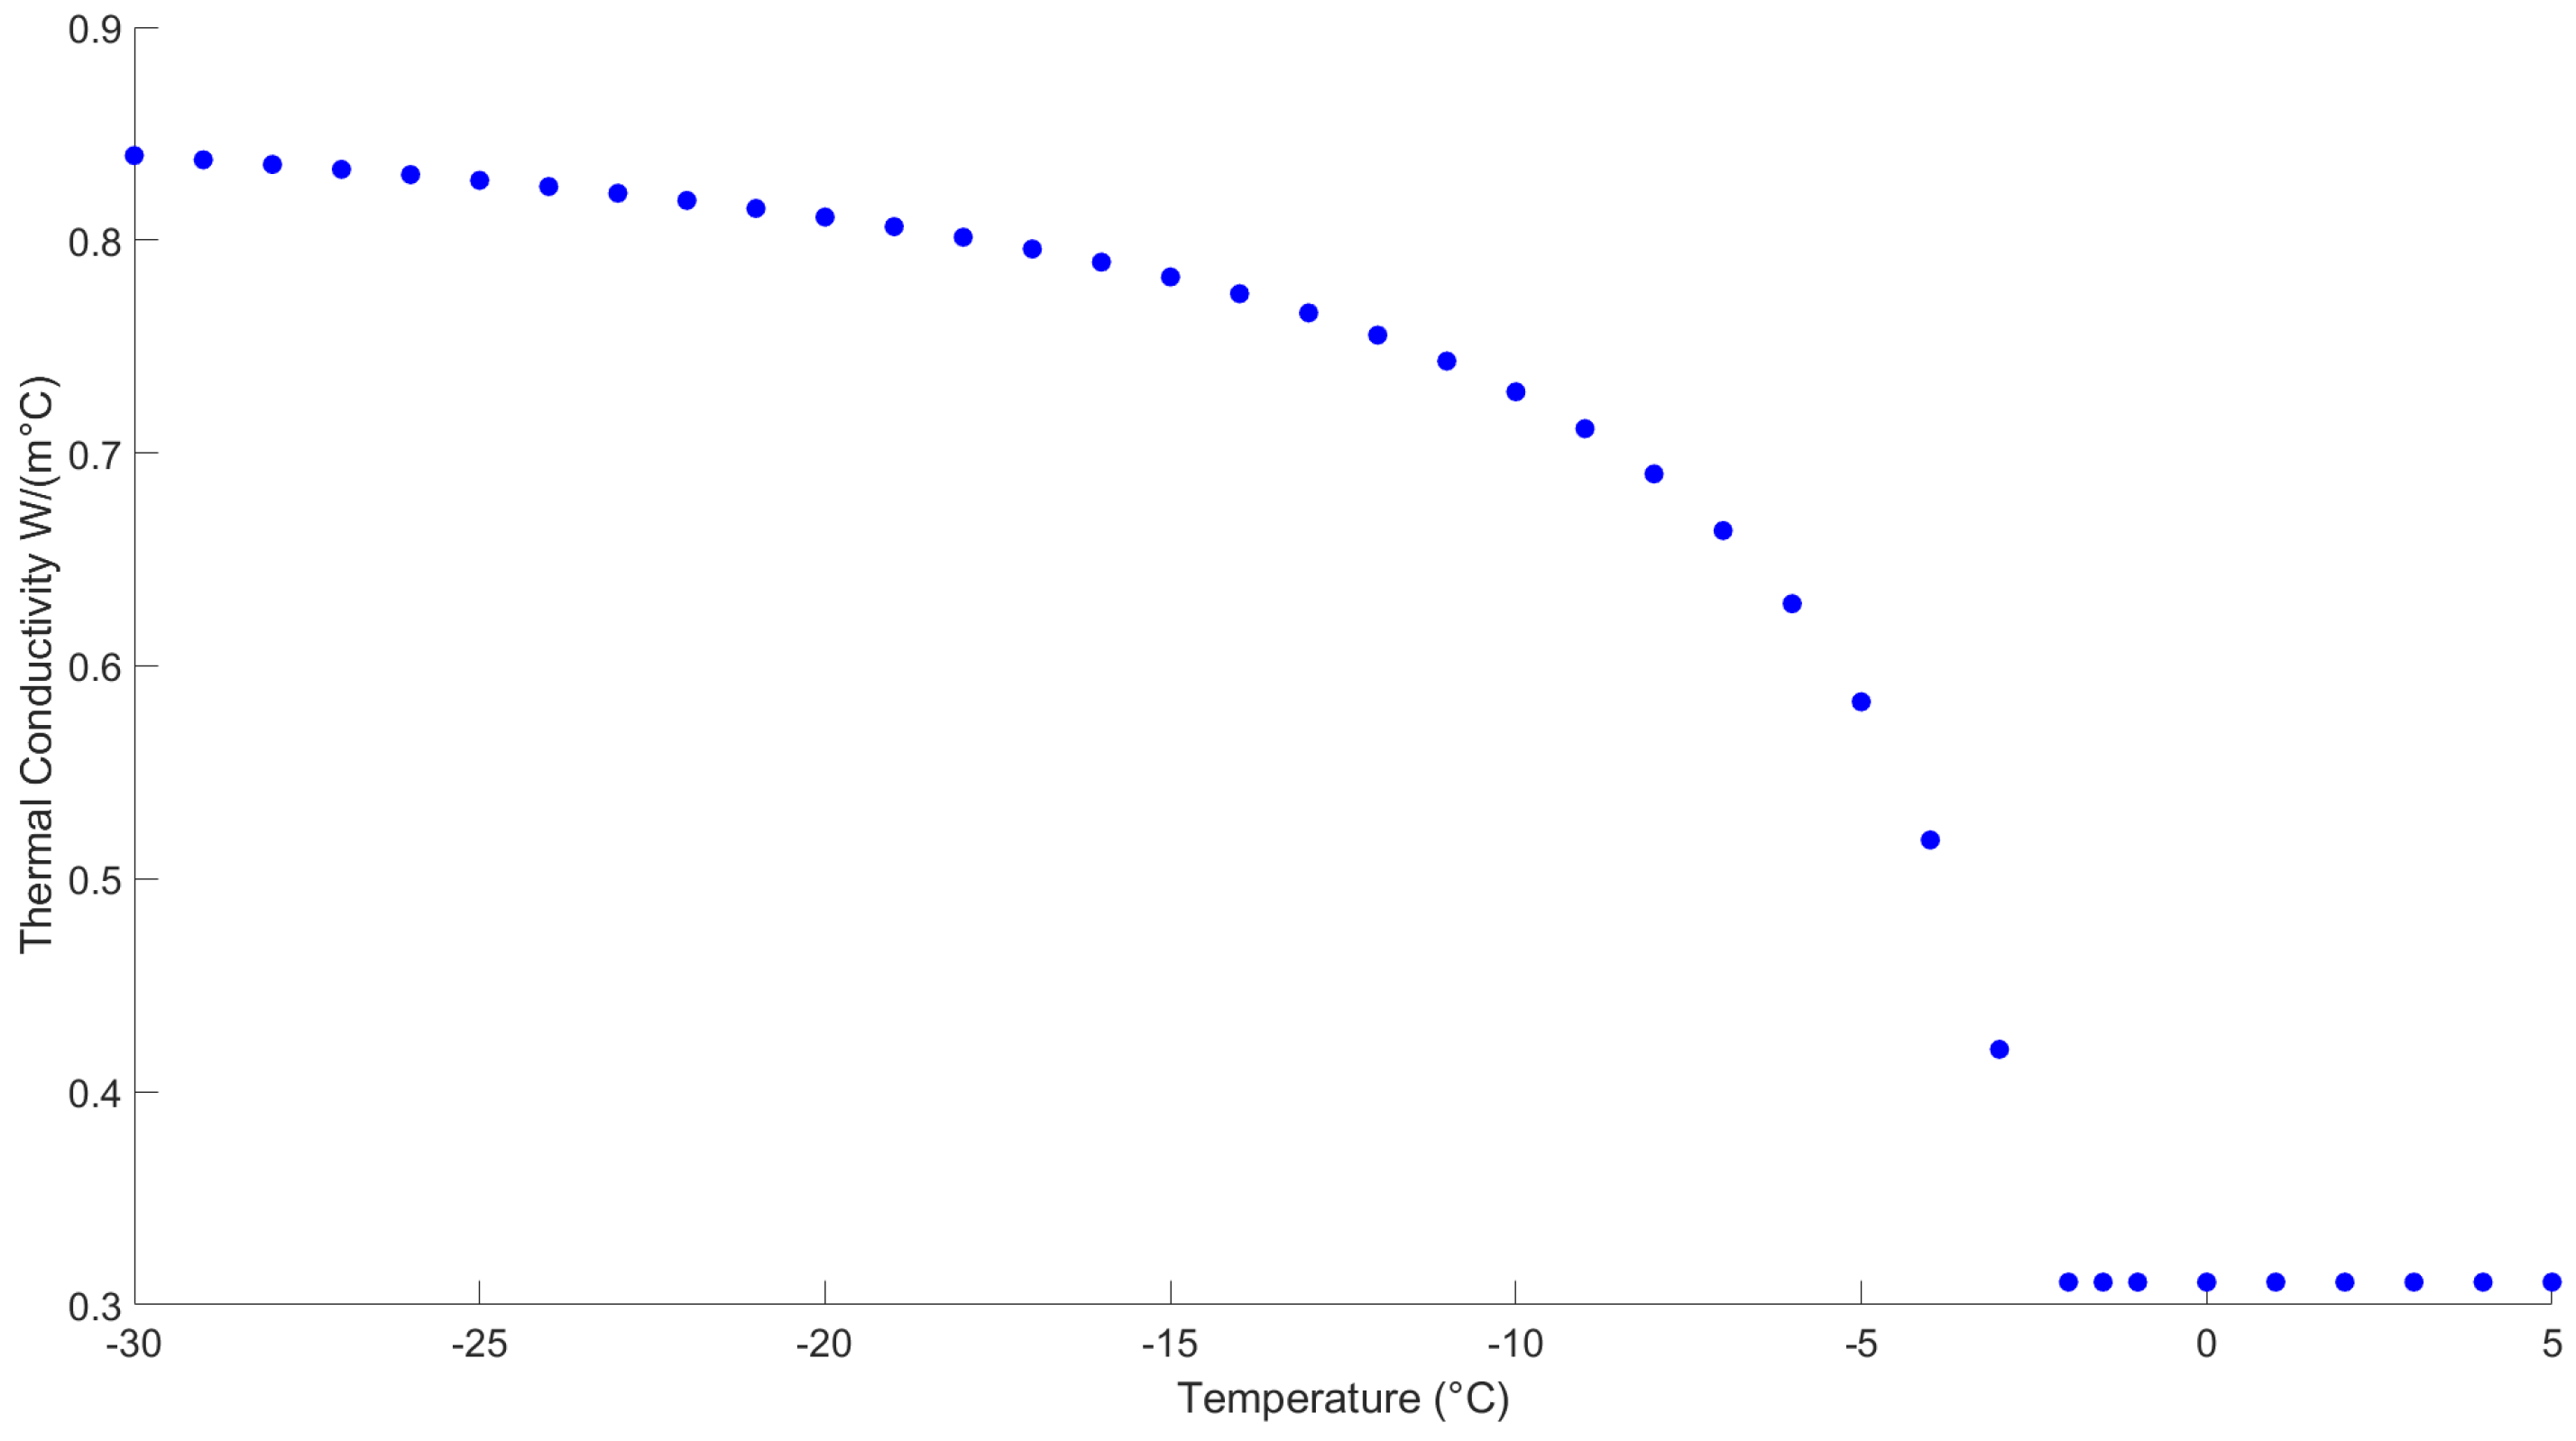
During the initial experimental studies, 30% air was added to the ice cream mixture according to the volume of ice cream mixture. Considering Equations (5)–(8), the thermal conductivity value was calculated according to an experimental recipe, and results can be found in Figure 6.

3.2. Experimental and Numerical Model Results

The temperature of the mold’s contact points with the glycol–water mixture is considered as a constant that is equal to temperature of the glycol–water mixture. The top surface of the ice cream boundary layer is considered to be where the convection heat transfer is happening, and the heat transfer convection coefficient is considered as 10 W/(m2 K). Ambient temperature is considered constant.
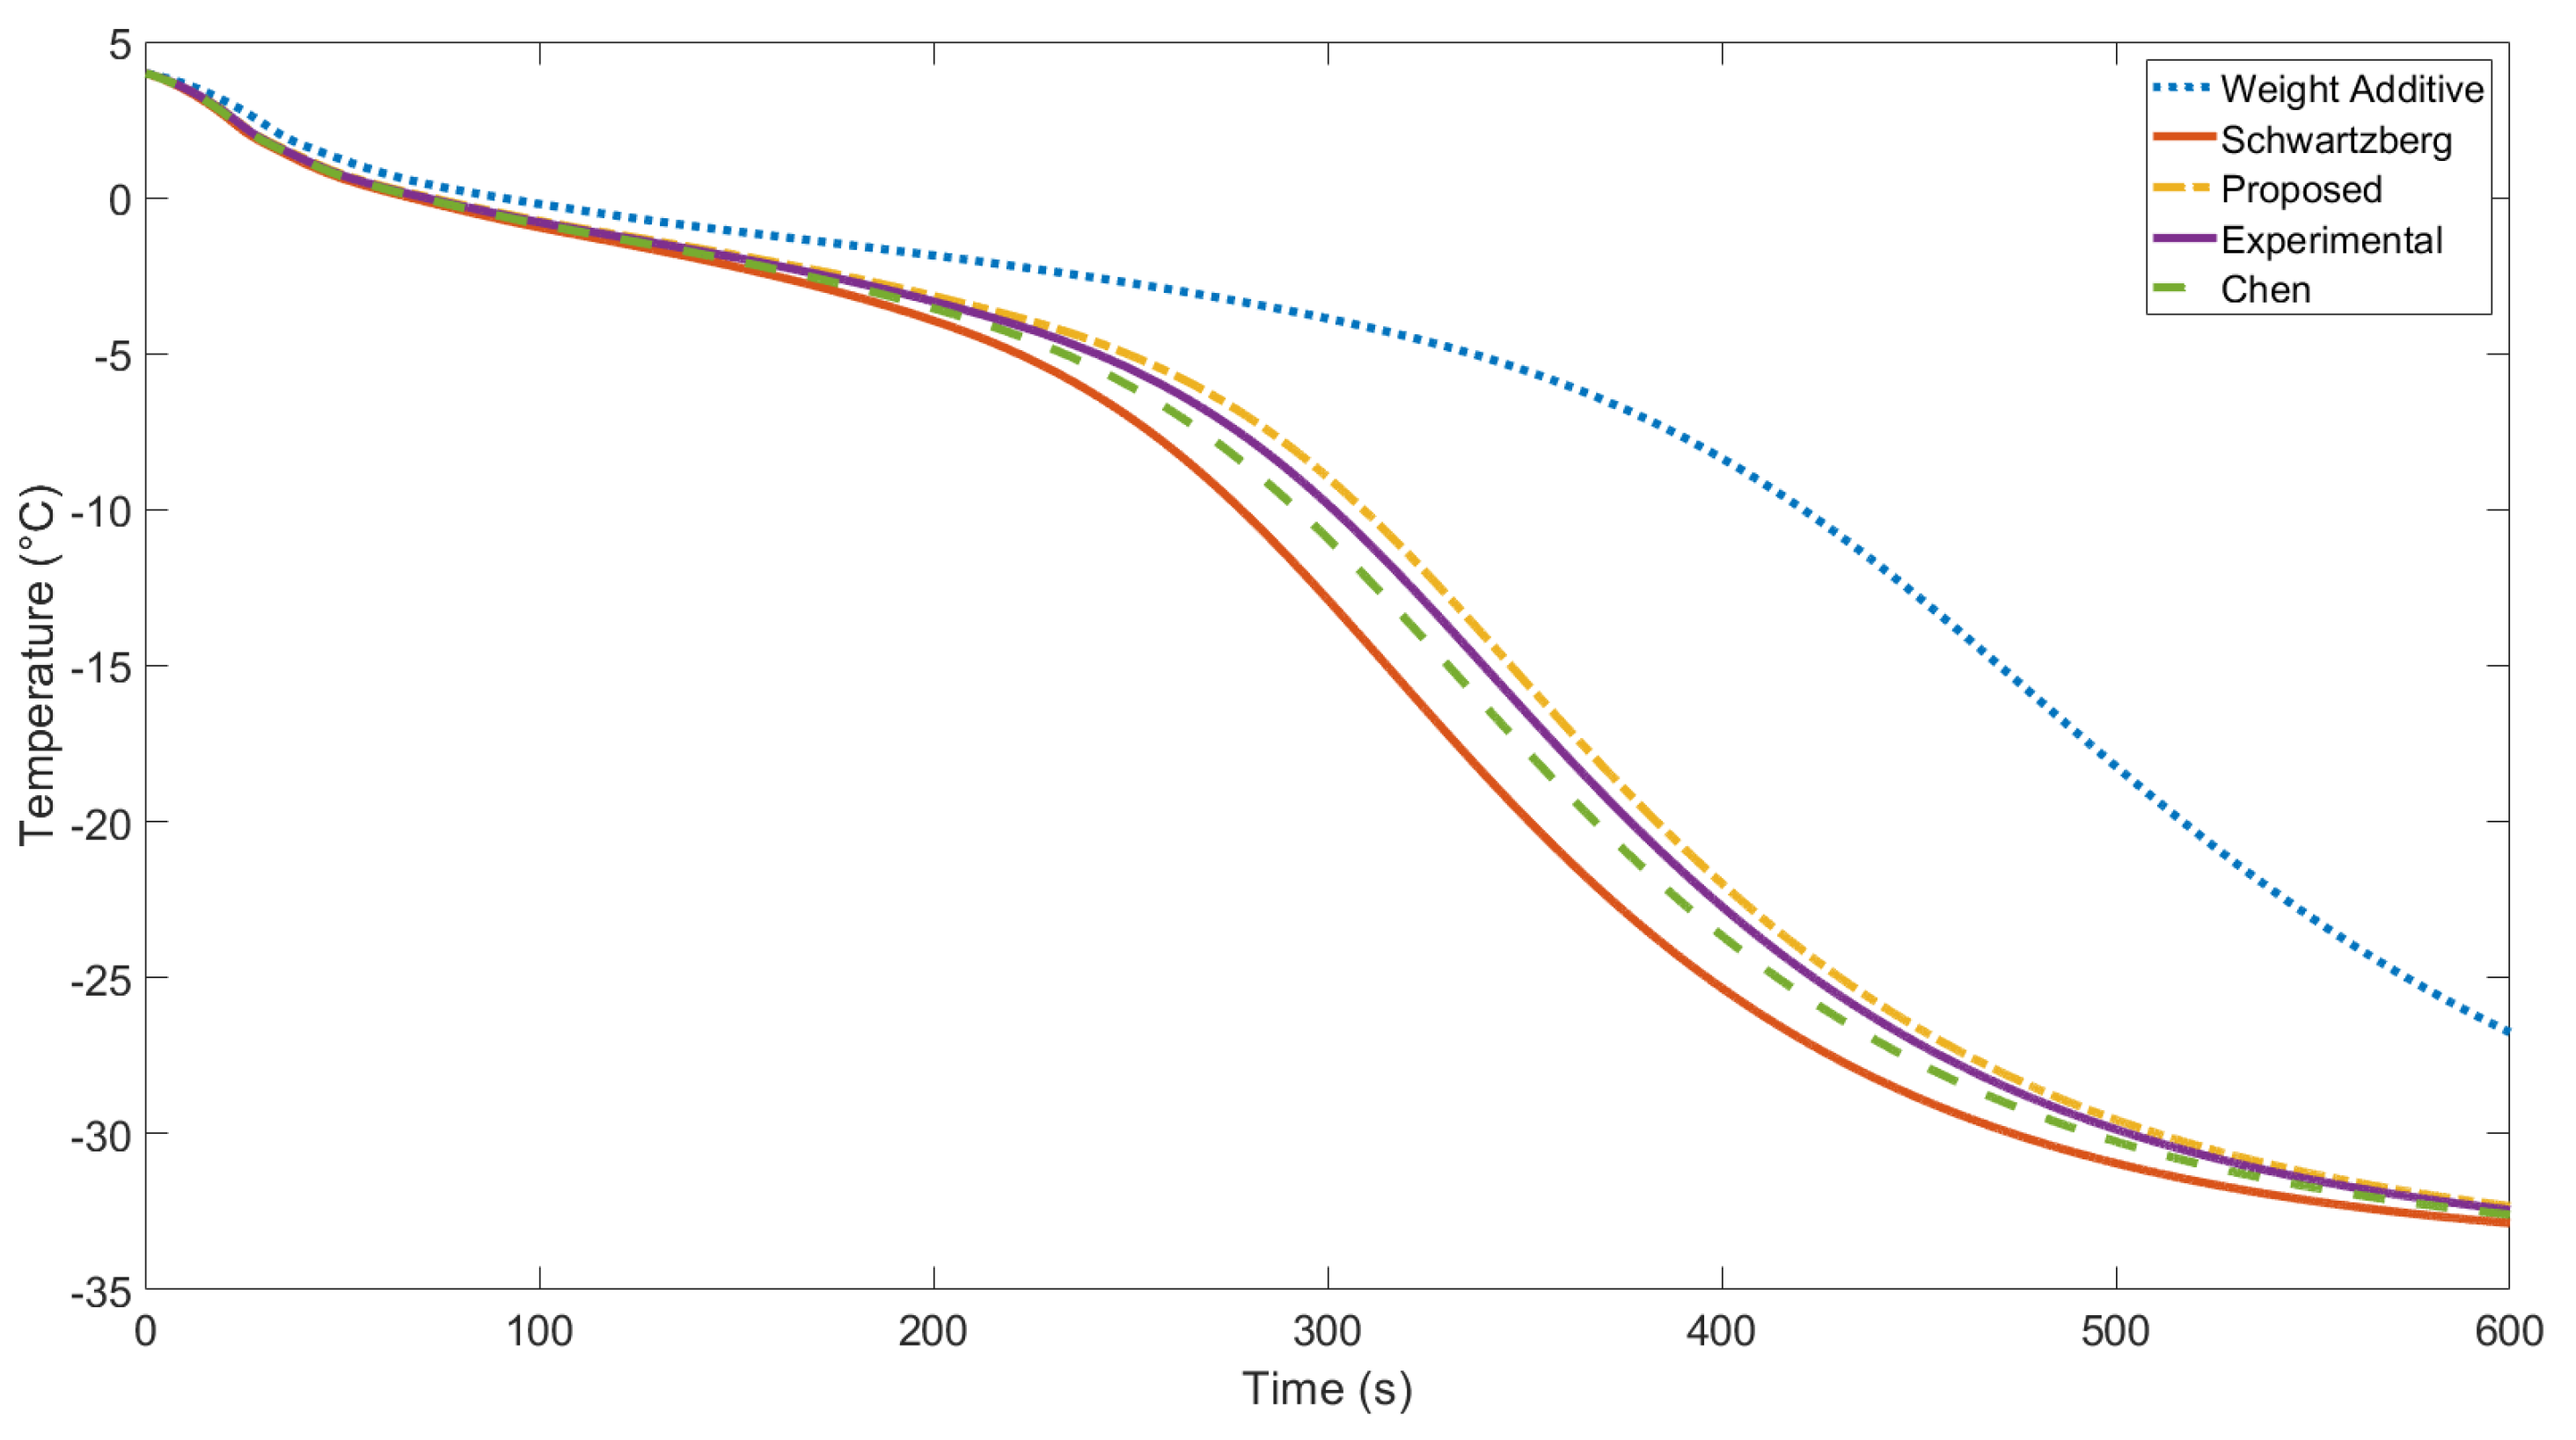
During experimental data recording, every second, the center point temperature of ice cream was recorded. Numerical simulation results were also captured every second, and numerical simulation was carried out for each specific heat correlation, which is given in Equations (10), (14), (15), and (24). Experimental results and numerical results are compared in Figure 7.
As is evident from Figure 7, the proposed formulation exhibits a favorable agreement with experimental results and correlations found in the existing literature. Consequently, the decision was made to proceed with a parametric analysis to explore additional factors influencing freezing performance. Conducting experimental studies for each parameter is impractical due to the considerable time and effort involved. Therefore, employing parametric numerical studies allows for a systematic investigation into the primary parameters affecting the study’s outcomes. Glycol–water mixture temperature, ice cream initial temperature, and air volume inside ice cream are the parameters of the freezing process. For each parameter, three levels were defined. For the glycol–water mixture temperature, −34, −37, and −40 °C are defined. Air amounts according to ice cream volume are considered to be 30, 50, and 80%. Initial ice cream temperature is considered as −1, 1, and 4 °C for the numerical analysis. The elapsed time until the ice cream center point reaches −18 °C was determined for each case, and the effects on the freezing time were discussed. Parametric study results can be found in Table 4. It is found that glycol–water mixture temperature is the most effective parameter in the freezing process and the least effective parameter is the amount of air inside the ice cream.

4. Discussion

This study investigates the phenomenon of ice cream freezing inside molds and proposes a new specific heat correlation. The specific heat results from the new correlation are compared with those from previous research, demonstrating good agreement with the ASHRAE [22] results, with only a 0.32% difference for temperatures above freezing and a 0.36% difference for temperatures below freezing. Additionally, a numerical model is developed to determine the freezing process of ice cream, which is validated through experimental studies. The effects of key parameters on the ice cream process are parametrically investigated, revealing that the glycol–water mixture temperature is the most significant parameter affecting the freezing phenomenon. A 3 °C difference in the glycol–water mixture temperature results in a 10.5% total change in freezing time on average, while the same temperature change for the initial temperature of ice cream is changes the total freezing time by 5.7%. Furthermore, 30% aerated ice cream exhibits a total freezing time that is 3.5% shorter than 50% aerated ice cream. However, this difference significantly increases between 50% and 80% aerated ice cream, averaging at 8.4%.

Author Contributions

Conceptualization, Ö.A.A. and D.B.Ö.; methodology, Ö.A.A. and D.B.Ö.; software, Ö.A.A.; validation, Ö.A.A. and D.B.Ö.; formal analysis, Ö.A.A. and D.B.Ö.; investigation, Ö.A.A. and D.B.Ö.; resources, Ö.A.A.; writing—original draft preparation, Ö.A.A. and D.B.Ö.; writing—review and editing, Ö.A.A.; visualization, Ö.A.A. supervision, D.B.Ö. All authors have read and agreed to the published version of the manuscript.

Funding

This research received no external funding.

Institutional Review Board Statement

Not applicable.

Informed Consent Statement

Not applicable.

Data Availability Statement

Data is contained within the article.

Acknowledgments

The authors would like to acknowledge that this paper is submitted in partial fulfilment of the requirements for a PhD degree at Yildiz Technical University and the authors gratefully acknowledge Unilever Sanayi ve Ticaret Türk A.Ş for their generous support in providing sustaining equipment for the experiments conducted in this study. Their contribution significantly enhanced the quality and scope of this research.

Conflicts of Interest

The authors declare no conflicts of interest.

References

  1. Lind, I. The measurement and prediction of thermal properties of food during freezing and thawing —A review with particular reference to meat and dough. J. Food Eng. 1991, 13, 285–319. [Google Scholar] [CrossRef]
  2. Sanz, P.; Alonso, M.D.; Mascheroni, R. Thermophysical Properties of Meat Products: General Bibliography and Experimental Values. Trans. ASAE 1987, 30, 283–289. [Google Scholar] [CrossRef]
  3. Simion, A.; Dobrovici, P.E.; Lacramioara, R.; Gavrilă, L. Modeling of the thermo-physical properties of grape juice I. Thermal conductivity and thermal diffusivity. Annals. Food Sci. Technol. 2009, 10, 363–368. [Google Scholar]
  4. Telis-Romero, J.; Telis, V.R.N.; Gabas, A.L.; Yamashita, F. Thermophysical properties of Brazilian orange juice as affected by temperature and water content. J. Food Eng. 1998, 38, 27–40. [Google Scholar] [CrossRef]
  5. Magerramov, M. Heat capacity of natural fruit juices and of their concentrates at temperatures from 10 to 120 °C. J. Eng. Phys. Thermophys. 2007, 80, 1055–1063. [Google Scholar] [CrossRef]
  6. Magerramov, M.; Abdulagatov, A.; Abdulagatov, I.; Azizov, N. Thermal conductivity of peach, raspberry, cherry and plum juices as a function of temperature and concentration. J. Food Process. Eng. 2006, 29, 304–326. [Google Scholar] [CrossRef]
  7. Cogné, C.; Andrieu, J.; Laurent, P.; Besson, A.; Nocquet, J. Experimental data and modelling of thermal properties of ice creams. J. Food Eng. 2003, 58, 331–341. [Google Scholar] [CrossRef]
  8. Sudhir, K.S.; Ashis, K.D. Thermal Properties of Frozen Peas, Clams and Ice Cream. Can. Inst. Food Sci. Technol. J. 1984, 17, 242–246. [Google Scholar] [CrossRef]
  9. Heldman, D.R.; Hedrick, T.I. Refrigeration requirements for ice cream freezing. J. Dairy Sci. 1970, 53, 1194–1200. [Google Scholar] [CrossRef]
  10. Bongers, P.M.M. A heat transfer model of a scraped surface heat exchanger for ice cream. In 16th European Symposium on Computer Aided Process Engineering and 9th International Symposium on Process Systems Engineering; Marquardt, W., Pantelides, C., Eds.; Computer Aided Chemical Engineering; Elsevier: Amsterdam, The Netherlands, 2006; Volume 21, pp. 539–544. [Google Scholar] [CrossRef]
  11. Boccardi, G.; Celata, G.P.; Lazzarini, R.; Saraceno, L.; Trinchieri, R. Development of a heat transfer correlation for a Scraped-Surface Heat Exchanger. Appl. Therm. Eng. 2010, 30, 1101–1106. [Google Scholar] [CrossRef]
  12. Imran, A.; Rana, M.A.; Siddiqui, A.M.; Shoaib, M. Flow of second grade fluid in a scraped surface heat exchanger. J. Food Process. Eng. 2017, 40, e12393. [Google Scholar] [CrossRef]
  13. Masuda, H.; Sawano, M.; Ishihara, K.; Shimoyamada, M. Effect of agitation speed on freezing process of ice cream using a batch freezer. J. Food Process. Eng. 2020, 43, e13369. [Google Scholar] [CrossRef]
  14. Cogné, C.; Laurent, P.; Andrieu, J.; Ferrand, J. Experimental data and modelling of ice cream freezing. Chem. Eng. Res. Des. 2003, 81, 1129–1135. [Google Scholar] [CrossRef]
  15. Schwartzberg, H.G. Effective heat capacities for the freezing and thawing of food. J. Food Sci. 1976, 41, 152–156. [Google Scholar] [CrossRef]
  16. Chen, C.S. Thermodynamic analysis of the freezing and thawing of foods: Enthalpy and apparent specific heat. J. Food Sci. 1985, 50, 1158–1162. [Google Scholar] [CrossRef]
  17. Leighton, A. On the calculation of the freezing point of ice cream mixes and of the quantities of ice separated during the freezing process. J. Dairy Sci. 1927, 10, 300–308. [Google Scholar] [CrossRef]
  18. Chang, H.D.; Tao, L.C. Correlations of enthalpies of food systems. J. Food Sci. 1981, 46, 1493–1497. [Google Scholar] [CrossRef]
  19. Marshall, R.T.; Goff, H.D.; Hartel, R.W. Ice Cream; Springer Science & Business Media: Berlin/Heidelberg, Germany, 2003. [Google Scholar]
  20. Miles, C.A.; van Beek, G.; Veerkamp, C.H. Calculation of thermophysical properties of foods. In Physical Properties of Foods; Jowitt, R., Ed.; Applied Science Publishers: London, UK, 1983. [Google Scholar]
  21. Fricke, B.; Becker, B. Evaluation of Thermophysical Property Models for Foods. HVAC&R Res. 2001, 7, 311–330. [Google Scholar] [CrossRef]
  22. American Society of Heating, Refrigerating, and Air-Conditioning Engineers. ASHRAE Handbook: Refrigeration; American Society of Heating, Refrigerating, and Air-Conditioning Engineers: Peachtree Corners, Georgia, 2006. [Google Scholar]
  23. Choi, Y.; Okos, M.R. Effects of the temperature and composition on the thermal properties of foods. In Food Engineering and Process Applications; IIR: Charlotte, NC, USA, 1986; pp. 93–101. [Google Scholar]
  24. Pyenson, H.; Dahle, C.D. Bound Water and its Relation to Some Dairy Products: I. The Bound Water Content of Some Milk Products and Other Products Used in the Dairy Industry. J. Dairy Sci. 1938, 21, 169–185. [Google Scholar] [CrossRef]
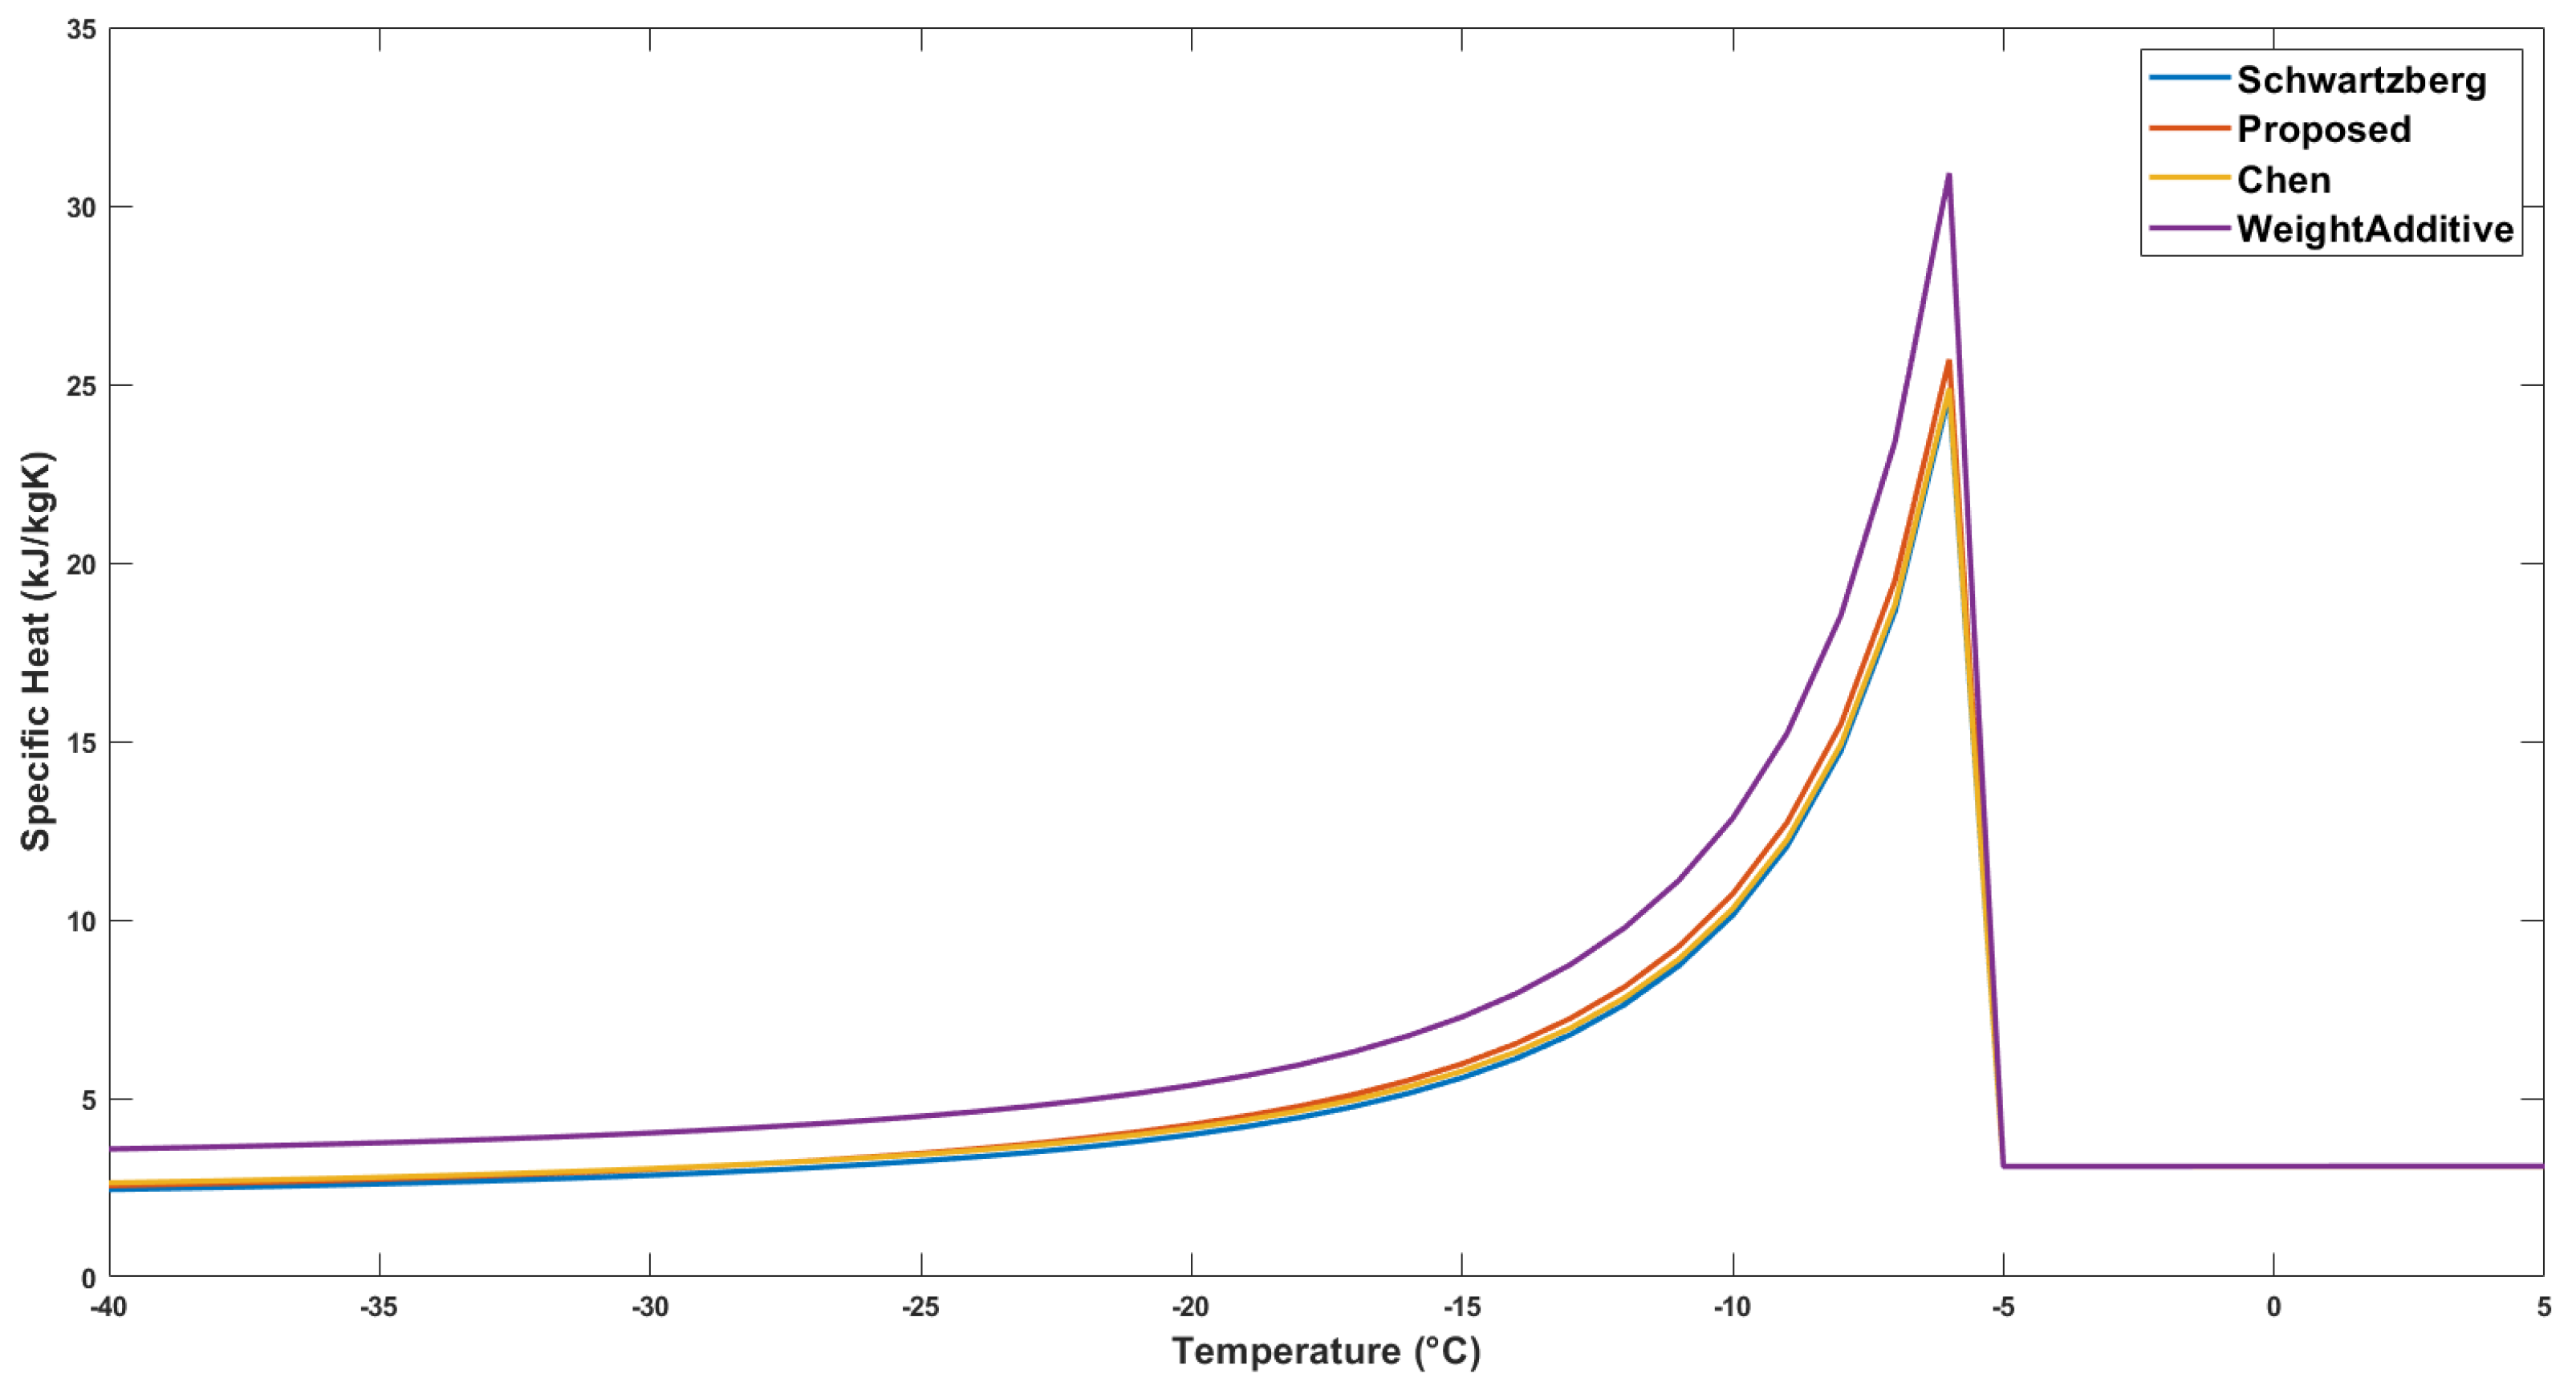
Figure 1. Specific heat calculations according to literature data.
Applsci 14 06194 g001
Figure 2. Schematic visualization of the experimental setup.
Applsci 14 06194 g002
Figure 3. Experimental setup: 1 corresponds to the glycol–water mixture, 3 represents the mold, 4 denotes the PT100 probe, and 5 signifies the data logger equipment.
Applsci 14 06194 g003
Figure 4. Mesh elements and boundary layer inflation visual.
Applsci 14 06194 g004
Figure 5. Mesh elements and boundary layer inflation visual.
Applsci 14 06194 g005
Figure 6. Thermal conductivity results according to literature correlations.
Applsci 14 06194 g006
Figure 7. Numerical and experimental results comparison graph.
Applsci 14 06194 g007
Table 1. Freezing point depression according to sucrose equivalence.
Sucrose Amount Dissolved
in 100 g Water (g)
Freezing Point
Depression (°C)
30.18
60.35
90.53
120.72
150.90
181.10
211.29
241.47
271.67
301.86
332.03
362.21
392.40
422.60
452.78
482.99
513.20
Table 2. Chocolate ice cream’s physical properties.
Food ItemWater
Xwo
Protein
Xp
Fat
Xf
Carbohydrate
Xc
Ash
Xa
Chocolate ice cream55.73.81129.41
Table 3. Chocolate ice cream’s physical properties.
CorrelationSpecific Heat Above
Freezing kJ/(kg K)
Specific Heat Below
Freezing kJ/(kg K)
ASHRAE3.112.75
Chen3.092.79
Schwartzberg3.102.60
Weight Additive3.103.75
Proposed3.102.74
Table 4. Parametric numerical analysis results.
Glycol–Water Mixture Temperature (°C)Initial Ice Cream Temperature (°C)Aeration Amount (%)Elapsed Time Until Ice Cream Center Point Reaches −18 °C (s)
−40−130229.6
−40−150238.4
−40−180311
−40130242.4
−40150251.6
−40180328.2
−40430260.2
−40450269.8
−40480351.6
−37−130254
−37−150263.6
−37−180344
−37130268.4
−37150278.6
−37180363.2
−37430288.4
−37450299.2
−37480389.6
−34−130284.8
−34−150303.2
−34−180385.6
−34130301.2
−34150312.6
−34180407.3
−34430324.4
−34450336.4
−34480437.8
Disclaimer/Publisher’s Note: The statements, opinions and data contained in all publications are solely those of the individual author(s) and contributor(s) and not of MDPI and/or the editor(s). MDPI and/or the editor(s) disclaim responsibility for any injury to people or property resulting from any ideas, methods, instructions or products referred to in the content.