1. Introduction
As a critical piece of infrastructure, the power grid shoulders the important mission of providing a safe and reliable power supply for economic and social operations. In order to control the power system, three major systems of characteristic recognition, operation control, and fault prevention have been gradually established. However, with advances in the construction of new power systems and information and communication technology, the physical foundation of new power systems has undergone profound changes [
1]. The coupling between power grid operation and external systems including primary energy sources has increased the potential for cyberattacks, and business cross-visits between the source side, the load side, and the grid side are frequent. The cyberspace boundary of power systems extends outwards, the network exposure surface is expanding day by day, and attack springboards are increasing, intensifying the threat of cyber-physical cross-domain attacks with strong targeting, high concealment, and cross-space characteristics. Cyber-physical cross-domain attackers adopt diversified and complex network attack methods. Such attacks start in the power information space, and the attacks target clearly affect the physical entities. They ultimately cause power system failures or even large-scale power outages. Numerous landmark cyberattacks such as Stuxnet in recent years have shown that cyber-physical cross-domain attacks that occur in the information domain clearly affect targets in the physical domain and can cause systemic paralysis of power infrastructure, trigger large-scale power outages, and even endanger national security [
2,
3].
In previous years, power systems effectively resisted attack threats from the internet by establishing three deep boundary isolation and protection systems: the internet, the information network, and the control network [
4]. However, with the increasing application and development of advanced energy technologies, new power systems are becoming more open, information-physical coupling interactions are becoming more complex, and the boundaries of traditional network security protection are further extended. The network boundary security protection measures based on physical isolation make it difficult to penetrate deeply into the periphery; however, the security responsibility boundary crosses the network region boundary, and security protection based on border protection is difficult to continue to apply. The threat of information-physical cross-domain attacks is greater. Therefore, in recent years, research on power cyber-physical cross-domain attacks has become a hot topic in the industry. The two most typical characteristics of electric power cyber-physical cross-domain attacks are the cross-space characteristics of the path and the temporal causality characteristics of attack load delivery. Therefore, the analysis and evaluation of electric power cyber-physical cross-domain attack paths are the focus of this article. Graph knowledge is a widely used basic theory of vulnerability exploitation analysis, from which concepts such as attack graphs are derived [
5]. An attack graph can help analyze the security threats to the power cyber-physical integration system from the perspective of vulnerability exploitation, and is an effective security analysis approach. It takes an attacker’s perspective and analyzes the dependencies between vulnerabilities that can be exploited based on the vulnerability information of cyber-physical nodes to find out all possible attack paths [
6,
7] so that administrators can take necessary measures to resist security risks. At the same time, research on power cyber-physical network attack paths based on graph knowledge has emerged in the industry. Therefore, graph knowledge can provide important support for the analysis and quantitative assessment of cyber-physical cross-domain attack paths in power systems.
In existing network security research based on graph knowledge, attack graph construction is a popular direction. In existing research, according to the different meanings represented by nodes and edges in the attack graph, attack graphs are divided into two categories: state attack graphs and causal relationship graphs [
8]. The nodes in the state attack graph represent the global state of the target network and the attacker, and the directed edges represent the state transitions caused by a single attack behavior [
9,
10]. Due to the state space explosion problem, state attack graphs are not suitable for security analysis of large-scale systems. In a causal relationship graph [
8,
9], nodes represent system attributes and atomic attacks, and directed edges represent causal relationships between nodes. The causal relationship diagram overcomes the state combination explosion problem of the state attack graph, has better scalability, and can be used for large-scale network security analysis. Most current attack graphs [
8,
9,
10] are causal relationship diagrams. Based on the coverage of attack paths in the attack graph, the attack graph can be divided into network attack graphs and sub-attack graphs. The network attack graph displays all possible attack paths in the business scenario, and the sub-attack graph displays only the attack paths related to specific security threats. The network attack graph is suitable for identifying various vulnerability exploitation threats in business scenarios that may affect the security attributes of the business system, and helps to assess the overall security or situation of the business system. However, network attack graphs [
9,
10] are often very large and are not suitable for analysis of a specific vulnerability exploitation threat. Sub-attack graphs [
11] are suitable for targeted analysis and disposal of specific vulnerability exploitation threats. In specific security analysis scenarios, in view of the different business importance of the system and the impact of factors such as limited resources and cost, it is often necessary to further analyze the various identified vulnerabilities and generate sub-attack graphs corresponding to each vulnerability risk, and finally determine the priority order of vulnerability exploitation threats to reasonably allocate security resources. Most of the above studies carried out attack graph construction and analysis from an attack perspective. The applicability of power cyber-physical fusion systems is not strong due to characteristics such as cross-space, strong coupling, and boundary protection. Attack graph construction and cyber-physical cross-domain attack methods that lack a business perspective and meet the characteristics of power cyber-physical fusion systems.
The authors of [
12] constructed a dependency graph called an object instance graph into a hypergraph by analyzing system calls, and built a Bayesian network based on the instance graph to achieve zero-day attack path characterization and identification. Kavallieratosd et al. considered the degree of hazard correlation between subsystems and attack paths, analyzed attack paths and determined the priority of the paths, which were used to discover and analyze attack paths in interconnected cyber-physical systems of equal scale in the real world [
13]. The authors of [
14] applied risk flow to represent the network and attack scenarios, and then fed it to the network flow model to calculate the risk flow. Finally, a dual-objective ranking algorithm was used to automatically infer the priority of the risk transmission path and perform fuzzy comprehensive evaluation to determine the risk severity. The authors of [
15] focused on the power cyber-physical fusion system and defined the attack cost, attack benefit, and attack efficiency based on the attacker’s perspective to quantify the gain–loss ratio of the attack, thereby analyzing the most efficient attack path. The flaw is that the article only considers the betweenness of vertices and does not consider the scenarios and vulnerabilities of cyber-physical nodes. Using the quantitative analysis results of attack paths, it is difficult to truly depict the risks of actual business scenarios. The authors of [
16] proposed a quantitative assessment method based on an improved attack graph, which quantifies the hazards of attack paths by introducing vertex vulnerability factors and defining the out-degree and in-degree of vertices. It is not considered that when the vertex degrees are the same, the quantitative evaluation results will be greatly biased.
This article is based on the strong coupling and boundary protection business characteristics of the power cyber-physical fusion system and the cross-space conduction and temporal causality characteristics of power cyber-physical cross-domain attack risks. A method for quantitative analysis of cross-domain attack paths in electric power cyber-physics based on graph knowledge is proposed. It intuitively reveals the impact of information space network security risks on the operating status of physical space systems after being propagated across space through attack paths. The proposed hierarchical attack graph construction and analysis method for power cyber-physical fusion systems takes into account its spatiotemporal constraints and dynamic characteristics, further expands the research content of existing work, and is applicable to all cyber-physical fusion systems. It can realize cyber-physical cross-domain attack path characterization and hazard quantification analysis. The contributions of this article mainly include the following three aspects:
- (1)
A method for constructing hierarchical attack graphs for power cyber-physical fusion systems is proposed. This method defines various objects such as cyber-physical cross-domain attacks, control master stations, measurement and control equipment node failures, and transient stable node disturbances as attack graph vertices, and establishes a causal logical relationship between each vertex. This realizes the characterization of the attack path of the power cyber-physical fusion system.
- (2)
Calculation of the vulnerability of vertices by comprehensively considering the out-degree, in-degree, and vertex betweenness of each vertex of the attack graph, and defining the edge weights and cyber-physical coupling relationships of the attack graph. This theoretically demonstrates the degree of harm to the operation of the physical space system after the risks of the power information physical coupling system are transmitted through various attack paths.
- (3)
The effectiveness of the proposed method is verified based on the IEEE RTS79 and RTS96 standard node systems. The simulation results show that the method in this paper can effectively evaluate the impact of cyber-physical cross-domain attack risks on the operation of the physical space system after being transmitted through the attack path, proving the effectiveness of this method.
3. Method for Constructing Attack Graph of Electric Power Cyber-Physical Fusion System
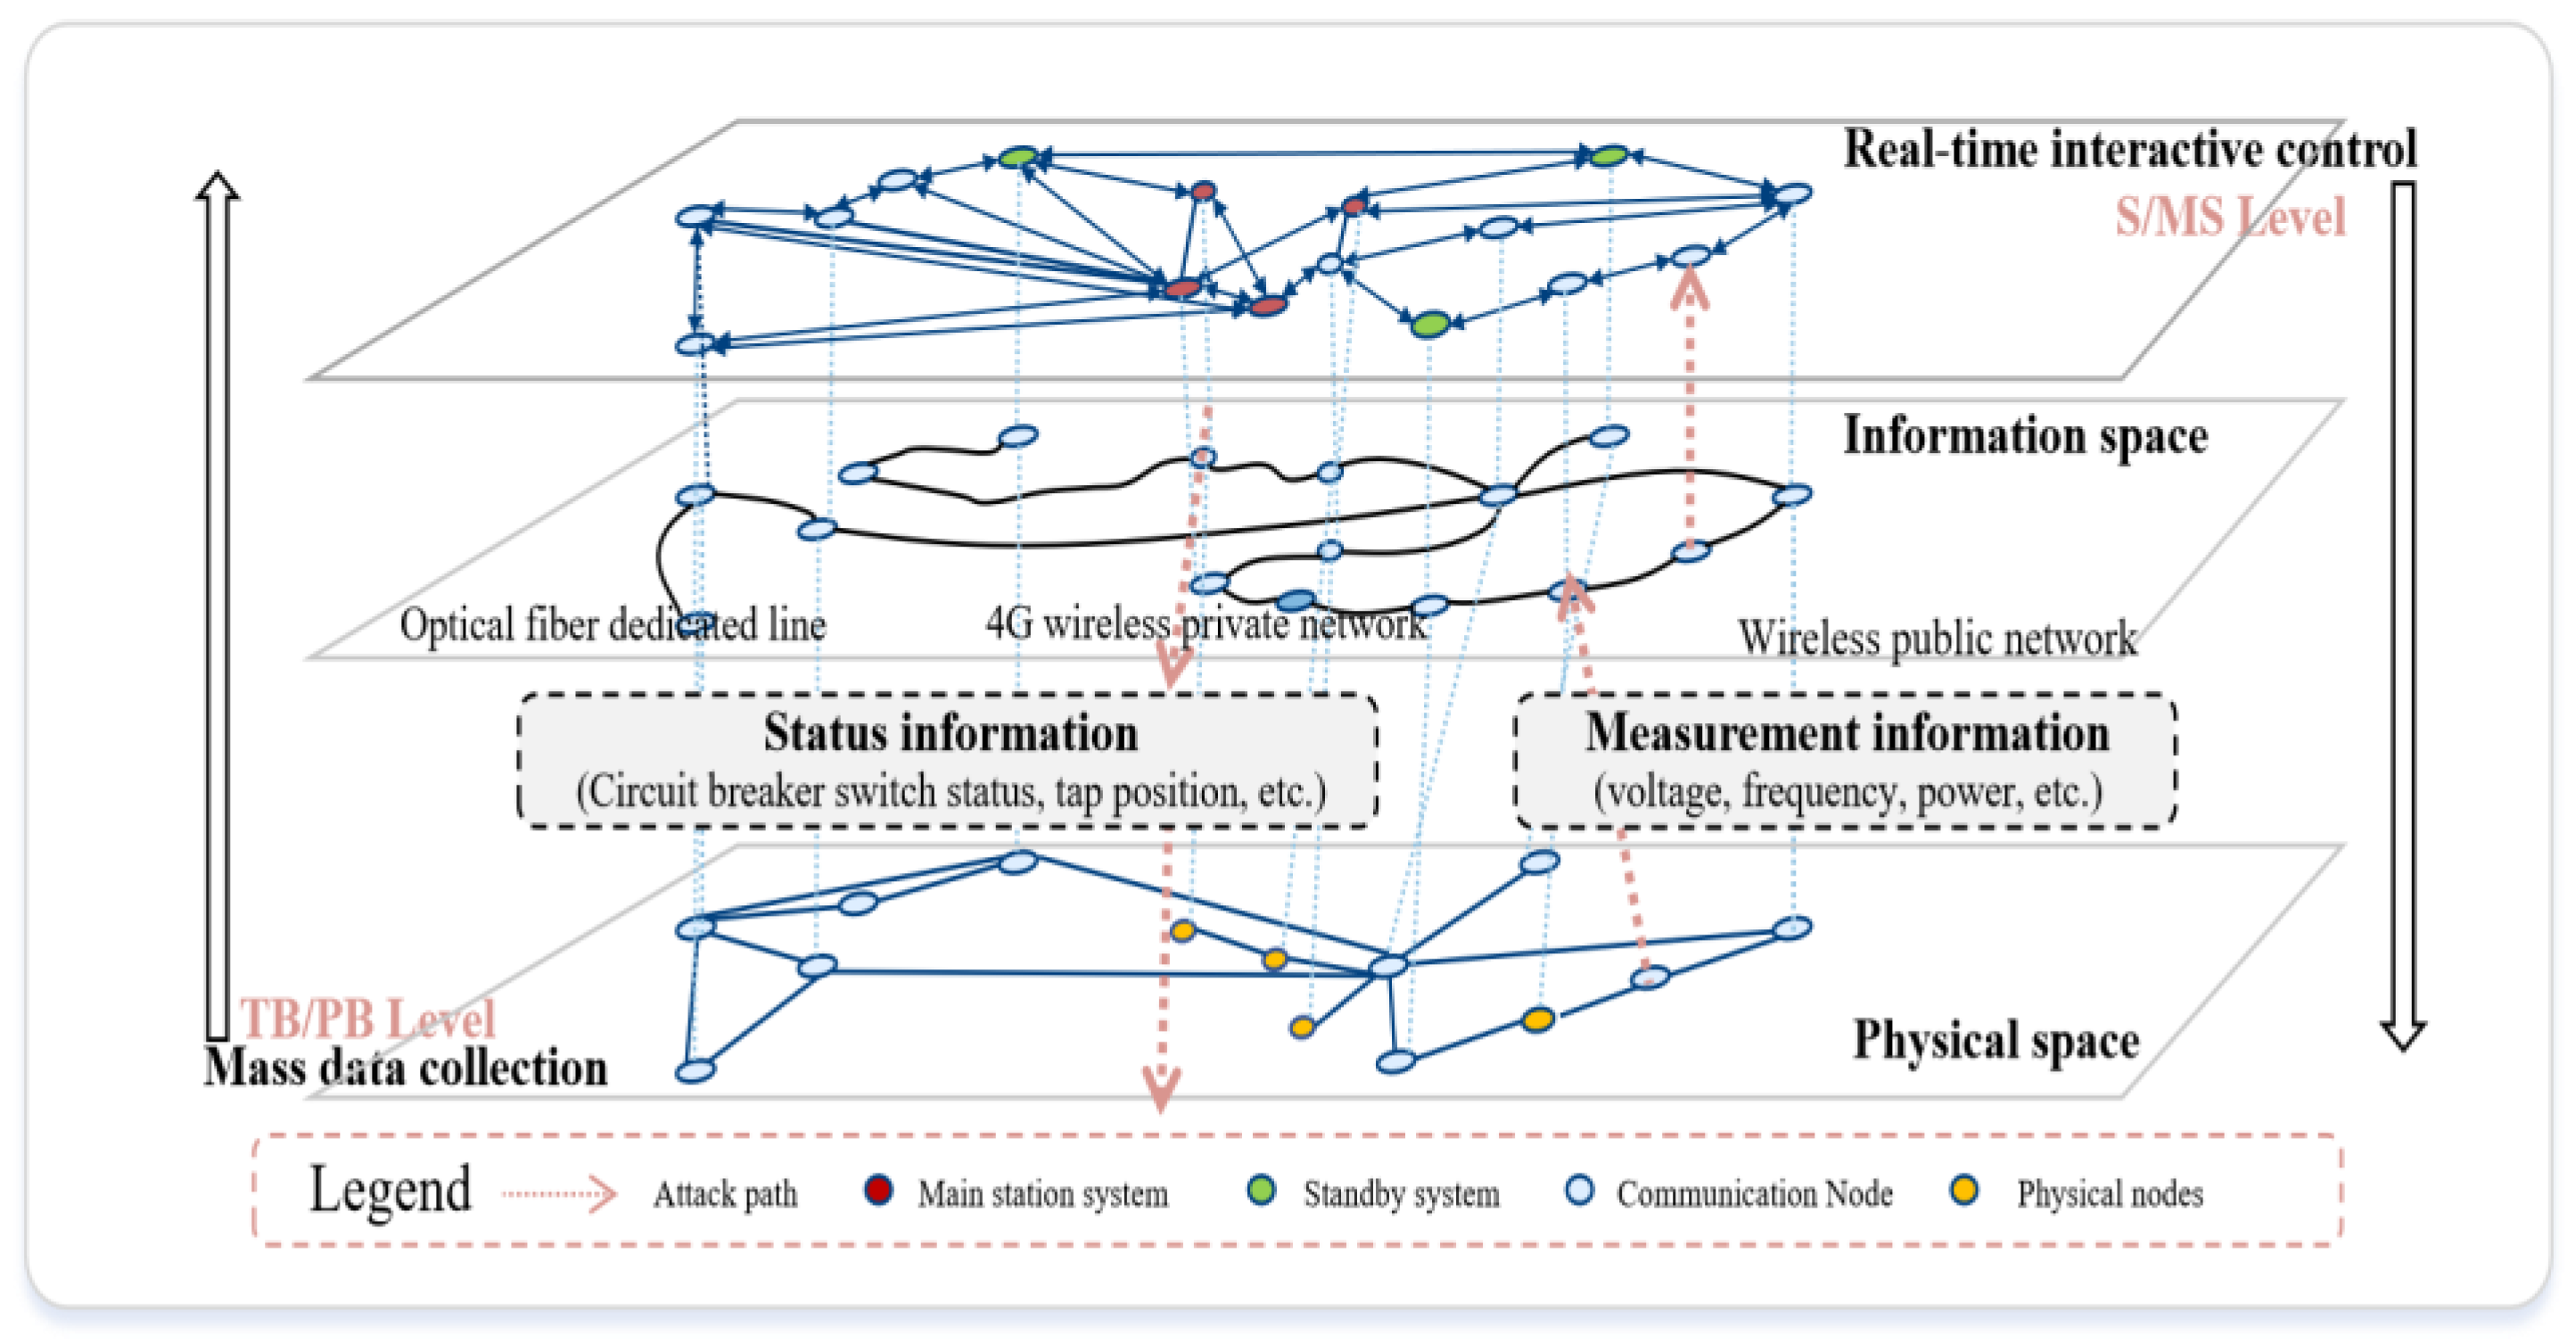
In network security research based on graph knowledge, an attack graph is an important subdivision direction. It plays an important role in intelligent attack and defense confrontation scenarios. The concept of the attack graph originally originated from the attack tree theory proposed by Bruce Schneier [
19], which uses a combination of multiple attack trees to represent the attacks faced by the system. Each root node represents an attack target, and the leaf nodes are specific attack steps. Every directed path from the lowest leaf node to a root node is a feasible attack path. The attack graph can accurately describe the logical relationship between the attack steps and the attack target, which coincides with the strong coupling of business and the temporal causality characteristics of interactive logic in the power cyber-physical convergence system. At the same time, the existing network security protection architecture of the power system is constrained by the principles of security zoning, network-dedicated horizontal isolation, and vertical authentication. The form of the power cyber-physical fusion system presents external autonomy of information space and physical space, intertwined conversion of internal information flow/energy flow, and is composed of the main station layer, channel transmission layer, terminal layer, and physical space entity grid collaborative operation control. Presenting a typical hierarchical structure, as shown in
Figure 2.
3.1. Define the Attack Graph
Existing research lacks consideration of characteristics such as power system cyber-physical coupling degree and business hierarchical structure, and the applicability of quantitative assessment of attack path hazards in power cyber-physical fusion systems is not strong. By introducing quantitative index items, this paper proposes an attack path hazard quantification assessment method that takes into account the business characteristics of the power cyber-physical fusion system and comprehensively considers vertex vulnerability factors, geodesic distances, edge weights, and cyber-physical coupling relationships.
First, define the attack graph based on graph theory knowledge and conduct the following discussion: Assume that in the attack graph G(V,A), . The directed edge set A = {a}, and are the out-degree and in-degree of the vertex v. is the geodesic distance between node i and node j, is the betweenness of node i, and is the betweenness of node j.
, leaf node ⇔ some kind of cyber-physical cross-domain attack, intermediate node ⇔ power secondary equipment node failure and transient stable node disturbance, root node ⇔ attack target.
. , are proportional to the frequency with which vertex v is exploited by various cyber-physical cross-domain attack pathways, and , reflect the importance of nodes i, j in effective attack paths.
Other leaf nodes or intermediate nodes or root nodes => condition 1 and condition 2 are true. The geodesic distance reflects the sum of the minimum edge weights in the attack path. The shorter the geodesic distance, the higher the probability of successful attack.
Condition 1: The triggering condition of a is true. If the setting value of the relay protection device is maliciously tampered with, the protection action may not be triggered. It may lurk in the form of a hidden fault and wait for an opportunity to occur.
Condition 2: The probability that the leaf node itself is true is limited by the business scenario of the attack target and the attack technical conditions. The attack event corresponding to the leaf node does not occur 100%.
Therefore, considering the vulnerability of vertices and the geodesic distance between vertices, the attack graph
can be defined as Formula (1). Assume that the attack graph contains a total of m vertices: V is the set of all vertices, A is the set of all directed edges, the source set X contains all leaf nodes with in-degree 0, and the collection set Y contains all root nodes. C is the vulnerability factor of each vertex, represented by the set
, where
[1, m].
The value of represents the degree of vulnerability of the vertex. The value of is determined by the out-degree, in-degree, betweenness, condition 1 and condition 2 of the vertex . The higher the frequency with which vertex is exploited by the shortest attack path in attack graph , the stronger the vulnerability of vertex and the higher the value.
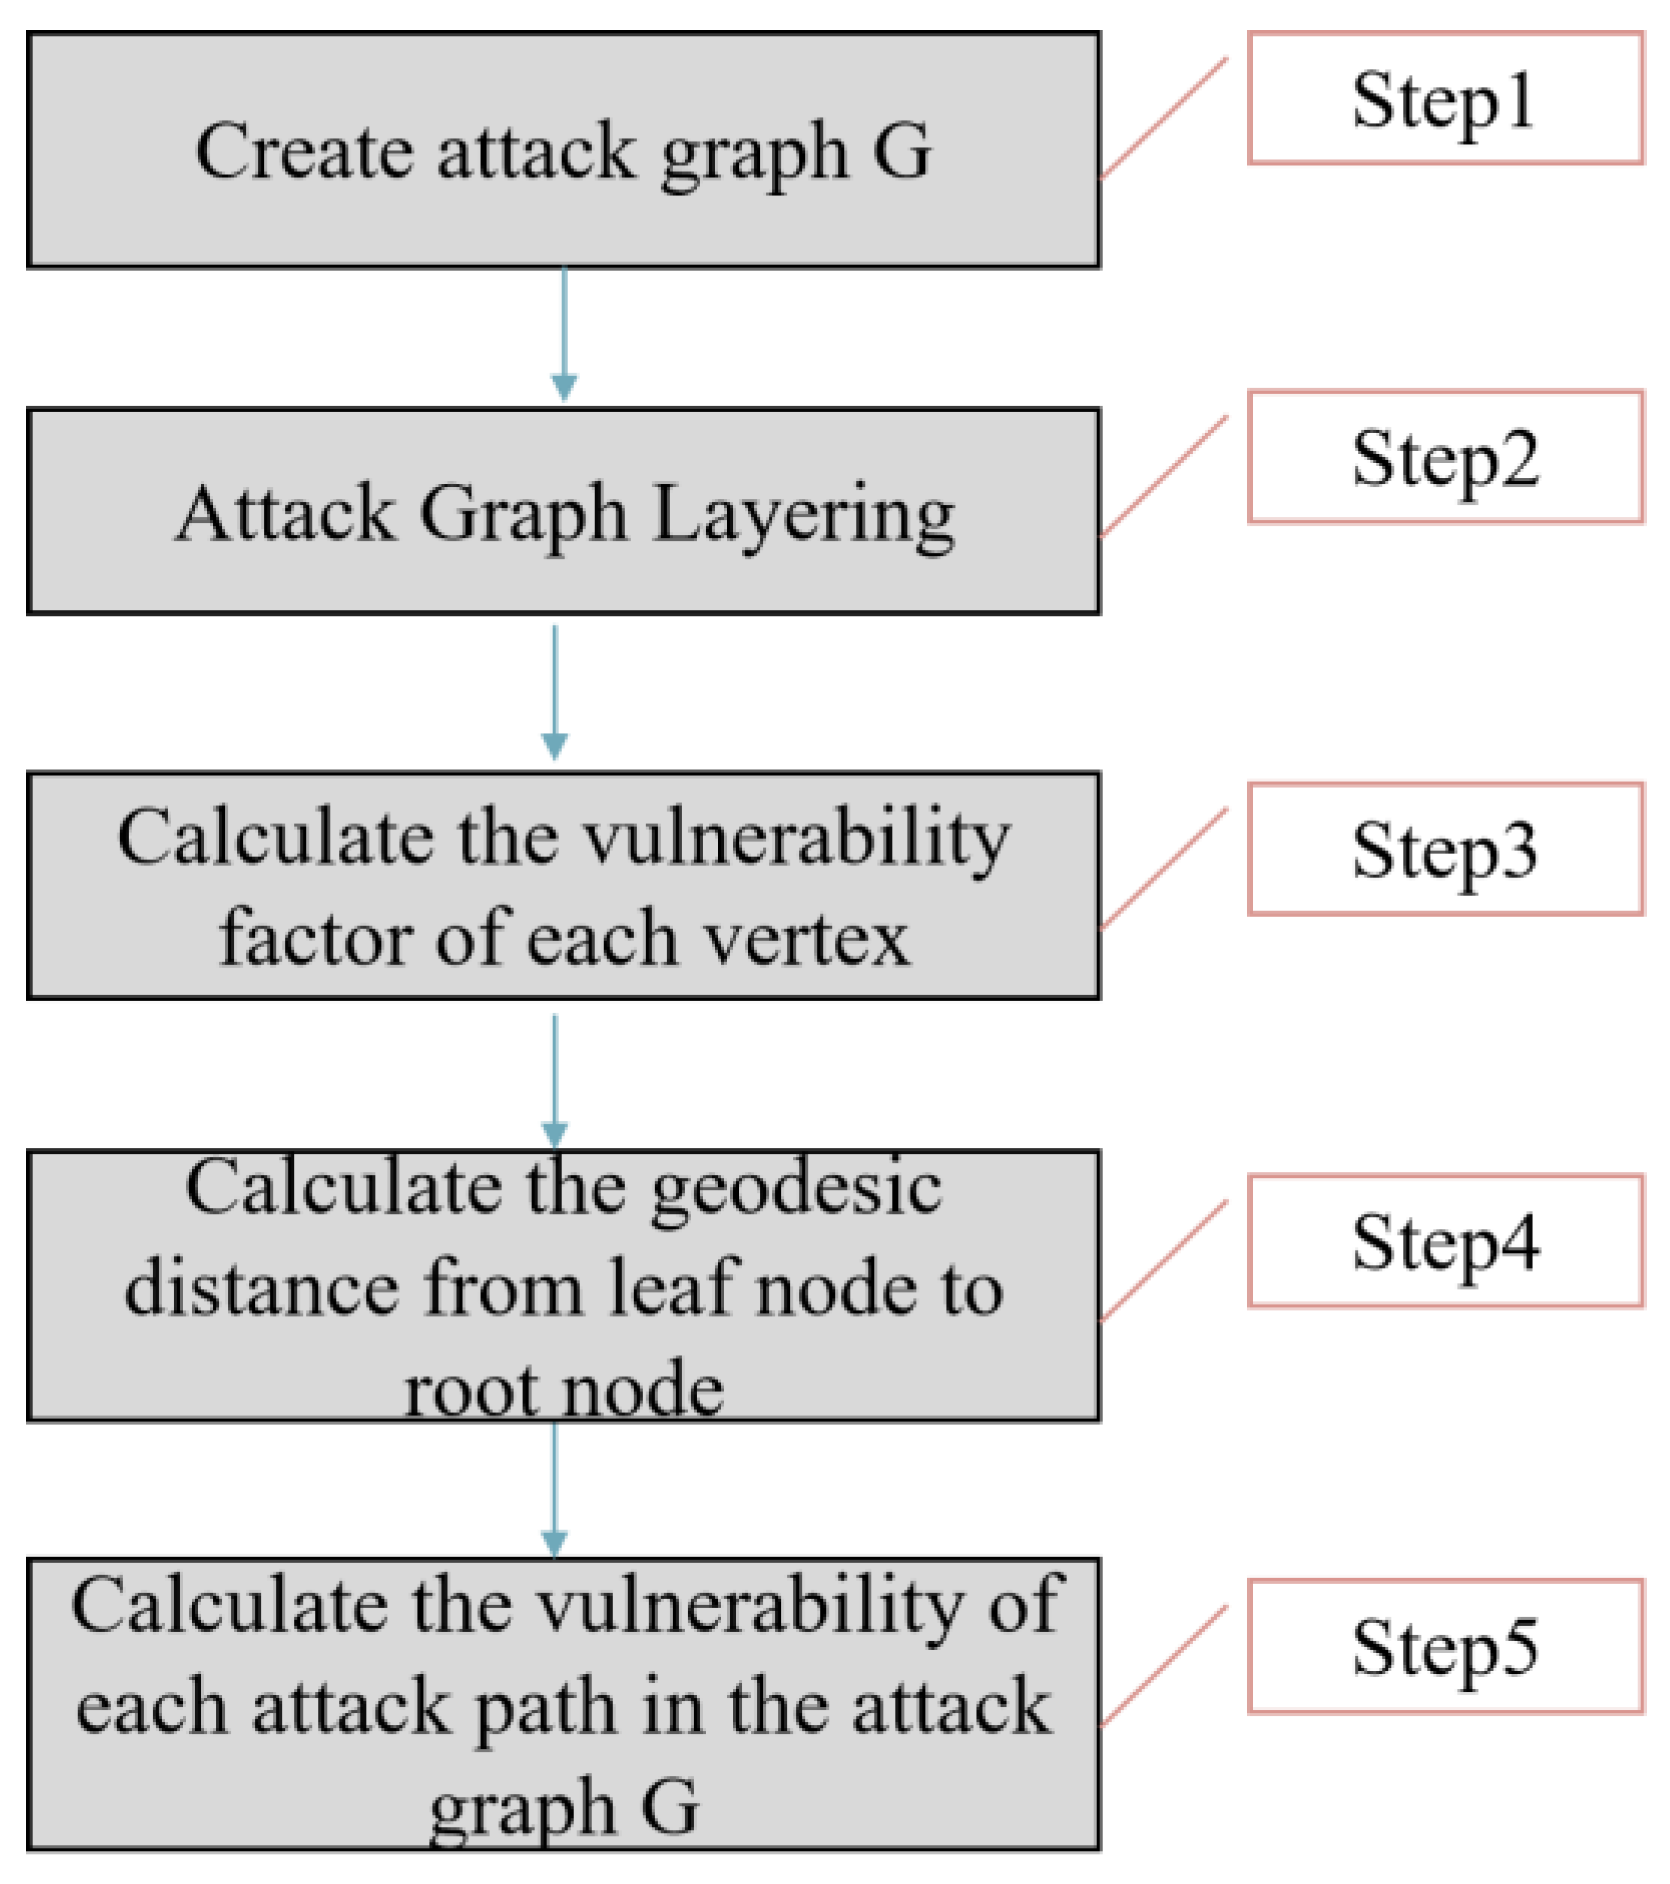
3.2. Attack Graph Building Process
The construction process of the hierarchical attack graph of the power information-physical fusion system is shown in
Figure 3:
Step 1: Create attack graph G. The attack targets are abstracted into root nodes, power secondary equipment node failures and transient stable node disturbances are abstracted into intermediate nodes, and various cyber-physical cross-domain attacks are abstracted into leaf nodes. Then, add all root nodes, intermediate nodes, and leaf nodes to the set V, create all feasible directed edges between each vertex and add them to the set A, and complete the construction of the attack graph G.
Step 2: Attack graph layering. Using the method in [
20], add all leaf nodes with in-degree 0 to the first-level set
,
= X. Traverse all the vertices with directed edges in the set
, and form the second level set L
2 with them. By analogy, the traversal stops at the last layer set
,
= Y, n is the depth of G, and it is specified that the intersection between different layer sets is an empty set.
Step 3: Calculate the vulnerability factor
of each vertex. The vulnerability factor
of vertex
in the l-th layer of the attack graph is jointly determined by the vertex out-degree, in-degree, and node betweenness. As shown in Formula (2),
[1, n].
The meaning and calculation method of each variable in Formula (2) are explained as follows:
Step 4: Calculate the geodesic distance from the leaf node to the target root node. To calculate the geodesic distance between two vertices, you first need to define the edge weights in the attack directed graph. Due to the hierarchical algorithm of the attack graph, in the layer, the weights of the directed edges connecting leaf nodes representing various cyber-physical cross-domain attack types are consistent with the occurrence probabilities of various attack types. For the calculation method, please refer to step 3. The directed edge weights between vertices such as control master station, measurement and control equipment failure, transient stable node disturbance, etc., can be determined in the following way:
First, give the definition of edge weights. Let represent the weight of the directed edge. Among them, corresponds to the directed edge , which refers to the one-step transition probability from the previous node to the current node, indicating the probability of the current node occurring when the previous state satisfies the conditions, which is called the previous transition probability. corresponds to the directed edge , which represents the probability that the current node reaches the subsequent node state, which is called the posterior transition probability here.
Therefore, from the definition of edge weights in (1), it can be seen that in the attack graph of the power cyber-physical fusion system, the pre-transition probability of the leaf nodes representing various cyber-physical cross-domain attacks is consistent with the probability of occurrence of various attacks. The weight of the edge connected to the root node representing the attack target is consistent with the post-transition probability of the preceding node. The weight of the edge connected to the intermediate vertex is determined by the forward and backward transition probabilities of the vertex.
Let the element
be the weight of the directed edge
= (
), which represents the probability of node
occurring if node
is satisfied,
. The pre-transition probability and the post-transition probability of the edges connected to intermediate nodes such as control master station, measurement and control equipment failure, transient stable node disturbance, etc., will be affected by factors such as the node’s own functional attribute GN, the scene attribute CJ, and the edge JO between cyber-physical networks. The influence can be used as the basis for determining the weight value
of the directed edge.The directed edge weight can be defined as Formula (6).
In actual business scenarios, state transfer between nodes is often caused by network congestion, jitter, system failure, and other factors. For example, the operating status of the physical system due to network congestion cannot be monitored in real time, causing the control master station to issue incorrect operation instructions. The state transition between nodes caused by such factors can be determined based on statistical analysis of historical fault types. The state transition probability between nodes determined in this article is as shown in
Table 1 below.
Step 5: Calculate the vulnerability of each attack path in the attack graph G. Traverse each attack path in G, and calculate the product of the vulnerability factor and the edge weight of each vertex it contains. The higher the result, the more harmful the attack path is.
3.3. Cascading Failure Analysis
In the traditional sense, cascading failure refers to any unexpected event that triggers system components to continuously exit operation without control [
22]. Its main feature is that there is a causal relationship between the fault events in the time sequence. However, with the advancement of digital technology and the transformation of the energy system, the source, grid, load, and storage of the new power system are coordinated and interactive, the dynamic interaction of information flow and energy flow is frequent, and the cyber-physical space coupling is enhanced. Attackers can launch cyber-physical cross-domain attacks to trigger a series of spatiotemporally coordinated power failures on multiple power nodes, forming a cascading failure across the information domain and power domain, destroying the stable operation of the power system. The authors of [
23] give the definition of cross-domain cascading failures.
Definition 1. The attacker launches a network attack against a certain information space node of the electric power cyber-physical fusion system, and uses the coupling characteristics of the cyber-physical fusion system to destroy the operation of the secondary power system. This causes disturbances or cascading failures in the power primary system, and ultimately forms a sequence of attack behaviors spanning the information domain and the physical domain.
Definition 2. The attack path refers to the attack sequence composed of the state nodes and action nodes in the probabilistic attack graph arranged according to a certain causal dependency relationship, recorded as path(s0, g) = {s0, a1, si, aj, …, g}. Among them, represents the attack state transfer sequence and represents the atomic attack behavior sequence. The probabilistic attack graph is a set containing multiple attack paths; that is, . Among them, represents the attack path numbered k from the initial state to the termination state g of .
Therefore, from the definitions of cascading faults and attack paths, it can be seen that cascading fault attack sequences and attack paths across the cyber-physical space have equivalent characteristics. For the convenience of analysis, this article uses cascading failures as attack paths to analyze subsequent chapters.
On the one hand, electric power physical nodes such as power stations and substations need to provide energy flow to the information space system to provide operational support. On the other hand, information nodes such as control systems and measurement and control terminals need to provide information flows to the power system to achieve control. This paper uses the load-capacity model proposed by Motter et al. to analyze the cascading failures of power systems caused by cyber-physical cross-domain attacks [
24]. The load of a node is the cumulative sum of the shortest paths through the node, and its capacity is in a fixed proportion to the initial node load, defined as Formula (7):
where
is the tolerance constant,
is the initial load value of node/edge i in the physical node of the power system. When a node in the power system fails, the topology of the system changes, so the load value in the system needs to be recalculated. If the load value of a node exceeds its capacity, the node fails and is removed. This process continues until the load values of all nodes are lower than their capacities, allowing the power network to achieve a new transient stability.
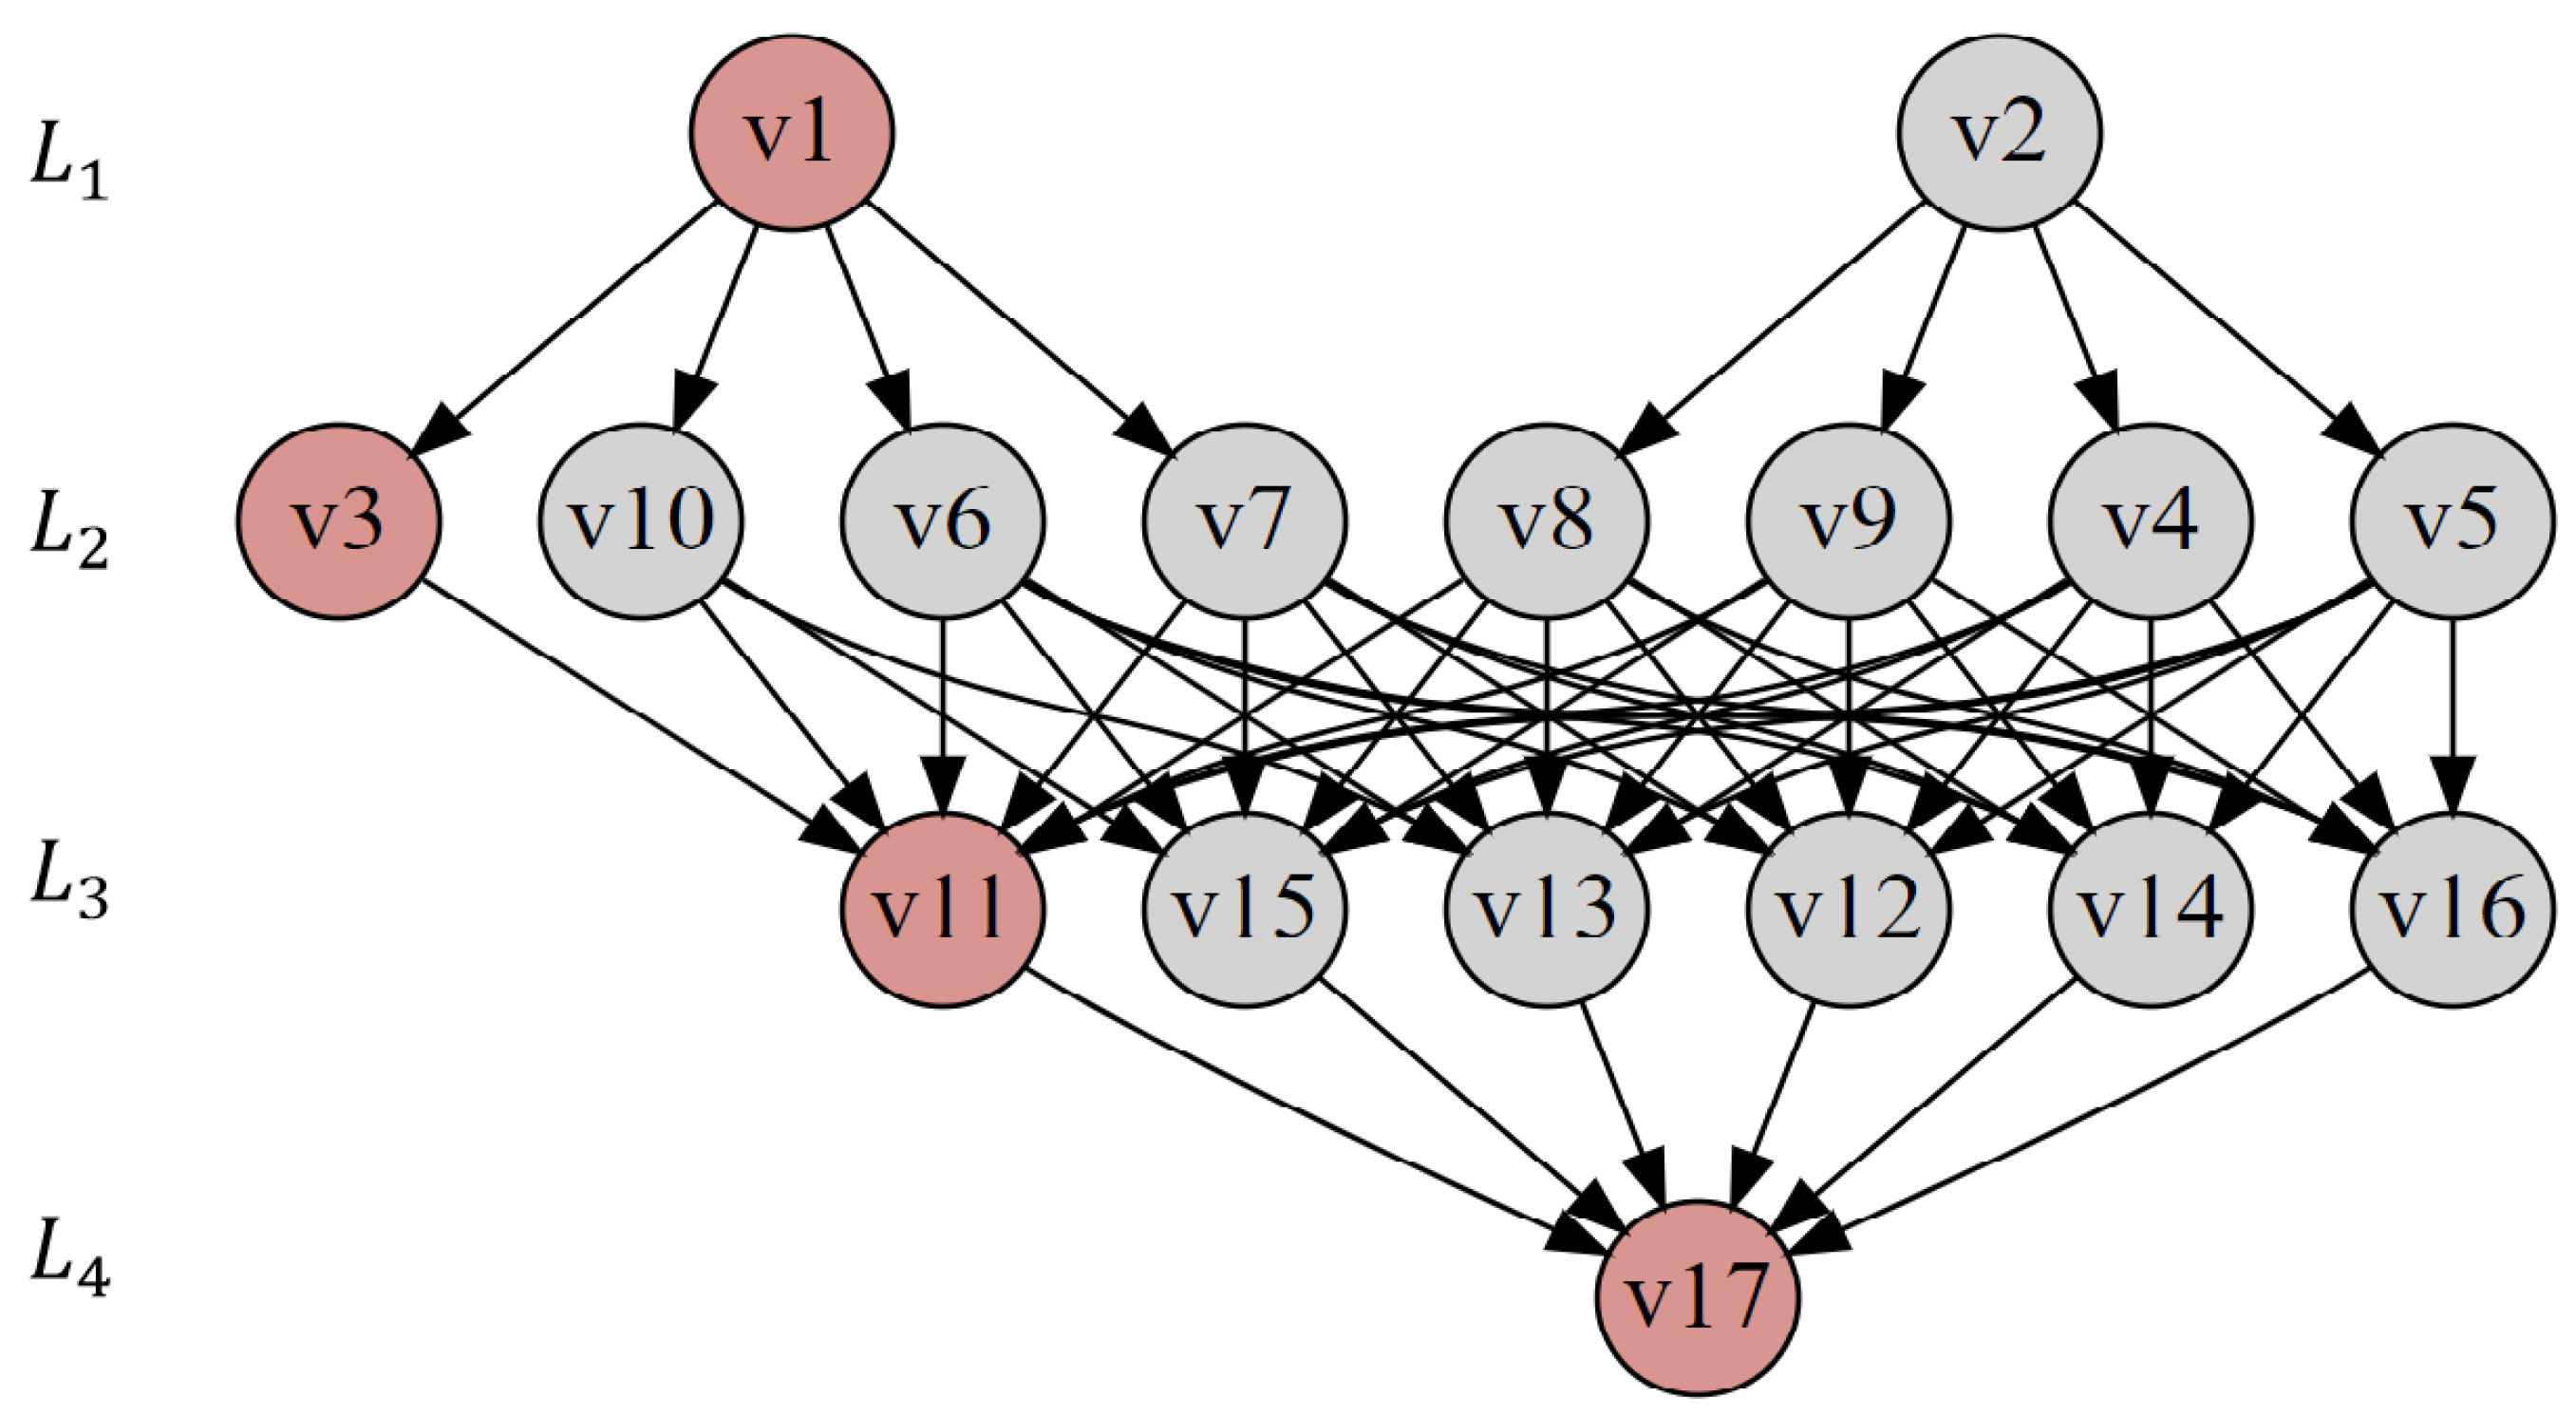
In
Figure 4, the path v1-v3-v11-v17 is a typical cascading failure across the cyber-physical space, and its implicit form is an effective attack path expected by the network attack initiator.
Table 2 shows the corresponding relationship between vertex objects at each level in the hierarchical attack graph of the power cyber-physical fusion system.
3.4. Cascading Fault Vulnerability Assessment Indicators
When the transient stable nodes are disturbed, some physical space nodes will fail. Therefore, after topological analysis of the physical space power grid and AC power flow analysis and calculation, it is necessary to detect the edge capacity of the physical space power grid. During this period, overloaded edges will cause protection actions and be removed. At the same time, if the power flow convergence fails, it means that the generators in the physical space power grid working subset node network cannot meet the initial load demand, and load shedding optimization operations need to be performed. The objective function and constraint conditions of the load shedding optimization operation are shown in Formulas (8) and (9).
Therefore, the vulnerability assessment index of power physical space cascading faults in this paper is composed of two factors: topological integrity and information physical layer operating characteristics. The power network topology integrity coefficient is the proportion of physical layer cascading failure nodes to the total nodes after being attacked by cyber-physical cross-domain attacks; the power grid physical layer operating characteristic coefficient is expressed by the load shedding ratio, which reflects the degree to which the power grid meets the needs of power users. Therefore, the cascading fault vulnerability assessment coefficient of the power cyber-physical fusion system in this paper is shown in Formula (10).
In the formula, is the total number of physical layer nodes, i is the iteration number of cascading failures, is the betweenness of the physical layer connected network. T is the total load shedding amount after the cascading fault ends, j is the complete set of physical layer power grid nodes, and is the total system load before the power grid failure. The abovementioned power network topology changes, load shedding ratio, etc., all have an impact on the overall system load rate, line average load rate, and line load fluctuation coefficient of the power cyber-physical integration system.
3.5. Attack Path Hazard Assessment
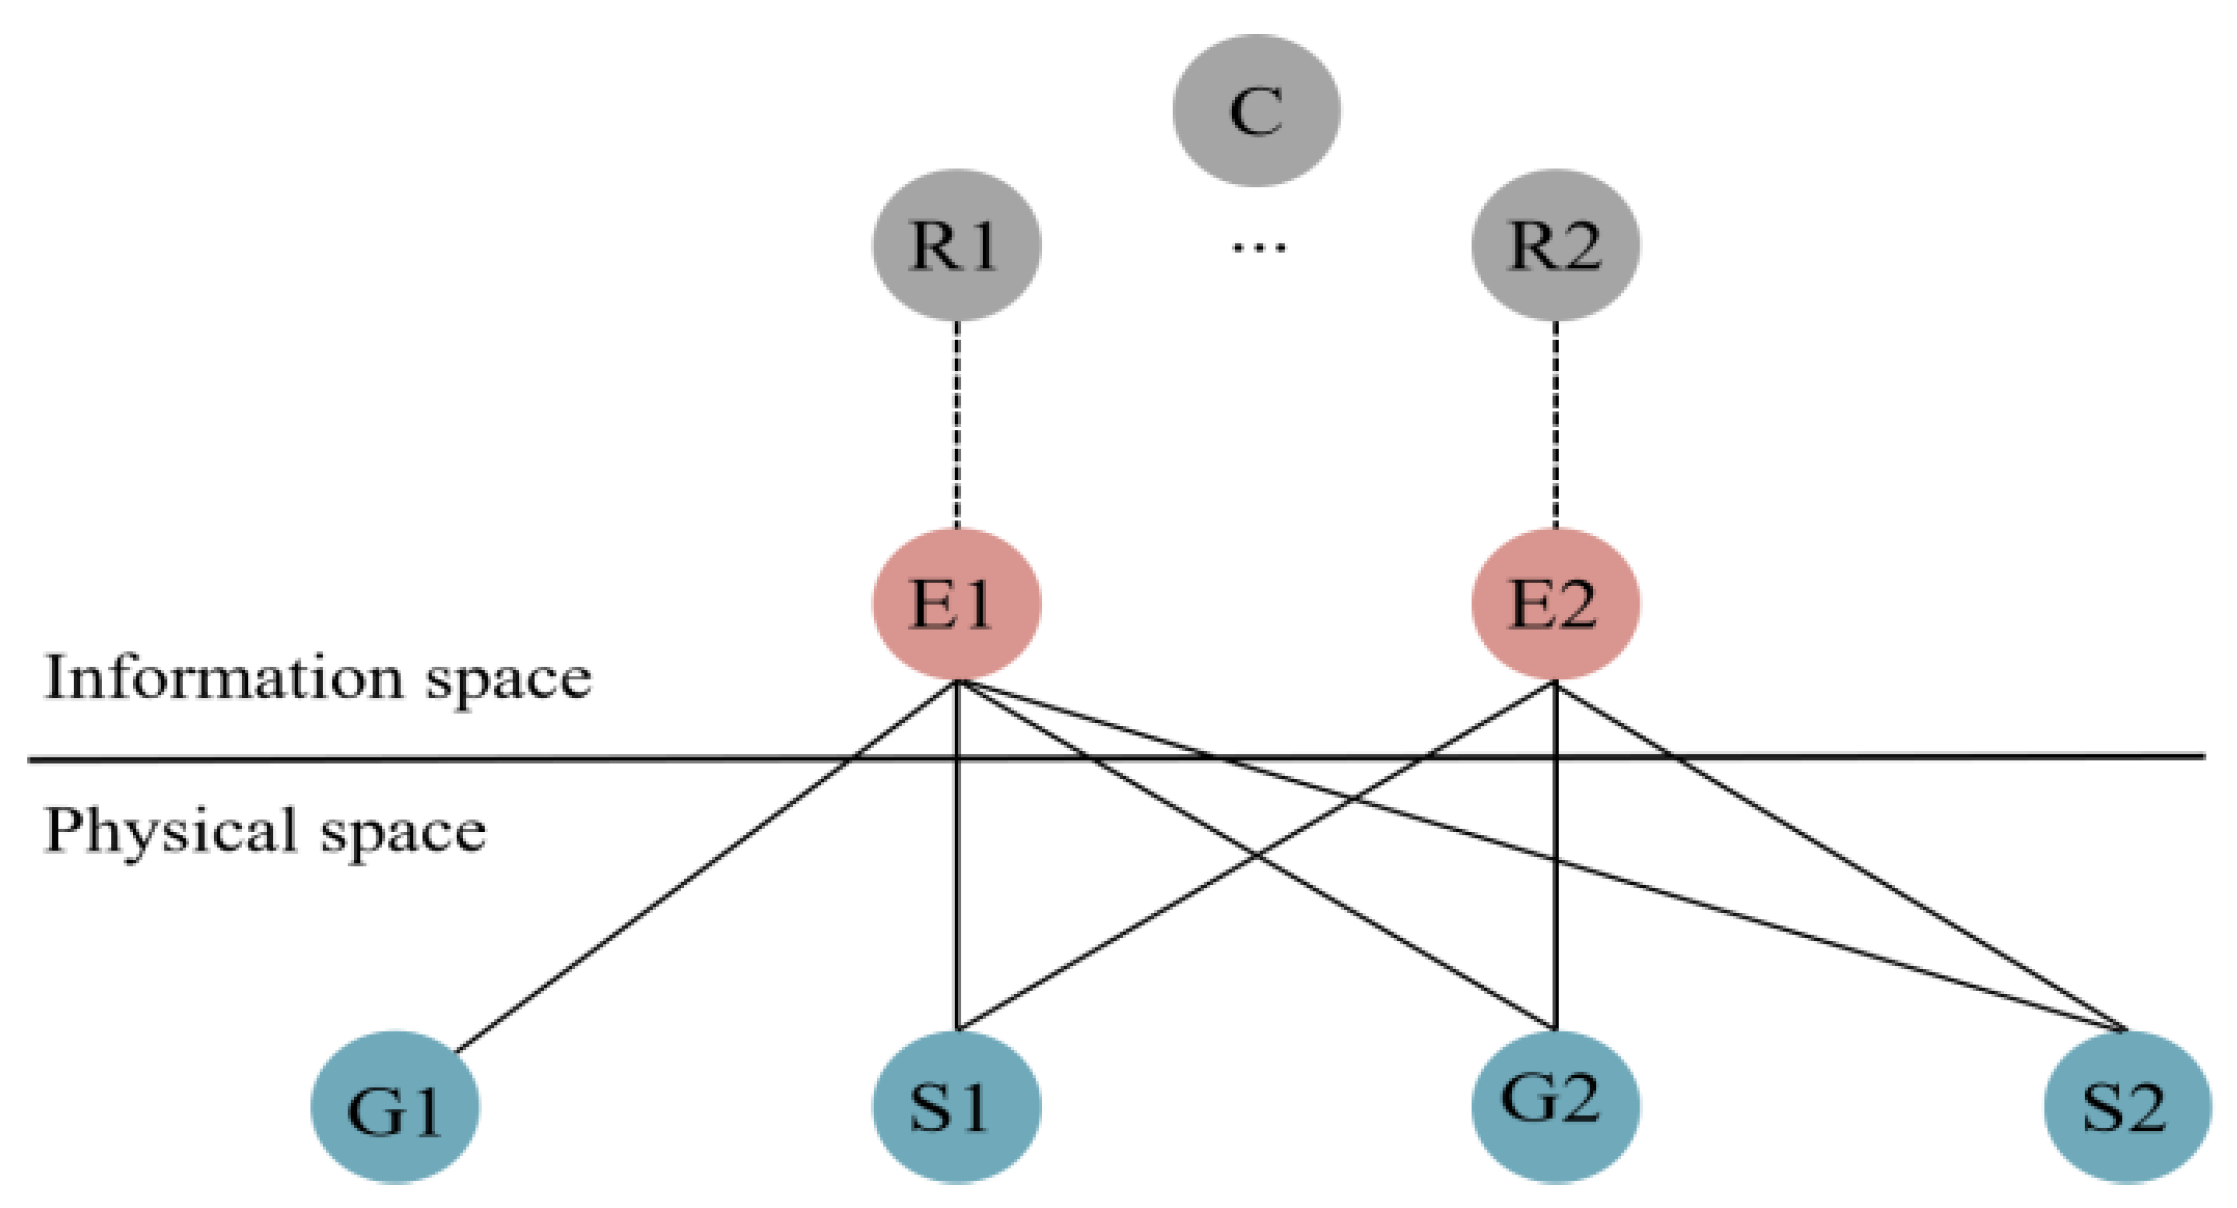
The out-degree, in-degree, betweenness, vulnerability factor, etc., of the attack graph vertices have been defined in the previous chapters of the article. However, it is still necessary to consider the influence of factors such as the node’s own functional attribute GN, the scene attribute CJ, and the connection edge JO between cyber-physical networks in the calculation of the attack graph edge weight, in order to facilitate the analysis of the coupling characteristics between heterogeneous networks in the power cyber-physical fusion system. Therefore, before assessing the hazards of the attack path, it is first necessary to define the coupling characteristics of the cyber-physical network of the power system. Chen et al. believe that the probability of successful transmission of information system control signals across space to the physical space of the power system depends on the mutual coupling relationship between the router nodes in the information system and the generator and transformer nodes in the power system [
15]. However, due to the vertical encryption device deployed in the grid boundary network security protection architecture, the real-time vertical encryption device then transparently forwards control messages through the switch to the connected physical space power plants and substations. Therefore, the node sinking of the source and network interaction changes into the coupling relationship between the vertical encryption device and the physical space of the power system. Normally, vertical encryption devices appear in pairs. Therefore, in order to fully consider the current constraints of network security protection in actual business scenarios, the coupling relationship between networks is defined here as shown in Formula (11):
Among them, is the inter-network degree of node i, and the inter-network degree of node i reflects the number of inter-network edges connecting the information space real-time longitudinal encryption device to the physical space node i. The set of edges connecting the real-time longitudinal encryption device and the node i in the physical space is denoted as , and the set of edges connecting the power station/substation node to the node m in the information space is denoted .
As shown in
Figure 5, the inter-network coupling relationship between the real-time longitudinal encryption device E1 and the power plant G2, that is, the probability of the control signal E1 → G2, can be characterized by Formula (12).
Among these, = {E1,E2}, = {G1,S1,G2,S2}, = {S1,G2,S2}. The probability that cyber-physical cross-domain attack risks are transmitted to the physical space through real-time vertical encryption device nodes can be calculated by Formula (12). Therefore, the edge weight between the L3 and L4 layer vertices of the attack graph is strongly related to the degree of coupling between networks.
This article focuses on the impact assessment on the main network in the study of attack path hazard assessment of power cyber-physical fusion systems. The cascading failure of the power grid’s physical space system caused by information space security risks transmitted to the physical space through the attack path is an important reference indicator to measure the damage of the attack path. In order to simplify the construction process of the attack graph, a hierarchical attack graph is constructed using cyber-physical cross-domain attack types, power secondary equipment failures, transient stable node disturbances, etc., as vertices. The attack graph is a directed acyclic graph with a depth of 4. The calculation of the vertex vulnerability factor can be calculated according to (2)–(5). It can be seen from the literature [
24] that the current operating status of the power system determines whether security risks can be transmitted across the cyber-physical space by attack paths. Therefore, according to Formula (5), the unsteady state probability p1 of the power system can be set to p, and the steady state probability p2 is 1-p. In addition,
and
are obtained from the adjacency matrix A(G), T(L1) is 2, T(L2) is 8, T(L3) is 6, and T(L4) is 1. Finally, the vulnerability factor of each vertex is obtained by Formula (2).
The harm of each attack path is calculated based on the edge weight definition in
Table 1, the vertex vulnerability factor and the coupling degree between cyber-physical networks in
Table 3. At the same time, it is also necessary to consider the actual impact of transiently stable nodes on physical space and the coupling relationship between cyber-physical networks. Therefore, the calculation results of the damage degree of each attack path are shown in
Table 4.
4. Experimental Simulation Analysis
This article uses IEEE-RTS79 and IEEE-RTS96 system models to carry out experimental simulation analysis. The IEEE RTS79 and RTS96 systems are power system reliability testing systems that can simulate the physical power grid in physical space and are commonly used to analyze, test, and evaluate the reliability of power systems. This paper used this system to verify the impact of attack risks on the operation of the power grid’s physical space system after being propagated across space via cyber-physical cross-domain attack paths. The IEEE-RTS79 system consists of a total of 24 nodes and 38 transmission lines, with 32 conventional generating units and a total installed capacity of 3405 MW. The load data is a time series curve composed of the hourly average load, the peak load is 2850 MW, and the load demand of each node is completely positively correlated [
25]. The remaining necessary parameters and IEEE-RTS96 system parameters can be directly obtained by consulting the literature [
26,
27,
28]. At the same time, in order to describe the operating status of the power grid physical space system, the system load rate, line average load rate, and line load fluctuation coefficient are respectively defined as Formulas (13)–(15).
In the formula,
is the current active load of the system,
is the maximum historical statistical active load of the system (the value of the example system is 2850 MW),
is the initial transmission power of branch i, and
is the line set. By evaluating the harm degree of the attack path conduction risk across the cyber-physical space, the effectiveness of the power cyber-physical cross-domain attack path harm assessment method based on graph knowledge is verified. As shown in the following
Table 5.
It can be seen from
Table 6 that each attack path conducts security risks across the cyber-physical space and can cause cascading failures of the power physical system. At the same time, the risk of attack paths propagating across space is related to the load rate of the power system, the average load rate of the line, and the line load fluctuation coefficient. When the system load rate is low, the three attack paths <v1,v10,v11,v17>, <v2,v5,v12,v17>, and <v2,v8,v15,v17> have very little load loss. The risk of cascading failure in the physical space system of the power grid is low. As the system load rate increases, the average line load rate and the line load fluctuation coefficient are important factors to measure the impact of each attack path on the cascading failure of the power grid’s physical space system. When the average load ratio of the line is 0.236, 0.246, and 0.319, the load loss of the physical space system of the power grid caused by the cross-space conduction of security risks through the attack path is small. The possibility of cascading failures in the physical space system of the power grid is unlikely. When the system load ratio is 0.787, 0.879, and 0.96, due to the large line load fluctuation coefficient, security risks are transmitted across space through various attack paths, causing high load losses in the physical space system of the power grid. Cyber-physical cross-domain attacks increase the possibility of cascading failures in the power grid’s physical space system. When the system load factor has little difference and takes values of 0.879 and 0.96, the average load factor of the line is 0.39 and 0.436, and the line load fluctuation coefficient is 1.6387 and 1.427. When the system load rate is relatively consistent, the average load rate of the line has a greater impact on the load loss of the power grid physical system caused by the cross-space propagation of security risks through various attack paths than the fluctuation coefficient of the line. The risk of cascading failures in the physical space system of the power grid caused by attacks is also relatively high.
After the risk of cyber-physical cross-domain attacks is transmitted across space through various attack paths, the risk of cascading failures caused by different operating statuses of the power grid’s physical space system is also completely different. For example, when the system load ratio is 0.375 or 0.467, attack path 1 <v1,v10,v11,v17> has the largest load loss and the highest risk of cascading failures. It can be seen that after the protection equipment suffers a cyber-physical cross-domain attack, the risk of cascading failure caused by the failure of the power grid’s physical space system to respond to switching/speculative operation instructions in a timely manner is the greatest. As the system load rate increases, for example, when the system load rate is 0.525, 0.617, and 0.689, the load loss of attack path 3 <v2,v8,v15,v17> is the highest. That is, at this stage, the protection equipment settings are maliciously tampered with, and the risk of cascading failures caused by misoperation or refusal to operate the load switching operation is the greatest. When the system load rate continues to increase, for example, when the system load rate is 1.4478 or 1.6387, the attack path 2 <v2,v5,v12,v17> has the highest load loss. The attack causes the control device to issue wrong instructions, causing the power regulation parameters to be maliciously changed, resulting in the greatest risk of cascading failures.
When the IEEE-RTS79 system is used as the simulation analysis of the power grid physical space system,
Figure 6 and
Figure 7 show the load loss and cascading failure probability of the power grid physical space system obtained when the system load rate is 0.6896 and 0.879. It reflects the relationship between the loss of load of the power grid’s physical space system and the probability of cascading failure of the physical space system caused by the risk of cyber-physical cross-domain attacks transmitted across space through typical attack paths. The polyline in the log-log plot is the trend given by the simulation data. The following two conclusions can be drawn from the simulation results:
When the system load rate is low, such as 0.6896, as shown in
Figure 6, the overall cascading fault scale distribution of the power grid physical space system presents the characteristics of a ladder distribution. When a cascading failure of the same scale occurs in the physical space system of the power grid, the cyber-physical cross-domain attack risk is transmitted through the attack path 3 <v2,v8,v15,v17>, and the resulting loss of load in the physical space system of the power grid plays a dominant role.
When the system load rate is high, such as 0.879, as shown in
Figure 7 and
Figure 8, under the same system load rate, the physical space system load loss situation tends to be consistent. After cyber-physical cross-domain attack risks are transmitted across space through different attack paths, the probability of causing cascading failures of the same scale is basically the same. The figure shows that there are jump points at the end of the power grid physical space system load loss distribution chart, indicating that when the cascading failure of the physical space system develops to a certain scale, the entire network will collapse. This is determined by the network scale and structure of the system. For this simulation system, the internal lines and transmission sections of the two interconnected subsystems will be affected by the disconnection of certain lines, causing a large-scale collapse of the power physical system.
By simulating more than 1000 cascading failure modes caused by cross-space propagation of cyber-physical cross-domain attack risks under typical attack paths, the number of interruptions of the power grid’s physical space system lines under each cascading failure mode was obtained. Only the top 10 disconnected lines are shown here. From this, we can obtain some lines that are strongly related to the load loss of the power grid’s physical space system caused by the risk conduction through typical cyber-physical cross-domain attack paths. It can be seen from
Table 7 that the transmission section of the two interconnected subsystems is prone to major power outages. After cyber-physical cross-domain attack risks are transmitted through each attack path, the system load loss and the line with the highest number of line interruptions are also slightly different.
In order to verify the impact of risks propagating across space through various attack paths in a larger-scale system, the IEEE-RTS96 system model was selected to carry out further simulation analysis. After the cyber-physical cross-domain attack risk is transmitted through three typical attack paths, the log-log plot of the system load loss probability is shown in
Figure 9 below. It can be seen from the figure that when the scale of the power physical space system is large, the system load loss distribution has the characteristics of approximate exponential distribution. Therefore, it can be seen from the experimental simulation results of this article that when the scale of the power physical space system is small, the risk is transmitted through attack path 1, resulting in a high proportion of system load loss, and there is discontinuous load removal amount, showing the characteristics of step distribution. When the scale of the power grid physical space system is large, the system load loss characteristics have the characteristics of approximate exponential distribution.
5. Discussion
This paper proposes a quantitative analysis method for the impact of power cyber-physics cross-domain attack paths based on graph knowledge. It solves the problem of constructing a hierarchical attack graph for power cyber-physics fusion systems and quantitatively analyzing the risks of power information coupling systems after being conducted through each attack path. There are issues such as the assessment of the hazards of the operation of the space physical power grid system, but there are also shortcomings in the following three aspects. The first is the insufficient consideration of unexpected variables during the quantitative analysis of attack path risks. For example, factors such as the complex interactions and dependencies between various attack vectors, cumulative effects or potential amplification effects during vulnerability exploitation are ignored. At the same time, when calculating the transition probability of intermediate nodes, by summarizing the corresponding relationships of each node in the power information physical space, estimate and assign the probability of success of fixed value tampering attacks against power-specific measurement and control terminals, etc. This calculation idea also has certain subjective experience judgment problems. Second, the combination of the evolution path of the impact of the physical power grid in the physical space of the power grid and graph theory has not yet been clarified. When the cyberattack launched in the information space directly acts on the physical power grid object in the physical space, two types of paths are involved. One is the attack path composed of the nodes in the information space. The other is the risk evolution path formed in the physical power grid in the physical space after the risk of the cyberattack is transmitted across space. This paper only focuses on the quantitative assessment of the risk transmission of the attack path composed of the nodes in the information space of this kind of information-physical cross-domain attack. The load loss of the nodes and lines in the physical space only supports the effectiveness verification of the above method. Third, the verification simulation analysis of the method needs to be optimized on the existing basis. The existing visualization method can show the impact of typical attack risks on the physical power grid after they are transmitted across space, but it is not intuitive enough. At the same time, the method proposed in this paper is only compared in terms of technical principles, and lacks comparison in dimensions such as the time complexity of the method.
Therefore, we will focus on solving the above shortcomings in future work. One of the important research directions is to draw on the idea of the automatic attack graph, which can describe the specific steps that attackers may take when penetrating the power network or carrying out cyber-physical cross-domain attacks from the attacker’s perspective. On the basis of fully considering the real attack and defense confrontation process, the hierarchical idea from the business perspective of the power cyber-physical fusion system is taken into account to establish a hierarchical attack graph. The second is to fully consider the completeness of the impact of interference factors, the complex interactions and dependencies between various attack vectors, and the cumulative effect or potential amplification effect in the vulnerability exploitation process during the risk quantification analysis of the cross-domain attack path of the power cyber-physical fusion system. factors. The third is to fully demonstrate the verification analysis of the method, such as the impact of network attack risks on the operating frequency of the power grid after being transmitted through each attack path of power cyber-physical cross-domain attacks, etc., use a new visualization method to show the difference between this method and existing methods, and carry out technical comparative analysis of factors such as time complexity, etc.
6. Conclusions
Based on an in-depth understanding of the business architecture and network security protection architecture of the electric power cyber-physical integration system, this article comprehensively sorts out the causal logical relationships between the nodes of the cyber-physical cross-domain attack risk transmission link. A general attack graph hierarchical construction model that takes into account the characteristics of the hierarchical architecture of the cyber-physical fusion system is given, and the attack path of the electric power cyber-physical fusion system is comprehensively described. The proposed quantitative analysis method of cross-domain attack paths in power cyber-physical fusion systems comprehensively considers characteristics such as vertex vulnerability factors, geodesic distances, edge weights, and coupling relationships between cyber-physical networks. It overcomes the shortcomings of existing research methods that focus on qualitative analysis and the lack of consideration of actual business scenarios in quantitative analysis. On the basis of intuitively revealing the objective law of the impact of information space risks on the operating status of physical space systems after being propagated across space through attack paths, the content of existing research has been further expanded. The operating status of the system is described by defining the system load rate, line average load rate, and line load fluctuation coefficient, and numerical simulation is used to conduct a quantitative analysis of the degree of risk conduction across space in typical attack paths, verifying the effectiveness of the proposed method. Looking into the future, based on the in-depth research and optimization of the method proposed in this paper, we will further propose attack detection schemes and defense strategies that take into account the degree of harm of cross-domain attack paths of power information and physics to ensure the safe and reliable operation of the power information and physical fusion system.


