Article

Lifting Activities Assessment Using Lumbosacral Compression and Shear Forces

1
Department of Occupational and Environmental Medicine, Epidemiology and Hygiene, INAIL, Via Fontana Candida 1, Monte Porzio Catone, 00078 Rome, Italy
2
Department of Medical and Surgical Sciences and Biotechnologies, Sapienza University of Rome, Polo Pontino, Via Franco Faggiana 1668, 04100 Latina, Italy
*
Author to whom correspondence should be addressed.
Appl. Sci. 2024, 14(14), 6044; https://doi.org/10.3390/app14146044
Submission received: 2 April 2024 / Revised: 20 June 2024 / Accepted: 9 July 2024 / Published: 11 July 2024
(This article belongs to the Section Applied Biosciences and Bioengineering)

Abstract

:
In this study, we have analyzed the behavior of shear and compression forces at the L5-S1 joint during the execution of controlled lifting tasks designed on the basis of the revised NIOSH (National Institute for Occupational Safety and Health) lifting equation (RNLE) with an increasing lifting index (LI = 1, LI = 2, and LI = 3). We aim to verify the sensitivity of force indices with regard to risk levels. Twenty subjects performed the tasks, and the kinematic and kinetic data of their movement were acquired by using an optoelectronic motion analysis system and platform, respectively. Lumbosacral forces were calculated using the lower and upper body models, and some indices (i.e., maximum, medium, and range values) were extracted. Our findings confirm that the kinetic-based indices extracted from shear and compression forces at the L5-S1 joint are related to risk conditions, and they could improve the quantitative tools and machine-learning approaches that can also be used in a workspace to assess risk conditions during lifting tasks.

1. Introduction

Lifting activities are one of the primary causes of work-related low back diseases (WLBDs) for a large percentage of industrial workers and manual material handlers [1,2,3]. One of the approaches widely used for the prevention of WLBDs is the revised NIOSH (National Institute for Occupational Safety and Health) lifting equation (RNLE) [4,5]. It allows us to estimate the lifting index (LI), a reliable indicator of the risk of WLBDs. Nevertheless, this and other methods listed in international ergonomics standards [6,7,8] cannot be used for biomechanical risk assessment when manual material handling (MMH) activities are performed with the aid of collaborative robots and exoskeletons [6,9,10,11]. In recent years, new approaches for biomechanical risk assessment, based on the use of wearable sensor networks and machine-learning algorithms, have been proposed [12,13,14,15,16,17,18]. These methods combine kinematic and electromyographic-based indices and wireless wearable sensors attached to the worker’s body. Literature shows that the kinematic [14,16,18] and sEMG [13,15,17] indices used in these tools were correlated with compression and shear forces that determine injuries at the lumbosacral (L5-S1) joint. These forces can be evaluated by considering wearable sensors to acquire the upper body or lower body segments’ kinematics and force platforms to record the ground reaction forces.
It would be very important to be able to use the behavior of the compression and shear forces on L5-S1 in risk assessment tools because the sensors currently available for measuring ground reaction forces, sensorized shoes, and insoles can be used directly in the field. Furthermore, indices based on kinetics would allow for enriching the sets of indices used to train specific artificial neural networks, thus improving the existing quantitative tools for biomechanical risk assessment in lifting tasks. For the above-mentioned reasons, it is necessary to estimate the forces acting on the L5-S1 joint by using methods that do not use the reaction forces in comparison with methods that use them. In case of overlapping results, the model that does not use the forces could be used directly in the field, thus eliminating the need to use sensors to measure forces and, therefore, reducing the measurement complexity. To the best of our knowledge, there are no studies that have made this comparison in lifting activities designed on the RNLE and with an increasing lifting index.
Since these forces are correlated with indices related to the risk levels [13,14] and considering that a higher LI implies a higher risk and physical engagement, we hypothesize that these forces and the kinetic-based indices extracted from these forces are able to discriminate between different risk conditions.
The aim of the present work is to compare shear and compression forces at the L5-S1 joint calculated using the lower and upper body models during the execution of controlled lifting tasks designed on the RNLE and with an increasing LI (LI = 1, LI = 2, and LI = 3).
Both models should provide higher compressive and shear forces at higher risk levels.

2. Materials and Methods

2.1. Subjects

Twenty male subjects (mean age 33.30 ± 7.39 years, height 1.80 ± 0.07 m, body mass index (BMI) 24.37 ± 2.67 kg/m2) are included in the study. They had no history of musculoskeletal disorders, upper limb, lower limb, and trunk surgery, or orthopedic and neurological diseases and gave their informed consent to the study, which complied with the Helsinki Declaration and was approved by the local ethics committee (Comitato Etico “LAZIO 2”, N.0078009/2021).

2.2. Kinematic and Kinetic Recordings

The movements of 37 spherical markers (15 mm in diameter) covered with aluminum powder reflective material were detected using eight infrared cameras (sampling frequency 340 Hz) optoelectronic motion analysis system (SMART-DX 6000 System, BTS, Milan, Italy). Thirty-three markers were placed over specific anatomical points: the cutaneous projections of the spinous processes of the seventh (C7) and tenth cervical vertebrae, suprasternal notch (between the clavicular notches), sternum, sacrum and, bilaterally, over the temple, posterior-superior parietal bone, acromion, olecranon, ulnar styloid and radial processes, head of the third metacarpal bone, anterior superior iliac spine, great trochanter, lateral femoral condyle, fibula head, lateral malleolus, metatarsal head and heel (Figure 1, [19,20,21,22,23]). Furthermore, four markers were placed over the four vertexes of a load consisting of a plastic crate. Ground reaction forces were acquired by using four dynamometric platforms at a sampling rate of 680 Hz (P 6000, BTS, Milan, Italy) embedded in the floor. Data acquisition from the infrared cameras and force platforms was integrated and synchronized.

2.3. Experimental Procedures

The subjects were asked to perform the manual material lifting task standing in a neutral body position, placing their feet on the force platforms, and lifting a plastic crate with handles using both hands in three different lifting conditions chosen to obtain LI values of 1, 2, and 3 (Figure 1) defined as follows:
LI   = L o a d L C × H M × V M × D M × A M × F M × C M
where L o a d is the value of the load weight, L C is the load constant defined as 23 kg in RNLE, H M , V M , D M , A M , F M , and C M are the multipliers values for the horizontal (H) and vertical (V) locations, vertical travel distance (D), asymmetry angle (A), lifting frequency (F) and hand-to-object coupling (C). A, F, and C were equal for the three lifting conditions: A = 0° (AM = 1), F ≤ 0.2 lifts/min (FM = 1), and C = good (CM = 1). Each participant was required to perform a total of 9 trials (3 repetitions × 3 lifting tasks), one for each lifting, lasting a few seconds. The time between one trial and the next was determined by F. The order of each condition was randomly assigned, while the three repetitions of the same condition were repeated one after the other (i.e., 3 repetitions of condition with LI = 2, then three repetitions of LI = 3, and finally, the three repetitions of LI = 1).

2.4. Data Analysis

2.4.1. Lifting Cycle Detection

Smart Capture (BTS, Milan, Italy), Smart Tracker (BTS, Milan, Italy), and Matlab (version 8.0.0.783, MathWorks, Natick, MA, USA) software were used for the acquisitions, the tracking procedure, and data analysis, respectively. Starting from the vertical displacement of one of the four markers placed over the vertexes of the crate, the load velocity was evaluated and used to define the lifting cycle: the start and stop of the lifting task were set as the time points at which the crate marker velocity exceeded the velocity threshold by 0.025 m/s on the vertical axis and fell below the velocity threshold in the opposite direction [13,14,15,16]. Kinematic and kinetic data were time normalized to the duration of the lifting tasks and reduced to 101 samples with a polynomial procedure (see Figure 1, [13,14,15,16]).

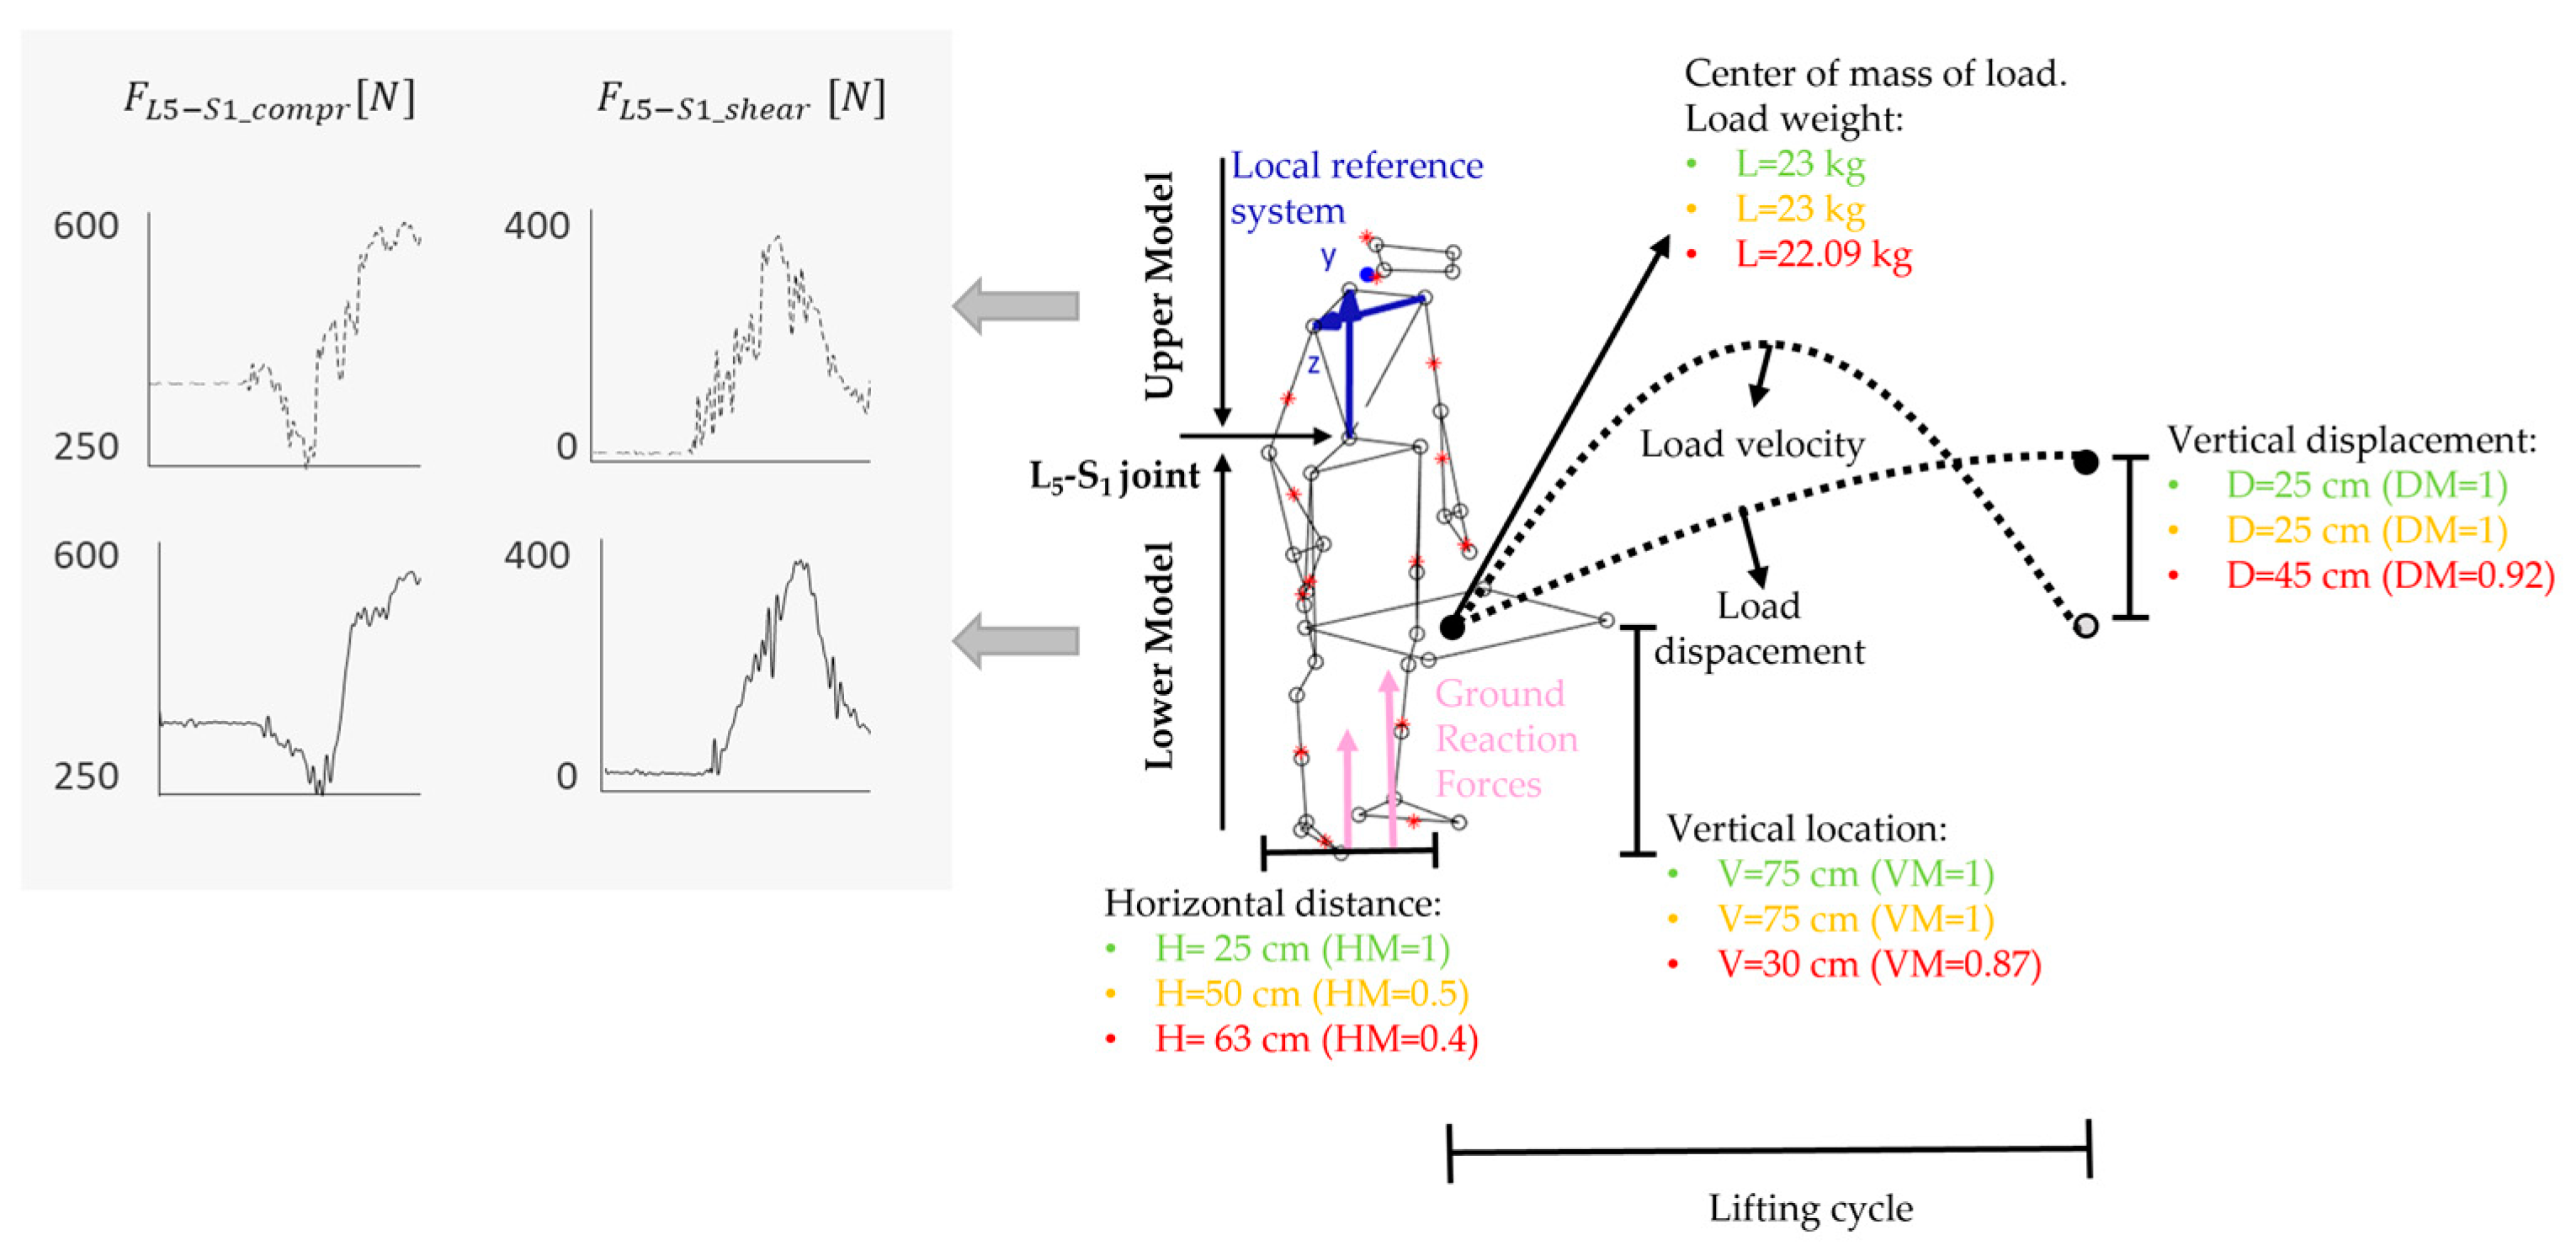
2.4.2. Force Calculation

We used a lower body model and an upper body model to evaluate the net forces at the L5-S1 joint ( F L 5 S 1 ) . The lower body model includes the pelvis and bilateral thighs, shanks, and feet [24], while the upper body model includes the hands, forearms, arms, head, trunk, and load [24]. In the local reference system placed on the trunk, the y axis is oriented as the vector C7-sacrum and x z represents the plane orthogonal to y , the F L 5 S 1 were calculated by using the following formula [24]:
F L 5 S 1 = r = 1 n F r i = 1 k m i g + i = 1 k m i a i
where
  • F r is the rth external force;
  • n is the number of external forces;
  • k is the number of body segments considered;
  • g is the acceleration of gravity;
  • m i and a i are the mass and the acceleration of the i th segment, evaluated considering kinematic, anthropometric data and body segment parameters using the Table 1 [25,26].
In detail, for the two models:
F L 5 S 1   L o w e r   M o d e l = G R F i = 1 7 m i g + i = 1 7 m i a i
F L 5 S 1   U p p e r   M o d e l = m l o a d g + m l o a d a l o a d i = 1 8 m i g + i = 1 8 m i a i
where G R F is the ground reaction force. The components of F L 5 S 1 on the y axis and the x z planes were called compression ( C F L 5 S 1 ) and shear ( S F L 5 S 1 ) forces, respectively. The values of forces were reported in N ( C F L 5 S 1 and S F L 5 S 1 ), they were normalized with respect to the body weight ( C F L 5 S 1 , Norm and S F L 5 S 1 , Norm in N/kg) and normalized with respect to the F L 5 S 1 during the standing phase ( | C F L 5 S 1 C F L 5 S 1 S t a n d i n g | and | S F L 5 S 10 S F L 5 S 1 S t a n d i n g |). For each considered force, the maximum, mean, and range (difference among maximum and minimum values) values were evaluated in the lifting cycle.

2.5. Statistical Analysis
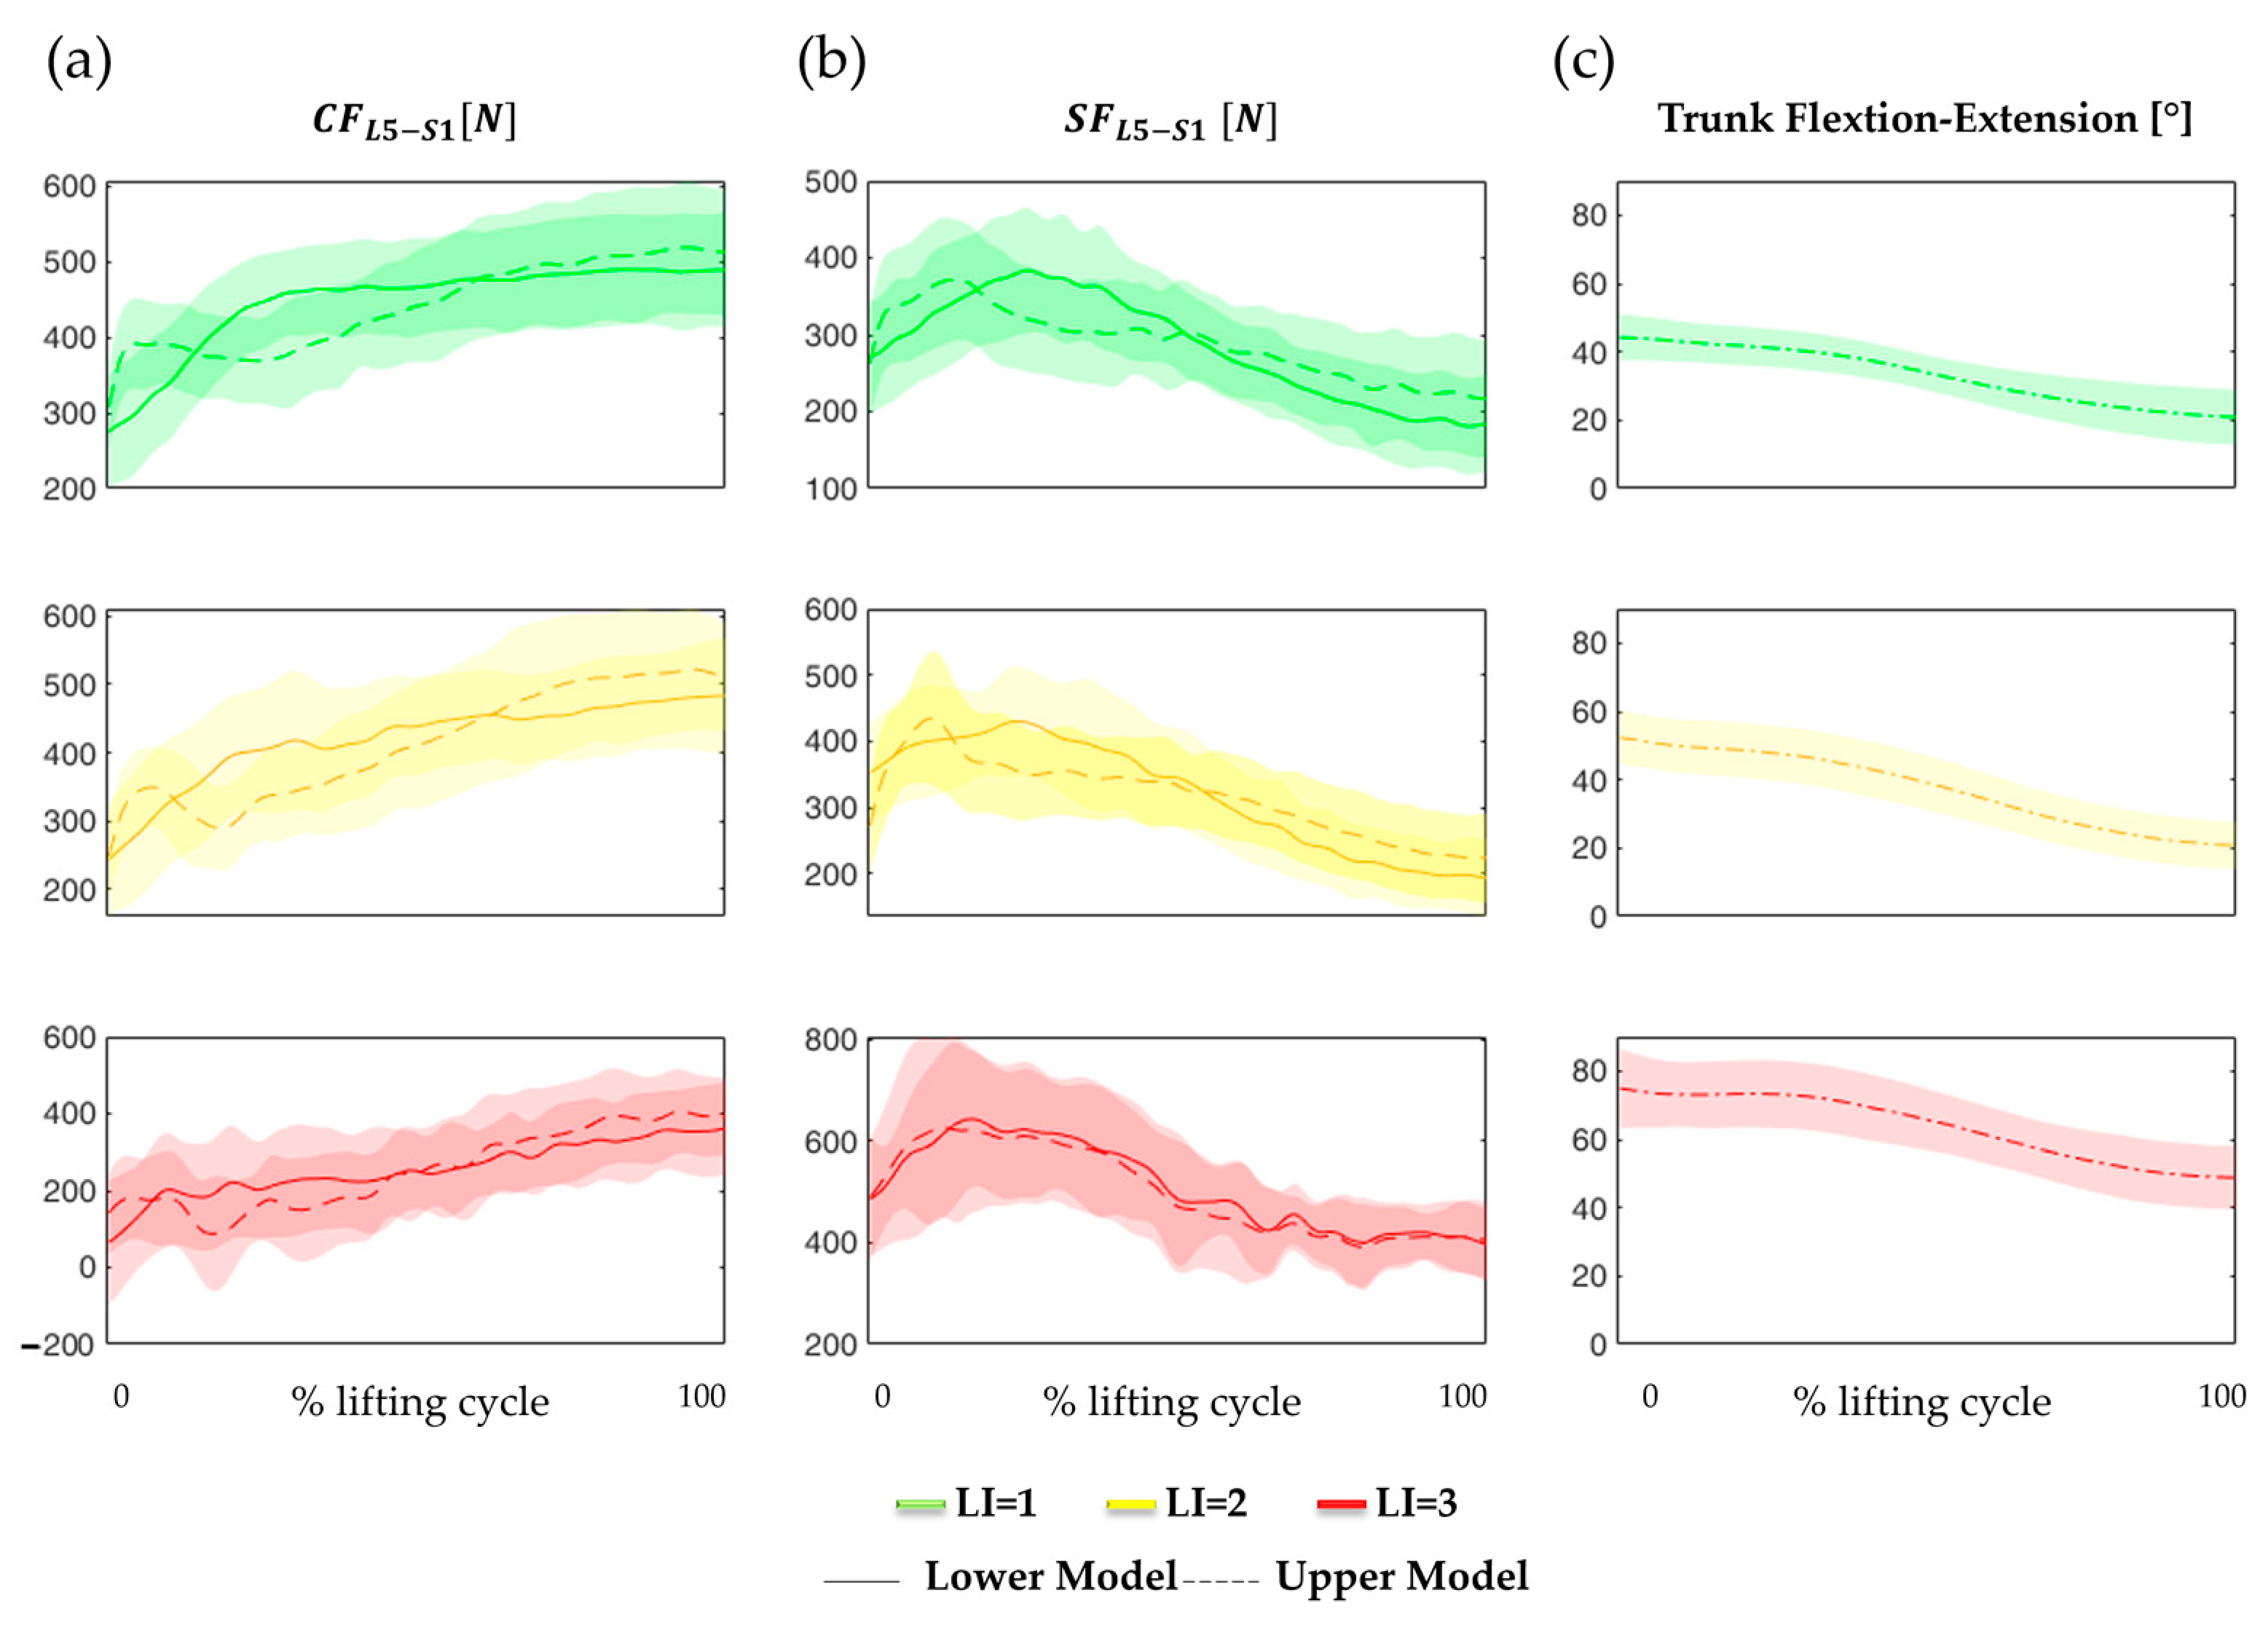
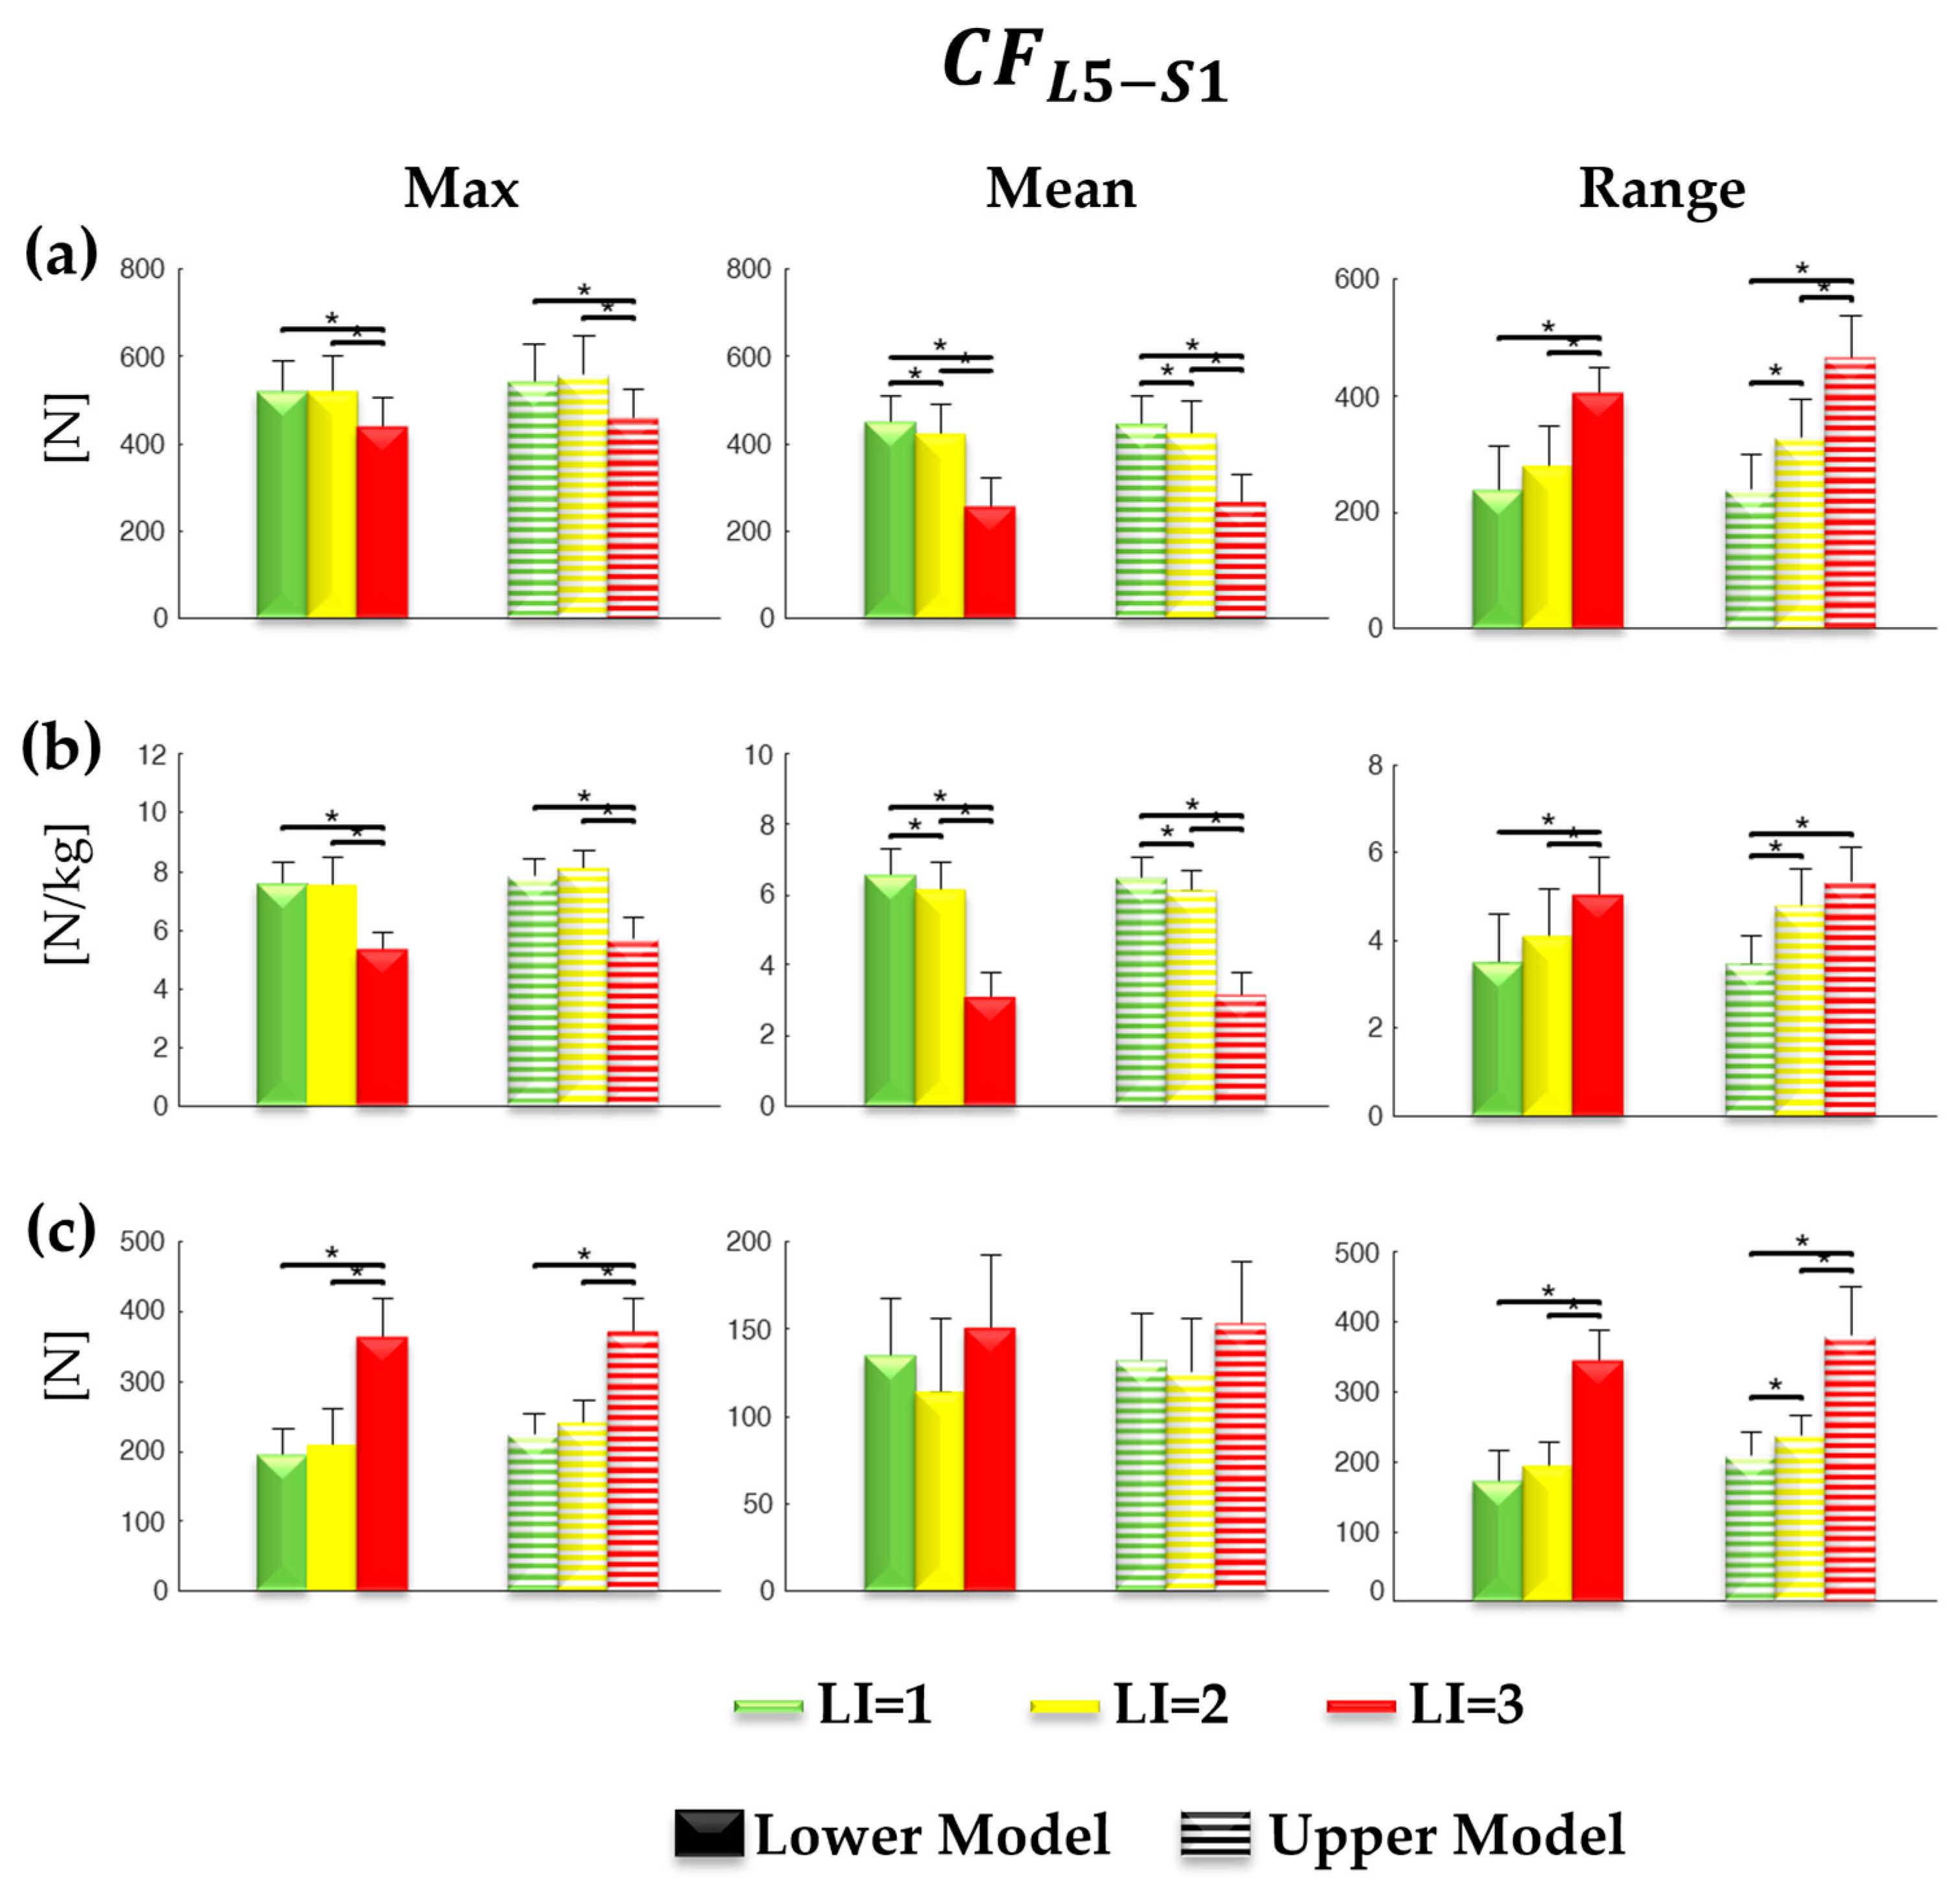
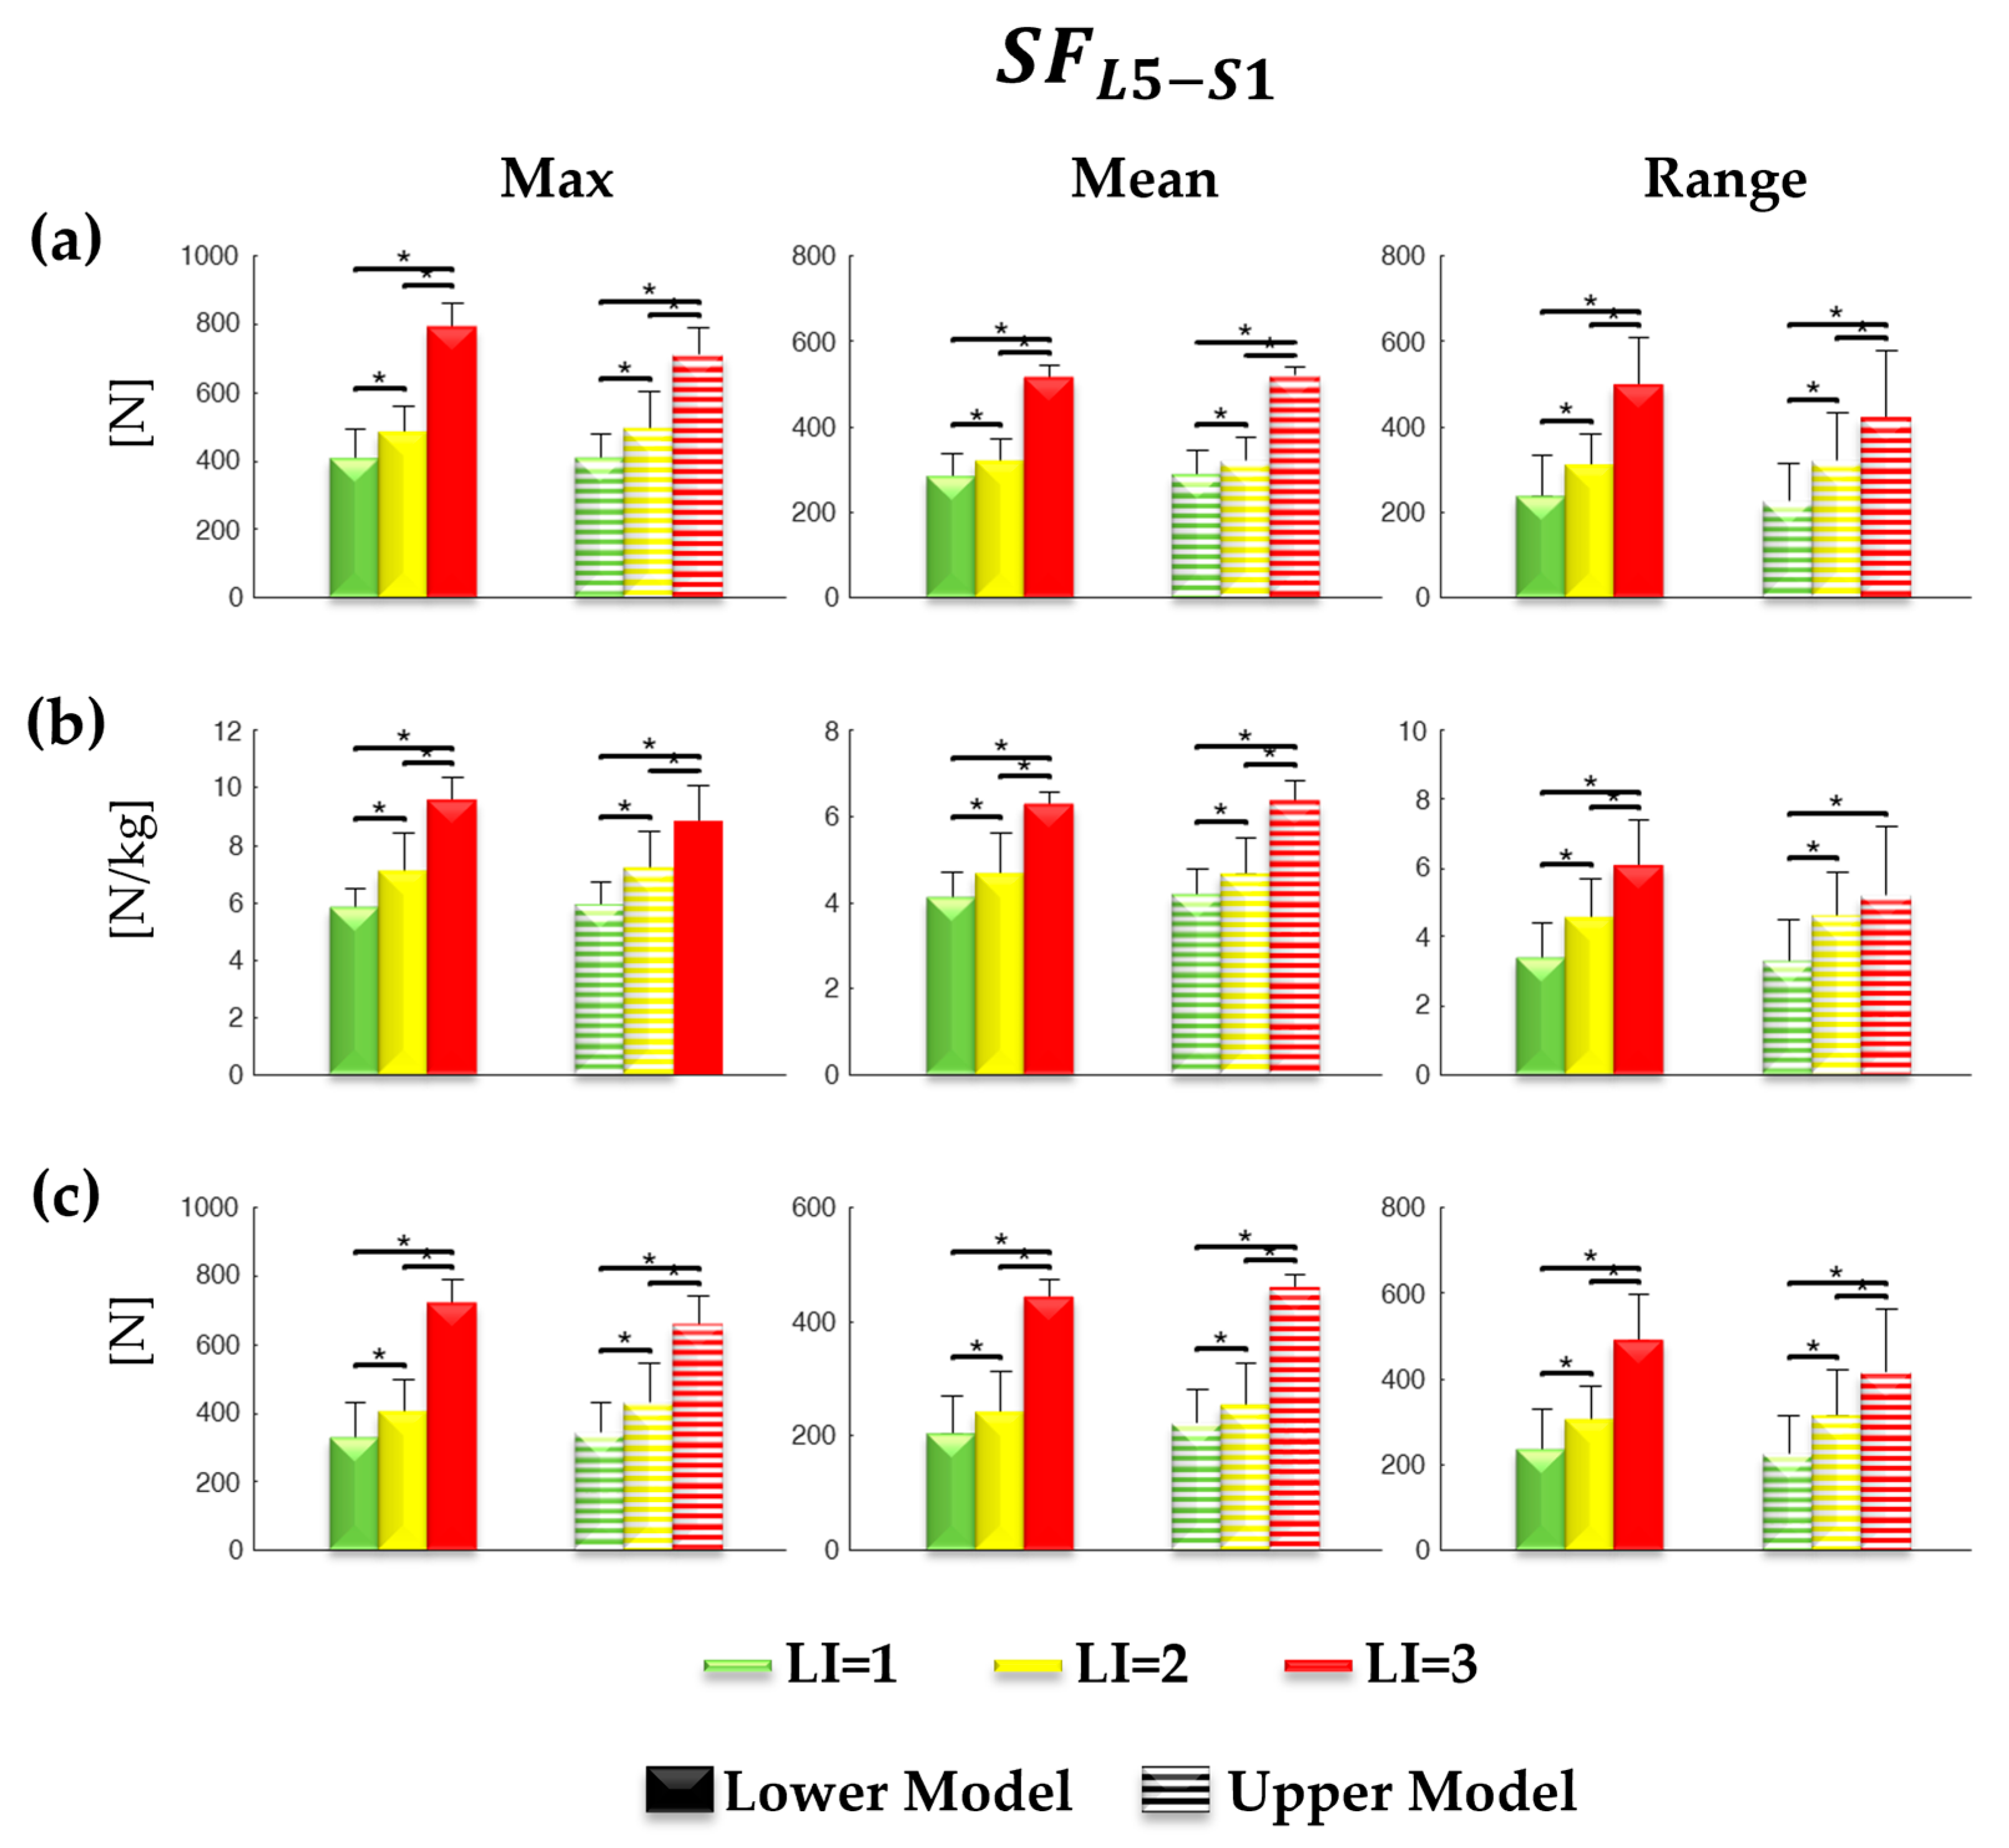
All the analyses were performed using SPSS 17.0 software (SPSS Inc. Chicago, IL, USA). The Shapiro–Wilk and Kolmogorov–Smirnov test was used to analyze the normal distribution of the data. For each lifting condition and for each parameter, we performed a one-way repeated-measures ANOVA to determine whether there was any significant difference between the three risk levels. Cohen’s d values were also evaluated to estimate the effect size for the comparison between the LI pairs means. Post-hoc analyses, with Bonferroni’s corrections, were performed when significant differences were observed in the ANOVA. Furthermore, the power analysis for the investigated sample was performed using G*Power software (G*Power 3.1.9.7). A p value of less than 0.05 was considered statistically significant.

3. Results

Figure 2 shows the mean and standard deviation for each lifting condition of the C F L 5 S 1 and S F L 5 S 1 evaluated with both lower (continuous lines) and upper models (dotted lines). Also, in Figure 2, the trunk flexion-extension angle curves were reported.
Figure 3 and Figure 4 show the means and standard deviations for each parameter for compression and shear forces, respectively.
The repeated measures ANOVA revealed a significant effect of the LI on the Max, Mean, and Range for all forces evaluated with the lower model and upper model ( C F L 5 S 1 [N], S F L 5 S 1 [N], C F L 5 S 1 , Norm   [N/kg], S F L 5 S 1 , Norm [N/kg], | C F L 5 S 1 C F L 5 S 1 Standing | [N] and | S F L 5 S 1 S F L 5 S 1 , Standing | [N]) except for | C F L 5 S 1 C F L 5 S 1 , Standing | [N] evaluated with lower model (p = 0.058), see Table 2.
The power analysis for the investigated sample was 0.83.
Table 3 shows the p values of the paired t-test with Bonferroni’s corrections for Maximum, Mean, and Range for all considered forces, which highlight the differences between pairs of LI. Furthermore, the Cohen’s d values were reported.

4. Discussion

In this study, we have analyzed the behavior of shear and compression forces at the L5-S1 joint ( S F L 5 S 1 and C F L 5 S 1 )   during the execution of controlled lifting tasks designed on the basis of the RNLE [4,5] with an increasing lifting index (LI = 1, LI = 2, and LI = 3). Overall, due to how the LI is computed and the input variables that are considered, it is related to back compression, and for this reason, it is considered a good predictor of the risk of low-back incidents and overexertion injuries [5]. Higher LI values imply greater loads on the lumbosacral joint [4,5,27]. LIs higher than 1.0 but lower than 3 are assumed to represent lifting heavy loads activities that pose a risk for the lumbosacral joint, while LI values higher than 3.0 are referred to as highly stressful lifting tasks, implying an elevated risk of work-related low-back injury [28]. Furthermore, the scientific literature also highlights that higher LIs lead to higher kinematic and sEMG-based indexes, which, in turn, are positively correlated with compression and shear forces [14,15]. In this study, these forces were calculated using both lower and upper body models, as presented by Plamondon [24]. The findings highlight that the S F L 5 S 1 are related to risk levels: the maximum, mean, and range values significantly increase with LI (Figure 4, Table 1). These results are similar for both the used model, lower, and upper model (Figure 4, Table 1) and for all considered forces, the values of forces reported in N ( S F L 5 S 1 in N, Figure 4a) are normalized with respect to the body weight ( S F L 5 S 1 N o r m in N/kg, Figure 4b) and normalized with respect to the F L 5 S 1 during the standing phase ( | S F L 5 S 10 S F L 5 S 1 S t a n d i n g | in N, Figure 4c).
Regarding the C F L 5 S 1 , they are related to risk levels; however, the results are different with respect to the S F L 5 S 1 and depend on the parameters and force normalization. In particular, considering the values of forces reported in N ( C F L 5 S 1 , Figure 3a) and normalized with respect to the body weight ( C F L 5 S 1 , Norm in N/kg, Figure 3b), the maximum and mean values decrease with LI while the range values increase with LI (Figure 3a,b, Table 1). These results are similar for both the used model and the lower and upper models (Figure 3a,b, Table 1). Furthermore, considering the values of forces normalized with respect to the F L 5 S 1 during the standing phase ( | C F L 5 S 10 C F L 5 S 1 S t a n d i n g | in N, Figure 3c), the maximum and range increase with LI (Figure 3c). This result could be affected by the task geometry, resulting in a different initial C F L 5 S 1   depending on the posture taken by subjects before lifting the load. In fact, in the tasks with LI = 1 and 2, the subject started in a posture closer to standing because the load was placed at an initial vertical height that was close to the subject’s pelvis (V = 75 cm in both LIs, see Figure 1) and therefore the subjects did not have to either lean forward excessively with the trunk or bend the legs. In contrast, in the tasks with LI = 3, the vertical position of the load is further from the subject’s trunk, being close to the floor (V = 30 cm, see Figure 1 and Figure 2). In this case, the subjects had to move closer to the load using the strategy they deemed appropriate, either bending the legs or the trunk (the task execution strategy, in fact, was self-selected). Therefore, when normalized forces are considered with respect to the value before performing lifting, these are found to reduce the effect of posture, and the values increase with LI (Figure 3c). The effect of the posture in estimating forces was shown by Arjmand and colleagues [29]: they have shown that the compression and shear forces at the L5–S1 joint in the symmetric lifting task range from 568 N to 5474 N and 221 N to 1924 N depending on trunk flexion angle, the lumbar/pelvis ratio, the load weight and the load position [29].
The results of our study show that the range could be a good parameter to classify the risk. Indeed, it increases with LI in all considered forces, also reducing the effect of the posture present in the other parameters for C F L 5 S 1 .
Another important result of this study is the similar results obtained with these two different models. In particular, the results obtained with the upper model could be useful for evaluating these forces in work environments as well. In fact, while the lower model requires the use of platforms to evaluate the forces to assess GRF, the upper model does not require such forces. Therefore, these forces could be estimated only from kinematic data measured, for example, by IMU in the workspace. Indeed, the promising use of these wearable sensors and algorithms for an instrumental biomechanical risk assessment was shown [18]. Future studies could involve the use of risk assessment tools directly in real work life, including indices based on compression and shear forces on L5-S1 that can be measured directly in the field by using only IMUs. Furthermore, these indices could be used to enrich the existing trained artificial intelligence algorithms, allowing biomechanical risk assessment in lifting tasks.
Therefore, the findings confirm our hypotheses that the shear and compression forces and the kinetic-based indices extracted from them are related to risk conditions: there are statistically significant differences among LI pairs. These findings could be used to enrich the indices used in quantitative tools and to improve machine-learning approaches [6,15], which can also be used in the workspace and to assess biomechanical risk conditions during lifting tasks.
The limitation of this study could be the dimensionality of the investigated sample. Indeed, even if the current sample size had been chosen to achieve adequate statistical power (the statistical power for this sample was 0.83) [30], increasing the sample could strengthen the results obtained. Furthermore, another experiment with a larger sample would allow the recruitment of female subjects, which would also allow an analysis of gender differences. Indeed, it has been shown that there is a different risk of developing LBD between men and women due to various factors [31,32,33,34]. It will be interesting to compare these forces with those estimated through neuromuscular models [35,36,37].
Another limitation of this study is related to the fact that the participants only performed one task for each LI category, and this did not allow the assessment of force variations associated with any changes in the tasks with the same LI. Therefore, future development will be to investigate compressive and shear forces during the execution of different tasks with the same LI.

Author Contributions

Conceptualization, T.V., G.C., M.S. and A.R.; methodology, T.V., G.C. and A.R.; software, T.V.; validation, T.V., G.C., M.S. and A.R.; formal analysis, T.V.; investigation, T.V. and G.C.; resources, T.V., G.C., M.S. and A.R. data curation, T.V.; writing—original draft preparation, T.V., G.C. and A.R.; writing—review and editing, T.V., G.C., M.S. and A.R.; visualization, T.V., G.C., M.S. and A.R.; supervision, A.R.; project administration, A.R.; funding acquisition, A.R. All authors have read and agreed to the published version of the manuscript.

Funding

The research presented in this article was carried out as part of the SOPHIA project, which has received funding from the European Union’s Horizon 2020 research and innovation program under Grant Agreement No. 871237. This research was also funded by INAIL, Bando Ricerche in Collaborazione (BRiC) 2022 program, ID 57 and 58.

Institutional Review Board Statement

The study was conducted in accordance with the Declaration of Helsinki and approved by the Ethics Committee of Regione Lazio, Comitato Etico “LAZIO 2” (protocol code N.0078009/2021, date of approval: 15 April 2021).

Informed Consent Statement

Informed consent was obtained from all subjects involved in the study.

Data Availability Statement

Data are available in a publicly accessible repository that does not issue DOIs. Publicly available datasets were analyzed in this study. These data can be found here: https://humandatacorpus.org/lifting-and-carrying-iso-11228/, accessed on 29 November 2023 [27].

Conflicts of Interest

The authors declare no conflicts of interest.

References

  1. Bosch, T.; van Eck, J.; Knitel, K.; de Looze, M. The effects of a passive exoskeleton on muscle activity, discomfort and endurance time in forward bending work. Appl. Ergon. 2016, 54, 212–217. [Google Scholar] [CrossRef] [PubMed]
  2. Alemi, M.M.; Geissinger, J.; Simon, A.A.; Chang, S.E.; Asbeck, A.T. A passive exoskeleton reduces peak and mean EMG during symmetric and asymmetric lifting. J. Electromyogr. Kinesiol. 2019, 47, 25–34. [Google Scholar] [CrossRef] [PubMed]
  3. Flor-Unda, O.; Casa, B.; Fuentes, M.; Solorzano, S.; Narvaez-Espinoza, F.; Acosta-Vargas, P. Exoskeletons: Contribution to Occupational Health and Safety. Bioengineering 2023, 10, 1039. [Google Scholar] [CrossRef] [PubMed]
  4. Waters, T.; Putz-Anderson, V.; Garg, A. Applications Manual for the Revised NIOSH Lifting Equation; DHHS Publication: Cincinnati, OH, USA, 1994. Available online: https://stacks.cdc.gov/view/cdc/5434 (accessed on 2 February 2024).
  5. Waters, T.R.; Putz-Anderson, V.; Garg, A.; Fine, L.J. Revised NIOSH equation for the design and evaluation of manual lifting tasks. Ergonomics 1993, 36, 749–776. [Google Scholar] [CrossRef] [PubMed]
  6. ISO/DIS 11228-1; Ergonomics—Manual Handling—Part 1: Lifting and Carrying. ISO: Geneva, Switzerland, 2003.
  7. ISO 11228-2; Ergonomics—Manual Handling—Part 2: Pushing and Pulling. ISO: Geneva, Switzerland, 2007.
  8. ISO/DIS 11228-3; Ergonomics—Manual Handling—Part 3: Handling of Low Loads at High Frequency. ISO: Geneva, Switzerland, 2007.
  9. Ranavolo, A.; Ajoudani, A.; Cherubini, A.; Bianchi, M.; Fritzsche, L.; Iavicoli, S.; Sartori, M.; Silvetti, A.; Vanderborght, B.; Varrecchia, T.; et al. The Sensor-Based Biomechanical Risk Assessment at the Base of the Need for Revising of Standards for Human Ergonomics. Sensors 2020, 20, 5750. [Google Scholar] [CrossRef] [PubMed]
  10. CWA 17938:2023; Guideline for Introducing and Implementing Real-Time Instrumental-Based Tools for Biomechanical Risk Assessment. CEN-CENELEC Management Centre: Belgium, 2023. Available online: https://www.cencenelec.eu/media/CEN-CENELEC/CWAs/RI/2023/cwa17938_2023.pdf (accessed on 10 July 2024).
  11. Armstrong, T.J.; Burdorf, A.; Descatha, A.; Farioli, A.; Graf, M.; Horie, S.; Marras, W.S.; Potvin, J.R.; Rempel, D.; Spatari, G.; et al. Scientific basis of ISO standards on biomechanical risk factors. Scand. J. Work. Environ. Health 2018, 44, 323–329. [Google Scholar] [CrossRef] [PubMed]
  12. Ranavolo, A.; Draicchio, F.; Varrecchia, T.; Silvetti, A.; Iavicoli, S. Wearable Monitoring Devices for Biomechanical Risk Assessment at Work: Current Status and Future Challenges—A Systematic Review. Int. J. Environ. Res. Public Health 2018, 15, 2001, Erratum in Int. J. Environ. Res. Public Health 2018, 15, 2569. [Google Scholar] [CrossRef] [PubMed]
  13. Ranavolo, A.; Varrecchia, T.; Iavicoli, S.; Marchesi, A.; Rinaldi, M.; Serrao, M.; Conforto, S.; Cesarelli, M.; Draicchio, F. Surface electromyography for risk assessment in work activities designed using the “revised NIOSH lifting equation”. Int. J. Ind. Ergon. 2018, 68, 34–45. [Google Scholar] [CrossRef]
  14. Ranavolo, A.; Varrecchia, T.; Rinaldi, M.; Silvetti, A.; Serrao, M.; Conforto, S.; Draicchio, F. Mechanical lifting energy consumption in work activities designed by means of the “revised NIOSH lifting equation”. Ind. Health 2017, 55, 444–454. [Google Scholar] [CrossRef]
  15. Varrecchia, T.; De Marchis, C.; Rinaldi, M.; Draicchio, F.; Serrao, M.; Schmid, M.; Conforto, S.; Alberto, R. Lifting activity assessment using surface electromyographic features and neural networks. Int. J. Ind. Ergon. 2018, 66, 1–9. [Google Scholar] [CrossRef]
  16. Varrecchia, T.; De Marchis, C.; Draicchio, F.; Schmid, M.; Conforto, S.; Alberto, R. Lifting activity assessment using kinematic features and neural networks. Appl. Sci. 2020, 10, 1989. [Google Scholar] [CrossRef]
  17. Chini, G.; Varrecchia, T.; Conforto, S.; De Nunzio, A.M.; Draicchio, F.; Falla, D.; Ranavolo, A. Trunk stability in fatiguing frequency-dependent lifting activities. Gait Posture 2023, 102, 72–79. [Google Scholar] [CrossRef] [PubMed]
  18. Ranavolo, A.; Ajoudani, A.; Chini, G.; Lorenzini, M.; Varrecchia, T. Adaptive Lifting Index (aLI) for Real-Time Instrumental Biomechanical Risk Assessment: Concepts, Mathematics, and First Experimental Results. Sensors 2024, 24, 1474. [Google Scholar] [CrossRef] [PubMed]
  19. Wu, G.; Siegler, S.; Allard, P.; Kirtley, C.; Leardini, A.; Rosenbaum, D.; Whittle, M.; D’Lima, D.D.; Cristofolini, L.; Witte, H.; et al. Standardization and Terminology Committee of the International Society of Biomechanics ISB recommendation on definitions of joint coordinate system of various joints for the reporting of human joint motion—Part I: Ankle, hip, and spine. J. Biomech. 2002, 35, 543–548. [Google Scholar] [CrossRef] [PubMed]
  20. Wu, G.; van der Helm, F.C.; Veeger, H.E.; Makhsous, M.; Van Roy, P.; Anglin, C.; Nagels, J.; Karduna, A.R.; McQuade, K.; Wang, X.; et al. International Society of Biomechanics. ISB Recommendation on Definitions of Joint Coordinate Systems of Various Joints for the Reporting of Human Joint Motion. Part II.; Shoulder, Elbow, Wrist and Hand. J. Biomech. 2005, 38, 981–992. [Google Scholar] [CrossRef] [PubMed]
  21. Gutierrez-Farewik, E.M.; Bartonek, A.; Saraste, H. Comparison and evaluation of two common methods to measure center of mass displacement in three dimensions during gait. Hum. Mov. Sci. 2006, 25, 238–256. [Google Scholar] [CrossRef] [PubMed]
  22. Rab, G.; Petuskey, K.; Bagley, A. A method for determination of upper extremity kinematics. Gait Posture 2002, 15, 113–119. [Google Scholar] [CrossRef]
  23. Davis, R.B., 3rd; Õunpuu, S.; Tyburski, D.; Gage, J.R. A gait analysis data collection and reduction technique. Hum. Mov. Sci. 1991, 10, 575–587. [Google Scholar] [CrossRef]
  24. Plamondon, A.; Gagnon, M.; Desjardins, P. Validation of two 3-D segment models to calculate the net reaction forces and moments at the L5/S1 joint in lifting. Clin. Biomech. 1996, 11, 101–110. [Google Scholar] [CrossRef]
  25. Zatsiorsky, V.M.; Seluyanov, V.N.; Chugunova, L.G. Methods of Determining Mass-Inertial Characteristics of Human Body Segments; Chernyi, G.G., Regirer, S.A., Eds.; Contemporary Problems of Biomechanics: Boca Raton, FL, USA, 1990; pp. 272–291. [Google Scholar]
  26. de Leva, P. Adjustments to Zatsiorsky-Seluyanov’s segment inertia parameters. J. Biomech. 1996, 29, 1223–1230. [Google Scholar] [CrossRef]
  27. Armstrong, D.P.; Fischer, S.L. Understanding individual differences in lifting mechanics: Do some people adopt motor control strategies that minimize biomechanical exposure. Hum. Mov. Sci. 2020, 74, 102689. [Google Scholar] [CrossRef] [PubMed]
  28. Ranavolo, A.; Mari, S.; Conte, C.; Serrao, M.; Silvetti, A.; Iavicoli, S.; Draicchio, F. A new muscle co-activation index for biomechanical load evaluation in work activities. Ergonomics 2015, 58, 966–979. [Google Scholar] [CrossRef] [PubMed]
  29. Arjmand, N.; Plamondon, A.; Shirazi-Adl, A.; Lariviere, C.; Parnianpour, M. Predictive equations to estimate spinal loads in symmetric lifting tasks. J. Biomech. 2011, 44, 84–91. [Google Scholar] [CrossRef] [PubMed]
  30. Naing, L.; Winn, T.; Rusli, B.N. Practical issues in calculating the sample size for prevalence studies. Arch. Orofac. Sci. 2006, 1, 9–14. [Google Scholar]
  31. Fillingim, R.B.; King, C.D.; Ribeiro-Dasilva, M.C.; Rahim-Williams, B.; Riley, J.L. Sex, gender, and pain: A review of recent clinical and experimental findings. J. Pain 2009, 10, 447–485. [Google Scholar] [CrossRef] [PubMed]
  32. Hunter, S.K. Sex differences in human fatigability: Mechanisms and insight to physiological responses. Acta Physiol. 2014, 210, 768–789. [Google Scholar] [CrossRef] [PubMed]
  33. Sullivan, B.E.; Carroll, C.C.; Jemiolo, B.; Trappe, S.W.; Magnusson, S.P.; Dossing, S.; Kjaer, M.; Trappe, T.A. Effect of acute resistance exercise and sex on human patellar tendon structural and regulatory mRNA expression. J. Appl. Physiol. 2009, 106, 468–475. [Google Scholar] [CrossRef] [PubMed]
  34. Johansen, T.; Samani, A.; Antle, D.; Côté, J.N.; Madeleine, P. Gender effects on the coordination of subdivisions of the trapezius muscle during a repetitive box-folding task. Eur. J. Appl. Physiol. 2013, 113, 175–182. [Google Scholar] [CrossRef]
  35. Sartori, M.; Reggiani, M.; Farina, D.; Lloyd, D.G. EMG-Driven Forward-Dynamic Estimation of Muscle Force and Joint Moment about Multiple Degrees of Freedom in the Human Lower Extremity. PLoS ONE 2012, 7, e52618. [Google Scholar] [CrossRef]
  36. Moya-Esteban, A.; van der Kooij, H.; Sartori, M. Robust estimation of lumbar joint forces in symmetric and asymmetric lifting tasks via large-scale electromyography-driven musculoskeletal models. J. Biomech. 2022, 144, 111307. [Google Scholar] [CrossRef]
  37. Lloyd, D.G.; Besier, T.F. An EMG-driven musculoskeletal model to estimate muscle forces and knee joint moments in vivo. J. Biomech. 2003, 36, 765–776. [Google Scholar] [CrossRef]
Figure 1. Kinematic (right side) and kinetic protocols (left side), an example of load displacement and velocity and lifting cycle definition; the values of NIOSH protocol for each lifting task are reported. In green, the values of the task with lifting index (LI) = 1; in yellow, the values for LI = 2; and in red, the values for LI = 3. L: load weight; H and HM: horizontal locations and corresponding values of the multiplier; V and VM: vertical locations and corresponding values of the multiplier; D and DM: vertical travel distances and corresponding values of the multiplier. Red * on the body (right side) represent the center of mass of each body segment.
Applsci 14 06044 g001
Figure 2. Compression ( C F c L 5 S 1 , (a)) and shear ( S F L 5 S 1 , (b)) forces evaluated with both lower (continuous lines) and upper models (dotted lines) and trunk flexion-extension (c) during the execution of the lifting tasks in the three different conditions (LI = 1 in green, LI = 2 in yellow, and LI = 3 in red). Curves represent the mean values with shaded SDs. Data are normalized to the lifting duration and reduced to 101 samples over the cycle.
Applsci 14 06044 g002
Figure 3. Means and standard deviations of Maximum, Mean, and Range values for compression forces in N (a), forces normalized with respect to the body weight in N/kg (b), and normalized with respect to the forces during standing phase in N (c) in each risk level condition for both lower and upper models. LI: lifting index. * Significant differences at post hoc analysis.
Applsci 14 06044 g003
Figure 4. Means and standard deviations of Maximum, Mean, and Range values for shear forces in N (a), forces normalized with respect to the body weight in N/kg (b) and normalized with respect to the forces during standing phase in N (c) in each risk level condition for both lower and upper models. LI: lifting index. * Significant differences at post hoc analysis.
Applsci 14 06044 g004
Table 1. Marker-set for each body segment and body segment parameter data from Zatsiorsky et al. 1990 and DeLeva 1996 [25,26].
SegmentMarkersMass (%Mass) CM (%Length)
FemaleMaleFemaleMale
HeadTemple and
posterior-superior parietal bone
6.686.9458.9459.76
Trunkseventh vertebrae, acromions, sacrum and anterior superior iliac spines 42.5743.4641.5144.86
Pelvissacrum, rasis and l asis12.4711.1749.261.15
Upper ArmAcromion and olecranon 2.552.7157.5457.72
Forearmolecranon and radial processes1.381.6245.5945.74
Handradial processes and head of the third metacarpal bone0.560.6174.7479
Thighgreat trochanter and lateral femoral condyle14.7814.1636.1240.95
Shanklateral femoral condyle and fibula head4.814.3344.1644.59
Footmetatarsal head and heel1.291.3740.1444.15
Table 2. Repeated measures ANOVA results on Maximum, Mean, and Range for compression and shear forces in N ( C F L 5 S 1 and S F L 5 S 1 ), normalized with respect to the body weight ( C F L 5 S 1 , Norm and S F L 5 S 1 , Norm ) and normalized with respect to the F L 5 S 1 during standing phase ( | C F L 5 S 1 C F L 5 S 1 S t a n d i n g | and | S F L 5 S 10 S F L 5 S 1 S t a n d i n g |) evaluated with lower model and upper model. Bold type indicates significant differences.
MaximumMeanRange
Lower Model C F L 5 S 1 [N]F = 17.515, df = 2, p < 0.001F = 103.466, df = 2, p < 0.001F = 40.791, df = 2, p < 0.001
C F L 5 S 1 , Norm [N/kg]F = 79.112, df = 2, p < 0.001F = 165.761, df = 2, p < 0.001F = 13.255, df = 2, p < 0.001
| C F L 5 S 1 C F L 5 S 1 S t a n d i n g | [N]F = 83.555, df = 2, p < 0.001F = 5.457, df = 2, p = 0.058F = 89.527, df = 2, p < 0.001
Upper Model C F L 5 S 1 [N]F = 17.343, df = 2, p < 0.001F = 72.977, df = 2, p < 0.001F = 63.171, df = 2, p < 0.001
C F L 5 S 1 , Norm [N/kg]F = 79.155, df = 2, p < 0.001F = 201.366, df = 2, p < 0.001F = 44.220, df = 2, p < 0.001
| C F L 5 S 1 C F L 5 S 1 S t a n d i n g | [N]F = 107.897, df = 2, p < 0.001F = 4.899, df = 2, p = 0.013F = 58.671, df = 2, p < 0.001
Lower Model S F L 5 S 1 [N]F = 214.901, df = 2, p < 0.001F = 217.721, df = 2, p < 0.001F = 66.483, df = 2, p < 0.001
S F L 5 S 1 , Norm [N/kg]F = 89.655, df = 2, p < 0.001F = 77.830, df = 2, p < 0.001F = 34.145, df = 2, p < 0.001
| S F L 5 S 1 S F L 5 S 1 S t a n d i n g | [N]F = 182.187, df = 2, p < 0.001F = 165.385, df = 2, p < 0.001F = 63.568, df = 2, p < 0.001
Upper Model S F L 5 S 1 [N]F = 78.062, df = 2, p < 0.001F = 205.992, df = 2, p < 0.001F = 13.265, df = 2, p < 0.001
S F L 5 S 1 , Norm [N/kg]F = 98.477, df = 2, p < 0.001F = 39.379, df = 2, p < 0.001F = 7.883, df = 2, p = 0.001
| S F L 5 S 1 S F L 5 S 1 S t a n d i n g | [N]F = 75.125, df = 2, p < 0.001F = 179.363, df = 2, p < 0.001F = 13.497, df = 2, p < 0.001
Table 3. p values of the paired t-test with Bonferroni’s corrections for Maximum, Mean, and Range for compression and shear forces in N ( C F L 5 S 1 and S F L 5 S 1 ), normalized with respect to the body weight ( C F L 5 S 1 , Norm and S F L 5 S 1 , Norm ) and normalized with respect to the F L 5 S 1 during the standing phase ( | C F L 5 S 1 C F L 5 S 1 S t a n d i n g | and | S F L 5 S 1 S F L 5 S 1 S t a n d i n g |) evaluated with the lower model and upper model. Cohen’s d values indicate the effect size for the comparison between the LI pairs means (“small” if d = 0.2, “medium” if d = 0.5, “large” if d = 0.8, “Very large” if d = 1.20, “Huge” if d = 2.0). Bold type indicates significant differences.
LIMaximumMeanRange
p ValueCohen’s dp ValueCohen’s dp ValueCohen’s d
Lower Model C F L 5 S 1 [N]1 vs. 21.0000.0070.0050.410.0530.55
1 vs. 30.0011.16<0.0012.99<0.0012.63
2 vs. 30.0011.05<0.0012.37<0.0012.10
C F L 5 S 1 , Norm [N/kg]1 vs. 21.0000.020.0080.520.0660.53
1 vs. 3<0.0013.16<0.0014.740.0021.52
2 vs. 3<0.0012.74<0.0013.950.0100.95
| C F L 5 S 1 C F L 5 S 1 S t a n d i n g | [N]1 vs. 20.4870.320.0510.540.1780.55
1 vs. 3<0.0013.570.5950.42<0.0013.78
2 vs. 3<0.0012.860.0530.87<0.0013.72
Upper Model C F L 5 S 1 [N]1 vs. 20.1070.170.0180.29<0.0011.37
1 vs. 30.0031.08<0.0012.71<0.0013.28
2 vs. 30.0011.22<0.0012.19<0.0011.95
C F L 5 S 1 , Norm [N/kg]1 vs. 20.0540.420.0160.59<0.0011.72
1 vs. 3<0.0013.05<0.0015.28<0.0012.46
2 vs. 3<0.0013.40<0.0014.830.0980.64
| C F L 5 S 1 C F L 5 S 1 S t a n d i n g | [N]1 vs. 20.0620.520.8500.230.0030.86
1 vs. 3<0.0013.650.1050.64<0.0013.09
2 vs. 3<0.0013.130.0780.81<0.0012.62
Lower Model S F L 5 S 1 [N]1 vs. 20.0010.940.0130.640.0010.85
1 vs. 3<0.0014.82<0.0015.22<0.0012.51
2 vs. 3<0.0014.06<0.0014.39<0.0011.98
S F L 5 S 1 , Norm [N/kg]1 vs. 20.0011.180.0140.680.0021.08
1 vs. 3<0.0015.06<0.0014.590.0022.25
2 vs. 3<0.0012.25<0.0012.290.0011.21
| S F L 5 S 1 S F L 5 S 1 S t a n d i n g | [N]1 vs. 20.0010.750.0060.540.0010.77
1 vs. 3<0.0014.44<0.0014.52<0.0012.45
2 vs. 3<0.0013.72<0.0013.59<0.0011.93
Upper Model S F L 5 S 1 [N]1 vs. 20.0020.930.0110.550.0340.91
1 vs. 3<0.0013.92<0.0015.400.0021.52
2 vs. 3<0.0012.23<0.0014.520.0060.73
S F L 5 S 1 , Norm [N/kg]1 vs. 20.0011.150.0140.660.0191.04
1 vs. 3<0.0012.67<0.0014.060.0221.14
2 vs. 3<0.0011.23<0.0012.520.3880.35
| S F L 5 S 1 S F L 5 S 1 S t a n d i n g | [N]1 vs. 20.0020.830.0070.480.0320.90
1 vs. 3<0.0013.59<0.0015.190.0021.53
2 vs. 3<0.0012.24<0.0013.720.0060.77
Disclaimer/Publisher’s Note: The statements, opinions and data contained in all publications are solely those of the individual author(s) and contributor(s) and not of MDPI and/or the editor(s). MDPI and/or the editor(s) disclaim responsibility for any injury to people or property resulting from any ideas, methods, instructions or products referred to in the content.

