


Wind Turbine Performance Evaluation Method Based on Dual Optimization of Power Curves and Health Regions

Abstract
:1. Introduction
1.1. Modeling of Wind Power Curves
- Binning Method for Wind Power Curve Modeling.
- Yang Mao et al. introduced a modeling approach using the binning method to articulate the relationship between wind velocity and generated power, examining the variability in modeling errors across different wind speed segments [1]. Similarly, Peng Lin et al. undertook a comparative analysis among the maximum value, maximum probability, and binning methods for modeling wind power curves. They highlighted the binning method’s closer alignment with real-world turbine operations based on empirical data [2]. In addressing challenges posed by deterministic turbine output models’ inability to precisely characterize statistical features of wind energy production, Chen et al. refined power data analysis using an enhanced binning technique and data fitting processes to mitigate data interference [3]. Likewise, to accurately quantify production losses in individual turbines, Zhan et al. devised the GD-BIN method (Gaussian distribution and bins), creating a wind power curve model that accurately reflects each turbine’s efficiency [4]. The GPR class method necessitates the random sampling of historical data for each prediction, resulting in high computational demands and reduced prediction stability [5].
- Polynomial Fitting for Wind Power Curve Modeling.
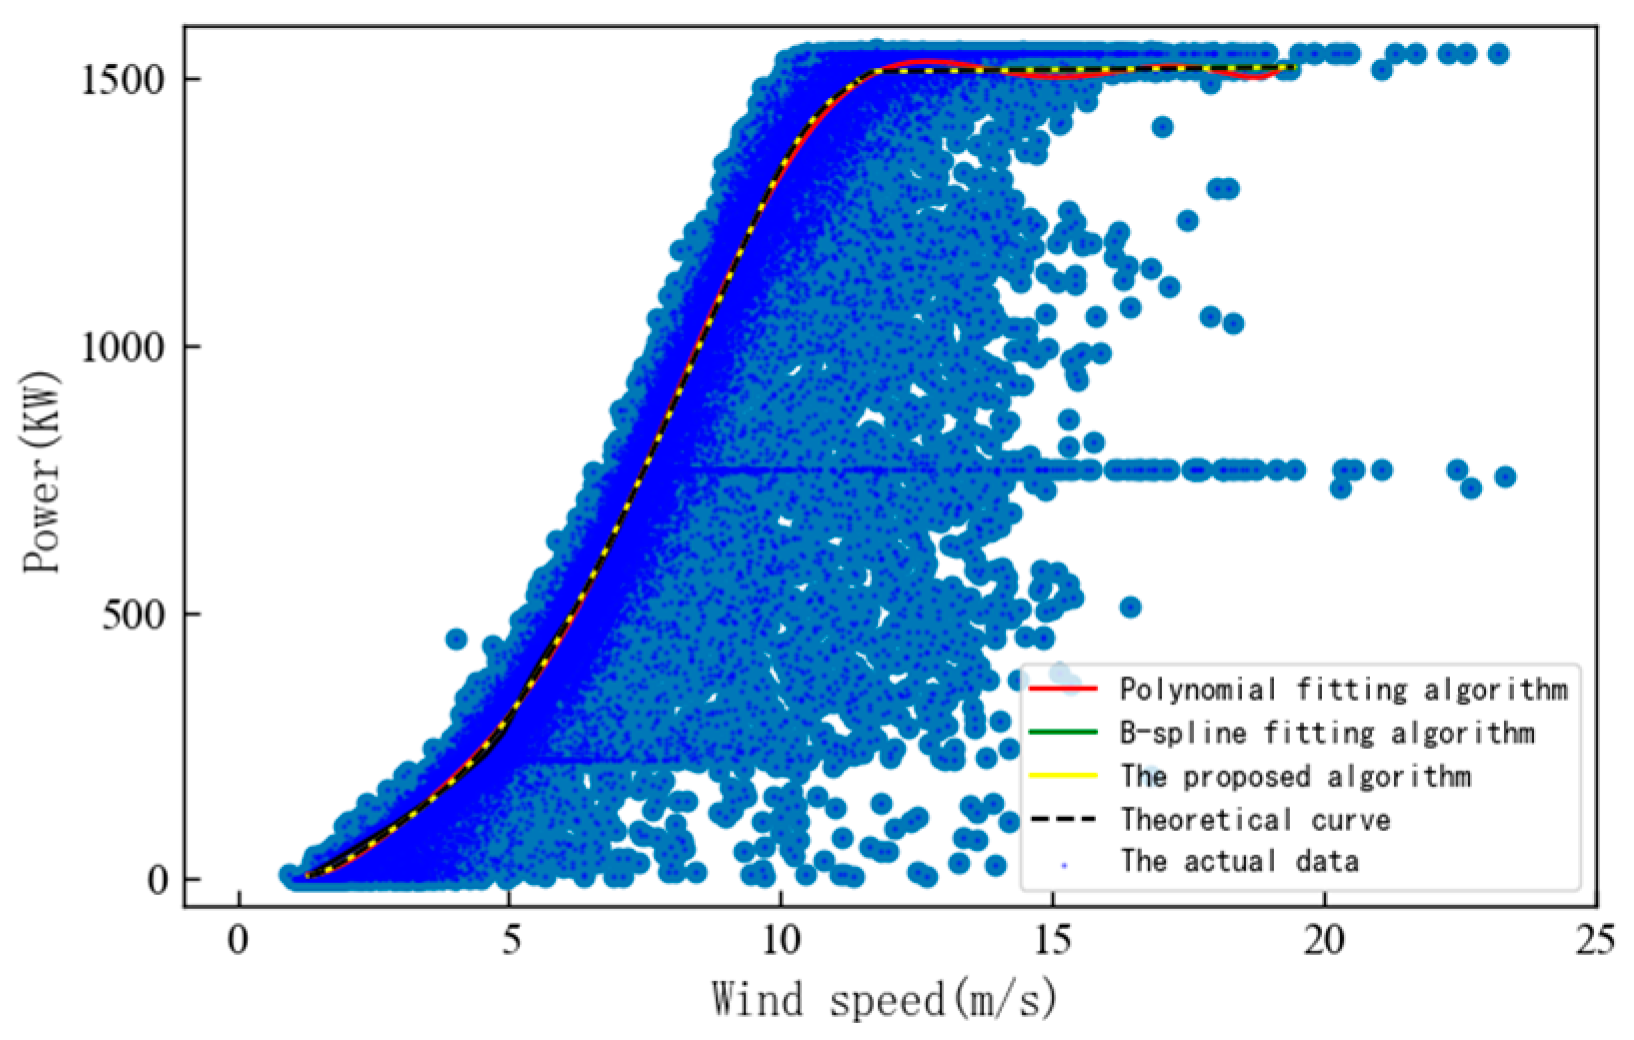
- Engaging with power curve data selection and fitting processes, researchers employed advanced polynomial and logistic function fitting algorithms for wind speed–power curve modeling after data refinement. Comparative evaluations of model accuracy and efficiency revealed that polynomial fitting, with its straightforward principle, rapid fitting capability, and commendable accuracy, is well-suited for practical power curve modeling tasks [6,7]. Xu et al. proposed an optimized local polynomial regression technique to develop an adaptive robust model for time-variant scatter power curves, aimed at enhancing predictive accuracy [8]. Through linear least squares, Wang et al. assessed various polynomial regression models, identifying those offering superior approximations for diverse wind speed distributions [9].
- B-Spline Fitting for Wind Power Curve Modeling.
- Recent scholarly efforts have also embraced B-spline fitting for curve modeling. Research documented in [10] applied the Iteratively Reweighted Least Absolute Shrinkage and Selection Operator (Lasso) for complex autoregressive modeling with periodic B-splines, accommodating diurnal and annual variations. Investigating four curve fitting approaches, ref. [11] advanced discussions on polynomial fitting by introducing methodologies such as local weighted polynomial fitting, cubic spline fitting, and cubic B-spline curve fitting to elevate fitting precision and adaptability. An innovative wind power curve modeling technique, employing enhanced smooth splines for wind speed–power data fitting, was outlined in [12]. This approach utilized cubic splines for data approximation and applied a roughness penalty for coefficient regularization, with cross-validation determining the optimal smoothing parameters. Addressing the modeling and optimization challenges in small-sample scenarios with complex mixed-type parameter interactions, ref. [13] proposed a novel strategy integrating Gaussian process regression with B-spline curves. This method constructed a functional parameter model through a weighted combination of B-spline-based functions and control points, followed by a genetic algorithm for model optimization.
1.2. Evaluation of Wind Turbine Performance Utilizing Wind Power Curves
- The incorporation of a regularization term within the least squares framework propels an enhanced segmented modeling optimization technique for the wind power curve via the refined PCF algorithm. This innovation addresses the challenges of curve–function disparities and the extensive duration required for model training, potentially affected by local optima, thereby paving new avenues in health performance curve modeling for turbines.
- Leveraging the proposed optimization algorithm for wind power curve modeling, this study devises an optimized approach to defining health regions grounded in data increment inflection points. This delineation fosters a solid foundation for the subsequent evaluation of turbine health performance.
2. Materials and Methods
2.1. An Enhanced Approach to Wind Power Curve Optimization via the Improved PCF Algorithm
2.1.1. The Binning Method
2.1.2. Adjustment of Power Outputs
2.1.3. Refinement of the PCF Algorithm
- PCF Algorithm Foundation:
- 2.
- B-Spline Fitting Algorithm
- 3.
- Regularized least squares
2.1.4. Evaluation Metrics for Wind Power Curve Modeling
2.2. Optimization Method for Wind Turbine Health Region Based on Data Increment Inflection Points
Delineation of Wind Turbine Performance Evaluation Region
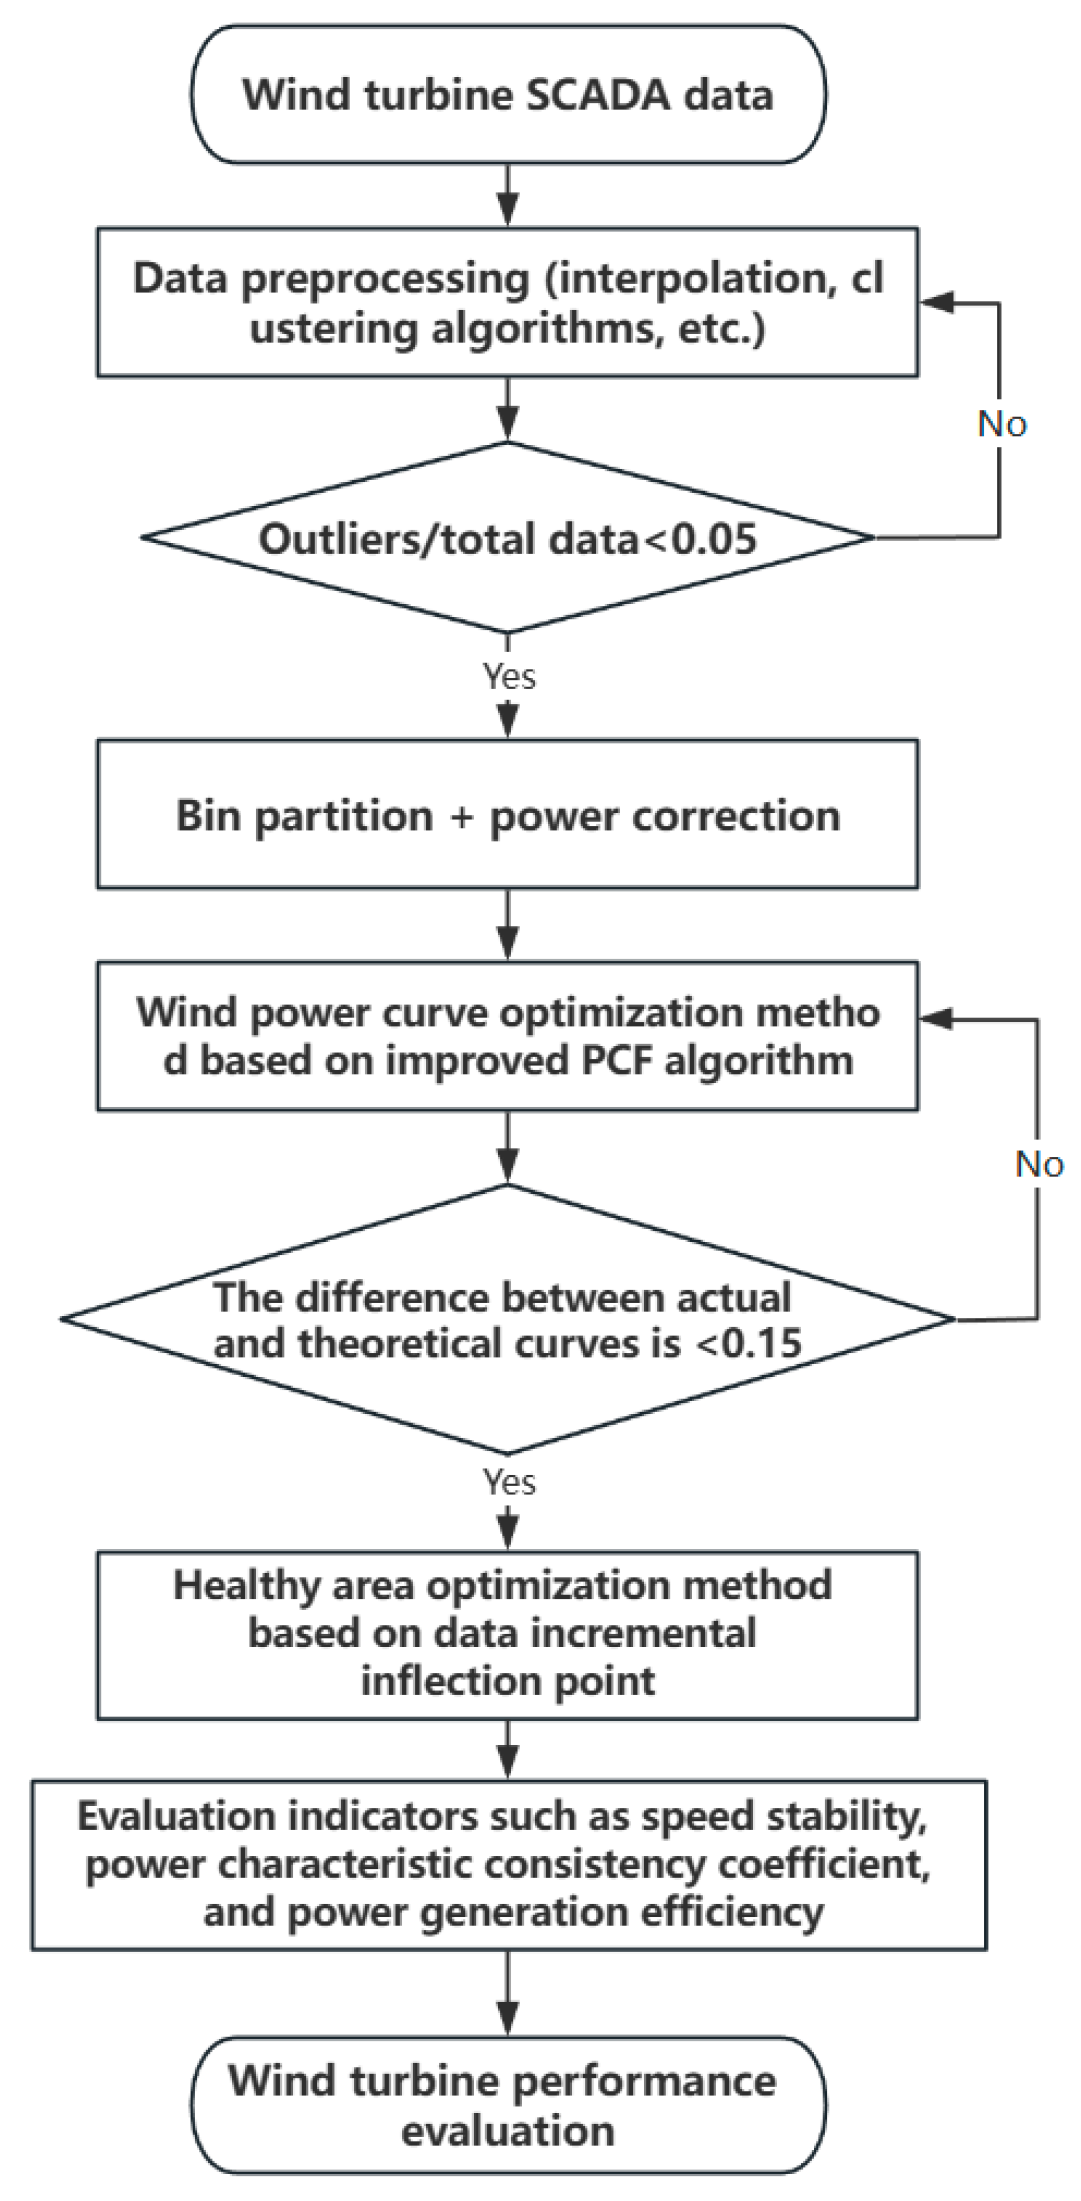
- After cleaning the original wind speed–power data using interpolation and clustering algorithms, the data are grouped into wind speed intervals of 0.5 m/s using the binning method, after sorting the wind speed–power data in ascending order. The average wind speed and power values within each interval, and , are calculated, resulting in data pairs .
- Power correction is applied to these data pairs .
- The improved PCF algorithm is used to fit these corrected data pairs into a static optimal power curve .
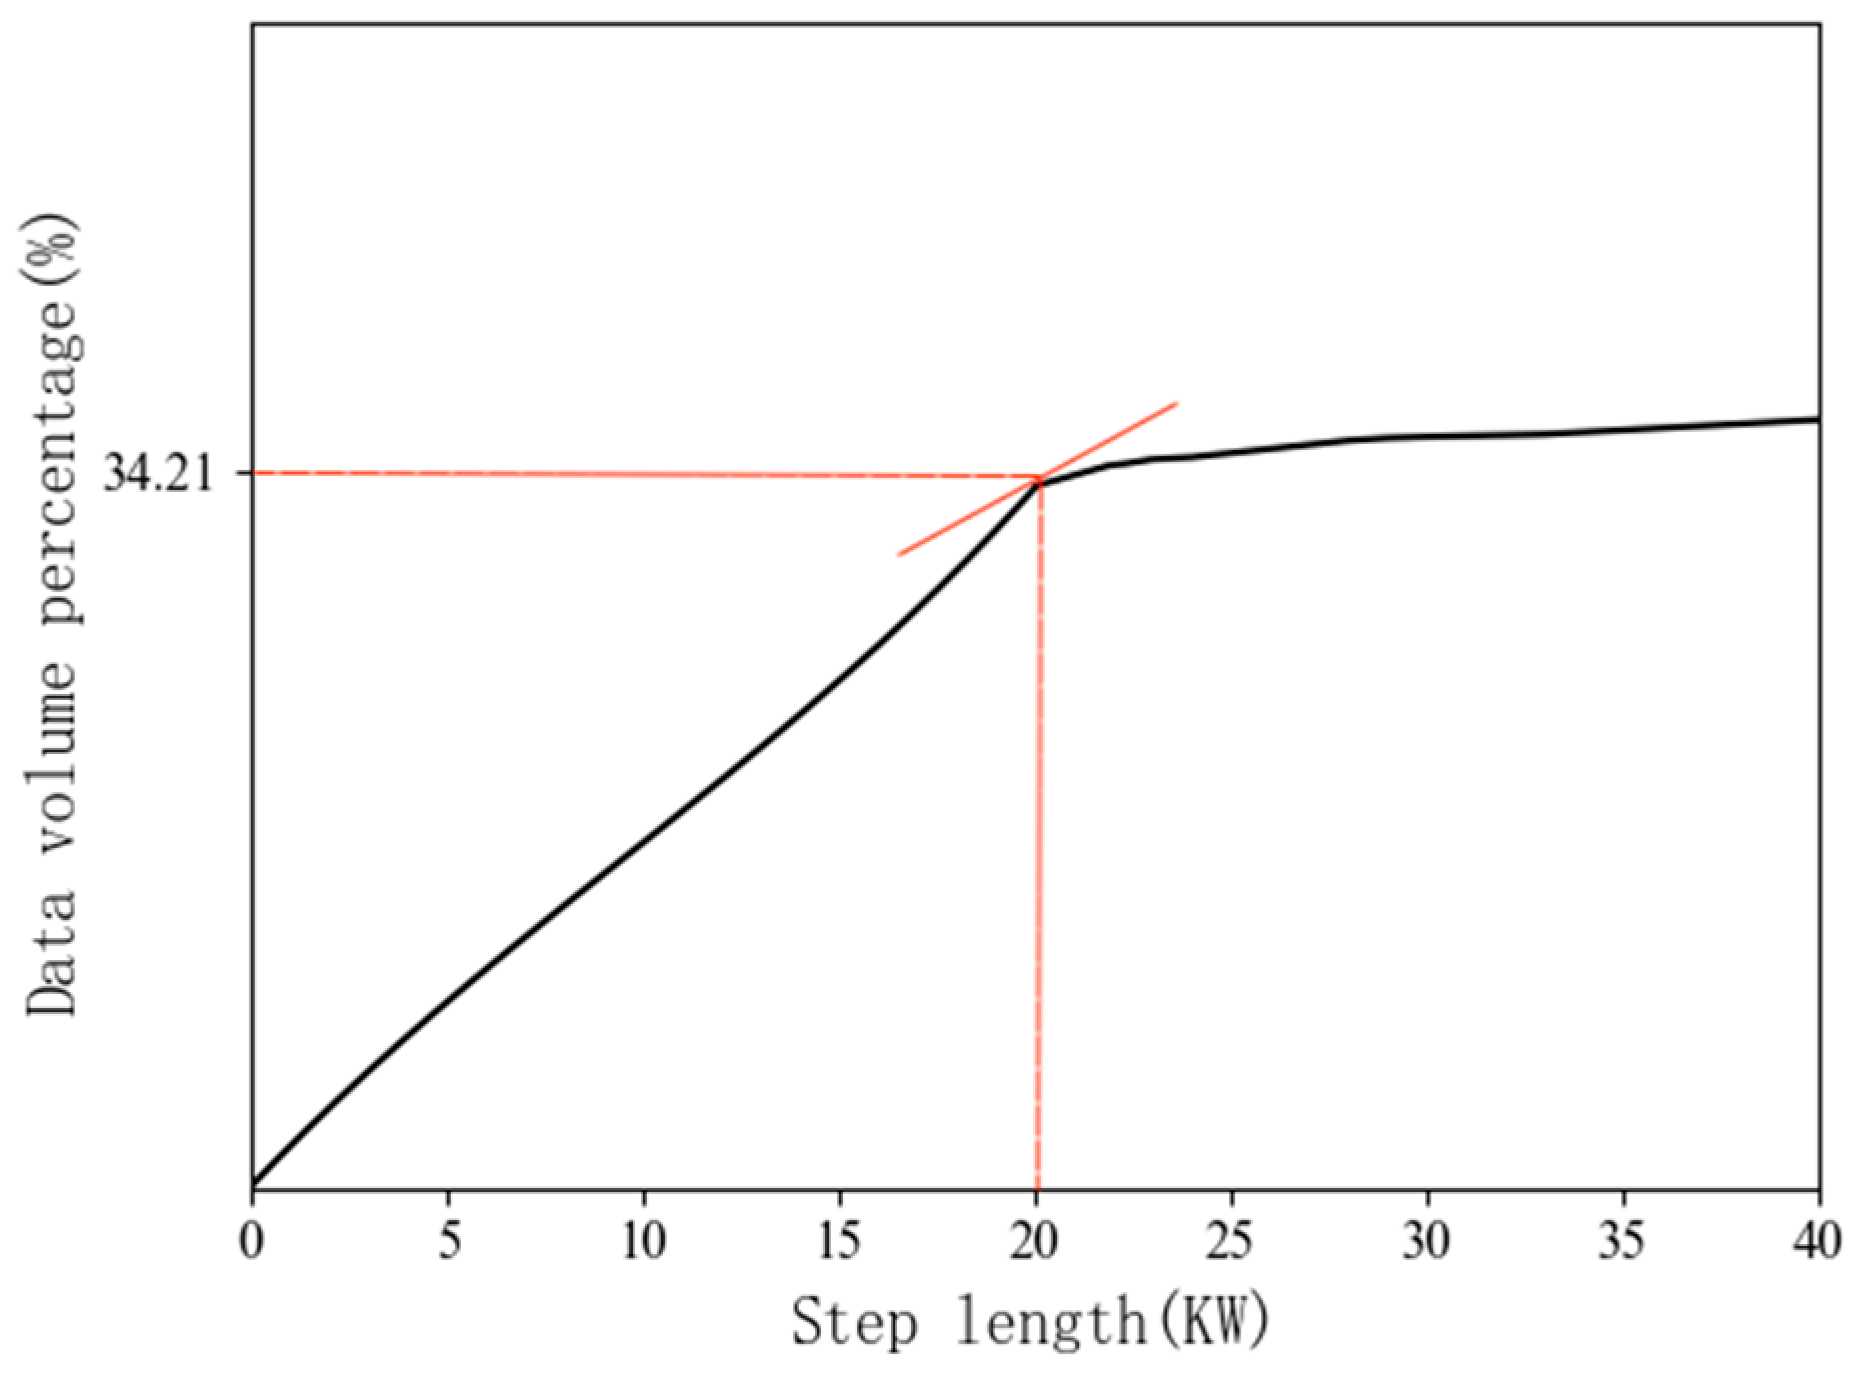
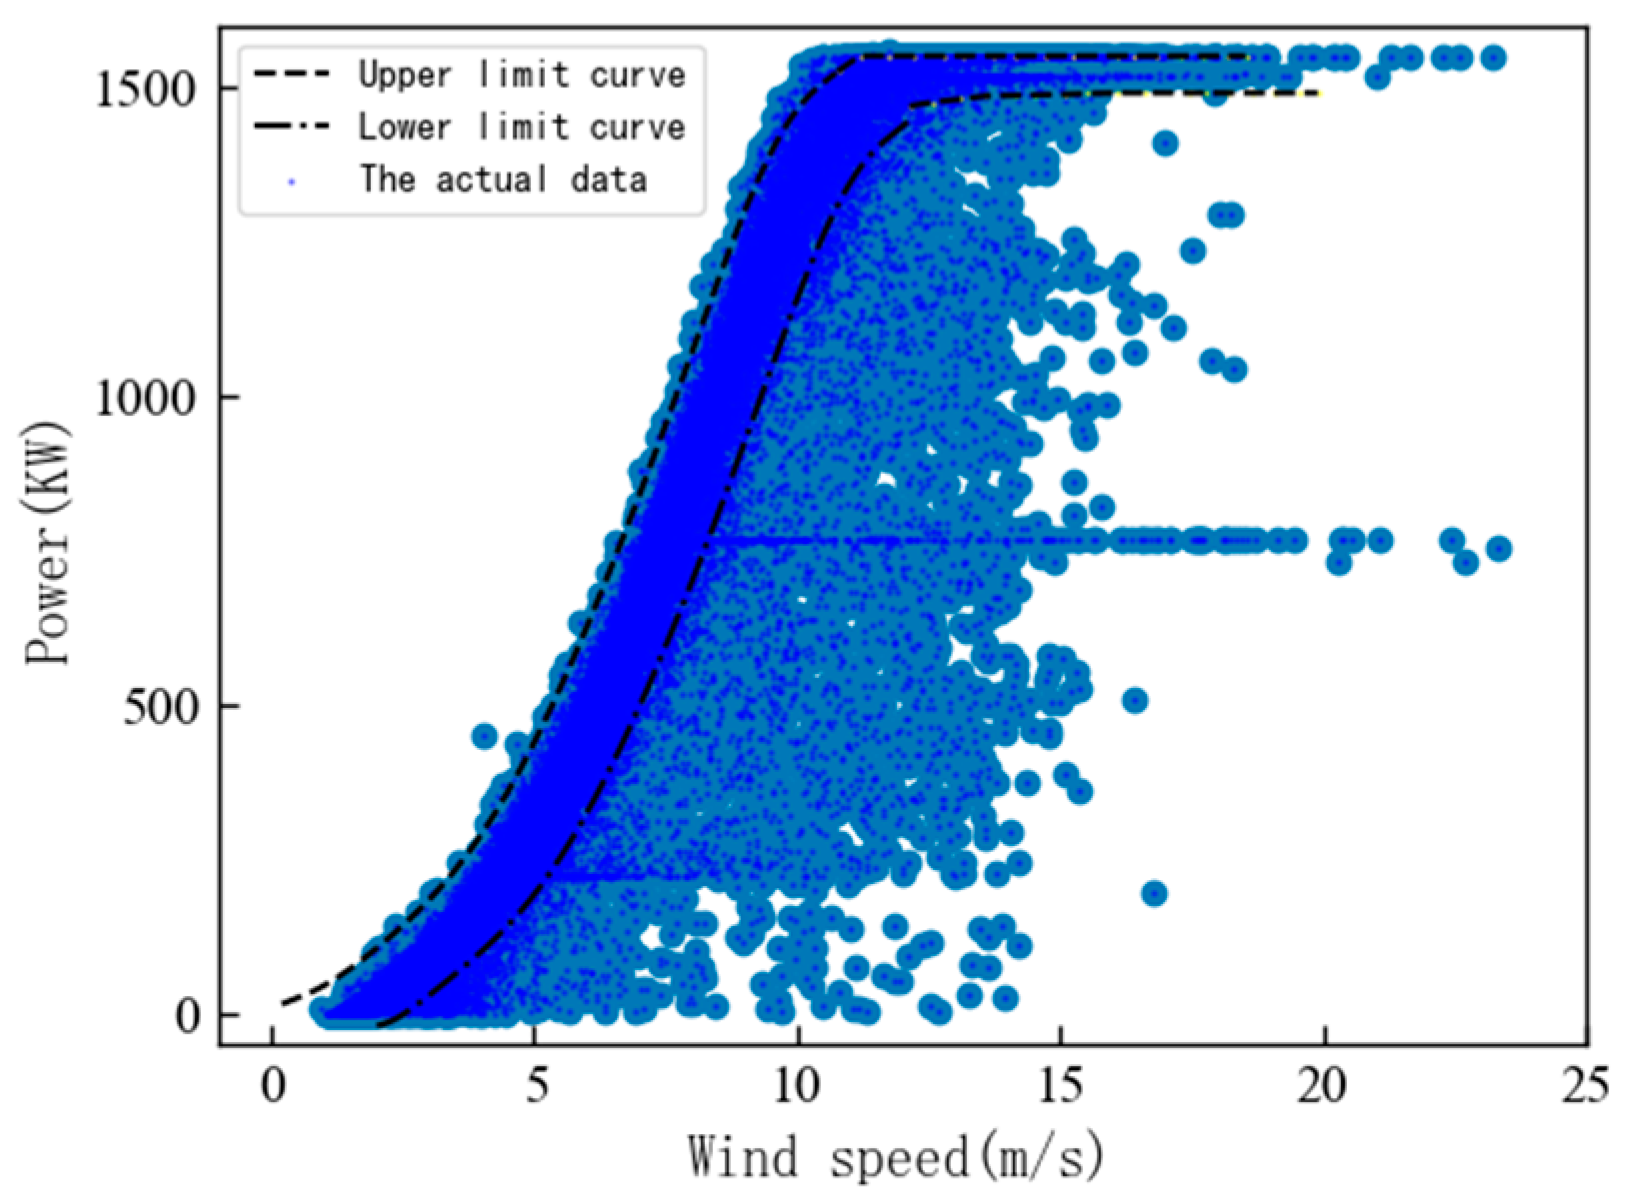
- The power curve obtained in the previous step is then moved horizontally (step size ) until the data volume percentage between the -times horizontally moved power curve and the static optimal wind speed–power curve shows its first inflection point on the slope curve. At this point, the movement stops, and the horizontal optimal upper (or lower) limit power curve is determined.
- The obtained horizontal optimal power curve is then moved vertically (step size ) until the data volume percentage between the n-th vertically moved power curve and the static optimal power curve reflects the effect demonstrated in the slope curve mentioned in step (4). At this point, the movement stops, and the vertical optimal upper (or lower) limit power curve is established.
- Rotational Speed Stability
- 2.
- Power Performance Coefficient (CP)
- 3.
- Efficiency of Power Generation
3. Discussion
3.1. Empirical Case Study and Analysis
3.1.1. Modeling of Wind Power Curves
3.1.2. Delineation of Wind Turbine Performance Evaluation Areas
- A turbine operating entirely within the healthy zone indicates normal performance status.
- If the actual power curve straddles the healthy zone and the anomaly zone, a comprehensive assessment is necessitated, factoring in indicators such as the rotational speed stability, power performance coefficient, and efficiency of power generation.
3.1.3. Wind Turbine Performance Evaluation
- Performance Evaluation Criteria
- 2.
- Evaluating Wind Turbine Performance
4. Conclusions
Author Contributions
Funding
Institutional Review Board Statement
Informed Consent Statement
Data Availability Statement
Acknowledgments
Conflicts of Interest
References
- Yang, M.; Dai, B. Error Analysis of Wind Speed-Power Curve Modeling in Wind Farms Based on the Binh Model. Autom. Electr. Power Syst. 2020, 40, 81–89. [Google Scholar]
- Lin, P.; Zhao, S.; Xie, Y.; Hu, Y. Modeling and Uncertainty Estimation of Wind Power Curve Based on Measured Data. Autom. Electr. Power Syst. 2015, 35, 90–95. [Google Scholar]
- Chen, S.; Guo, X.; Han, S.; Xiao, J.; Wu, N. A novel stochastic cloud model for statistical characterization of wind turbine output. IEEE Access 2020, 9, 7439–7446. [Google Scholar] [CrossRef]
- Zhan, Y.; Zhou, M.; Ren, D. Study and Application of Wind Turbine Power Loss Assessment based on GD-BIN Algorithm. IOP Conf. Ser. Mater. Sci. Eng. 2020, 782, 032075. [Google Scholar] [CrossRef]
- Chen, Z.H. Prediction of Remaining Useful Life of Electromechanical Actuators Based on Multimodal Transformer. Acta Armamentarii 2023, 44, 2920–2931. [Google Scholar]
- Xia, Q.; Lei, A.; Yan, Z.; Fenhua, L.; Hao, Z.; Jie, Y. Comparative study of multiple power curve modelling methods. Renew. Energy Resour. 2018, 36, 580–585. [Google Scholar]
- Cao, L.; Liu, W.; Guo, H. Cleaning and Modeling of Anomalous Data in Wind Farm Power Curves. J. Lanzhou Univ. Technol. 2022, 48, 64–70. [Google Scholar]
- Xu, M.; Pinson, P.; Lu, Z.; Qiao, Y.; Min, Y. Adaptive robust polynomial regression for power curve modeling with application to wind power forecasting. Wind Energy 2016, 19, 2321–2336. [Google Scholar] [CrossRef]
- Wang, L.; Liu, J.; Qian, F. Wind speed frequency distribution modeling and wind energy resource assessment based on polynomial regression model. Int. J. Electr. Power Energy Syst. 2021, 130, 106964. [Google Scholar] [CrossRef]
- Ziel, F.; Croonenbroeck, C.; Ambach, D. Forecasting wind power–modeling periodic and non-linear effects under conditional heteroscedasticity. Appl. Energy 2016, 177, 285–297. [Google Scholar] [CrossRef]
- Wang, F.; Liu, Y.; Cui, Q. Modeling and Optimization of Mixed-Type Parameters Based on Gaussian Process Regression. Stat. Decis. 2023, 39, 34–39. [Google Scholar]
- Liang, T.; Cui, J.; Shi, H.; Li, Z. Comparative Study on Modeling Methods of Wind Turbine Power Curve. Comput. Simul. 2021, 38, 62–66. [Google Scholar]
- Shen, X.; Fu, X. Modeling Method of Wind Turbine Power Curve Based on Improved Smooth Spline. High Volt. Eng. 2020, 46, 2418–2424. [Google Scholar]
- Zhang, P.; Xing, Z.; Guo, S.; Chen, M.; Zhao, Q. A New Wind Turbine Power Performance Assessment Approach: SCADA to Power Model Based with Regression-Kriging. Energies 2022, 15, 4820. [Google Scholar] [CrossRef]
- Zhan, J.; Wang, R.; Yi, L.; Wang, Y.; Xie, Z. Health assessment methods for wind turbines based on power prediction and mahalanobis distance. Int. J. Pattern Recognit. Artif. Intell. 2019, 33, 1951001. [Google Scholar] [CrossRef]
- Ansari, O.A.; Chung, C.Y. A hybrid framework for short-term risk assessment of wind-integrated composite power systems. IEEE Trans. Power Syst. 2018, 34, 2334–2344. [Google Scholar] [CrossRef]
- Zeng, T.; Liu, H.; Chen, H.; Wang, Z.; Chu, X. Wind Turbine Performance Evaluation Based on Multi-Feature Information Fusion. Comput. Integr. Manuf. Syst. 2022, 28, 1052–1061. [Google Scholar]
- Liu, Q.; Ma, H.; Chu, X.; Ma, B.; Wang, Z. Wind Turbine Performance Evaluation and Anomaly Detection Based on Long Short-Term Memory Autoencoder Neural Network. Comput. Integr. Manuf. Syst. 2019, 25, 3209–3219. [Google Scholar]
- Lin, T.; Zhang, L.; Cai, R.; Yang, X.; Liu, G.; Liao, W. Wind Turbine Performance Evaluation Based on Improved Fruit Fly Optimization Algorithm Optimized Support Vector Machine. Renew. Energy 2019, 37, 132–137. [Google Scholar]
- Li, D.; Zhang, H. Wind Turbine Performance Evaluation Based on Mutual Information Correlation of Wind Farm Big Data. Sci. Technol. Eng. 2018, 18, 211–215. [Google Scholar]
- Wan, S.; Wan, J.; Zhang, C. Wind Turbine Performance Evaluation Based on Grey Theory and Variable Weight Fuzzy Comprehensive Judgment. Acta Energiae Solaris Sin. 2015, 36, 2285–2291. [Google Scholar]
- Li, J.; Li, Y.; Wang, H.; Li, C. Health Performance Assessment and Prediction of Wind Turbine Units Based on XGBoost-Bin Automatic Power Limit Calculation [J/OL]. Computer Integrated Manufacturing Systems: 1–21. Available online: http://kns.cnki.net/kcms/detail/11.5946.tp.20220411.1552.028.html (accessed on 26 June 2024).
- Jiao, J.; Wen, Z. Assessment of Wind Turbine Performance Indicators Based on SCADA Data. Mod. Electr. Power 2020, 37, 539–543. [Google Scholar] [CrossRef]


| Modeling Method | NMAE | NRMSE | R2 | t/s |
|---|---|---|---|---|
| Polynomial fitting | 0.023 | 0.029 | 0.991 | 0.91 |
| B-spline fitting | 0.019 | 0.026 | 0.995 | 0.93 |
| This article’s algorithm | 0.016 | 0.021 | 0.998 | 0.92 |
Disclaimer/Publisher’s Note: The statements, opinions and data contained in all publications are solely those of the individual author(s) and contributor(s) and not of MDPI and/or the editor(s). MDPI and/or the editor(s) disclaim responsibility for any injury to people or property resulting from any ideas, methods, instructions or products referred to in the content. |
© 2024 by the authors. Licensee MDPI, Basel, Switzerland. This article is an open access article distributed under the terms and conditions of the Creative Commons Attribution (CC BY) license (https://creativecommons.org/licenses/by/4.0/).
Share and Cite
Guan, Q.; Han, J.; Geng, K.; Jiang, Y. Wind Turbine Performance Evaluation Method Based on Dual Optimization of Power Curves and Health Regions. Appl. Sci. 2024, 14, 5699. https://doi.org/10.3390/app14135699
Guan Q, Han J, Geng K, Jiang Y. Wind Turbine Performance Evaluation Method Based on Dual Optimization of Power Curves and Health Regions. Applied Sciences. 2024; 14(13):5699. https://doi.org/10.3390/app14135699
Chicago/Turabian StyleGuan, Qixue, Jiarui Han, Keying Geng, and Yueqiu Jiang. 2024. "Wind Turbine Performance Evaluation Method Based on Dual Optimization of Power Curves and Health Regions" Applied Sciences 14, no. 13: 5699. https://doi.org/10.3390/app14135699
APA StyleGuan, Q., Han, J., Geng, K., & Jiang, Y. (2024). Wind Turbine Performance Evaluation Method Based on Dual Optimization of Power Curves and Health Regions. Applied Sciences, 14(13), 5699. https://doi.org/10.3390/app14135699