Abstract
Ground Penetrating Radar (GPR) is a non-destructive geophysical technique utilizing electromagnetic pulses to detect subsurface material properties. The analysis of regions of interest (ROIs) in GPR images often entails the identification of hyperbolic reflection regions of underground targets through accurate segmentation, a crucial preprocessing step. Currently, this represents a research gap. In the hyperbolic reflection region, manual segmentation not only demands professional expertise but is also time-consuming and error-prone. Automatic segmentation can aid in accurately determining the location and depth of the reflection region, thereby enhancing data interpretation and analysis. This study presents a deep residual Convolutional Neural Network (Res-CNN) that integrates skip connections within an encoder-decoder framework for ROI-binarized hyperbolic segmentation. The proposed framework includes designed downsampling and upsampling modules that facilitate feature computation sharing between these two modules through skip connections within network blocks. In the evaluation of both simple and complex models, our method attained PSNR, SSIM, and FSIM values of 57.1894, 0.9933, and 0.9336, and 58.4759, 0.9958, and 0.9677, respectively. Compared to traditional segmentation methods, the proposed approach demonstrated clearer segmentation results, enabling intelligent and effective identification of the ROI region containing abnormal hyperbolic reflection waves in GPR images.
1. Introduction
Ground Penetrating Radar (GPR), as a non-destructive, efficient, and convenient geophysical detection instrument, has a wide variety of applications in urban infrastructure inspection [], urban road internal disease detection [], urban underground pipeline probing [], rebar recognition for tunnel secondary lining [], and identifying surrounding cracked rocks of underground caverns []. In different application scenarios, the ROIs of reflection hyperbola are difficult to identify quickly and accurately due to the different acquisition environments. In addition, strong noise interference will cover up the hyperbolic morphological characteristics in GPR images, making them difficult to visually discern. Currently, image segmentation offers a solution by delineating specific regions within an image, enabling pixels with similar features to be grouped together. This segmentation step typically precedes image target detection, providing shape, and structural features necessary for target identification []. Through image segmentation, specific target regions within the image can be identified and detected, allowing for the extraction of crucial regions for diagnosis.
In the GPR profile, the ROIs typically appear as hyperbolic regions, indicating potential burial sites for the target []. When GPR detects underground targets along the surface, the transmitting antenna emits high-frequency electromagnetic waves into the subsurface. If there is a dielectric contrast between the subsurface target and the background medium, a reflected wave is captured by the receiving antenna, forming the GPR records [].
Ideally, GPR images would only contain the airwave near the surface if there were no dielectric variations in the subsurface, without reflections from the deep underground targets. However, single-point anomalies or cylindrical scattering in the subsurface, such as pipes, cables, isolated rocks and voids, exhibit distinct hyperbolic characteristics in the GPR record []. As typically only a relatively small area of the radargram contains useful reflections corresponding to targets, segmenting and detecting these hyperbolic regions is crucial to reducing the dataset dimensions, thus alleviating the computational burden during later processing [].
Currently, many researchers have adopted various signal and image processing methods to detect hyperbolic ROIs. In the signal feature transform domain, Zhang et al. [] developed a coherence analysis (CA) framework for extracting GPR diffractions, potentially improving imaging resolution and thereby facilitating a delicate GPR data processing. Zhao et al. [] incorporated a local plane-wave destruction filter with an online dictionary learning algorithm for individually separation and imaging of GPR diffractions, particularly effective for subsurface small-scale buried targets. Li et al. [] employed wavelet denoising and gamma transformation to suppress the complex background noise and build a multi-scale image brightness and orientation feature pyramid model to enhance abnormal ROI features.
In terms of image processing techniques, Torrione et al. [] explored the histogram of oriented gradients (HOG) for landmine detection in GPR data, optimally extracting locations of interest for target identification and classification. Okay et al. [] calculated density, threshold, and derivation values in GPR images to detect profiles with anomalies and visualize them. Dou et al. [] applied the column-connection clustering (C3) algorithm to cluster ROIs after thresholding from the background of GPR images, identifying hyperbolic signatures. Ocaña-Levario et al. [] applied the variance filter to the raw GPR image, followed by iterative segmentation based on selected ranges, facilitating feature display in water leak GPR images to highlight the anomaly area of interest.
However, due to the complex detection environment and reflection clutter, image processing technologies based on threshold and clustering methods are effective for single anomaly processing, but inadequate for detecting multi-object reflection anomalies, resulting in low detection efficiency.
The diversification of GPR acquisition scenarios necessitates the quick processing of large volumes of raw GPR data. Typically, only a small fraction of collected data represent useful information (i.e., target data), while the majority is considered redundant in a typical GPR survey []. Simplifying images and focusing on abnormal ROIs can be achieved through image binarization, a common image processing technique separating foreground objects from the background. This simplification reduces data volume, highlights target contours, and lays the groundwork for future target detection and identification [].
Determining an appropriate threshold is crucial for proper imaging in GPR. A higher threshold may exclude important detail, while a lower threshold may include noise, leading to clutter []. Several scholars have conducted relevant studies addressing these considerations. Li et al. [] processed the radargrams by edge extraction using the Sobel operator, evaluating the randomized Hough transform (RHT) algorithm for tree root recognition in GPR images. Bugarinović et al. [] utilized the Canny edge detector as the initial stage of APEX (Automated Point Extraction from Radargrams) for automated hyperbolic reflection detection. Altin et al. [] implemented Otsu thresholding and Hough transformation for soil plane extraction in GPR B scans. Shahrabi et al. [] employed the canny edge detection method for hyperbolic reflection detection as a processing step, reducing bulk image data to representative points and lines.
Traditional image segmentation methods have limitations, including applicability to simple image models, sensitivity to complex backgrounds and noise, and a lack of self-adaptation to images, resulting in poor robustness. Consequently, traditional methods struggle to yield satisfactory results in various applications of GPR B scan data processing, hindering efficient analysis of GPR profiles.
While GPR data collection efficiency is high, processing and interpreting abnormal regions pose a bottleneck in technology development. Manual analysis remains the primary method for interpreting GPR images, relying on expert knowledge and being relatively slow. Hence, enhancing abnormal region recognition efficiency in GPR detection and achieving intelligent extraction of abnormal regions are crucial research issues.
Recently, deep learning has achieved remarkable success in natural image segmentation and detection. Efforts in GPR image processing based on deep convolutional networks aim to improve hyperbolic ROI detection efficiency. Several studies have explored deep learning methods for various tasks in GPR analysis. Lameri et al. [] proposed an algorithm for landmine detection using convolutional neural networks to analyze GPR B-scan images. They evaluated all patches of the B-scan image and detected objects by thresholding values. Picetti et al. [] introduced a landmine detection method based on convolutional autoencoders applied to GPR B-scans. This method showed promising performance compared to previous CNN-based approaches. Zhang et al. [] presented a Generative Adversarial Network (GAN)-based model to generate realistic GPR B-scan data. They also developed a single-stage object detection model using deep learning to automatically detect hyperbolas in GPR B-scan images. Özkaya et al. [] proposed a method based on residual CNN and Bi-LSTM models for predicting GPR type, soil type, and scanning frequency automatically. This method demonstrated high performance in specific GPR image analysis tasks. Liu et al. [] utilized a Single Shot Multibox Detector (SSD) model to identify ROIs containing hyperbolas in GPR images. They then transformed each target region into a binary image to locate rebar. Hou et al. [] improved the Mask Region-based Convolutional Neural Network (R-CNN) by incorporating a novel distance-guided intersection over union (DGIoU) method to detect and segment object signatures in GPR scans. Markovic et al. [] demonstrated the application of a deep semantic segmentation model to separate diffraction signals from the rest of the wavefield in GPR data, effectively delineating complete-shaped diffraction signals and recognizing weaker and incomplete ones.
While these deep learning methods on GPR images have improved the efficiency of anomaly detection of underground targets, there is little literature on the application of deep neural networks to GPR image segmentation. Furthermore, GPR models are data-driven and require large amounts of hand-labeled data for training. The lack of different types of typical GPR anomaly labeled data also limits the implementation of image segmentation algorithms in GPR images. This presents an opportunity for researchers to broaden the segmentation method’s applicability to GPR images. By utilizing a deep convolutional network framework for image segmentation for GPR, it can partition multiple distinct reflection hyperbola targets in GPR images into binarized ROIs, enhance the stability of the segmentation method across various GPR images, and eliminate reliance on skilled operators in the GPR post-processing phases.
The paper proposes an advanced approach utilizing a lightweight deep Res-CNN with skip connections based on the encoder-decoder framework for ROIs hyperbolic segmentation, aiming to simplify GPR profiles and identify significant ROIs. This framework effectively segments reflection hyperbolas in GPR data, obtaining binary features of anomalous reflection hyperbolas. Compared to traditional methods, this approach swiftly separates the anomalous reflection hyperbola from the backgrounds in massive GPR data, enhances the ROIs, and yields better preprocessing result across different target materials.
The paper is structured as follows: In Section 2, an introduction to GPR data binarization preprocessing and the proposed methods for binarizing ROIs hyperbolic region is provided, followed by detailed implementation descriptions. In Section 3, the model training dataset is introduced, and experimental testing and analysis are performed on simple models, complex scenarios, and field data. Discussion In Section 4, it focuses on the analysis of research results, the limitations of the methods, and future research directions. Conclusion In Section 5, the key findings and implications of the study are summarized.
2. Materials and Methods
2.1. GPR Data Binarization Preprocessing
The proposed algorithm flowchart is shown in Figure 1. In the GPR data binarization preprocessing step, due to the complexity of the underground medium, electromagnetic waves will be attenuated when propagating in the medium, and hyperbolic features are usually not obvious in the GPR raw data. While the airwave is a wavelet emitted by the GPR antenna without underground target reflection, it is directly propagated in the air from the transmitting antenna to the receiving antenna. Its strong energy will also interfere with the reflected echo signal of the target. Therefore, the influence of the airwave must be eliminated. Due to the small variation of airwaves across different measurement positions, each trace has the average trace over a moving average window subtracted from it to eliminate the airwave.
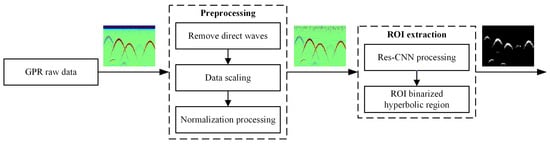
Figure 1.
ROI-binarized hyperbolic region extraction algorithm flowchart in GPR raw data.
For GPR data without airwaves, resizing was conducted to 256 × 256 for data scaling, with a single-channel input representing the signal’s amplitude for normalization processing. After preprocessing, the GPR data are used for ROI extraction using our deep semantic segmentation model with a Res-CNN structure.
2.2. ROI-Binarized Hyperbolic Region
2.2.1. The Residual Convolutional Neural Network
The proposed deep Res-CNN architecture is illustrated in Figure 2. The Res-CNN is a kind of end-to-end learning network widely used in image segmentation that can integrate features of different scales to achieve better learning results. A convolutional neural network can extract low-level, intermediate, and high-level features. As the number of layers increases, features at different levels can be extracted. The deeper the network, the more abstract the features extracted. But simply adding depth can lead to gradient dispersion or a gradient explosion. Therefore, a novel Res-CNN has been proposed, which combines the characteristics of skip connections and residual structure to extract the ROI-binarized hyperbolic region in the GPR profile, facilitating the quick separation of reflected waves from the GPR background profile and simplifying the GPR profile.
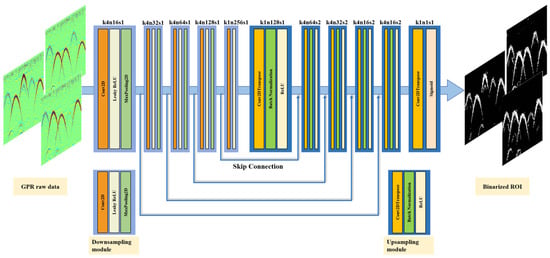
Figure 2.
The sketch of the Res-CNN structure used for ROI-binarized hyperbolic region extraction. Res-CNN structure with corresponding kernel size (k), number of feature maps (n), and stride (s) indicated for each convolution layer.
As shown in Figure 2, the proposed Res-CNN architecture consists of an encoding process, a decoding process, and an output process. The encoding process consists of five downsampling modules; each downsampling module consists of a convolutional layer, a LeakyReLU activation function layer, and a MaxPooling layer (the last downsampling module does not contain) to achieve dimensionality reduction in GPR input data. The downsampling module includes a convolution layer with small 4 × 4 kernels, increasing feature maps from 16 to 256 by a factor of 2, and a LeakyReLU activation with a negative slope coefficient (α = 0.2) and a max-pooling with 2 × 2 filters and stride 2. The decoding process is made up of five upsampling modules; each upsampling module is made up of a transposed convolution layer, a Batch Normalization layer, and a ReLU activation function layer to recover GPR data. Between the downsampling module and the upsampling module, a skip connection is used to overcome the problem of vanishing or exploding gradients when the number of convolutional layers increases and can use features learned from earlier layers in deeper layers. The skip connections involve skipping some of the layers in the neural network and feed the output of one layer as the input to the next layers. The layers in the encoder part are connected with skip connections and concatenated with layers in the decoder part. This enables the Res-CNN to use fine-grained details learned in the encoder part to construct an image in the decoder part. Finally, the output process contains a transposed convolution layer and a sigmoid activation function layer to obtain the extraction of ROI-binarized hyperbolic regions in the GPR profiles.
In our network architecture, three activation functions are used, respectively. The leaky rectified linear unit, or Leaky ReLU, is a type of activation function based on a ReLU, but it has a small slope for negative values instead of a flat slope. It is adopted to prevent the degradation problem of losing neuron information caused by the negative value in the downsampling module and accelerate convergence. The rectified linear activation unit (ReLU) is used as a default activation function to recover data since the negative values are not involved in the upsampling module in CNNs. The sigmoid activation function takes input and maps the resulting values between 0 and 1 for binary classification in the output process. In addition, skip connections are introduced to cascade the layers in the downsampling module with the upsampling module. The design allows information to flow more freely and preserves the details and semantic information in the original input data. This makes it easier for information to spread to subsequent levels and avoids information loss. A batch normalization layer is added to the upsampling module to overcome the problem of slow convergence due to discontinuous data distribution. Meanwhile, it keeps the input of each layer of the neural network in the same distribution and makes training deep network models easier and more stable.
2.2.2. Loss Function Optimization and Evaluation
The training process of convolutional neural networks is essentially a process of minimizing loss functions. In this paper, we use the binary cross-entropy function as the loss function, defined as follows:
where is the binary label (1 for positive points and 0 for negative points), and is the predicted probability of the point being positive for all points. In a deep learning network, the binary cross entropy (also known as logarithmic loss or log loss) is a commonly used loss function in particularly binary classification problems. It is designed to measure the dissimilarity between the predicted probability distribution and the true binary labels of a dataset. It penalizes predictions that are confident but wrong. In short, the binary cross entropy plays a crucial role in training models for binary classification by measuring how well the model’s predicted probabilities align with the true labels.
The optimization of the loss function adopts root mean square propagation (RMSProp), which uses a moving average to adaptively adjust the learning rate for each network training parameter. This algorithm is an extension of the stochastic gradient descent algorithm and the foundation of the Adam algorithm. One of the applications of RMSProp is the stochastic technology for mini-batch gradient descent. The updated equation can be performed as:
where is the moving average of squared gradients at time step , is the gradient of the cost function with respect to the weight, is the learning rate, and is the moving average parameter, is the parameters to be updated, and is a minimal parameter to prevent the denominator from being 0.
To evaluate ROI binarization hyperbola region extraction and avoid the subjectivity of results evaluation with the naked eye, three indicators, peak signal-to-noise ratio (PSNR), structural similarity index measure (SSIM) [], and feature similarity index measure (FSIM) [], were used for measurement. The equations are, respectively, as follows:
where
where is the root mean square error, is the image size, is the original image pixel value, is the image pixel value after extraction.
where , are the average value of the original image and the extraction image respectively, , are the variance of the original image and the extraction image, respectively. is the covariance between the original image and the extraction image. , , is the pixel value range.
where
where is all pixels of the original image, is the similarity score, and are constants, and and are gradients of the original image and the extraction image, respectively. is phase congruency. is the magnitude of the vector in position and scale . is a small positive constant, and is a local amplitude on scale .
3. Results
3.1. Model Training
The finite-difference time-domain (FDTD) algorithm is used to simulate different underground targets, generating GPR profiles that serve as training datasets for network training. For synthetic datasets, the ricker waveform with a center frequency of 400 MHz is employed to simulate both random medium models and homogeneous mediums, each measuring 5.0 m × 1.1 m. The size of our space grid was set to 0.005 m, and a total of 250 transmitting and receiving antennas were utilized to ensure adequate spatial resolution and coverage for our modeling process. The relative permittivity of the background is 9, and some small pores with a relative permittivity of 1 are distributed randomly in the random medium models. The model contains pipe anomalies of two materials: metal pipes and non-metallic pipes. The large pipe diameter is 0.2 m, the small pipe diameter is 0.15 m, and the pipe wall is 0.02 m. By varying the burial depth of the five pipes at the pipe position, a total of 500 datasets of simulated GPR pipe profiles were obtained under diverse conditions in two distinct media environments.
Due to the interference from background random media and the difference in reflected energy from metal pipes and non-metallic pipes, it is difficult to obtain a satisfactory ROI-binarized hyperbola region. To achieve this, the forward profile under the same anomaly model is utilized to extract the ROI-binarized hyperbola region. Subsequently, a set of data pairs is formed between the profiles obtained under the random medium and those under the homogeneous medium for the network model. Part of the training data are shown in Figure 3.
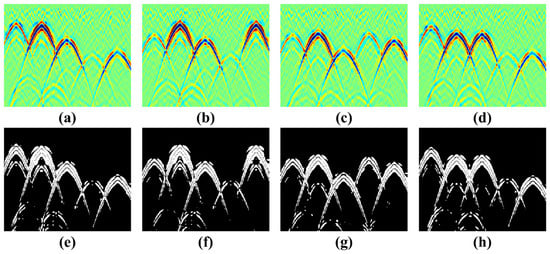
Figure 3.
The training data: the random medium results (a–d), and the ground truth of ROI-binarized hyperbolic region from homogeneous medium (e–h).
In this paper, the hyperparameters are set as follows: the learning rate and momentum . Additionally, the number of epochs is 500 times, and the batch size is 50. Figure 4 depicts the obtained loss function. It can be seen that the network has a quick convergence speed that eventually tends to be steady.
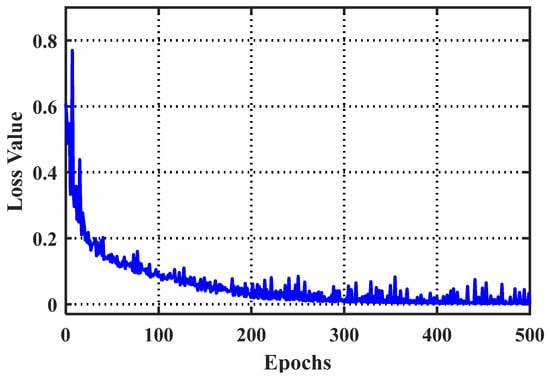
Figure 4.
Loss function curves of the model.
3.2. Model Testing of Simple Pipe Simulation
To test the effectiveness of the proposed method, a simple pipe model is designed as shown in Figure 5. The model size is 1.1 m × 5.0 m, with an air layer set to 0.1 m. The relative permittivity of the background is 9, and some small pores with a relative permittivity of 1 are randomly distributed in the medium models. Seven empty pipes with different material walls are distributed in the model, and the pipe parameters are shown in Table 1.
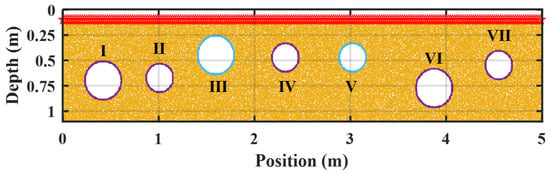
Figure 5.
Simple underground pipe model distribution.

Table 1.
FDTD models of different pipes parameters in a random medium.
The transmitting and receiving antennas move along the ground surface to collect data, as shown in the figure with the red stars. The forward simulation adopts the finite difference time domain algorithm, and the center frequency of the excitation source is 900 MHz. The special step of the forward model was set to 0.005 m in both the x and y directions. The time step was set to 0.01 ns, and the time window is 15 ns. The radargram obtained from the forward simulation result is shown in Figure 6a, and the GPR profile after preprocessing is shown in Figure 6b.
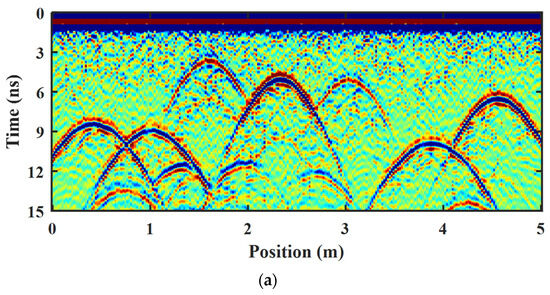
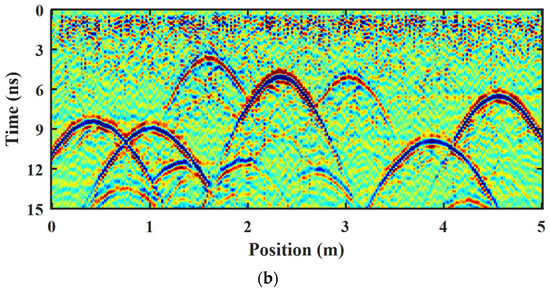
Figure 6.
Radargram from FDTD simulation of a pipe model in random media and its preprocessing result. (a) the forward simulation results; (b) the preprocessing results.
In the forward simulation results, the energy of the airwave is much larger than the energy required to obtain reflected waves from the underground pipe targets, and the stronger airwave will seriously affect our ROI-binarized hyperbolic region extraction. To eliminate the effect of air waves, the moving average method is employed to eliminate the horizontal arrivals in our preprocessing results. As shown in Figure 6b, seven different types of pipe reflection hyperbolas are well visualized during the forward simulation, and the diffraction waves and multiple waves from between pipes can be distinguished, but the energy of the target reflection hyperbola is weakened or even submerged due to the inhomogeneity of the background random medium. In order to simplify the GPR profile and extract the hyperbolic reflected waves of interest in the GPR profiles more quickly and efficiently, and to provide a good guiding relevance for the interpretation of the subsurface medium, the current popular image segmentation methods, namely the Otsu thresholding method and the K-means clustering segmentation method, are compared with our proposed Res-CNN method, as illustrated in Figure 7.
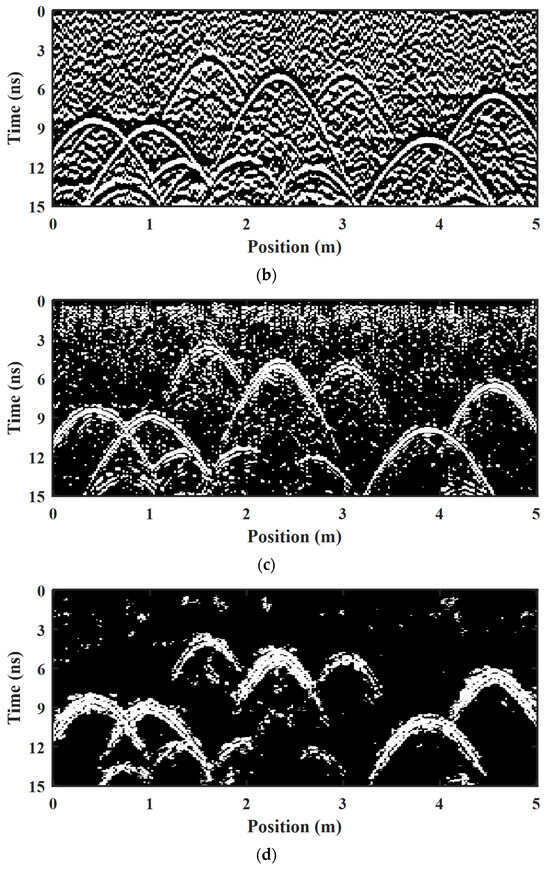
Figure 7.
ROI-binarized hyperbolic region extraction results with different methods. (a) Ground truth. (b) Otsu thresholding method with a threshold of 0.58. (c) K-means clustering segmentation method with 5 cluster centroid locations. (d) Our proposed Res-CNN method.
The. profile of interest obtained from the forward modeling results in a homogeneous medium that serves as the ground truth, as shown in Figure 7a. In Figure 7b, due to the random interference of the background random medium, the Otsu threshold method makes it difficult to search for a suitable threshold that minimizes the intraclass variance to achieve the separation of the hyperbolic region and the background in the GPR image and extracts the binarized ROIs. In Figure 7c, the K-means clustering segmentation method performs binary extraction on GPR images by selecting appropriate cluster centers. Compared with the Otsu threshold method, the background interference noise is significantly reduced, and the shape of the target hyperbolic reflection is better displayed. However, the hyperbola extraction of some diffraction waves and multiple wave types is affected by greater interference from the medium. In Figure 7d, the proposed Res-CNN method can obtain a better ROI in a binarized hyperbolic region. The hyperbolic reflections from different targets are clearer, and the background disturbances are less in the binarized profile. Deep diffraction waves and multiple-wave hyperbolas can also be effectively extracted. This enables improved interpretation and analysis of the target anomaly radar image with the binary profile.
The binarization outcomes of the GPR images using three evaluation criteria, namely PSNR, SSIM, and FSIM, are assessed to mitigate the subjectivity associated with visual inspection. The quantitative results are given in Table 2. In Table 2, across all metrics, including PSNR, SSIM, and FSIM, the Res-CNN method consistently outperforms the other methods, demonstrating superior reconstruction fidelity, similarity to ground truth, and feature preservation. Specifically, the Res-CNN method achieves the highest PSNR of 57.1894, the highest SSIM of 0.9933, and the highest FSIM of 0.9336, indicating its effectiveness and better performance in image segmentation tasks.
Table 2.
The results of three different quantitative evaluation methods in simple pipe simulation.
To evaluate the efficacy of a skip connection in training the proposed networks for GPR image segmentation, experiments were conducted with and without skip connections, while keeping the hyperparameters consistent. The trained model was used to binarized hyperbolic region extraction for GPR images, as shown in Figure 8. It is observed that the network architecture with a skip connection structure (Figure 7d) is more effective in capturing the morphology of the hyperbola region compared to the architecture without a skip connection structure (Figure 8). The performance of the network architecture with a skip connection structure is better at separating and characterizing the ROI binarization hyperbola region.
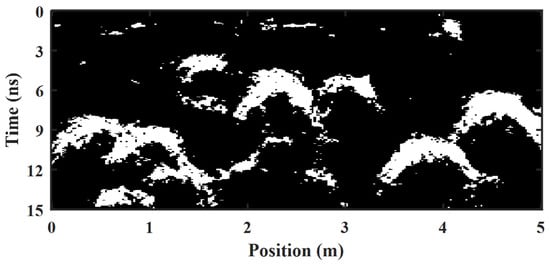
Figure 8.
ROI-binarized hyperbolic region extraction results from network architectures without a skip connection structure in simple pipe simulation.
3.3. Model Testing of Complex Scenarios
To further test the applicability of the method for extracting reflection waves in complex environments, a more complex pipe model with porous media was designed as shown in Figure 9, which is based on the field data collection at the test site in geophysical environment at IFSTTAR, Nantes, France []. The model size is 5 m × 13 m, and the top air layer is set to 0.1 m. The location of the excitation sources is shown by red stars. The permittivity and conductivity of the slope (gray) are 9 and 0.0001 S/m, respectively. In porous disturbance media, three layers of metal pipes with depths of 0.8 m, 1.5 m, and 2.2 m, respectively, with spacings of 0.5 m, 0.7 m, and 1 m, respectively, are buried. The radius of the pipes is 0.2 m.
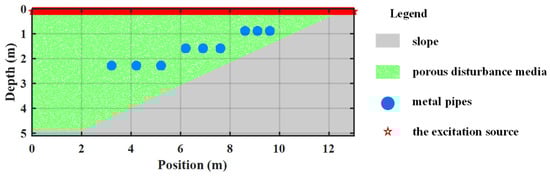
Figure 9.
Complex underground pipe model distribution.
The forward simulation adopts the finite difference time domain algorithm, and the center frequency of the excitation source is 400 MHz. The special step of the forward model was set to 0.01 m in both the x and y directions. The time step was set to 0.023 ns, and the time window is 57.5 ns. The radargram obtained from the forward simulation result is shown in Figure 10a, and the GPR profile after preprocessing is shown in Figure 10b.
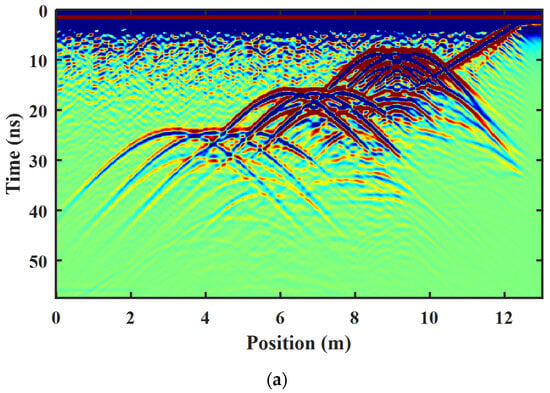
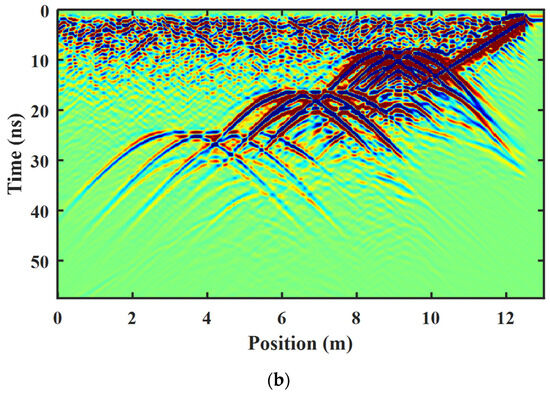
Figure 10.
Radargram from a more complex pipe model with porous media and its preprocessing result. (a) The forward simulation results; (b) the preprocessing results.
In the forward simulation results, the strong energy from the airwave and the interference of the background porous media can significantly affect ROI-binarized hyperbolic region. To reduce the effect of clutter on the target reflection, preprocessing methods are employed to enhance the quality of the image. As shown in Figure 10b, the three layers of pipe reflection regions on the slope are shown in turn. The three pipes near the surface experience overlapping of the reflected waves due to the small spacing, and the bottom pipeline has a lager spacing and more clear reflected hyperbolic branching regions.
To rapidly distinguish these ROIs from the background medium and simplify the GPR image to accentuate the characteristics of the reflected waves, three different segmentation methods are compared, as shown in Figure 11. A ground truth image is chosen as a reference, as depicted in Figure 11a. The Otsu thresholding method is affected by noise and leaves many background noises in Figure 11b, and the K-means clustering method suppresses the noise better, but the shape of the hyperbola is not clear enough in Figure 11c. Our proposed network segmentation method can both have good suppression of noise and extract a complete hyperbolic morphology in Figure 11d, showing that the algorithm has better robustness to complex reflections as well.
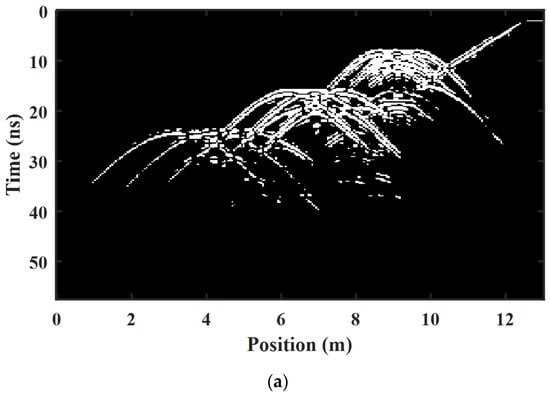
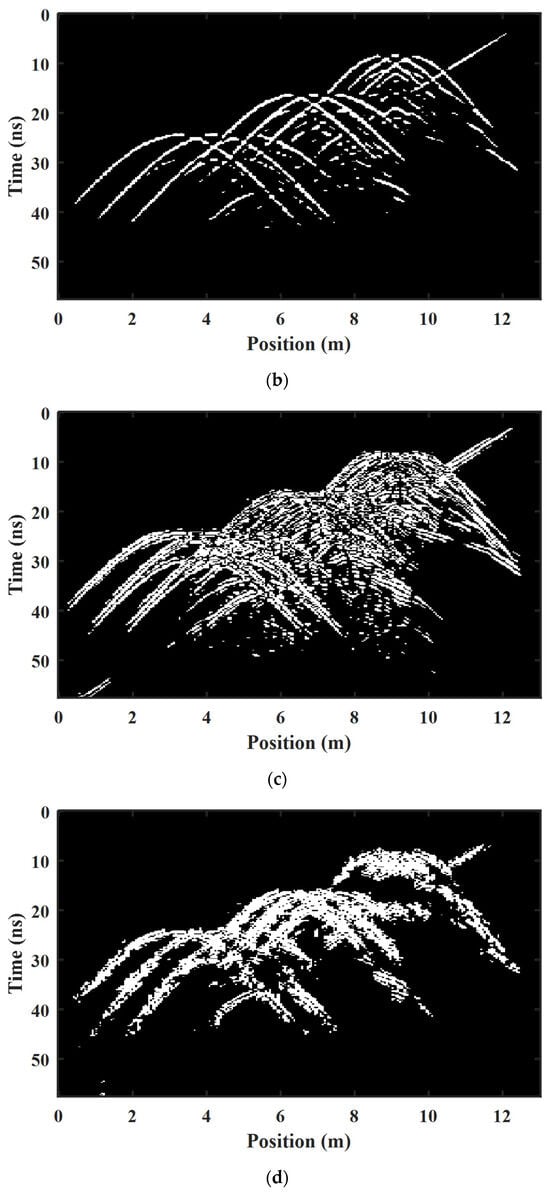
Figure 11.
ROI-binarized hyperbolic region extraction results with different methods. (a) Ground truth. (b) Otsu thresholding method with a threshold of 0.50. (c) K-means clustering segmentation method with 5 cluster centroid locations. (d) Our proposed Res-CNN method.
We also measure the binarization results of the GPR images using three evaluation criteria, namely PSNR, SSIM, and FSIM, to avoid the subjectivity of visual inspection, and the quantitative results are given in Table 3. In terms of PSNR, the Res-CNN method performs the best, reaching 58.4759, surpassing the Otsu threshold method (55.7984) and the K-means clustering segmentation method (58.0648). In terms of SSIM and FSIM, the Res-CNN method also outperforms, achieving 0.9958 and 0.9677, respectively, while the performance of the Otsu threshold method and the K-means clustering segmentation method is slightly lower. Based on these metrics, the Res-CNN method exhibits superior performance in image segmentation, demonstrating higher accuracy and robustness.
Table 3.
The results of three different quantitative evaluation methods in complex scenarios.
In addition, a comparison was conducted between the results of ROI binarization hyperbola region extraction for network structures with and without skip connections, as shown in Figure 12. In Figure 12, extracting a complete hyperbola morphology proves challenging when using a structure without skip connections. However, in Figure 11d, a clearer and more complete hyperbolic reflection feature can be observed. Nonetheless, it is noteworthy that the characterization in the second and third layers of the pipes appears clearer than that in the first layer. This difference may arise from the smaller spacing between the pipelines, leading to the three pipeline hyperbolas in the first layer capturing the rough reflection region without proper separation. Therefore, the convolutional neural network with a skip connection structure can enhance the transmission of information in the deep network structure and obtain better results.
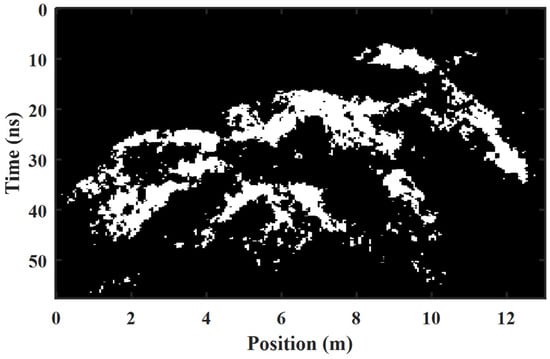
Figure 12.
ROI-binarized hyperbolic region extraction results from network architectures without a skip connection structure in complex scenarios.
3.4. Model Testing of Field Data
The field data collection was carried out at the test site in a geophysical environment at IFSTTAR, Nantes, France [] to demonstrate the effect of our proposed network on the binary extraction of ROIs. The Gneiss 14/20 gravel region was selected as the experimental location. Three layers of 2.5-meter-long pipes were buried at different depths, serving as the main reflector for data collection. The actual buried depths of each pipe can be referenced in the as-built report of this geophysical test site. SIR 4000 control unit with GSSI common offset antenna of nominal center frequency at 400 MHz was equipped for radargram acquisition. Figure 13a showcases the radargram acquired by a 400 MHz GPR, featuring clearly presented hyperbolic patterns. The GPR field profile after preprocessing is shown in Figure 13b.
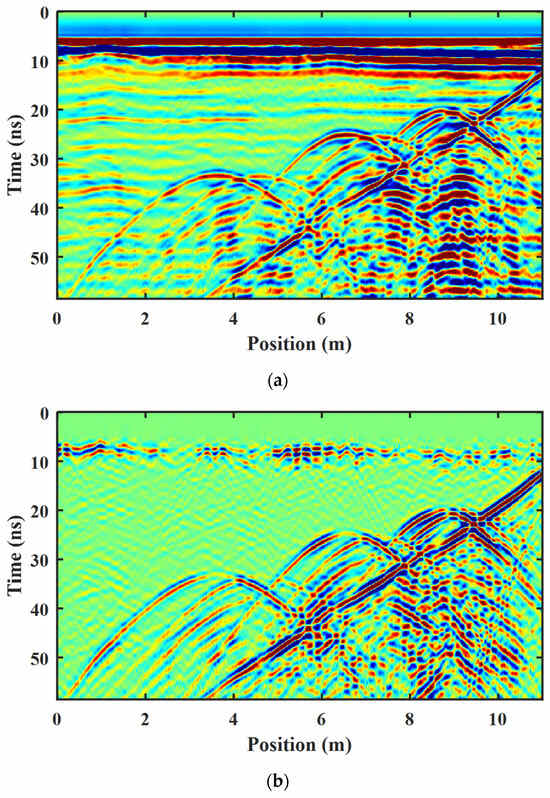
Figure 13.
Radargram from field data and its preprocessing result. (a) the field data results; (b) the preprocessing results.
In order to simplify the GPR field profile and separate the ROIs, the Otsu thresholding method, the K-means clustering segmentation method, and our proposed Res-CNN method are used to obtain the binarized results, and the ROI-binarized hyperbolic region results are shown in Figure 14a–c. Since the field data show strong airwaves at the ground surface, the three binarization methods can obtain good target extraction results in the ROIs after preprocessing. In Figure 14a, the Otsu thresholding method obtains a hyperbolic shape at the location of the peak with the strongest energy, and the multiple reflected waves in the GPR image also interfere with ROI-binarized hyperbolic region segmentation. In Figure 14b, the K-means clustering algorithm can achieve binarization of the target reflection region with peaks and troughs of reflected waves, but it is also strongly affected by multiple reflected waves. In Figure 14c, the proposed method demonstrates enhanced capability in separating the hyperbolic reflection ROIs for binarization. It achieves a cleaner background profile and effectively distinguishes the background distribution from the target reflection. Additionally, all three methods were affected by the results of airwave pre-processing, resulting in airwave clutter appearing on the surface. In future research, consideration will be given to employing more advanced clutter processing techniques to improve airwave removal.
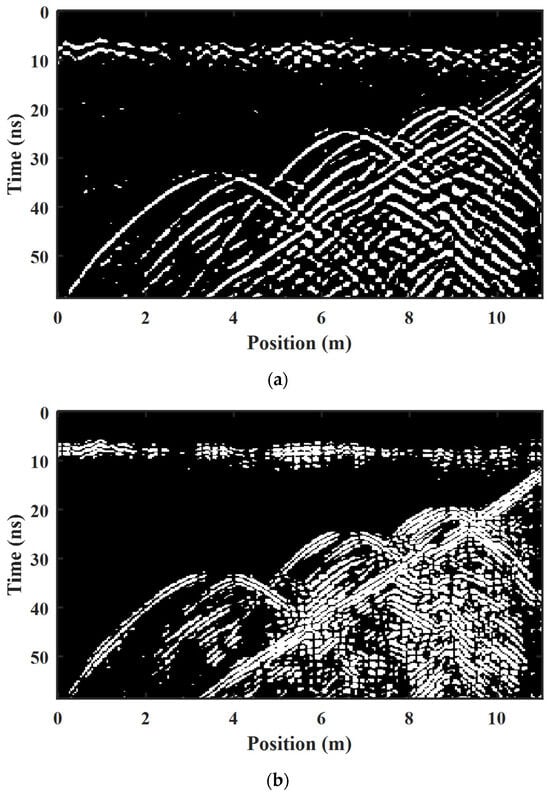
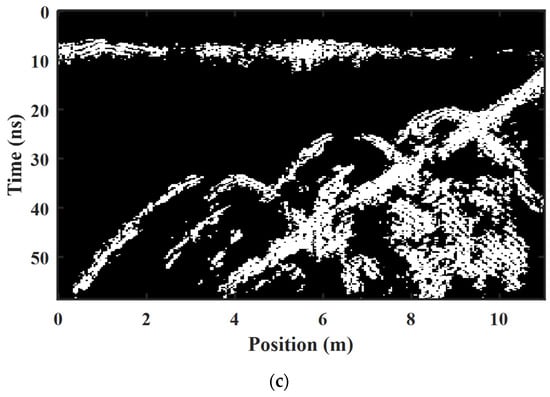
Figure 14.
ROI-binarized hyperbolic region extraction results with different methods on the field data. (a) Otsu thresholding method with a threshold of 0.49. (b) K-means clustering segmentation method with 3 cluster centroid locations. (c) Our proposed Res-CNN method.
The results of ROI binarization hyperbola region extraction for network structures with and without skip connections were also compared, as shown in Figure 15. The convolutional neural network with a skip connection structure can better achieve ROI-binarized hyperbolic region segmentation and characterization; hyperbolic morphology is more clean and complete in Figure 14c compared to the result in Figure 15.
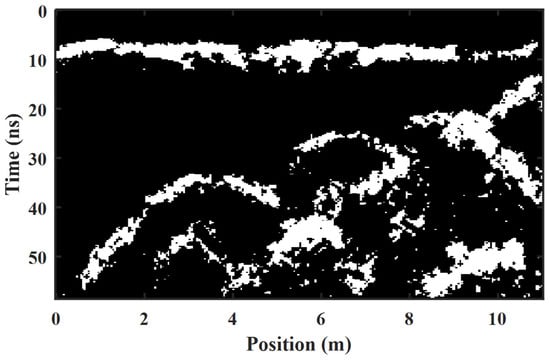
Figure 15.
ROI-binarized hyperbolic region extraction results from network architecture without a skip connection structure.
4. Discussion
This paper introduces a deep Res-CNN architecture incorporating skip connection layers for segmentation and characterization of hyperbolas in ROI-binarized hyperbolic region extraction. The aim is to expedite the identification of underground target reflection regions and enhance the interpretation of GPR imaging.
The primary finding of the study is that networks incorporating skip connection layers facilitate improved transmission of network information, resulting in clearer and more distinct extraction of hyperbolic morphology regions in GPR images compared to structures lacking skip connections. In comparative analysis, the Res-CNN outperformed conventional segmentation methods, showcasing superior efficiency and accuracy in segmenting hyperbolic ROIs in GPR images.
However, it is essential to acknowledge several intrinsic and extrinsic limitations of the current study. Primarily, the training dataset mainly comprises forward simulation data and may not fully capture the complexity of underground medium conditions. Therefore, enhancing the performance of the network requires the incorporation of models with dispersive or anisotropic media and the utilization of high-quality field data for training. Additionally, the model’s performance may be affected by parameter selection, which requires verification and optimization of different parameters to ensure robustness under different scenarios. Furthermore, exploring advanced techniques for noise reduction and feature extraction could further enhance the model in challenging real-word conditions.
The proposed model demonstrates the potential applicability of deep neural networks in segmenting and characterizing ROI-binarized hyperbolic regions in GPR images. Future research can further explore the model performance to leverage capabilities in deep learning, thereby enhancing the efficiency of GPR interpretation under different conditions.
5. Conclusions
A simple, lightweight, and efficient Res-CNN structure was constructed to achieve the extraction of ROI-binarized hyperbolic regions from GPR images, facilitating swift and precise identification of target reflection areas. These are instrumental in enhancing our understanding and analysis of the distribution and burial depth of subsurface targets.
The Res-CNN model comprises ten blocks and employs distinct activation functions within downsampling and upsampling blocks to fine-tune network functionality. Notably, the integration of skip connections ensures effective information propagation throughout the deep network, thereby enhancing segmentation accuracy.
Different types of GPR anomaly label datasets were constructed using random media data and binarized images from homogeneous media, enhancing the network’s ability to better adapt to hyperbolic features and yield accurate ROI results. Numerical simulations and field experiments demonstrate that the Res-CNNs efficacy effectively separates target regions from the GPR background. Meanwhile, the field data result also proves that the trained network has good ability and confirms the effectiveness and applicability of this algorithm for guiding practical interpretation.
Looking ahead, the study presents an advanced and efficient tool for GPR image analysis, providing a simple and powerful solution for extracting target reflection regions. These advancements simplify the interpretation process and hold promise for improving subsurface imaging and target identification across various applications, such as geological surveys, infrastructure assessment, and more.
Author Contributions
Conceptualization, H.Z. and Q.D.; methodology, D.F.; software, H.Z.; validation, H.Z.; formal analysis, B.Z.; investigation, H.Z.; resources, X.W.; data curation, H.Z.; writing—original draft preparation, H.Z.; writing—review and editing, H.Z., and D.F.; visualization, H.Z.; supervision, Q.D.; project administration, Q.D.; funding acquisition, Q.D. and D.F. All authors have read and agreed to the published version of the manuscript.
Funding
This research was funded in part by the National Natural Science Foundation of China under Grants 42374180, 42074161, 42104143, and 42174178, in part by Natural Science Foundation of Hunan Province, China under Grant 2021JJ30806 and 2022JJ40584, in part by the Fundamental Research Funds for the Central Universities of Central South University under Grant 2020zzts171, and in part by the Hunan Provincial Postgraduate Research Innovation Project under Grant CX20200227.
Data Availability Statement
The data presented in this study are available on request from the corresponding author. The data are not publicly available due to the data are part of an ongoing study.
Acknowledgments
We are grateful for resources from the High Performance Computing Center of Central South University.
Conflicts of Interest
The authors declare no conflicts of interests.
References
- Zhou, F.; Chen, Z.; Liu, H.; Cui, J.; Spencer, B.F.; Fang, G. Simultaneous estimation of rebar diameter and cover thickness by a GPR-EMI dual sensor. Sensors 2018, 18, 2969. [Google Scholar] [CrossRef]
- Torbaghan, M.E.; Li, W.; Metje, N.; Burrow, M.; Chapman, D.N.; Rogers, C.D. Automated detection of cracks in roads using ground penetrating radar. J. Appl. Geophys. 2020, 179, 104118. [Google Scholar] [CrossRef]
- Bai, X.; Yang, Y.; Wen, Z.; Wei, S.; Zhang, J.; Liu, J.; Li, H.; Tian, H.; Liu, G. 3D-GPR-RM: A Method for Underground Pipeline Recognition Using 3-Dimensional GPR Images. Appl. Sci. 2023, 13, 7540. [Google Scholar] [CrossRef]
- Li, C.; Zhang, Y.; Wang, L.; Zhang, W.; Yang, X.; Yang, X. Recognition of Rebar in Ground-Penetrating Radar Data for the Second Lining of a Tunnel. Appl. Sci. 2023, 13, 3203. [Google Scholar] [CrossRef]
- Jin, Y.; Duan, Y. Identification of unstable subsurface rock structure using ground penetrating radar: An eemd-based processing method. Appl. Sci. 2020, 10, 8499. [Google Scholar] [CrossRef]
- Zhou, X.; Chen, H.; Li, J. An automatic GPR B-scan image interpreting model. IEEE Trans. Geosci. Remote Sens. 2018, 56, 3398–3412. [Google Scholar] [CrossRef]
- Mertens, L.; Persico, R.; Matera, L.; Lambot, S. Automated detection of reflection hyperbolas in complex GPR images with no a priori knowledge on the medium. IEEE Trans. Geosci. Remote Sens. 2015, 54, 580–596. [Google Scholar] [CrossRef]
- Gamal, M.; Di, Q.; Zhang, J.; Fu, C.; Ebrahim, S.; El-Raouf, A.A. Utilizing Ground-Penetrating Radar for Water Leak Detection and Pipe Material Characterization in Environmental Studies: A Case Study. Remote Sens. 2023, 15, 4924. [Google Scholar] [CrossRef]
- Borgioli, G.; Capineri, L.; Falorni, P.; Matucci, S.; Windsor, C.G. The detection of buried pipes from time-of-flight radar data. IEEE Trans. Geosci. Remote Sens. 2008, 46, 2254–2266. [Google Scholar] [CrossRef]
- Al-Nuaimy, W.; Huang, Y.; Nakhkash, M.; Fang, M.; Nguyen, V.; Eriksen, A. Automatic detection of buried utilities and solid objects with GPR using neural networks and pattern recognition. J. Appl. Geophys. 2000, 43, 157–165. [Google Scholar] [CrossRef]
- Zhang, B.; He, R.; Zhang, H.; Lei, Y.; Dai, Q. Diffraction Separation by a Coherence Analysis Framework for Ground Penetrating Radar Applications. IEEE Trans. Geosci. Remote Sens. 2023, 61, 1–15. [Google Scholar] [CrossRef]
- Zhao, J.; Yu, C.; Peng, S.; Chen, Z. Online dictionary learning method for extracting GPR diffractions. J. Geophys. Eng. 2019, 16, 1116–1123. [Google Scholar] [CrossRef]
- Li, F.; Yang, F.; Yan, R.; Qiao, X.; Xing, H.; Li, Y. Study on significance enhancement algorithm of abnormal features of urban road ground penetrating radar images. Remote Sens. 2022, 14, 1546. [Google Scholar] [CrossRef]
- Torrione, P.A.; Morton, K.D.; Sakaguchi, R.; Collins, L.M. Histograms of oriented gradients for landmine detection in ground-penetrating radar data. IEEE Trans. Geosci. Remote Sens. 2013, 52, 1539–1550. [Google Scholar] [CrossRef]
- Okay, M.O.; Samet, R. An Approach to Detect and Visualize the Anomalies based on GPR Data. In Proceedings of the 18th International Conference on Geoinformatics-Theoretical and Applied Aspects, Kiev, Ukraine, 13–16 May 2019; pp. 1–5. [Google Scholar]
- Dou, Q.; Wei, L.; Magee, D.R.; Cohn, A.G. Real-time hyperbola recognition and fitting in GPR data. IEEE Trans. Geosci. Remote Sens. 2016, 55, 51–62. [Google Scholar] [CrossRef]
- Ocaña-Levario, S.J.; Carreño-Alvarado, E.P.; Ayala-Cabrera, D.; Izquierdo, J. GPR image analysis to locate water leaks from buried pipes by applying variance filters. J. Appl. Geophys. 2018, 152, 236–247. [Google Scholar] [CrossRef]
- Shihab, S.; Al-Nuaimy, W. A Comparison Of Segmentation Techniques For Target Extraction In Ground-Penetrating Radar Data. Near Surf. Geophys. 2004, 2, 49–57. [Google Scholar] [CrossRef]
- Jiao, L.; Ye, Q.; Cao, X.; Huston, D.; Xia, T. Identifying concrete structure defects in GPR image. Measurement 2020, 160, 107839. [Google Scholar] [CrossRef]
- Sharma, P.; Kumar, B.; Singh, D. Development of Adaptive Threshold and Data Smoothening Algorithm for GPR Imaging. Def. Sci. J. 2018, 68, 316–325. [Google Scholar] [CrossRef]
- Li, W.; Cui, X.; Guo, L.; Chen, J.; Chen, X.; Cao, X. Tree root automatic recognition in ground penetrating radar profiles based on randomized Hough transform. Remote Sens. 2016, 8, 430. [Google Scholar] [CrossRef]
- Bugarinović, Ž.; Pajewski, L.; Ristić, A.; Vrtunski, M.; Govedarica, M.; Borisov, M. On the introduction of canny operator in an advanced imaging algorithm for real-time detection of hyperbolas in ground-penetrating radar data. Electronics 2020, 9, 541. [Google Scholar] [CrossRef]
- Altin, g.; Dolma, a. Buried Objects Segmentation and Detection in GPR B Scan Images. Eurasia Proc. Sci. Technol. Eng. Math. 2019, 6, 11–17. [Google Scholar]
- Shahrabi, M.A.; Hashemi, H. Analysis of GPR hyperbola targets using image processing techniques. J. Seism Explor. 2021, 6, 561–575. [Google Scholar]
- Lameri, S.; Lombardi, F.; Bestagini, P.; Lualdi, M.; Tubaro, S. Landmine detection from GPR data using convolutional neural networks. In Proceedings of the 2017 25th European Signal Processing Conference (EUSIPCO), Kos, Greece, 28 August–2 September 2017; pp. 508–512. [Google Scholar]
- Picetti, F.; Testa, G.; Lombardi, F.; Bestagini, P.; Lualdi, M.; Tubaro, S. Convolutional autoencoder for landmine detection on GPR scans. In Proceedings of the 2018 41st International Conference on Telecommunications and Signal Processing (TSP), Athens, Greece, 4–6 July 2018; pp. 1–4. [Google Scholar]
- Zhang, X.; Han, L.; Robinson, M.; Gallagher, A. A GANs-based deep learning framework for automatic subsurface object recognition from ground penetrating radar data. IEEE Access 2021, 9, 39009–39018. [Google Scholar] [CrossRef]
- Özkaya, U.; Öztürk, Ş.; Melgani, F.; Seyfi, L. Residual CNN+ Bi-LSTM model to analyze GPR B scan images. Autom. Constr. 2021, 123, 103525. [Google Scholar] [CrossRef]
- Liu, H.; Lin, C.; Cui, J.; Fan, L.; Xie, X.; Spencer, B.F. Detection and localization of rebar in concrete by deep learning using ground penetrating radar. Autom. Constr. 2020, 118, 103279. [Google Scholar] [CrossRef]
- Hou, F.; Lei, W.; Li, S.; Xi, J.; Xu, M.; Luo, J. Improved Mask R-CNN with distance guided intersection over union for GPR signature detection and segmentation. Autom. Constr. 2021, 121, 103414. [Google Scholar] [CrossRef]
- Markovic, M.; Malehmir, R.; Malehmir, A. Diffraction pattern recognition using deep semantic segmentation. Near Surf. Geophys. 2022, 20, 507–518. [Google Scholar] [CrossRef]
- Wang, Z.; Bovik, A.C.; Sheikh, H.R.; Simoncelli, E.P. Image quality assessment: From error visibility to structural similarity. IEEE Trans. Image Process. 2004, 13, 600–612. [Google Scholar] [CrossRef]
- Zhang, L.; Zhang, L.; Mou, X.; Zhang, D. FSIM: A feature similarity index for image quality assessment. IEEE Trans. Image Process. 2011, 20, 2378–2386. [Google Scholar] [CrossRef] [PubMed]
- Dérobert, X.; Pajewski, L. TU1208 Open Database of Radargrams: The Dataset of the IFSTTAR Geophysical Test Site. Remote Sens. 2018, 10, 530. [Google Scholar] [CrossRef]
Disclaimer/Publisher’s Note: The statements, opinions and data contained in all publications are solely those of the individual author(s) and contributor(s) and not of MDPI and/or the editor(s). MDPI and/or the editor(s) disclaim responsibility for any injury to people or property resulting from any ideas, methods, instructions or products referred to in the content. |
© 2024 by the authors. Licensee MDPI, Basel, Switzerland. This article is an open access article distributed under the terms and conditions of the Creative Commons Attribution (CC BY) license (https://creativecommons.org/licenses/by/4.0/).