Article

Constitutive Characteristics of Rock Damage under Freeze–Thaw Cycles

1
School of Civil Engineering, Hunan University of Science and Technology, Changsha 411100, China
2
College of Civil Engineering, Chongqing University, Chongqing 400045, China
*
Author to whom correspondence should be addressed.
Appl. Sci. 2024, 14(11), 4627; https://doi.org/10.3390/app14114627
Submission received: 26 April 2024 / Revised: 21 May 2024 / Accepted: 22 May 2024 / Published: 28 May 2024
(This article belongs to the Special Issue Effects of Temperature on Geotechnical Engineering)

Abstract

:
Freeze–thaw effect is one of the most important environmental conditions that rocks may be subjected to. Through laboratory model tests, the damage characteristics of rocks under the FTC were studied. Based on assuming that the strength of rocks subject to the FTC follows the Weibull distribution, the cumulative damage variable of the number of FTCs was introduced. A cumulative damage constitutive model of shear strength attenuation of rock that meets the Mohr–Coulomb criterion is established. The rationality and applicability of the proposed damage constitutive model are verified by comparing the results of rock shear strength parameters under cyclic freeze–thaw loads.

1. Introduction

In many engineering applications, rocks are subject to freeze–thaw cycles (FTC). Under the action of freeze–thaw cycle and low temperature frostbite, rock and soil will have irreversible damage. This is an important safety hazard and disaster inducement for geotechnical engineering in cold areas [1,2]. For example, frost heave rupture of highway tunnels in cold regions leads to instability. Freeze–thaw collapse leads to landslide, multi-slope collapse of frozen rock in mining areas, dynamic disturbance of frozen rock caused by earthquakes, etc. The compressive strength of rock plays an important role in the construction of rock engineering and is a key parameter in the construction process [3,4]. Therefore, the influence of FTC on the compressive strength of rock is discussed, and the intrinsic relationship between rock strength and FTC is understood. This is of great significance to the research and practice of rock engineering [5].
The compressive strength of rock before and after different FTCs has been obtained, and it was found that the compressive strength of rock will decrease more along with the increase in the number of FTCs [6]. In addition, it was found that, after the freezing temperature of the rock sample was reduced, the compressive strength decreased more significantly [7]. Berea rock was selected for FTC treatment, and the compression coefficient of the rock decreased by about 16% and 24%, respectively, when the temperature ranged from −4 °C to 6 °C [8,9,10]. Different kinds of granites were selected for the FTC and ultrasonic test study [11], and it was found that the wave velocity of different kinds of granites decreased after each FTC, and the decreasing trend was related to lithology, freeze–thaw time and cycle times, with the maximum decrease of about 15%. According to the above analysis, these changes are mainly caused by the expansion of pores and cracks in rocks [12].
However, in many engineering practices, as mentioned above, rock causes a dynamic stress. There has been limited research conducted on the dynamic mechanical properties of rocks following FTC [13]. For example, through the comparison of a quasi-static uniaxial experiment and a SHPB impact experiment, it was found that the compressive strength of granite and limestone under high strain rate is greater than that under static load [14]. Generally speaking, the increase in the number of FTCs or a decrease in the loading rate will lead to a decrease in the fracture strength [15]. The failure process in rock under the action of the FTC is a change process of microstructural damage [4,16,17]: (1) the expansion force generated when the water contained in the rock voids is converted into ice, (2) thermal stress caused by the temperature difference between the surface and the interior of the rock, (3) the water pressure inside the rock caused by the freezing of the surface. In addition, there is also an expansive force phenomenon when ice crystals are formed [18,19].
Looking at the current research status in China and abroad, there are many research projects on freeze–thaw rock, but few on damage caused by the mechanical properties of freeze–thaw rock. Most are confined to the unidirectional stress state, without considering the influence of confining pressure. The parameters of the model are mostly based on the fitting of test data, lack clear physical meaning, and can not reflect the general change law of the selected physical quantity.
Drawing inspiration from the traditional statistical stress–strain model of rock, this paper postulates that the micro-strength of rock subjected to FTC adheres to the Weibull distribution. By incorporating a cumulative damage variable based on the number of FTCs, we have developed a constitutive model for cumulative damage in rock shear strength decay that aligns with the Mohr–Coulomb criterion. The validity and practicality of this proposed damage constitutive model are confirmed through a comparison of its predictions with observed changes in rock shear strength parameters under cyclic freeze–thaw loads.

2. Experimental Setup

Typical rock samples of amphibolite in the study area were selected, and all the kinds of rock sample were made into standard cylinders according to different sample sizes and hardness by using a diamond machine or stone grinder and other processing equipment. The rocks are all standard cylinders with a diameter of 5 cm and a height of 10 cm, and the initial deviation is controlled within 5%. A total of 5 groups were set up, 6 samples were prepared in each group, and 0, 10, 20, 30 and 40 different FTC tests were conducted respectively. According to the test requirements, a total of 30 standard samples were made. Some of the field test samples are shown in Figure 1.

3. Preparation of Samples and Their Associated Physical Characteristics

The FTC test process is taken in accordance with the Standard of Test Methods for Engineering Rock Mass [20]. The temperature range is set as −20–20 °C. The temperature–time parameters of the FTC and the main process of the FTC are as follows:
  • Cooling stage: cooling freezing, freeze–thaw test box temperature gradually decreased from room temperature and stabilized at −20 °C, cooling process time is about 100 min.
  • Freezing stage: constant temperature freezing, freeze–thaw test box to maintain −20 °C ambient temperature, constant temperature for 4 h.
  • heating stage: heating and melting, freeze–thaw box placed automatically into the test box, slightly higher than 20 °C warm water to heat the frozen sample, the box temperature gradually stabilized at 20 °C, the heating process time about 100 min.
  • Melting stage: constant temperature water bath, freeze–thaw box environment temperature maintained at 20 °C constant temperature, the sample immersed in 20 °C warm water bath, heating for 4 h.
  • The warm water in the freeze–thaw test box is discharged to complete a full FTC test cycle and enter the next FTC stage until the preset number of FTCs.
In this study, a total of five groups of FTC damaged rock samples were set, which were 0, 10, 20, 30, and 40 FTC, respectively. To ensure that the test rock samples are in a state of full water without water loss, the samples that have completed the FTC continue to be immersed in the constant temperature water bath until the mechanical test is carried out.

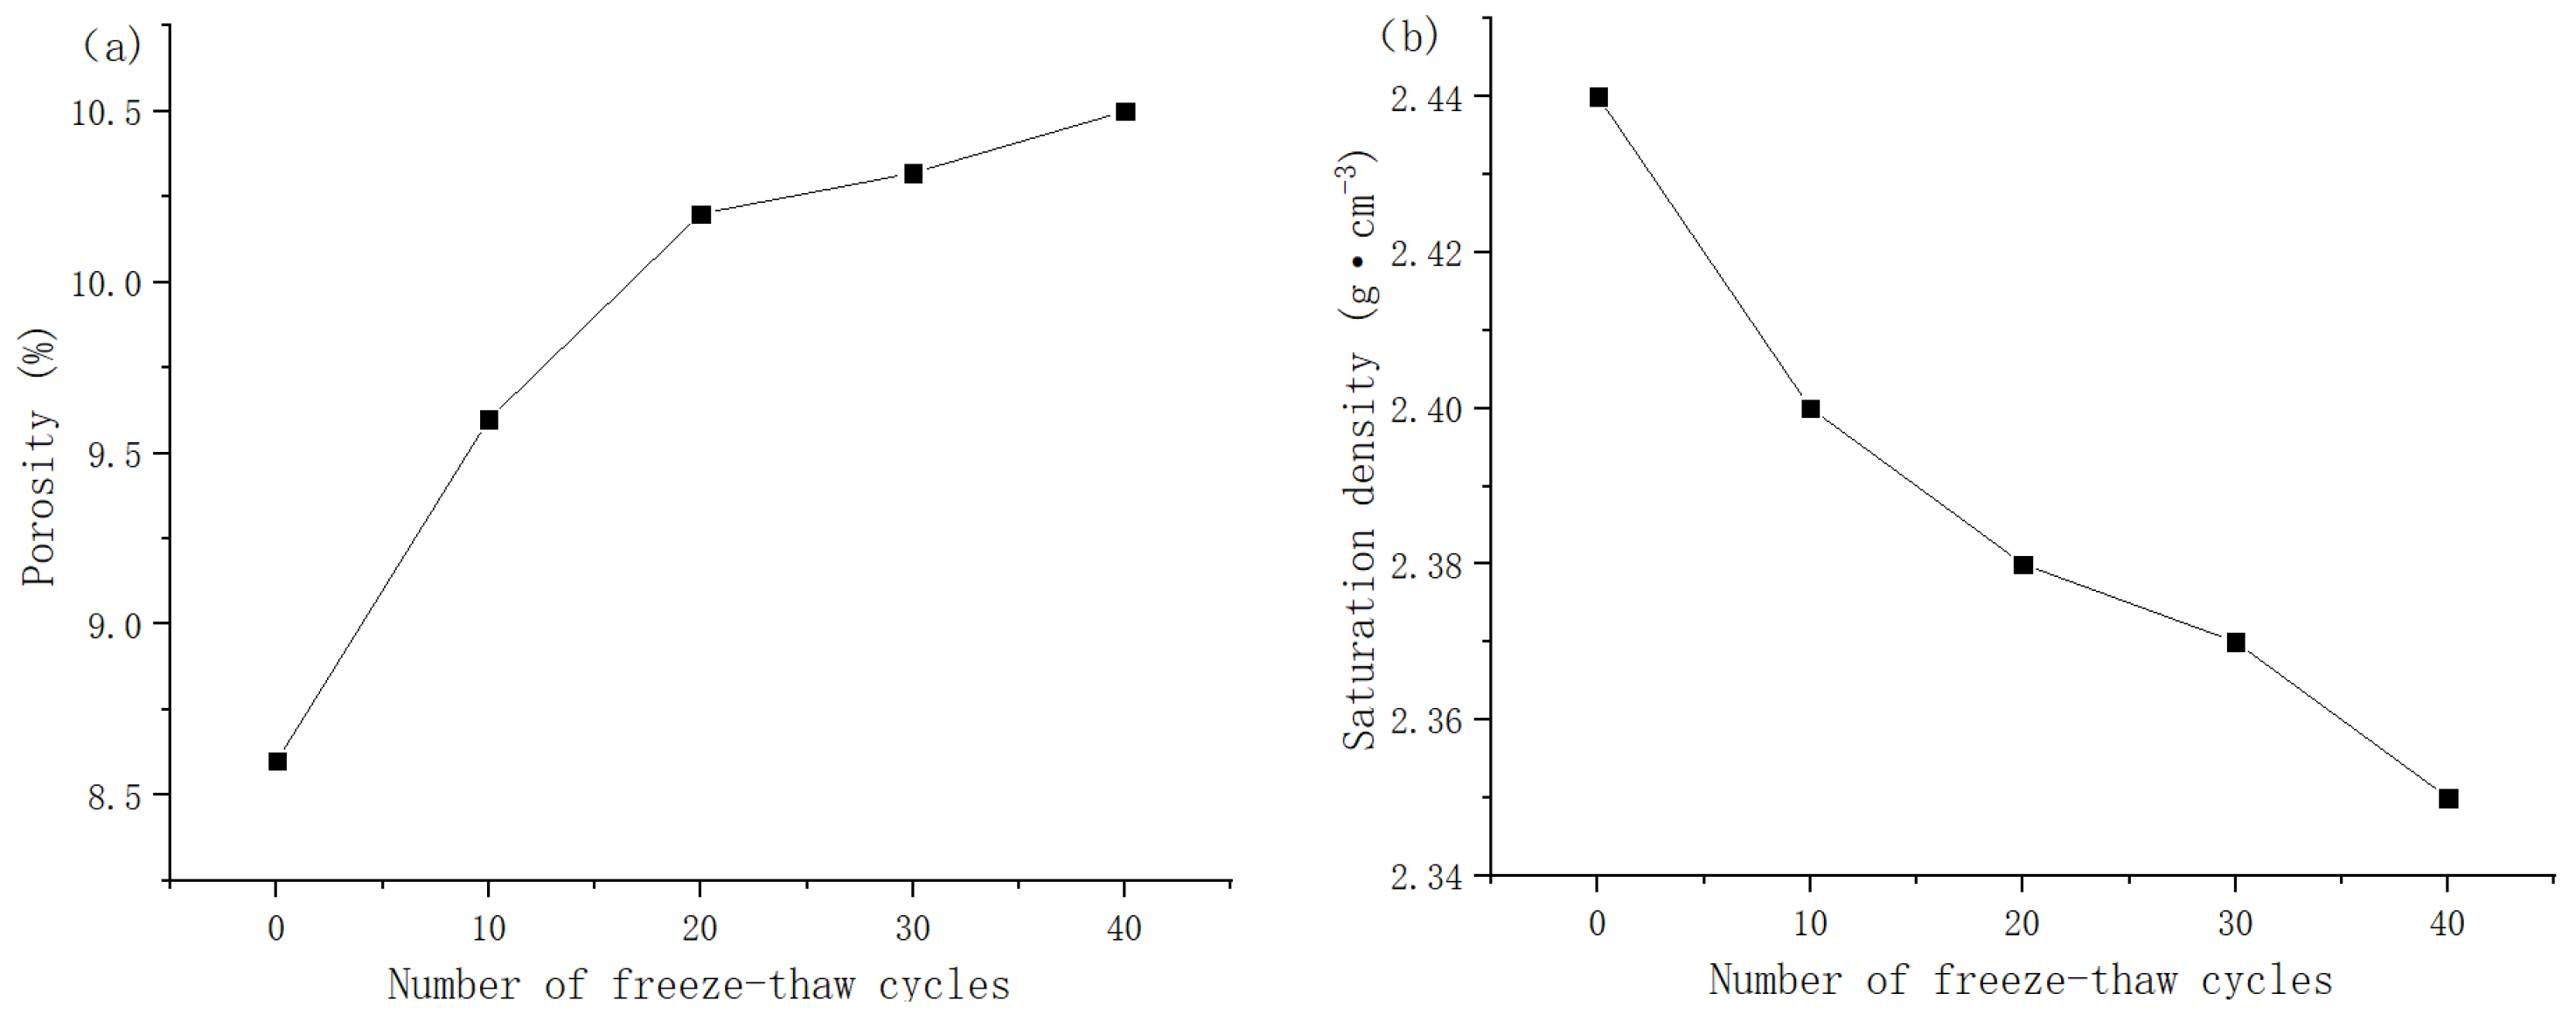
3.1. Rock Porosity and Saturation Density

Concurrently, both the quality and wave velocity of the saturated rock samples were measured following each freeze–thaw condition; the values in the figure are the average values of each group of rocks under the same number of FTCs, as shown in Figure 2.
As depicted in Figure 2, the physical and hydraulic properties of rock samples exhibit variations with the number of FTCs. However, these differences are relatively minor, and the overall trend remains consistent. Initially, at 0 FTC, the porosity of the rock samples stands at 8.78%, suggesting the presence of a significant number of pore structures under natural saturation. As the samples undergo FTC, the water within experiences a phase transition from water to ice, leading to the expansion of existing pores and cracks, as well as the formation of new pores. Consequently, the porosity increases to 10.80% after 40 FTCs, representing a 23.01% increase. Concurrently, the saturated density of the rock samples decreases with the increasing number of FTCs. This decrease is primarily attributed to the loss of mineral particles on the sample surface, resulting in a reduction in the saturated mass. Additionally, the expansion of the rock volume due to the development of cracks caused by the frost heave force contributes to this decrease. Notably, within the first 20 FTCs, the saturation density of the samples decreases significantly, from 2.44 g·cm−3 to 2.38 g·cm−3. The porosity of the rock samples continues to increase with the increasing number of FTCs, and the growth rate of porosity during the first 20 cycles is significantly higher than that in subsequent cycles. This observation suggests that FTC not only increases the number of pores in the rock but also significantly enhances the openness and connectivity of these pores.

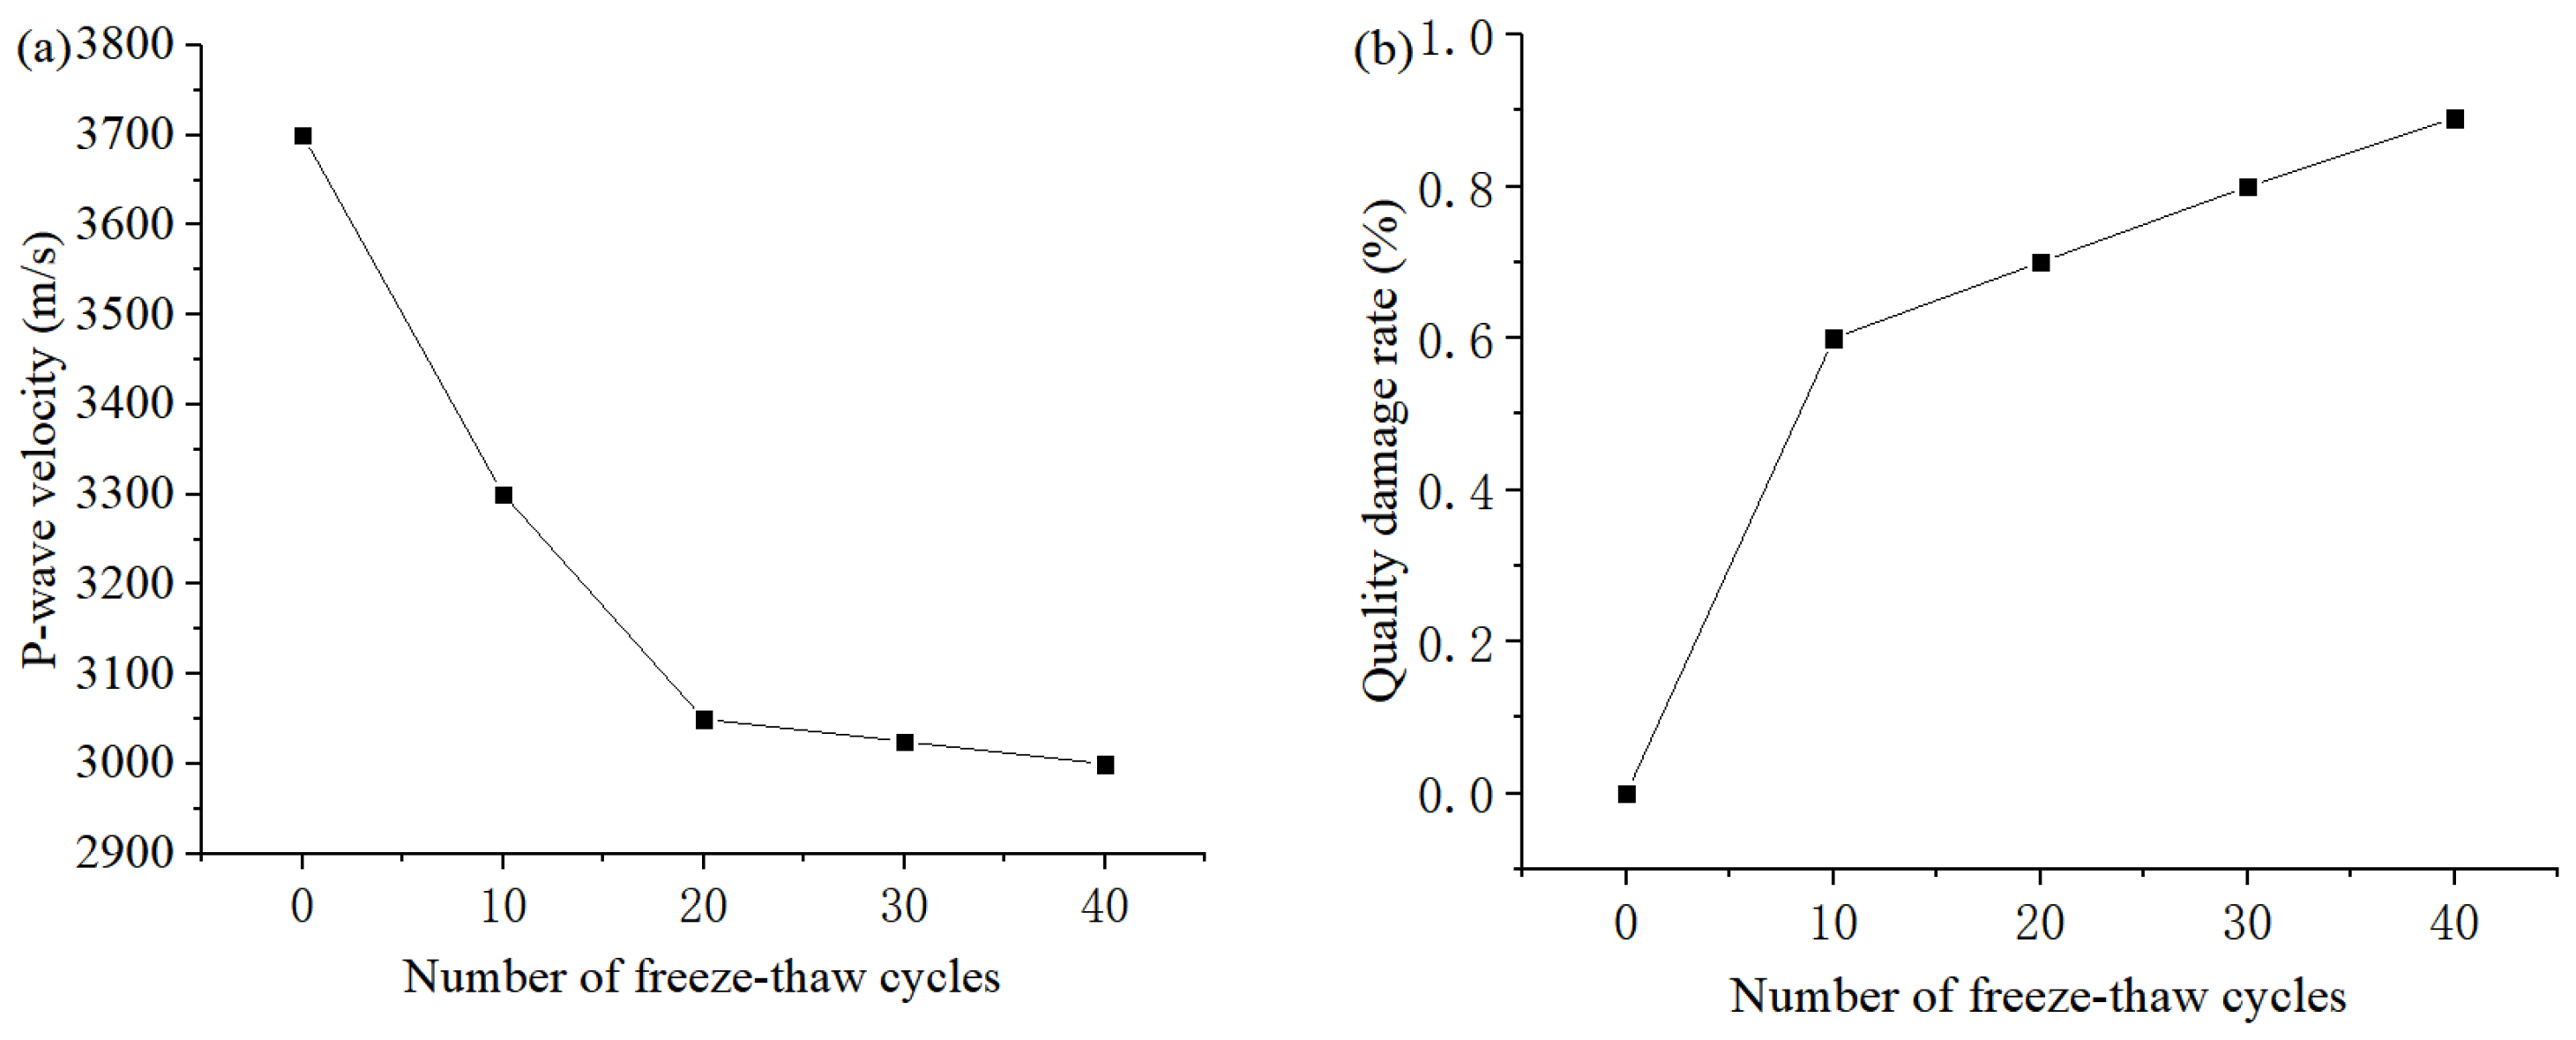
3.2. Rock Mass Loss Rate and P-Wave Velocity

Ultrasonic wave speed, as an effective means of non-destructive rock testing, can effectively explore the development of the interior of the rock, according to the ultrasonic wave speed difference, in order to judge the integrity of the interior of the rock, as shown in Equation (1).
K m = m s 1 m s 2 m s 1 × 100 %
Figure 3 shows the relationship between rock mass loss rate and longitudinal wave velocity with the number of FTCs; the values in the figure are the average values of each group of rocks under the same number of FTCs. By observing Figure 3, we can find that, with the reduction of FTC frequency, the loss of rock sample quality is also gradually reduced. However, in the first 10 FTCs, the variation range of rock mass loss rate is significantly greater than that in the subsequent FTCs (20, 30, 40). This is because the sample itself is in a certain breezy state when the damage frequency of the FTC is small, the rock sample is mainly concentrated in the surface layer, and the material spalling on the rock is the main reason for the substantial reduction of its mass. With the increase in FTC frequency, the damage was transferred to the inside of the specimen. The damage of the internal material does not leave the specimen, while the damage of the dry rock sample is 2813 m/s. The reason is that the pores of the saturated water sample are filled with water, and the wave speed in water is much larger than that in air. Second, the wave impedance of water is closer to the solid skeleton of rock than that of air. According to the elastic wave propagation theory, this will weaken the refraction and reflection of stress waves to a certain extent. The propagation path of the stress wave in the rock sample is shortened because of the reduction, which results in the velocity of the P-wave slowing down with time. The decrease in P-wave velocity is not only affected by the freeze–thaw cycle. It is also closely related to its internal structure and mineral composition. In the early FTC stage, the intercrystalline cohesion in rock is weaker than the frost heave force, and a large number of argillaceous cements in rock will significantly soften and argillify in the early FTC stage, which also has a significant impact on the P-wave velocity. The cementation between quartz particles will be weakened and the wave velocity will decrease.

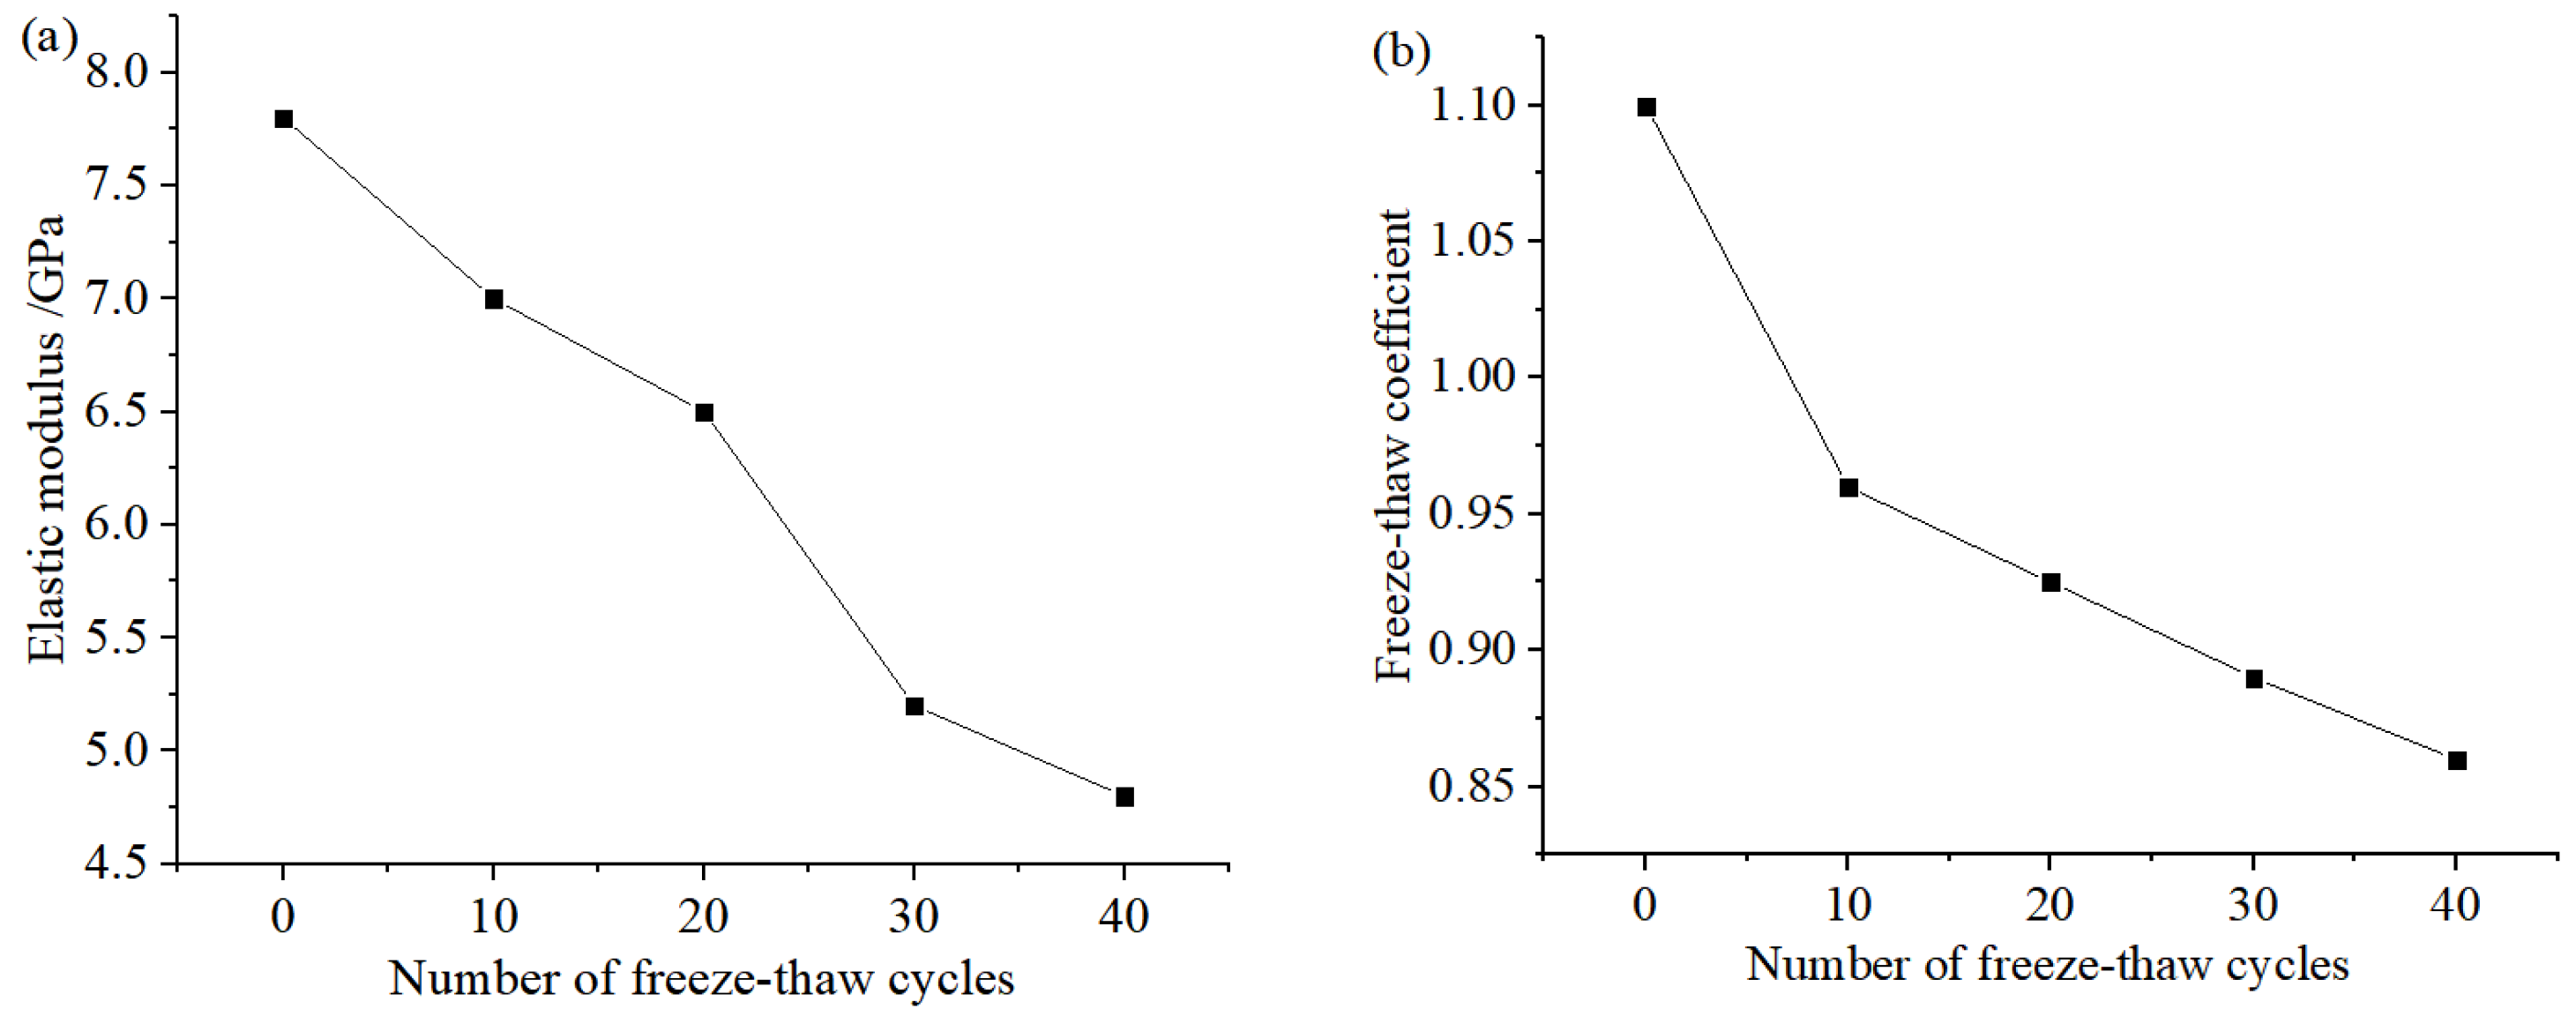
3.3. Analysis of Strength Loss Rate

Table 1 shows the average value of saturated uniaxial compressive strength and loss rate of samples with different FTCs. The experimental data show that with the increase in FTC number, the saturated compressive strength of specimens decreases obviously, and the same FTC number has a similar weakening effect on the saturated compressive strength of different types of rocks.
With the increase in the number of FTCs, the mechanical properties of rock blocks basically show a downward trend, but there are also abnormal conditions, e.g., the compressive strength of the granulated rock group after 20 FTCs is greater than that after 10 FTCs, which shows the discrete data and non-uniformity of rock samples during the experiment.

3.4. Static Compression Test of Rock Damaged by FTC

The Φ50 mm × 100 mm cylinder rock samples obtained had undergone 0 (no freeze–thaw damage, i.e., the water-saturated sample), 10, 20, 30, and 40 FTC damage, respectively. The samples under different freeze–thaw test conditions were all in a water-saturated state. The changes in static elastic modulus, Poisson’s ratio, and freeze–thaw coefficient of the rock sample along with the number of FTCs are shown in Figure 4; the values in the figure are the average values of each group of rocks under the same number of FTCs.
K f = R ¯ f R ¯ s
The experimental results show that. with the increase in FTC times, the Poisson’s ratio of rock samples increases gradually, and the freeze–thaw coefficient increases but then decreases. The quality loss rate of the samples also increased. This indicates that FTC damage gradually develops from the surface to the interior, which is consistent with the law of rock mass affected by temperature under a natural environment. It can be seen that FTC damage is a process that develops from the surface to the interior, which is also consistent with the effect of temperature on in situ rock mass under a natural environment.

4. Constitutive Relationship and Damage Variables

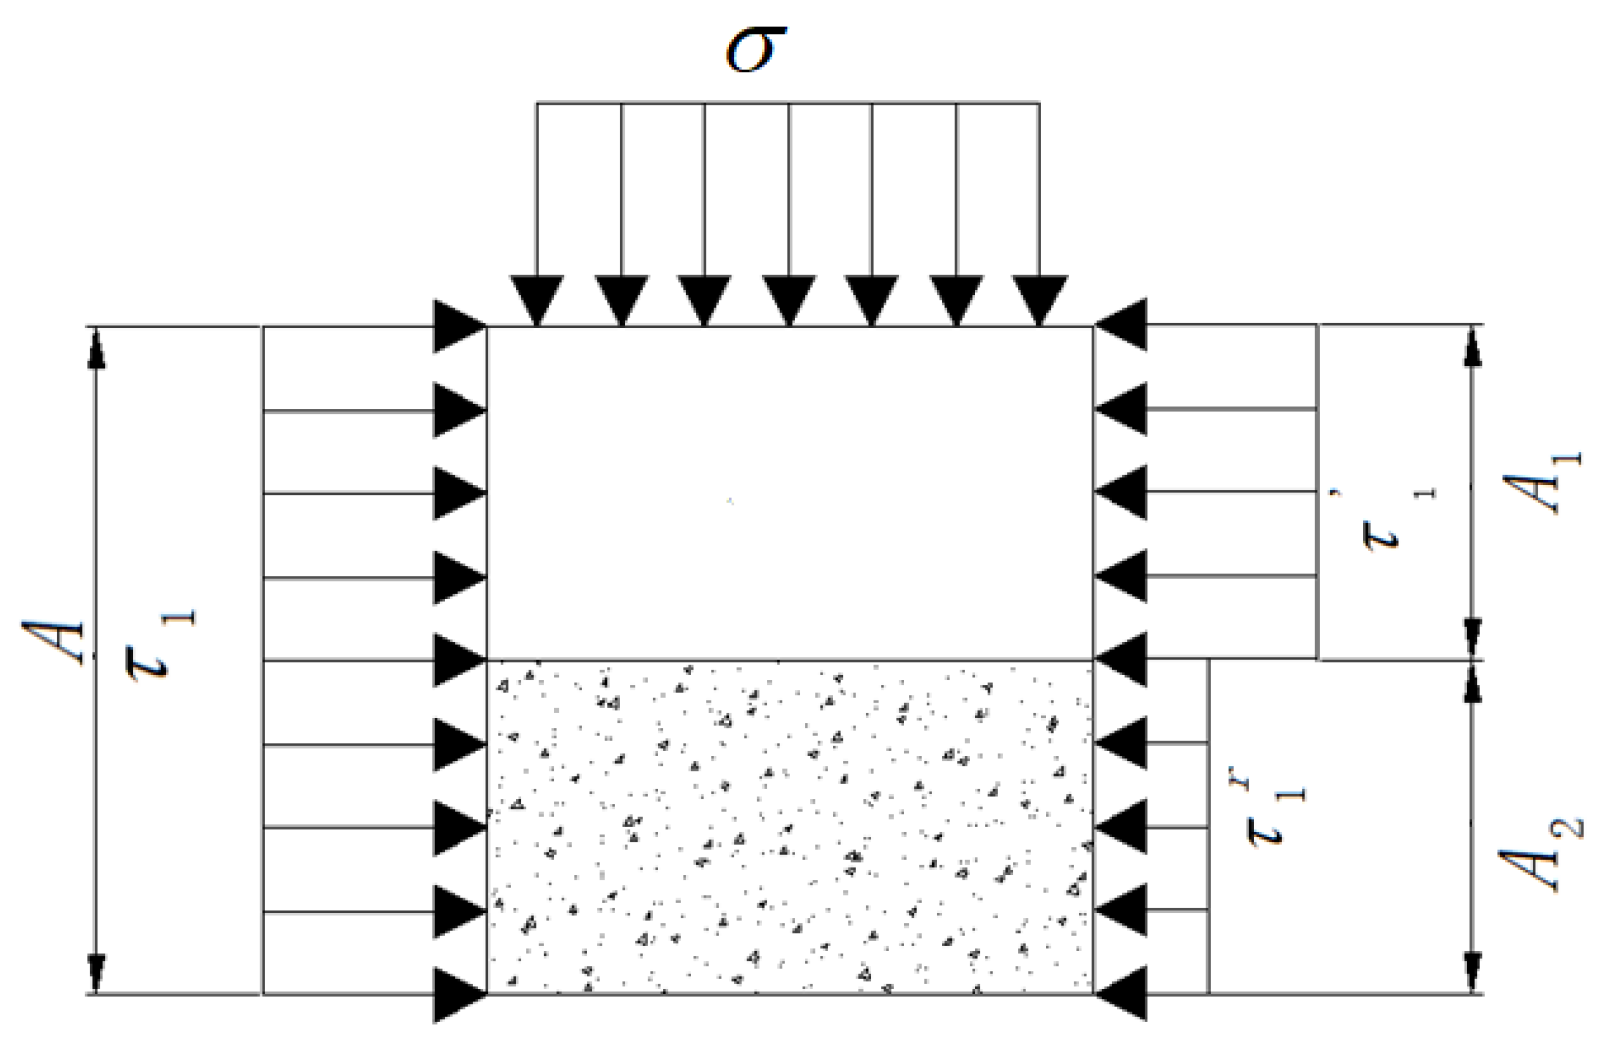
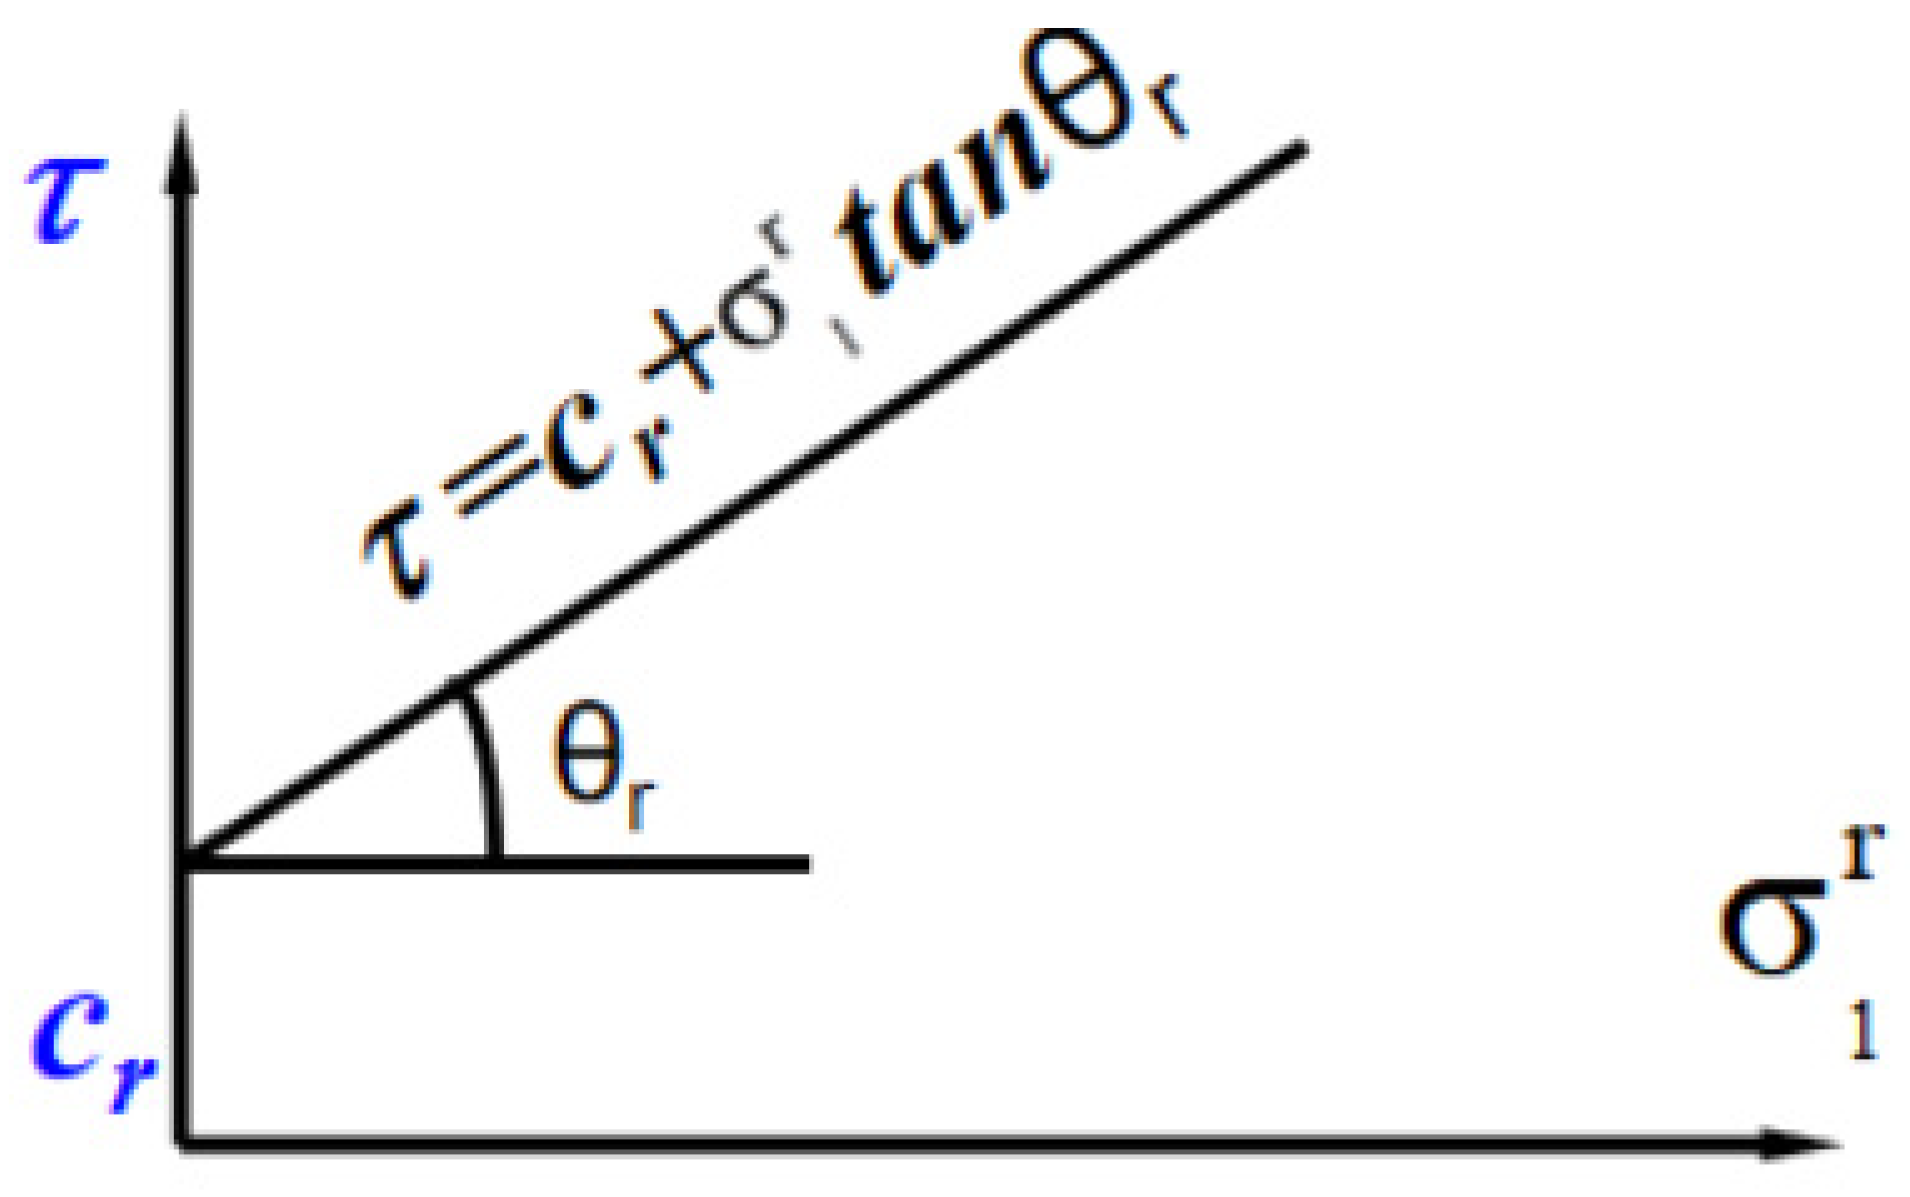
4.1. Establishment of the Constitutive Model

Damage theory is widely used in damage models, among which a large number of damage models are established based on the assumption of Lemaitre strain equivalence, as shown in Equation (3) below. This hypothesis shows that the attenuation of the shear strength of the rock is caused by the destruction of the internal mechanical structure of the rock mass. When the rock is subjected to shear failure, the material bearing the shear strength inside can be divided into two parts: the undamaged material and the cavity. The cavity is the part that does not bear any shear strength. As shown in Figure 5, the blank part is the undamaged part of the material, and the shaded part is the damaged part of the material.
τ 1 = τ 1 ( 1 D )
where τ 1 is the nominal shear stress, τ 1 is the effective shear stress, and D is the damage percentage. According to Equation (4), when the rock is destroyed, i.e., when D = 1, the nominal shear stress of the rock and soil must be 0, i.e., the residual strength must be 0, which is contrary to the actual situation, as shown in Equation (4) below.
τ 1 = τ 1 ( 1 D ) + τ 1 r D
where τ 1 is the shear stress of the damaged part of the material, and the meaning of other physical quantities is the same as that of the model shown in Equation (4). According to Equation (4), when the rock and soil material is in a state of destruction, i.e., when D = 1, and τ 1 = τ 1 ( 1 D ) = 0 , so τ 1 = τ 1 . The stress state and rock strength parameters of some undamaged rocks meet the molar Coulomb failure criterion, as shown in Equations (5) and (6) and Figure 6.
τ = 1 2 ( σ 1 σ 3 ) sin 2 θ r
σ = 1 2 ( σ 1 + σ 3 ) + 1 2 ( σ 1 σ 3 ) cos 2 θ r
θ r is the residual friction Angle of the fracture zone, C r is the residual cohesion force, respectively, and σ 1 r is the first principal stress. Equations (7) and (8) can be obtained from Figure 5.
τ 1 A = τ 1 A 1 + τ 1 r A 2
A = A 1 + A 2
Equation (4) is a new damage model for rock materials. If σ = σ , Equation (9) can be obtained by combining Equations (6) and (10).
σ = 1 2 ( σ 1 + σ 3 ) + 1 2 ( σ 1 σ 3 ) cos 2 θ r
In addition, since it is the horizontal residual shear strength of the rock, it also conforms to the Mohr–Coulomb criterion, i.e., τ 1 r
σ 1 r = σ 3 r tan 2 ( 45 ° + θ r 2 ) + 2 C r tan ( 45 ° + θ r 2 )
τ 1 r = 1 2 ( σ 1 r σ 3 r ) sin ( 90 ° + θ r )
where σ 3 r is the third principal stress determined according to the residual strength of the rock.
Therefore, by combining Equation (11) with Equation (10), Equation (12) can be obtained:
τ 1 r = 1 2 2 sin ( 45 ° + θ r 2 ) σ 3 r + 2 C r cos ( 45 ° + θ r 2 ) 1 sin ( 45 ° + θ r 2 ) sin ( 45 ° + θ r 2 )
The shear stress of the undamaged part of the rock also conforms to the Mohr–Coulomb criterion under different normal stress conditions, as shown in Equation (13) below.
τ 1 = σ tan θ + C
Thus, we can obtain Equations (14) and (15) by substituting Equations (12) and (13) into Equation (7).
τ 1 = ( σ tan θ + C ) ( 1 D ) + B 1 D
B 1 = 1 2 2 sin ( 45 ° + θ r 2 ) σ 3 r + 2 C r cos ( 45 ° + θ r 2 ) 1 sin ( 45 ° + θ r 2 ) sin ( 45 ° + θ r 2 )
γ = 2 C cos θ sin θ 1
F = 2 σ σ 3 ( 1 cos 2 θ ) 1 + cos 2 θ + β σ 3 + γ
D = 1 exp [ ( F / F 0 ) m ] F > 0 0 F 0
In Equation (18), m, and F0 are Weibull distribution parameters of rock microunit strength F.

4.2. Determination of Parameters of Rock Damage Constitutive Model

Combine Equation (18) with Equation (14), as shown in Equation (19). It is also assumed that, under different normal stress conditions, the peak shear stress of the rock is σ S C . τ s c
τ σ | τ = τ S C , σ = σ S C = 0
From the partial decomposition of Equation (12), Equation (20) is obtained:
τ σ = tan θ r D tan θ r + ( B 1 C σ tan θ r ) D σ
Therefore, the combination of Equations (19) and (20) can be derived from Equation (21):
D σ | τ = τ S C , σ = σ S C = ( D S C 1 ) tan θ r ( B 1 C σ S C tan θ r )
Equations (20) and (22) can be obtained by partial decomposition of Equation (18):
D σ = exp [ ( F F 0 ) m ] [ m ( F s c F 0 ) m 1 ] 1 F 0 F σ
Equation (23) can be solved by partial differential of Equation (17):
F σ = 2 1 + cos 2 θ
Equations (24) and (25) can be obtained by combining Equations (18) and (23).
exp [ ( F F 0 ) m ] = 1 D
( F F 0 ) m 1 = F F 0 ln ( 1 D )
Combine Equation (21) with Equation (25) to obtain Equation (26).
m = F s c tan θ ( 1 + cos 2 θ r ) 2 ( B 1 C σ S C tan θ r ) ln ( 1 D S C )
where, when τ = τ S C ,   σ = σ S C , the micro-element strength F of the rock can be determined by Equation (17), i.e.,
F s c = 2 σ S C σ 3 ( 1 cos 2 θ r ) 1 + cos 2 θ r + β σ 3 + γ
Combine Equations (24) and (27) to obtain Equation (28).
F 0 = F s c [ ln ( 1 D S C ) ] 1 m
Combine Equations (12)–(28) to obtain Equation (29). σ = σ S C τ = τ S C
D S C = τ S C ( σ S C tan θ r + C ) B 1 ( σ S C tan θ r + C )
D n = 1 E n E 0
where E0 and En are elastic modulus of rock before and after receiving FTC for n times, respectively. The damage of rock compressive strength caused by FTC was coupled and analyzed, i.e., the total damage variable expression of FTC was obtained, as shown in Equation (31).
D m = D + D n D D n
By combining Equations (24), (30) and (31), the total evolution equation of rock damage variables after coupling of FTC loads of different times is obtained, as shown in Equation (32):
D m = 1 E n E 0 exp [ ( F F 0 ) m ]
When γ1 = γn, the corresponding value of F is FC, which is obtained by combining Equations (24), (25) and (32), as shown in Equation (33).
( F c F 0 ) m = ln 1 τ max E n γ n τ r E n γ n · E 0 E n = B
Equations (36) and (37) are obtained from Equations (27) and (34).
m = E n γ n ( E n γ n τ r ) B
F 0 = F c 1 τ r E n γ n · m 1 m
Equations (23)–(25) are the relationship between model parameters and rock mechanics characteristic parameters. The macroscopic mechanical properties of rock contained in the parameter expressions can be easily obtained from the conventional mechanical properties tests. Especially when it is difficult to obtain the whole stress–strain curve of rock due to the limitation of test conditions, the constitutive model reflecting the whole process of rock failure can still be obtained. According to Equations (32), (34) and (35), the total evolution equation of rock damage variables after different numbers of FTCs can be obtained, as shown in Equation (36).
D m = 1 E n E 0 exp E n γ 1 τ r E n γ n ( E n γ n τ r ) ln 1 τ max E n γ n τ r E n γ n · E 0 E n E n γ n E n γ 1 τ r E n γ n τ r E n γ n ( E n γ n τ r ) { ln 1 τ max E n γ n τ r E n γ n · E 0 E n }
The damage evolution rate of frequency FTC under the action of different frequency FTC can be derived by Equation (36), as shown in Equation (37).
D m . = ( 1 D m ) E n 2 γ n ( E n γ 1 τ r ) m 1 ( E n γ n τ r ) m + 1

5. Discussion

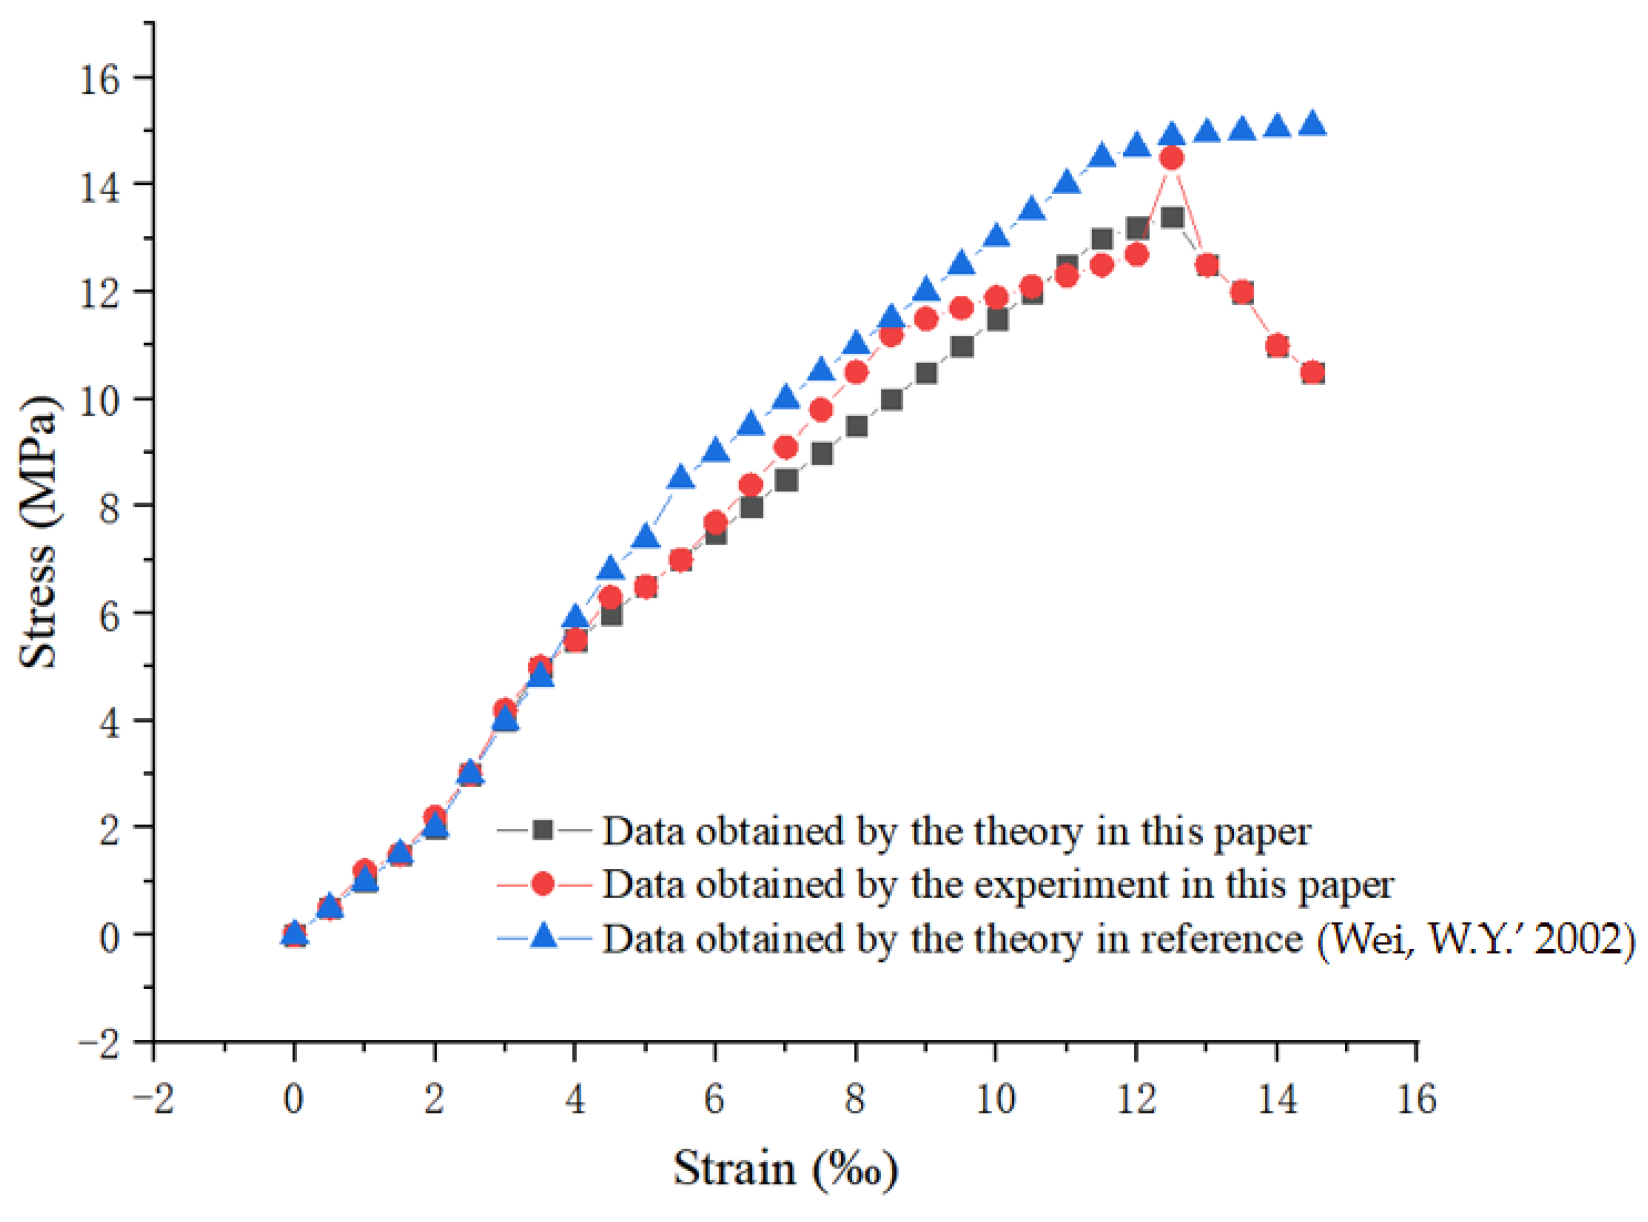
5.1. Comparison of Theoretical Models

In order to verify and illustrate the rationality and superiority of the damage constitutive model proposed in this paper to simulate the whole process of rock strain softening deformation, the stress–strain curves of the rock under the conditions of confining pressure of 2 MPa and number of FTCs of 10 were analyzed, respectively, by using the method described in the literature [21], as shown in Figure 7.
(1) Figure 7 shows the theoretical curves of the rock damage constitutive model under various confining pressure and freeze–thaw cycle conditions calculated by using the mechanical test results of the freeze–thaw cycle shown in Table 1 and Table 2 and compared with the experimental curves. Although the stress–strain curve obtained by the model in reference [21] can better reflect the strain softening characteristics of rock, it cannot reflect the residual strength characteristics of rock after failure.
(2) The proposed model can not only reflect the strain softening characteristics and residual strength characteristics of rock after failure, which is in good agreement with the measured curve, but can also simulate the mechanical behavior of rock under various confining pressures and freeze–thaw cycles in a unified function form and does not contain unconventional mechanical parameters. Therefore, the proposed model is more reasonable and superior to the existing models.

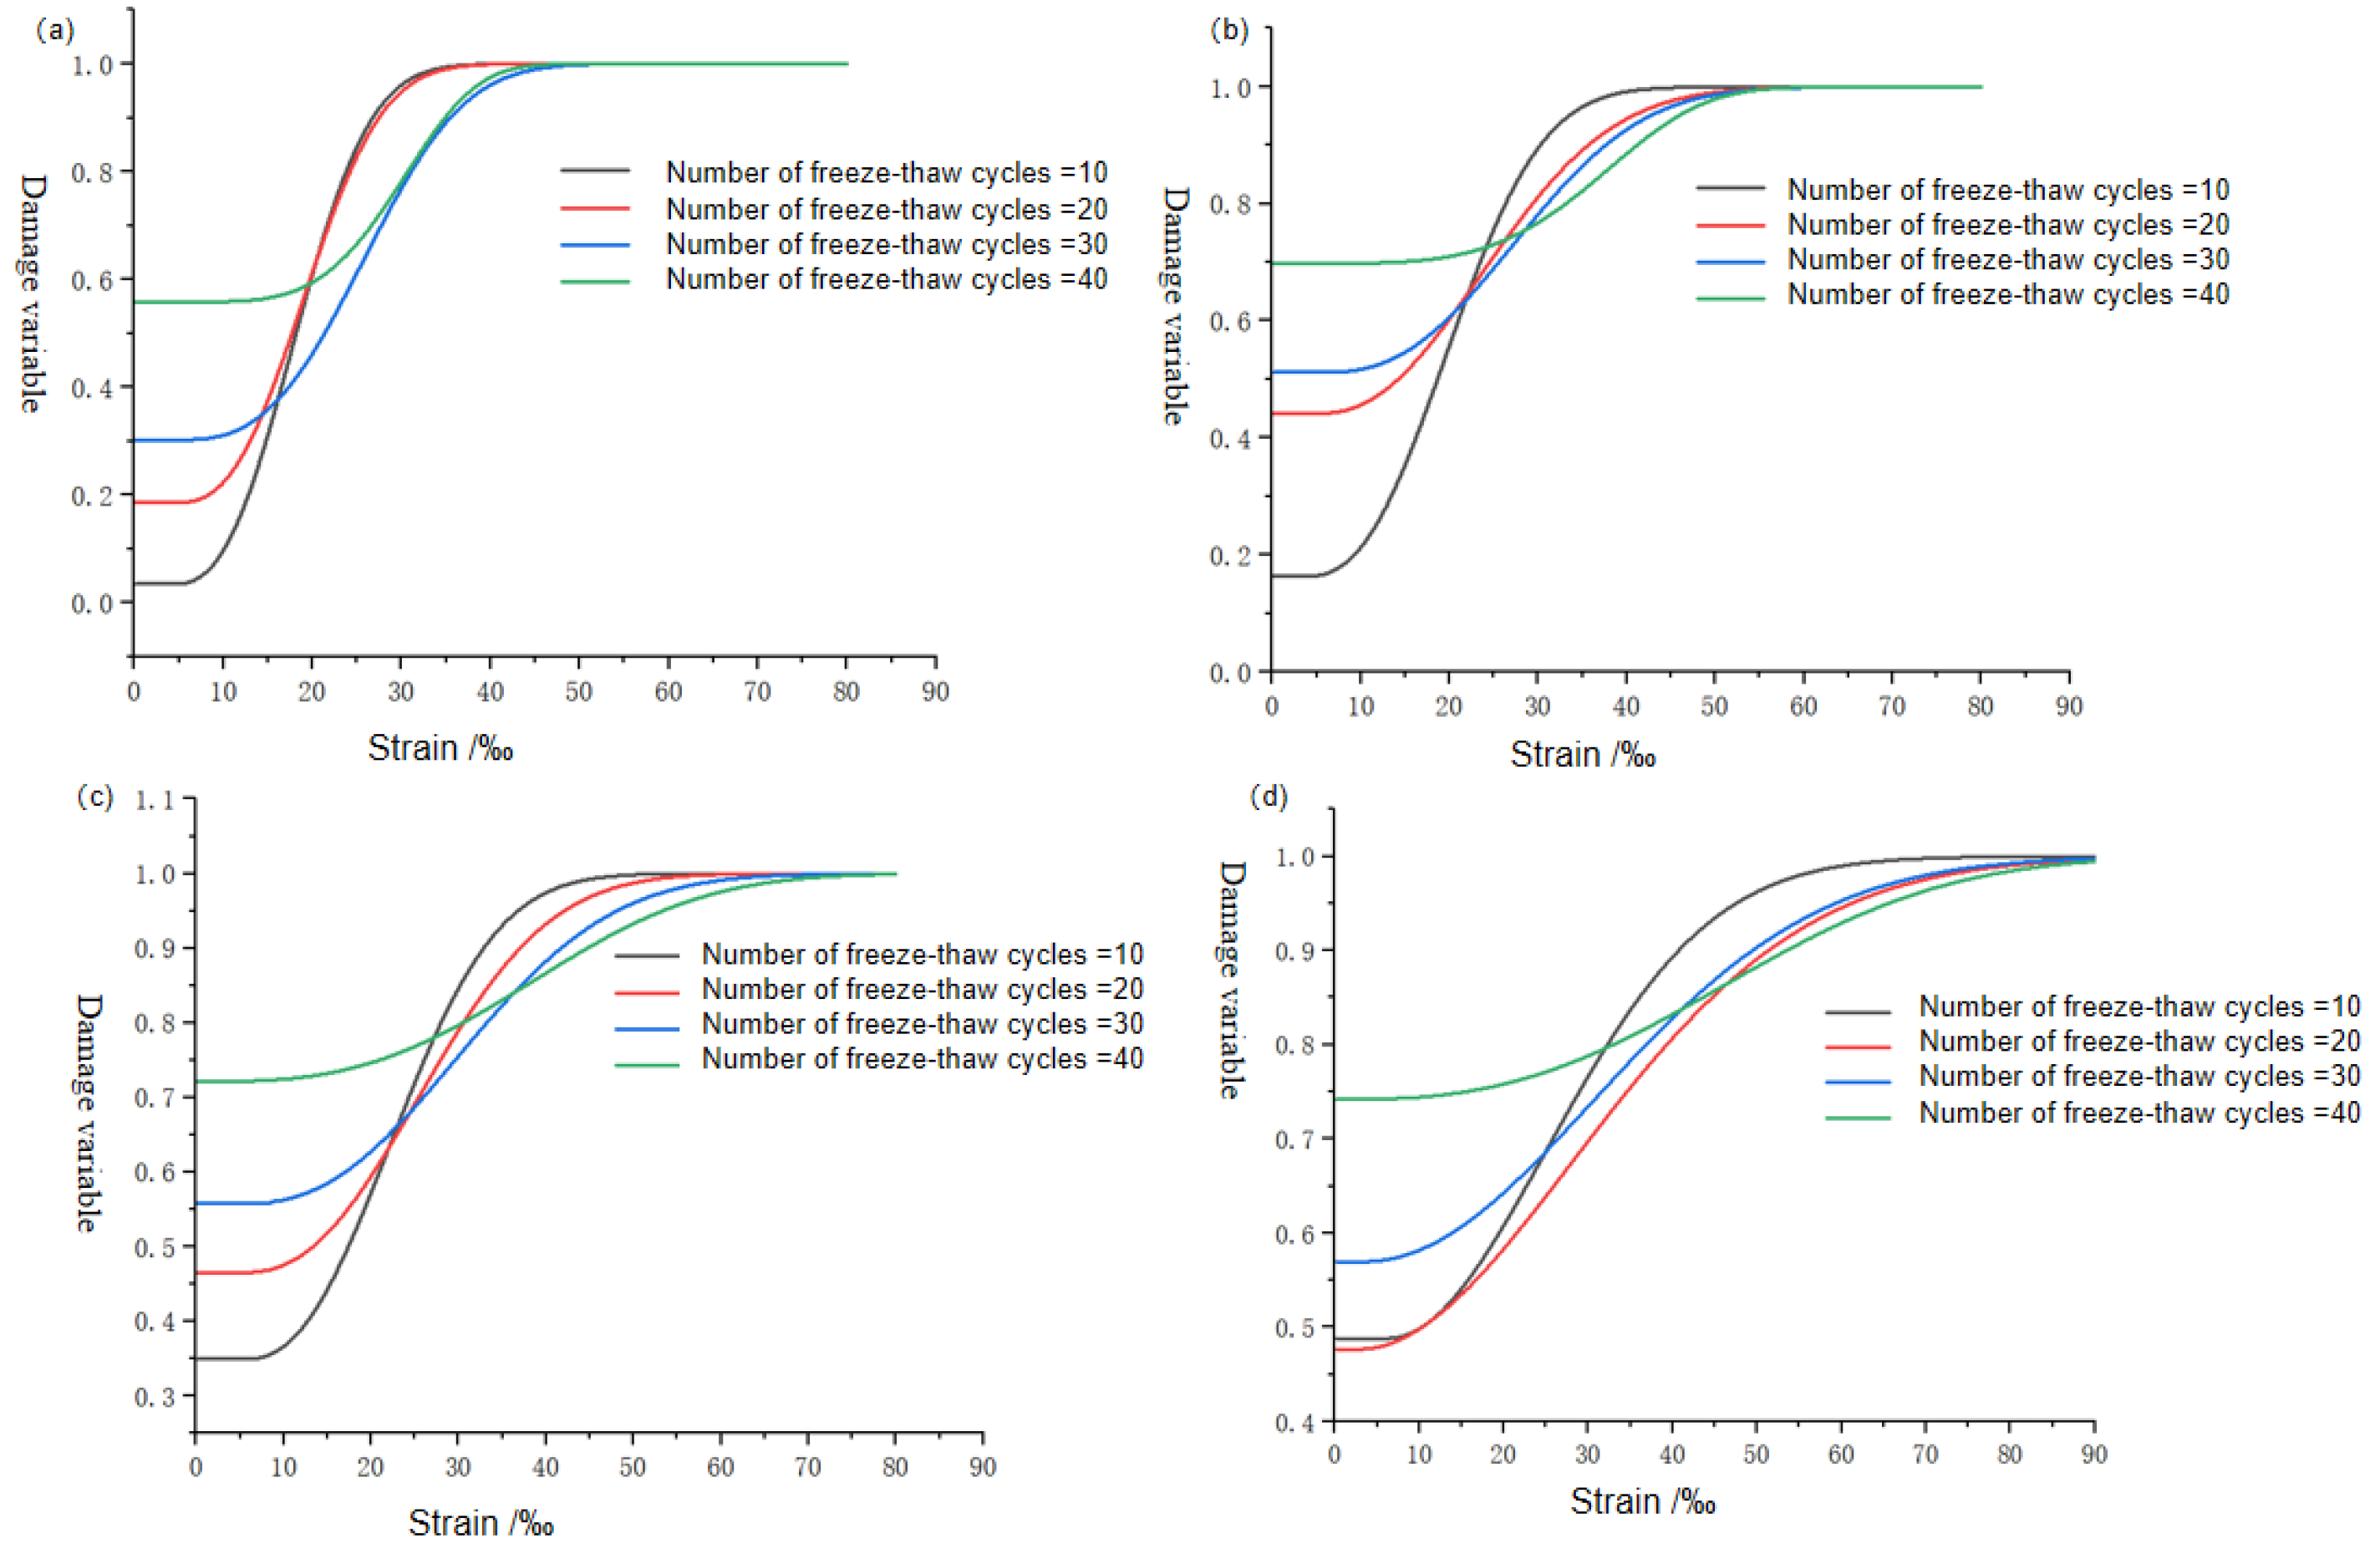
5.2. Damage Percentage Analysis of Rocks under Different FTCs

Based on the verified cumulative damage constitutive model describing the decay of rock shear strength, combined with Equation (36) for calculating rock damage percentage, the changes in rock damage mechanical properties under different freeze–thaw cycles can be obtained, as shown in Figure 8.
(1) It can be seen from Figure 8 that, under the same number of freeze–thaw cycles, the initial damage percentage of rocks gradually increases with the increase in freeze–thaw cycles. In addition, it can be seen from Figure 8a that with the increase in freeze–thaw cycles, the strain value required for the sliding zone soil to reach the damage variable of 1 under the same normal stress load also increases, i.e., as shown in Figure 8c, when the rock passes 10, 20, 30 and 40 times and the freeze–thaw cycle reaches the failure value 1, its shear strain is 52‰, 68‰, 75‰ and 81‰, respectively. A larger number of freeze–thaw cycles can lead to a larger shear displacement of the rock, and the change is obvious. Under the same number of freeze–thaw cycles, a larger number of freeze–thaw cycles will cause greater damage to the rock material.
(2) It can be seen from Figure 8b–d that, with the increase in the number of freeze–thaw cycles, the change in rock damage value tends to be gentle under different freeze–thaw cycles. At the same time, when the peak value of the curve describing the change of damage value reaches 1, the required final strain value gradually increases, indicating that more cracks appear in the rock with the increase in the number of freeze–thaw cycles. With the increase in the number of freeze–thaw cycles, cracks appear continuously in the rock, and obvious plastic zones appear along with them, making the rock produce plastic hardening characteristics under the accumulation of freeze–thaw cycles. Meanwhile, with the increase in the number of freeze–thaw cycles, the rock is damaged to different degrees. With the increase in freeze–thaw cycles, the greater the damage degree of the rock, the more damaged parts in the rock. The energy required to produce further damage is also greater, so the ductile failure characteristics of the rock are becoming more and more obvious.

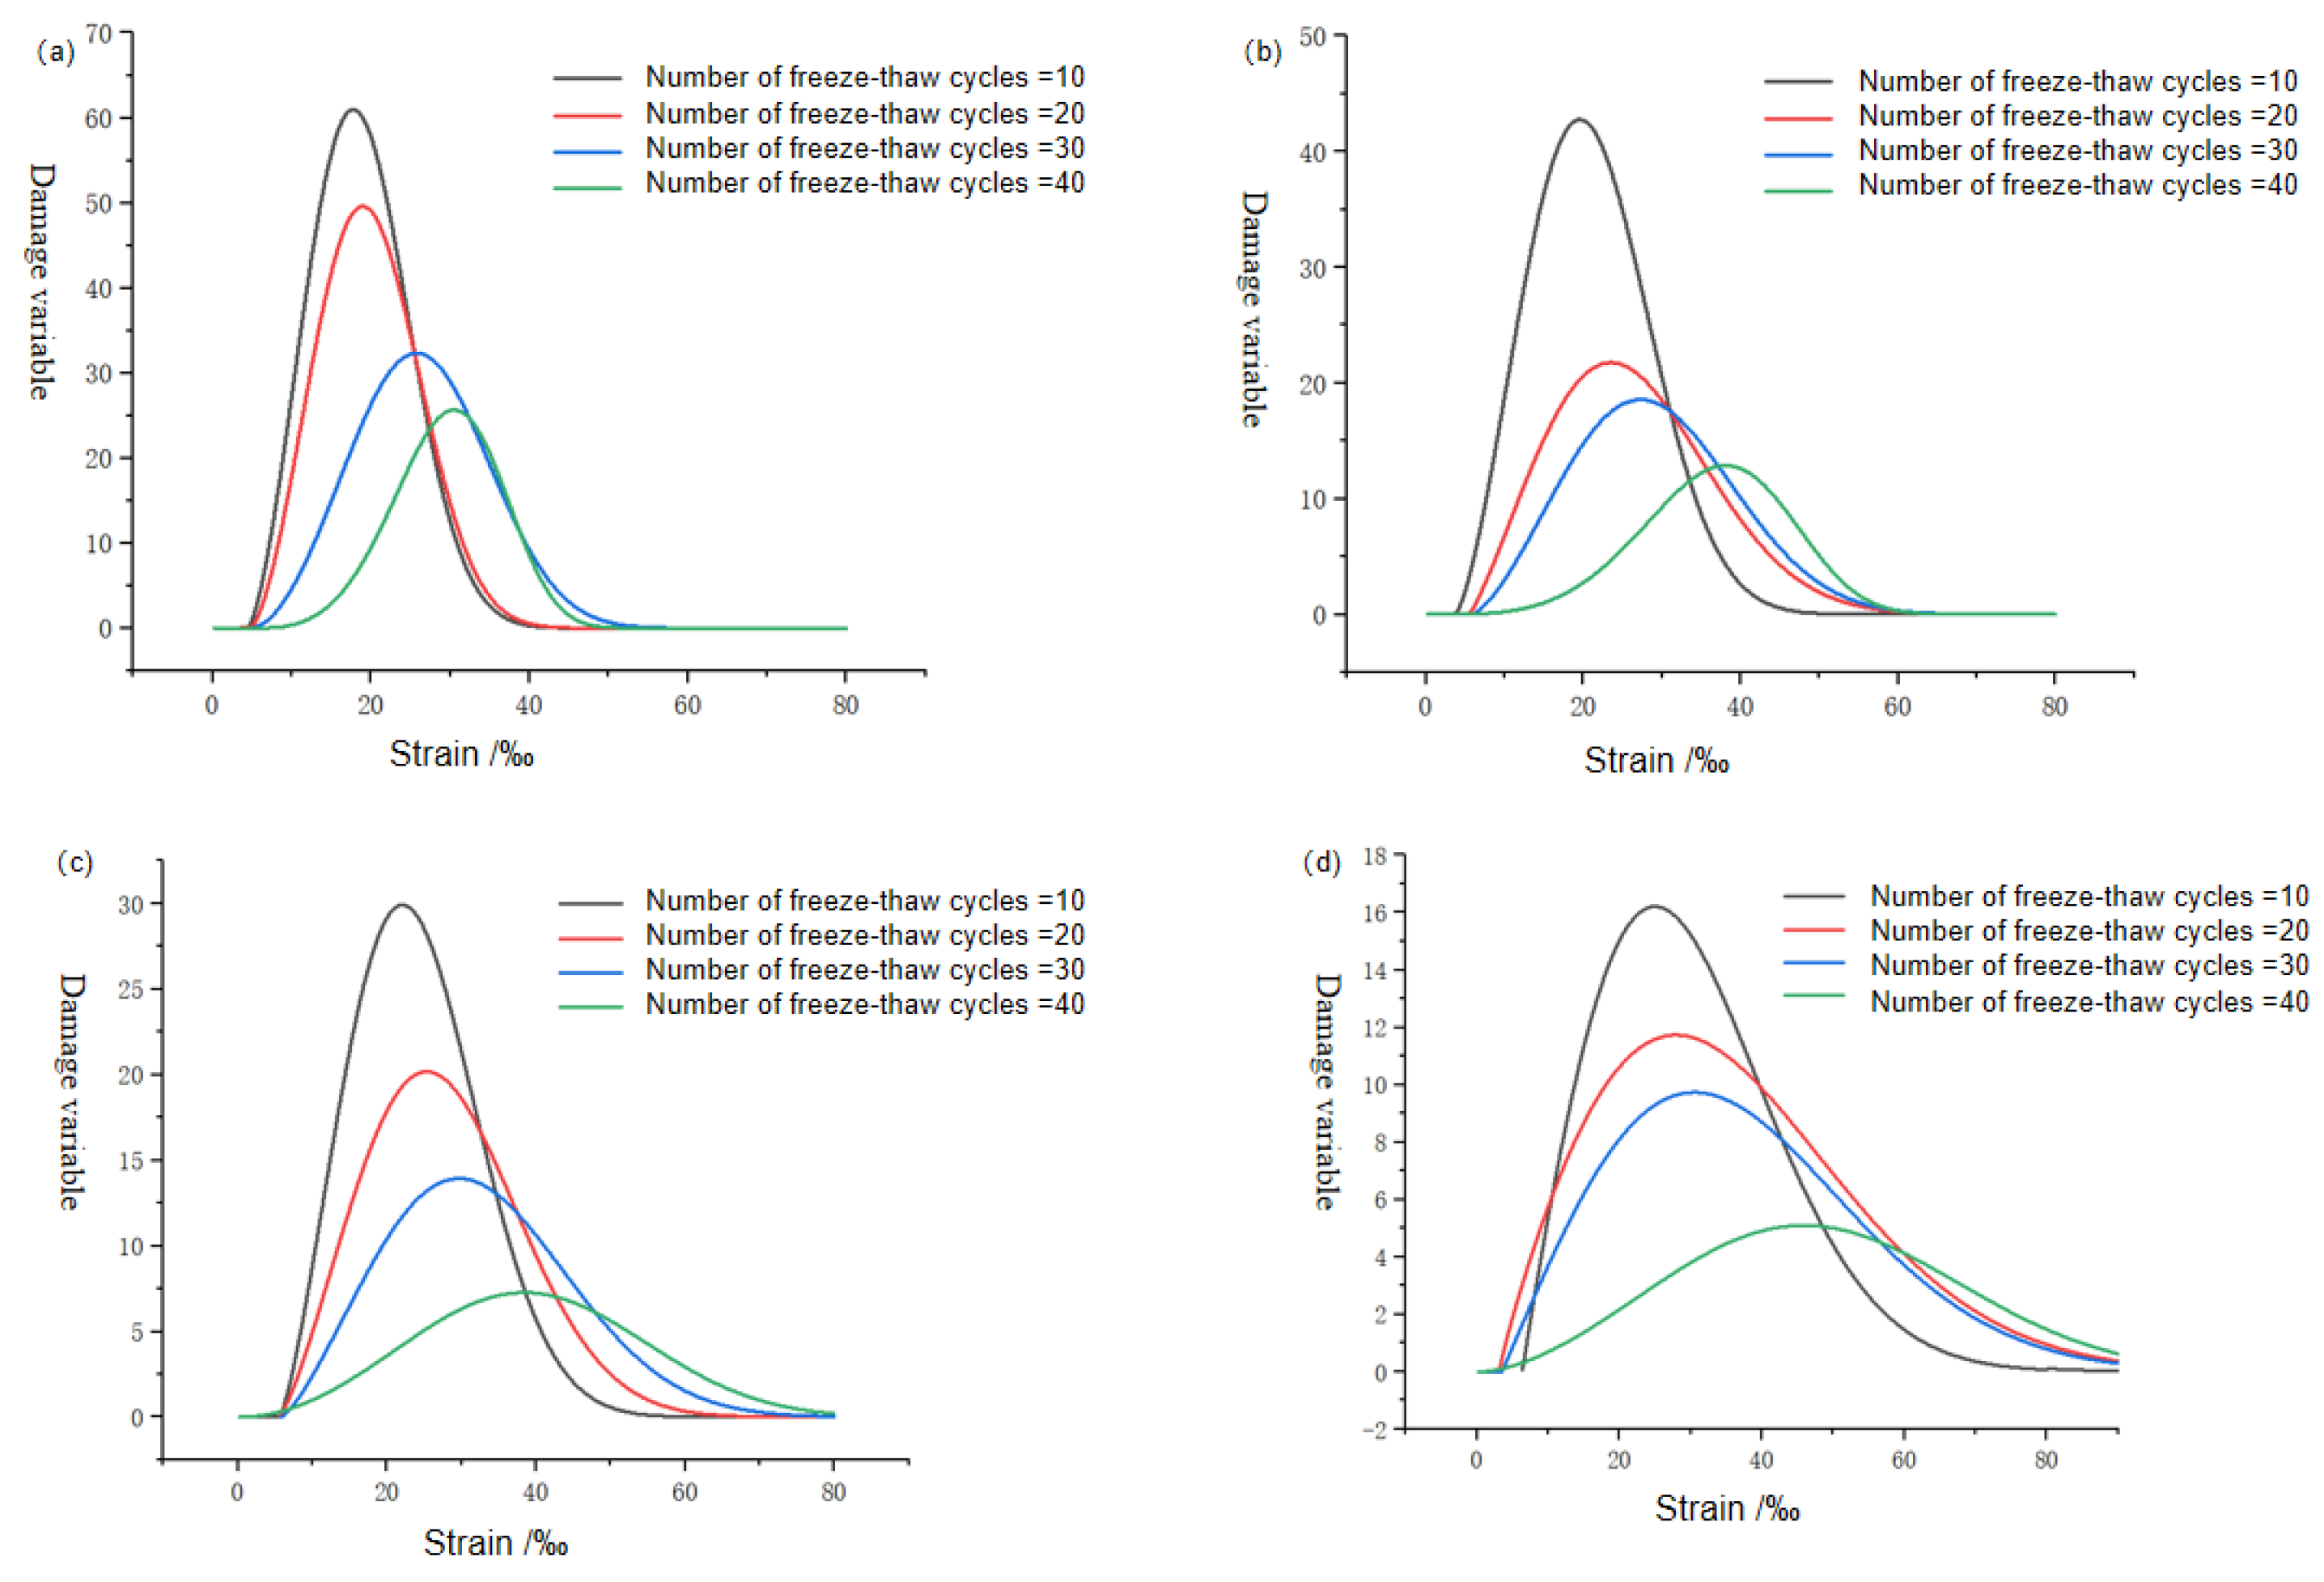
5.3. Analysis of Damage Evolution Rate of Rocks under Different FTCs

Combined with Equation (37), we analyzed the evolution law of rock damage change rate under different FTCs. As shown in Figure 9, with the increase in FTCs, the maximum damage rate of the rock decreases because of the time delay in the occurrence of damage. At the same time, the increase in FTCs increases the peak strain value of the rock damage change rate curve, indicating that the ductile failure characteristics of rock are gradually significant.

6. Conclusions

The stress-strain curves of rocks with various FTC strengths were obtained by dynamic compression tests under different loading rates and confining pressure. The study found:
(1) Through different FTC tests, the physical properties of rock samples change significantly. The FTC has a great influence on rock parameters, including saturation density, porosity and P-wave velocity. With the increase in FTC frequency, the mineral particles on the surface of the sample peel off, and the internal particles soften, resulting in the decrease in saturated mass, the expansion of pore structure, and the increase in mass loss rate. At the same time, the damage accumulation reduces the wave velocity.
(2) With the increase in the number of FTCs, the change in rock damage value gradually flattens, the final strain value increases, and the cracks increase. With the increase in FTCs, the peak strain value of rock damage change rate increases, indicating that the ductile failure characteristics are more and more significant.
(3) Although this study involves four FTC conditions, the results may be limited. In the future, by increasing the number of FTCs and confining pressure conditions, the mechanical properties of rocks under the coupling of freeze–thaw and confining pressure can be more comprehensively understood, and the universality of test results can be improved.

Author Contributions

Conceptualization, Y.L., Z.W., H.C. and T.W.; methodology, Y.L.; software, Y.L.; validation, Z.W.; writing-original draft preparation, T.W. and Z.W.; writing—review and editing, T.W. and H.C.; project administration, H.C. and H.C.; funding acquisition, T.W. and H.C. All authors have read and agreed to the published version of the manuscript.

Funding

This study was sponsored by the National Natural Science Foundation of China (Grant No. 52308393) and the State Key Laboratory of Precision Blasting and Hubei Key Laboratory of Blasting Engineering, Jianghan University (Grant No. PBSKL2023B2).

Data Availability Statement

The raw data supporting the conclusions of this article will be made available by the authors on request.

Conflicts of Interest

The authors declare no conflicts of interest.

References

  1. Zeng, Z.; Kong, L.; Wang, M.; Wang, J. Effects of remolding and wetting-drying-freezing-thawing cycles on the pore structures of Yanji mudstones. Cold Reg. Sci. Technol. 2020, 174, 103037. [Google Scholar] [CrossRef]
  2. Soltani, A. Comments on “effect of wetting–drying–freezing–thawing cycles on the swelling behaviour of the Yanji mudstone”[Environ Earth Sci (2019) 78: 435]. Environ. Earth Sci. 2019, 78, 512. [Google Scholar] [CrossRef]
  3. Wang, J.; Song, C.; Hou, A.; Miao, Y.; Yang, G.; Zhang, J. Effects of freezing-thawing cycle on peatland active organic carbon fractions and enzyme activities in the Da Xing’anling Mountains, Northeast China. Environ. Earth Sci. 2014, 72, 1853–1860. [Google Scholar] [CrossRef]
  4. Zeng, Z.; Kong, L. Effect of wetting–drying–freezing-thawing cycles on the swelling behavior of the Yanji mudstone. Environ. Earth Sci. 2019, 78, 435. [Google Scholar] [CrossRef]
  5. Martinez, J.; Benavente, D.; Gomez-Heras, M.; Marco-Castaño, L.; García-del-Cura, M.Á. Non-linear decay of building stones during freeze-thaw weathering processes. Constr. Build. Mater. 2013, 38, 443–454. [Google Scholar] [CrossRef]
  6. Yamabe, T.; Neaupane, K.M. Determination of some thermo-mechanical properties of Sirahama rock under subzero temperature condition. Int. J. Rock Mech. Min. Sci. 2001, 38, 1029–1034. [Google Scholar] [CrossRef]
  7. Park, C.; Synn, J.H.; Shin, H.S.; Cheon, D.S.; Lim, H.D.; Jeon, S.W. Experimental study on the thermal characteristics of rock at low temperatures. Int. J. Rock Mech. Min. Sci. 2004, 41, 81–86. [Google Scholar] [CrossRef]
  8. Sondergeld, C.H.; Rai, C.S. Velocity and resistivity changes during FTC in Berea rock. Geophysics 2007, 72, E99–E105. [Google Scholar] [CrossRef]
  9. Del Roa, L.M.; Lopez, F.; Esteban, F.J.; Tejado, J.J.; Mota, M.I.; González, I.; Ramos, A.; San Emeterio, J.L. Ultrasonic study of alteration processes in granites caused by freezing and thawing. In Proceedings of the IEEE Ultrasonics Symposium 2005, Rotterdam, The Netherlands, 18–21 September 2005. [Google Scholar]
  10. Janach, W. The role of bulking in brittle failure of rocks under rapid compression. Int. J. Rock Mech. Min. Sci. Geomech. Abstr. 1976, 13, 177–186. [Google Scholar] [CrossRef]
  11. Lankford, J. The role of tensile microfracture in the strain rate dependence of compressive strength of fine-grained limestone—Analogy with strong ceramics. Int. J. Rock Mech. Min. Sci. Geomech. Abstr. 1981, 18, 173–175. [Google Scholar] [CrossRef]
  12. Olsson, W.A. The compressive strength of tuff as a function of strain rate from 10−6 to 103/sec. Int. J. Rock Mech. Min. Sci. Geomech. Abstr. 1991, 28, 115–118. [Google Scholar] [CrossRef]
  13. Zhou, K.P.; Li, B.; Li, J.L.; Deng, H.W.; Feng, B.I.N. Microscopic damage and dynamic mechanical properties of rock under freeze-thaw environment. Trans. Nonferrous Met. Soc. China 2015, 25, 1254–1261. [Google Scholar] [CrossRef]
  14. Kawakata, H.; Cho, A.; Yanagidani, T.; Shimada, M. The observations of faulting in westerly granite under triaxial compression by X-ray CT scan. Int. J. Rock Mech. Min. Ences 1997, 34, 151.e1–151.e12. [Google Scholar] [CrossRef]
  15. Kawakata, H.; Cho, A.; Kiyama, T.; Yanagidani, T.; Kusunose, K.; Shimada, M. Three-dimensional observations of faulting process in Westerly granite under uniaxial and triaxial conditions by X-ray CT scan. Tectonophysics 1999, 313, 293–305. [Google Scholar] [CrossRef]
  16. Kyoya, T.; Baek, Y.; Onda, C. On deterioration of Oya-tuff in freezing-thawing cycle and its quantitative description. Doboku Gakkai Ronbunshu 2000, 652, 103–114. [Google Scholar] [CrossRef] [PubMed]
  17. Sun, Y.; Zhai, C.; Qin, L.; Xu, J.; Yu, G. Coal pore characteristics at different freezing temperatures under conditions of freezing-thawing cycles. Environ. Earth Sci. 2018, 77, 525. [Google Scholar] [CrossRef]
  18. Tiwari, N.; Satyam, N.; Singh, K. Effect of Curing on Micro-Physical Performance of Polypropylene Fiber Reinforced and Silica Fume Stabilized Expansive Soil Under Freezing Thawing Cycles. Sci. Rep. 2020, 10, 7624. [Google Scholar] [CrossRef] [PubMed]
  19. Sellares, J.; Mas, S.; Melo, E.; Sanchez, F.; Marin, J.; Gea, J.; Barreiro, E. Oxidative stress time course in the rat diaphragm after freezing-thawing cycles. Respir. Physiol. Neurobiol. 2006, 155, 156–166. [Google Scholar] [CrossRef] [PubMed]
  20. GBT 50266-2013; Test Method Standard for Engineering Rock Mass. China Planning Press: Beijing, China, 2013. (In Chinese)
  21. Wei, W.Y.; Wei, L.D. Study on statistical damage constitutive model of rock. Chin. J. Rock Mech. Eng. 2002, 21, 787–791. (In Chinese) [Google Scholar]
Figure 1. Photos of some rock samples before the freeze–thaw experiment.
Applsci 14 04627 g001
Figure 2. Relation of saturation density and porosity of rocks with the number of FTCs after freeze–thaw test: (a) Porosity; (b) Saturation density.
Applsci 14 04627 g002
Figure 3. The relationship between rock mass loss rate and p-wave velocity with the number of FTCs: (a) P-wave velocity; (b) Quality damage rate.
Applsci 14 04627 g003
Figure 4. Changes in static elastic modulus and freeze–thaw coefficient of rocks under different cyclic damage states of freeze–thaw: (a) Elastic modulus; (b) Freeze–thaw coefficient.
Applsci 14 04627 g004
Figure 5. Shear stress diagram of rock microelements.
Applsci 14 04627 g005
Figure 6. Diagram of the Mohr–Coulomb criterion.
Applsci 14 04627 g006
Figure 7. Comparison between test and theoretical curves [21].
Applsci 14 04627 g007
Figure 8. Damage percentage of rocks under different FTCs: (a) Confining pressure = 0; (b) Confining pressure = 2 MPa; (c) Confining pressure = 5 MPa; (d) Confining pressure = 10 MPa.
Applsci 14 04627 g008
Figure 9. Damage evolution rate of rocks under different FTCs: (a) Confining pressure = 0; (b) Confining pressure = 2 MPa; (c) Confining pressure = 5 MPa; (d) Confining pressure = 10 MPa.
Applsci 14 04627 g009
Table 1. Mean saturated strength and strength loss rate of samples after different FTCs.
Mean Compressive Strength at Unfrozen and Thawing Saturation (MPa)0 Times of FTC 10 Times of FTC 20 Times of FTC 30 Times of FTC40 Times of FTC
Saturated Water Compressive Strength (MPa)Loss Rate of Freeze–Thaw Strength (%)Saturated Water Compressive Strength (MPa)Loss Rate of Freeze–Thaw Strength (%)Compressive Strength in Saturated Water (MPa)Loss Rate of Freeze–Thaw Strength (%)Compressive Strength in Saturated Water (MPa)Loss Rate of Freeze–Thaw Strength (%)Saturated Water Compressive Strength (MPa)Loss Rate of Freeze–Thaw Strength (%)
125.7119.50116.97.00113.29.94111.711.14105.615.99
Table 2. Parameter values of cumulative damage model of rock shear strength under different normal stresses and FTCs.
Number of FTCsConfining Pressure/MPaExtreme Stress
/MPa
Modulus of Elasticity
/GPa
1004.230.867
10214.51.295
10519.61.452
101024.31.565
2003.80.761
20212.71.156
20518.91.289
201023.51 325
3003.740.529
30211.30.890
30518.11.066
301022.91.240
4003.30.515
40210.50.710
40517.20.917
401021.20.932
Disclaimer/Publisher’s Note: The statements, opinions and data contained in all publications are solely those of the individual author(s) and contributor(s) and not of MDPI and/or the editor(s). MDPI and/or the editor(s) disclaim responsibility for any injury to people or property resulting from any ideas, methods, instructions or products referred to in the content.

