

Removal of Color-Document Image Show-Through Based on Self-Supervised Learning

Abstract
1. Introduction
- The foreground and show-through parts in document images are highly similar because they both comprise document content. Without additional prior knowledge, it is difficult to accurately recover the desired foreground images.
- In real-world scenarios, there is a lack of authentic images that match the show-through images, making supervised training infeasible. As a result, most document image processing algorithms rely on synthetic training data. However, there exists a gap between synthetic and real-world data, which limits the performance of these algorithms.
2. Related Work
2.1. Show-through-Removal Method
2.2. GAN
2.3. Cycle Consistency Loss
3. Proposed Methods
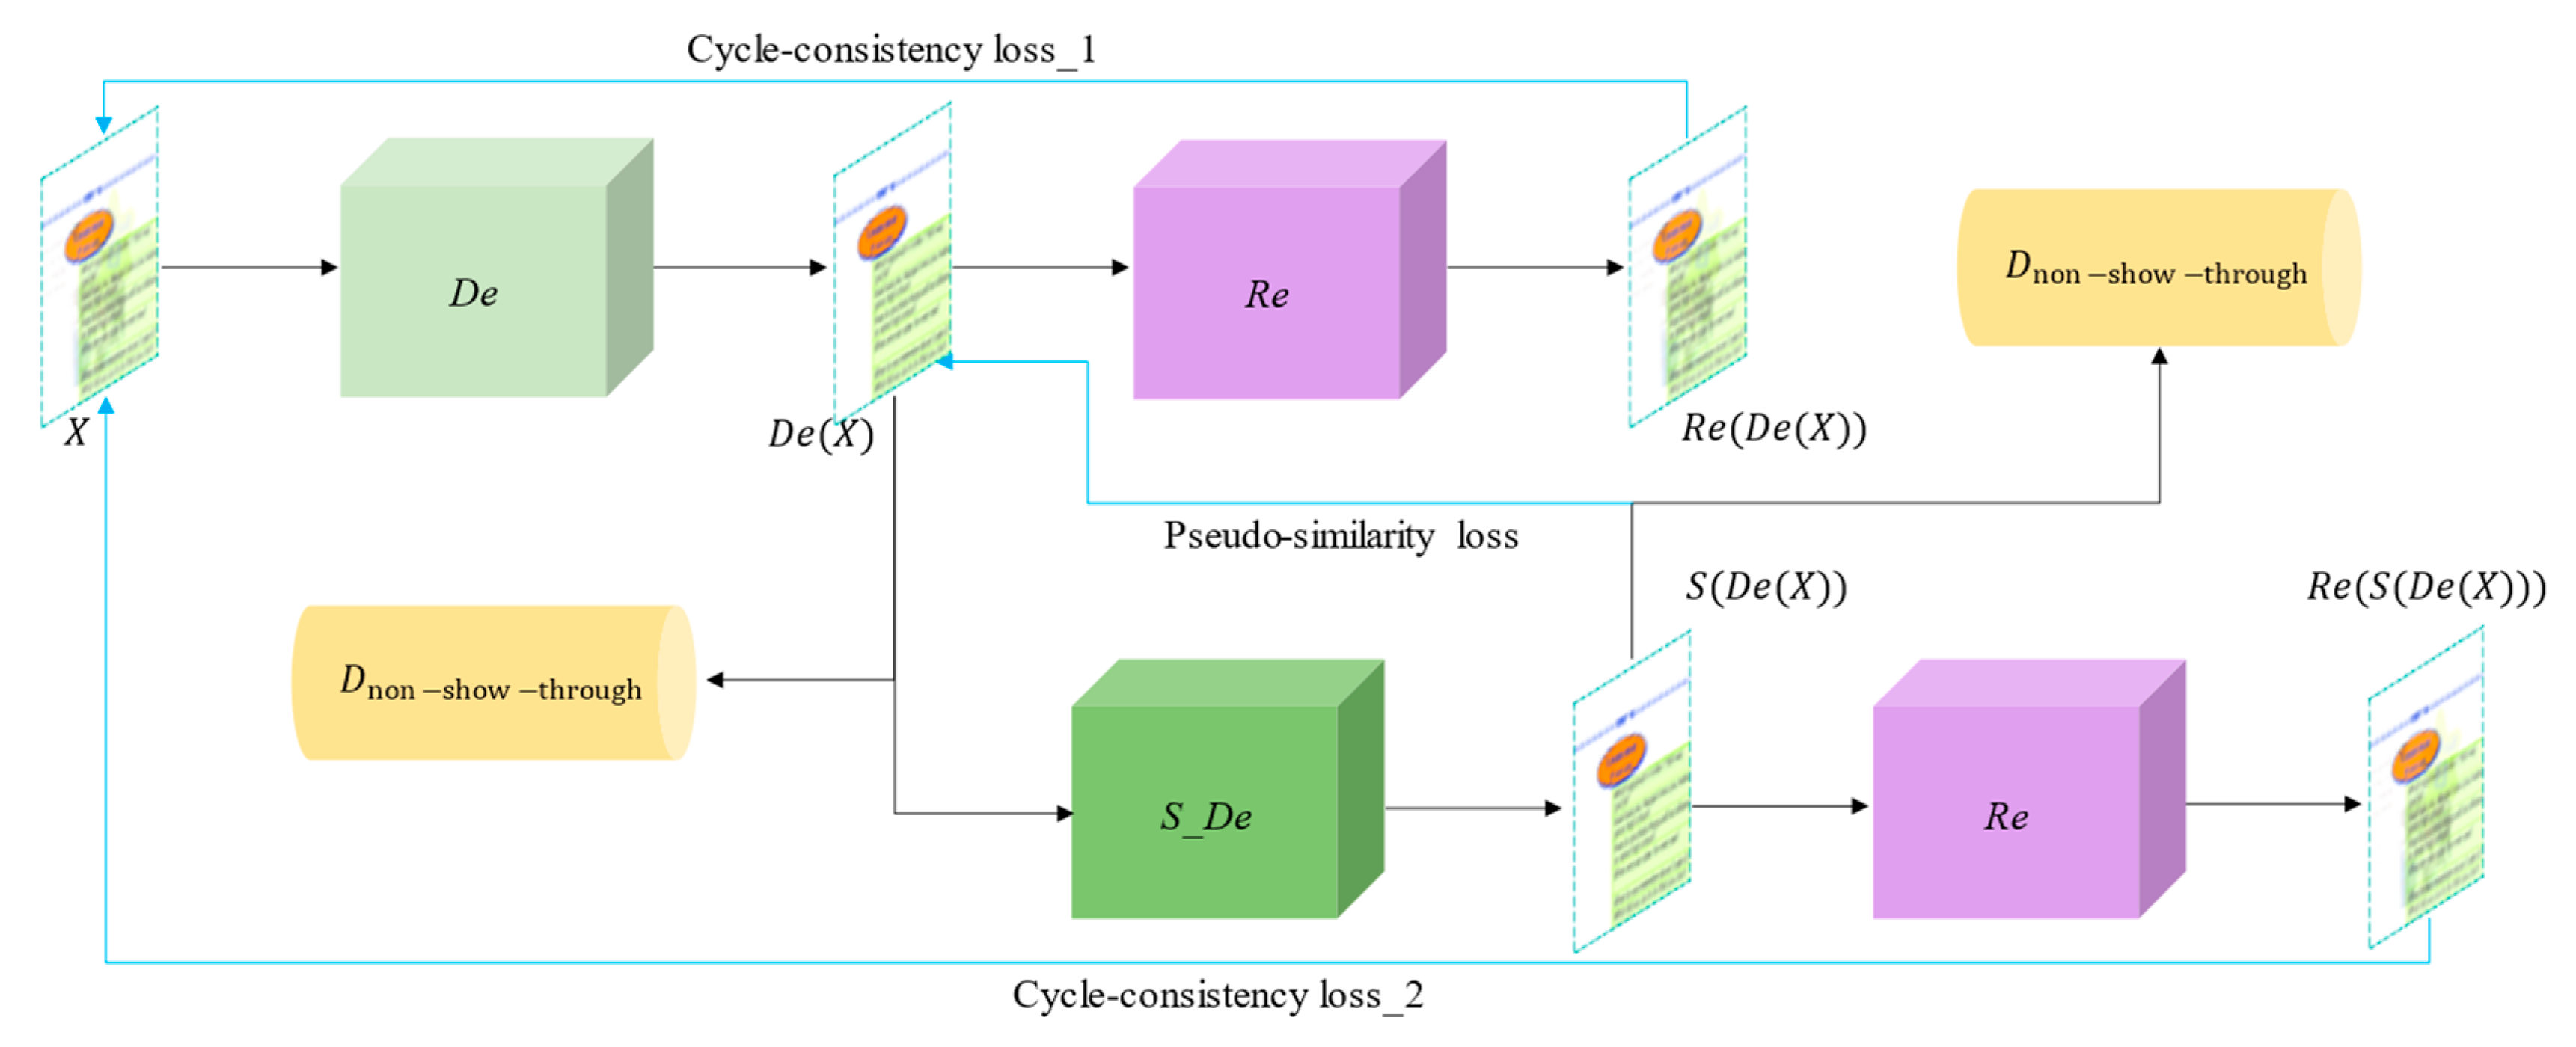
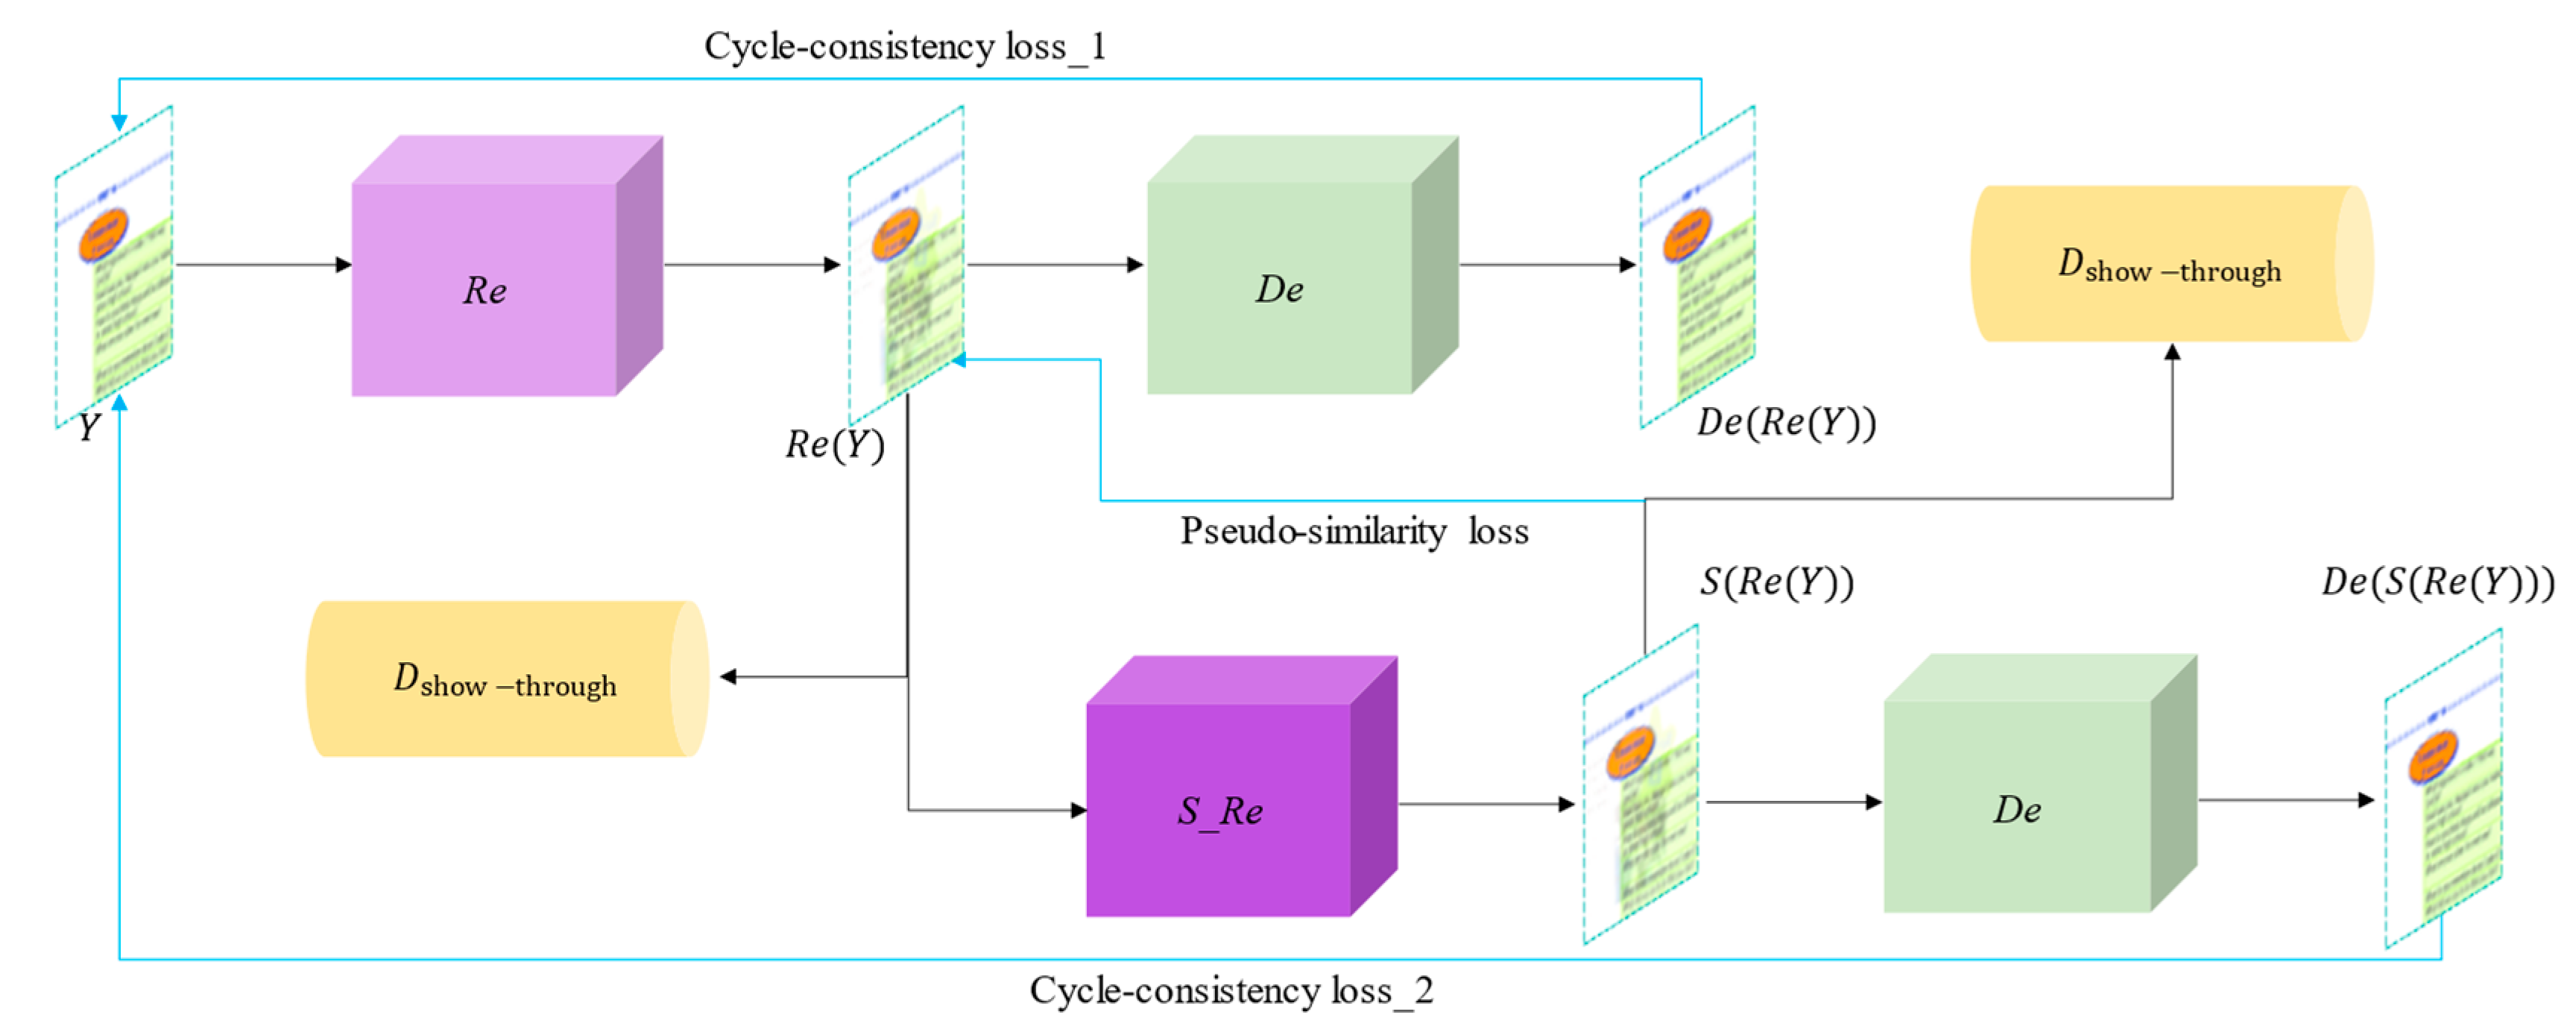
3.1. Overall Network Framework
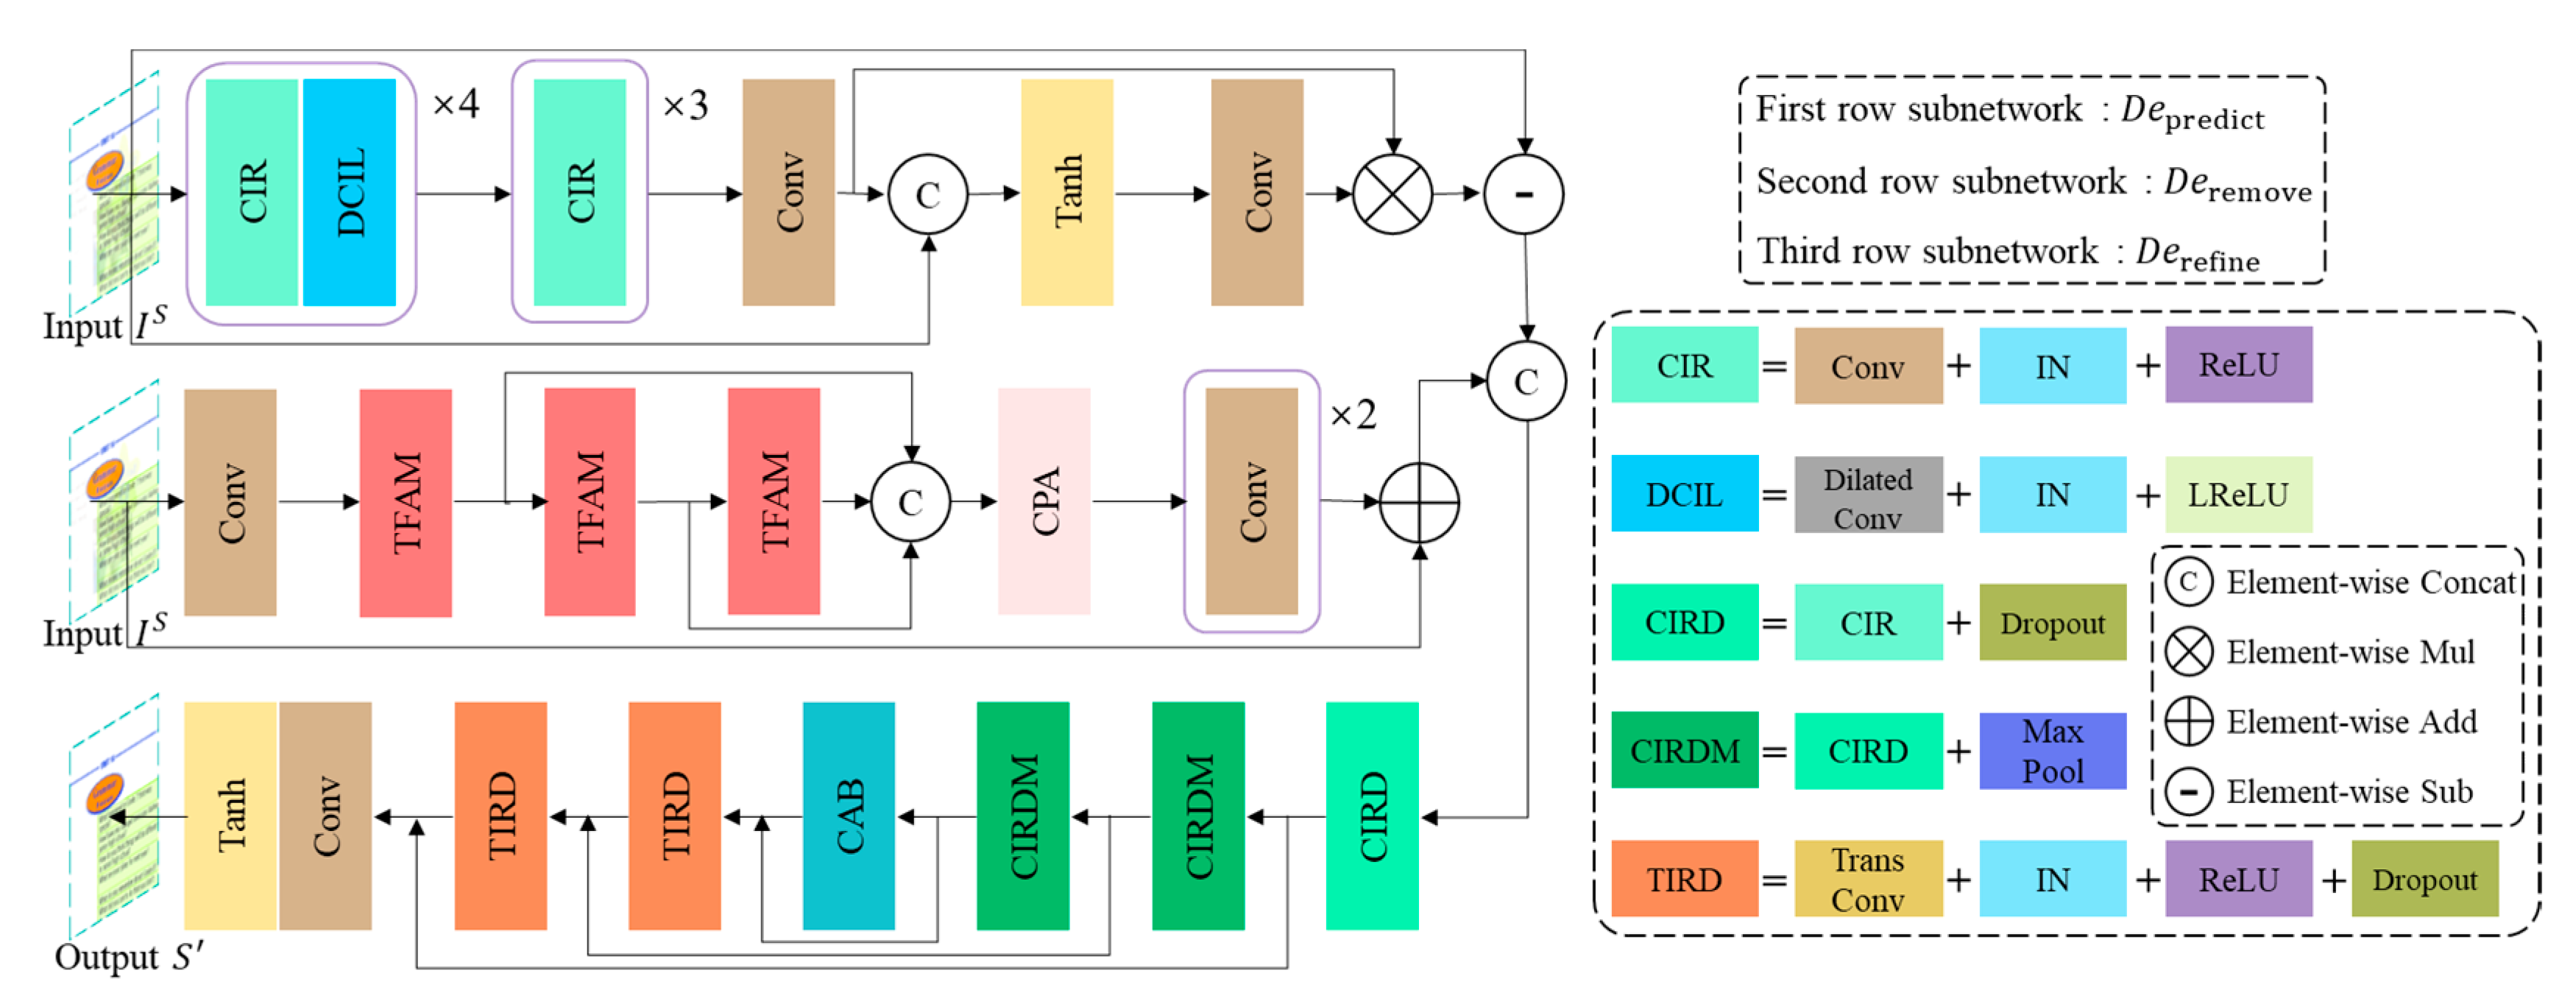
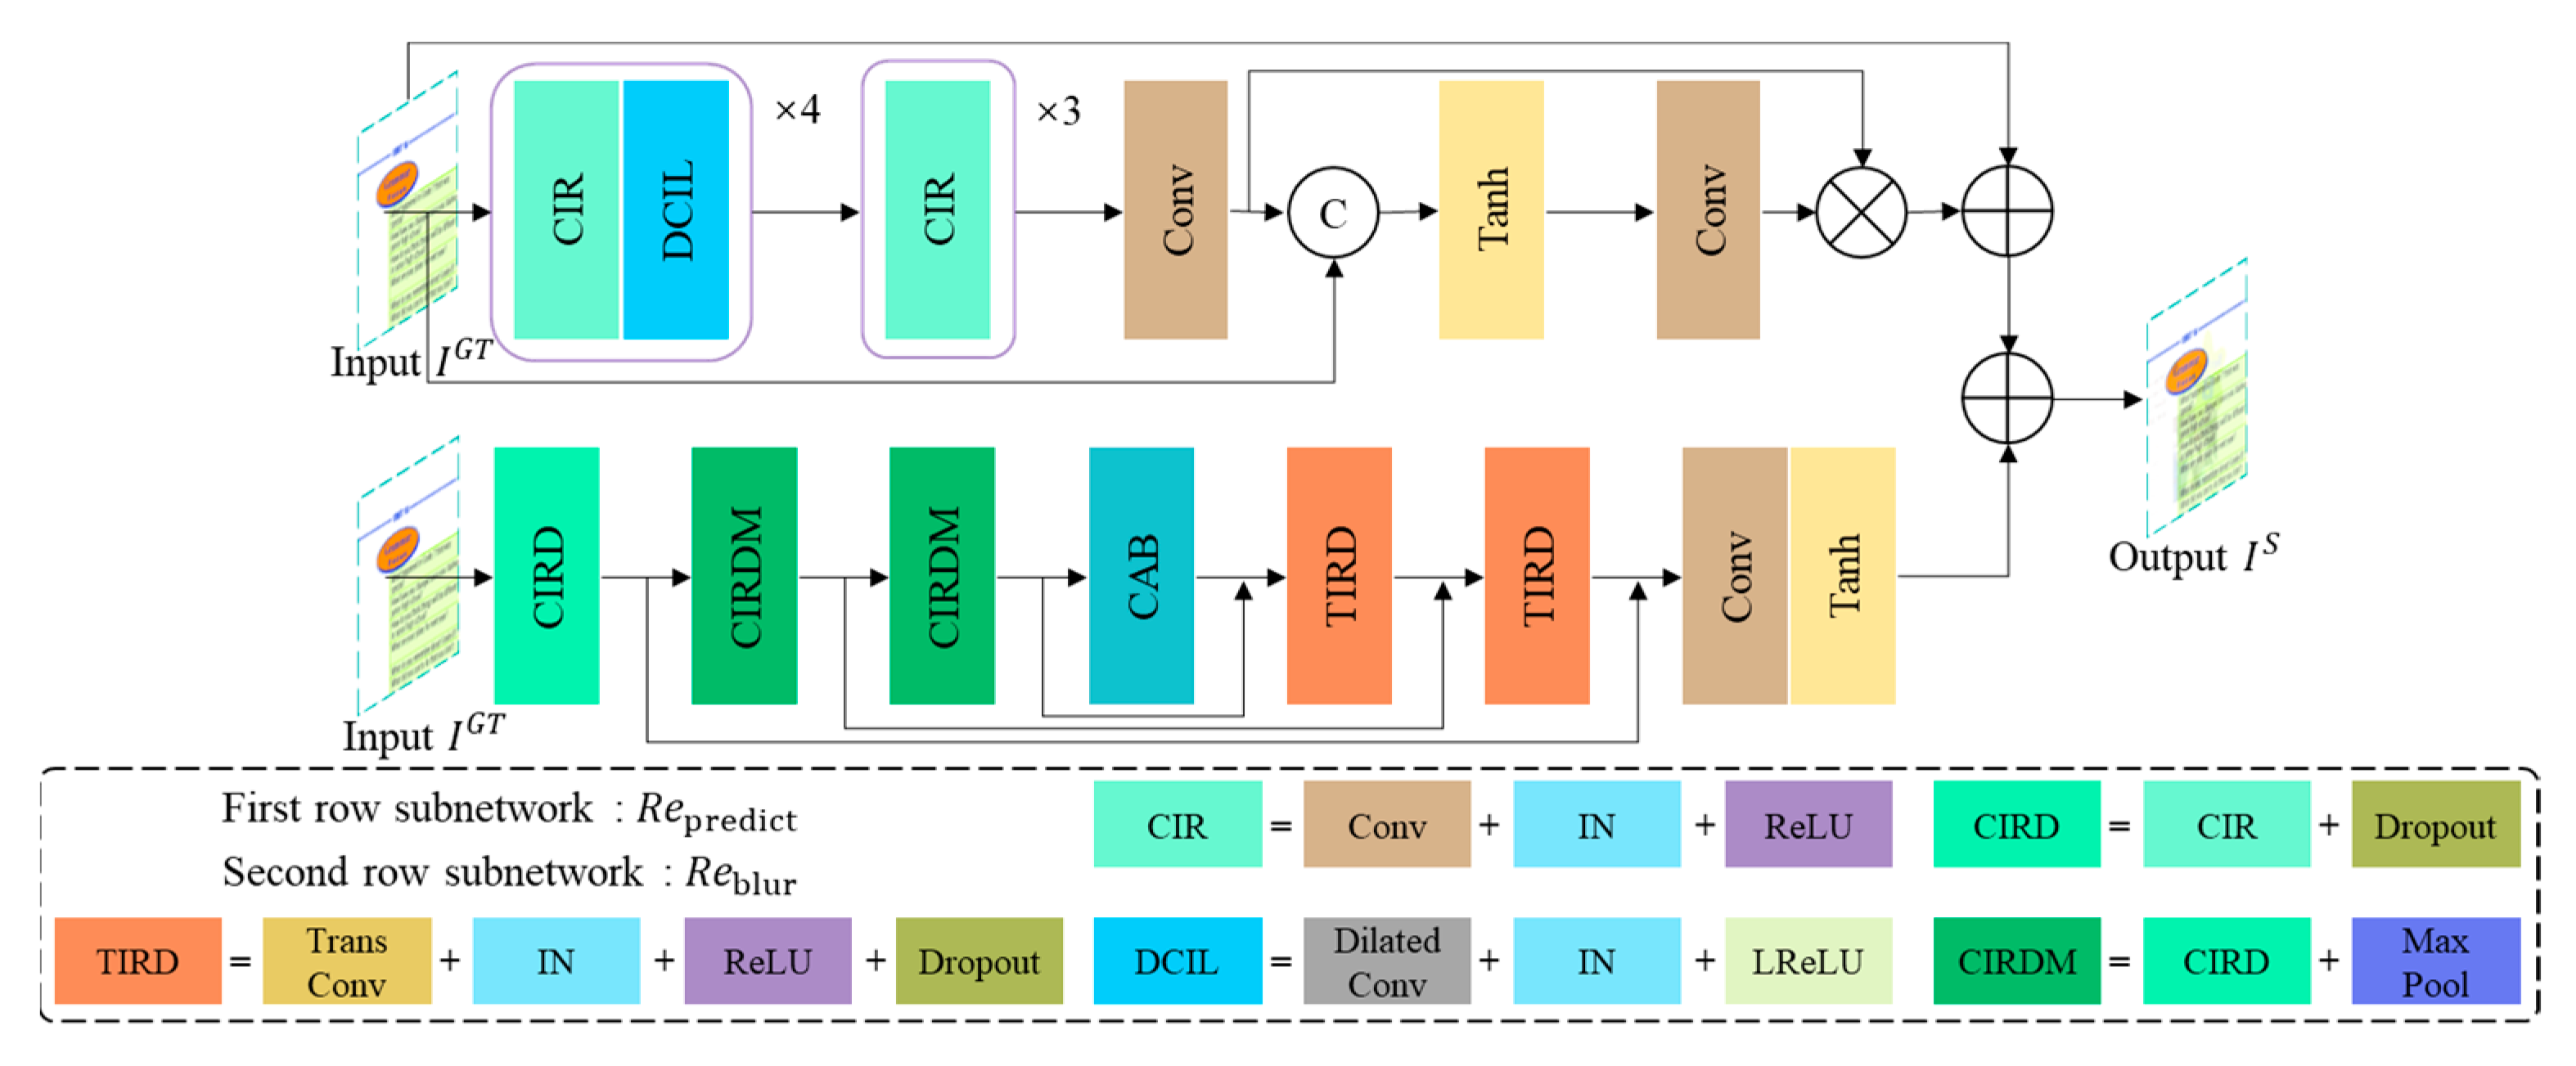
3.2. Generative Network
- (1)
- Generator
- (2)
- Generator
- (3)
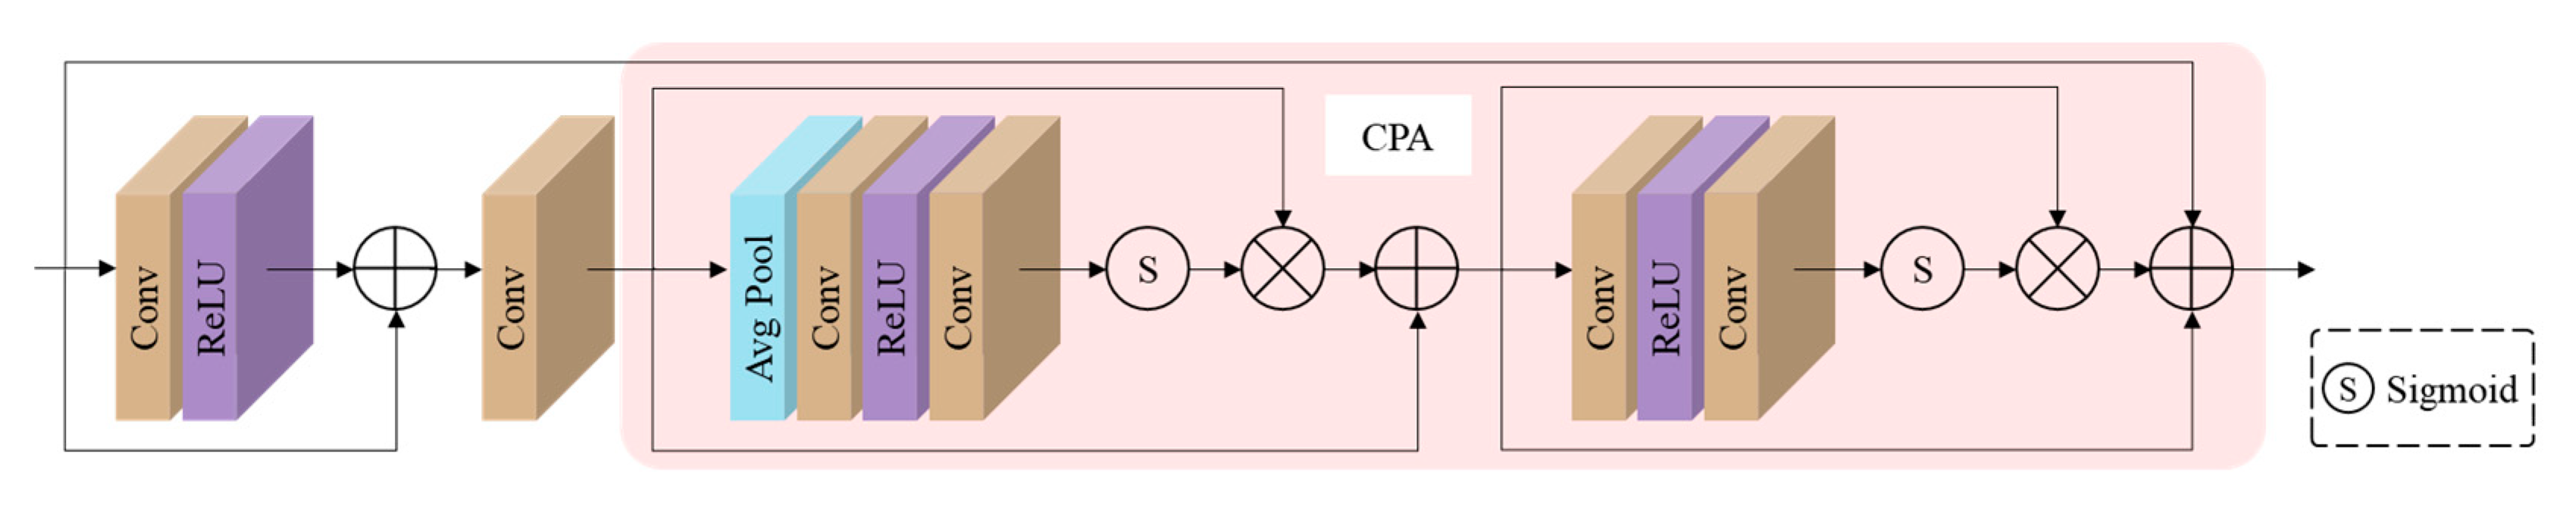
- Similarity Network
3.3. Discriminative Network
3.4. Loss Functions
- (1)
- Adversarial loss
- (2)
- Cycle consistency loss
- (3)
- Identity loss
- (4)
- Pseudo-similarity loss
- (5)
- Perceptual loss
- (6)
- Total loss
4. Experimental Results and Analysis
4.1. Implementation Details and Parameter Settings
4.2. Dataset and Evaluation Metrics
- (1)
- Synthetic dataset
- (2)
- Real dataset
- (3)
- Evaluation metrics:
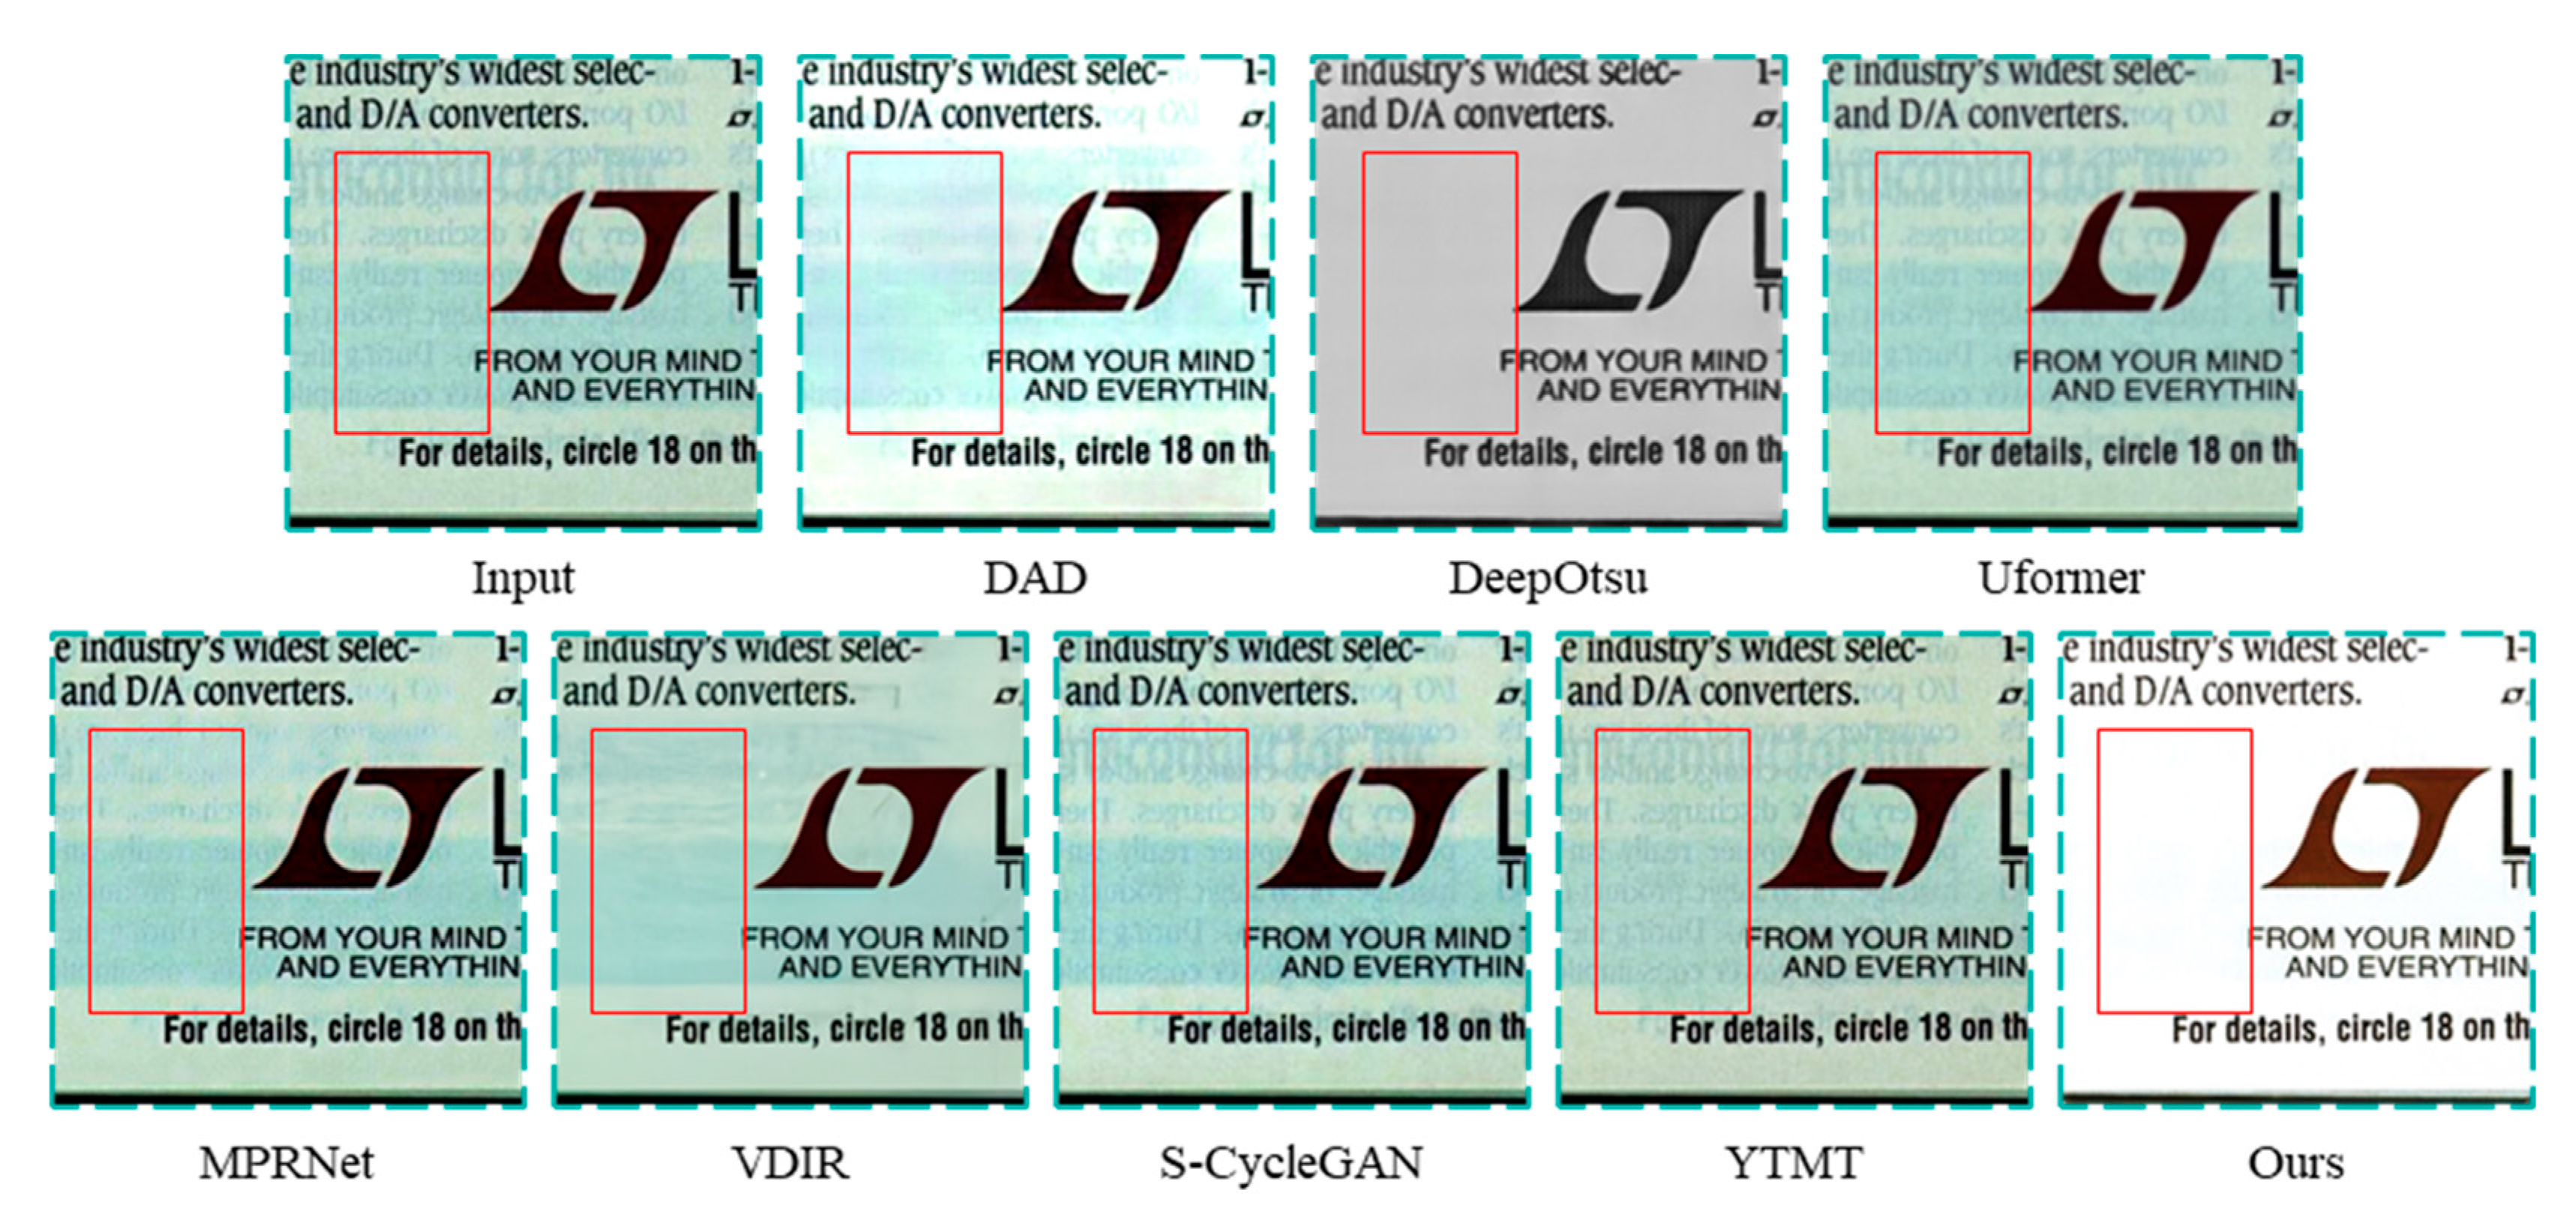
4.3. Analysis of Experimental Results on Synthesized Dataset
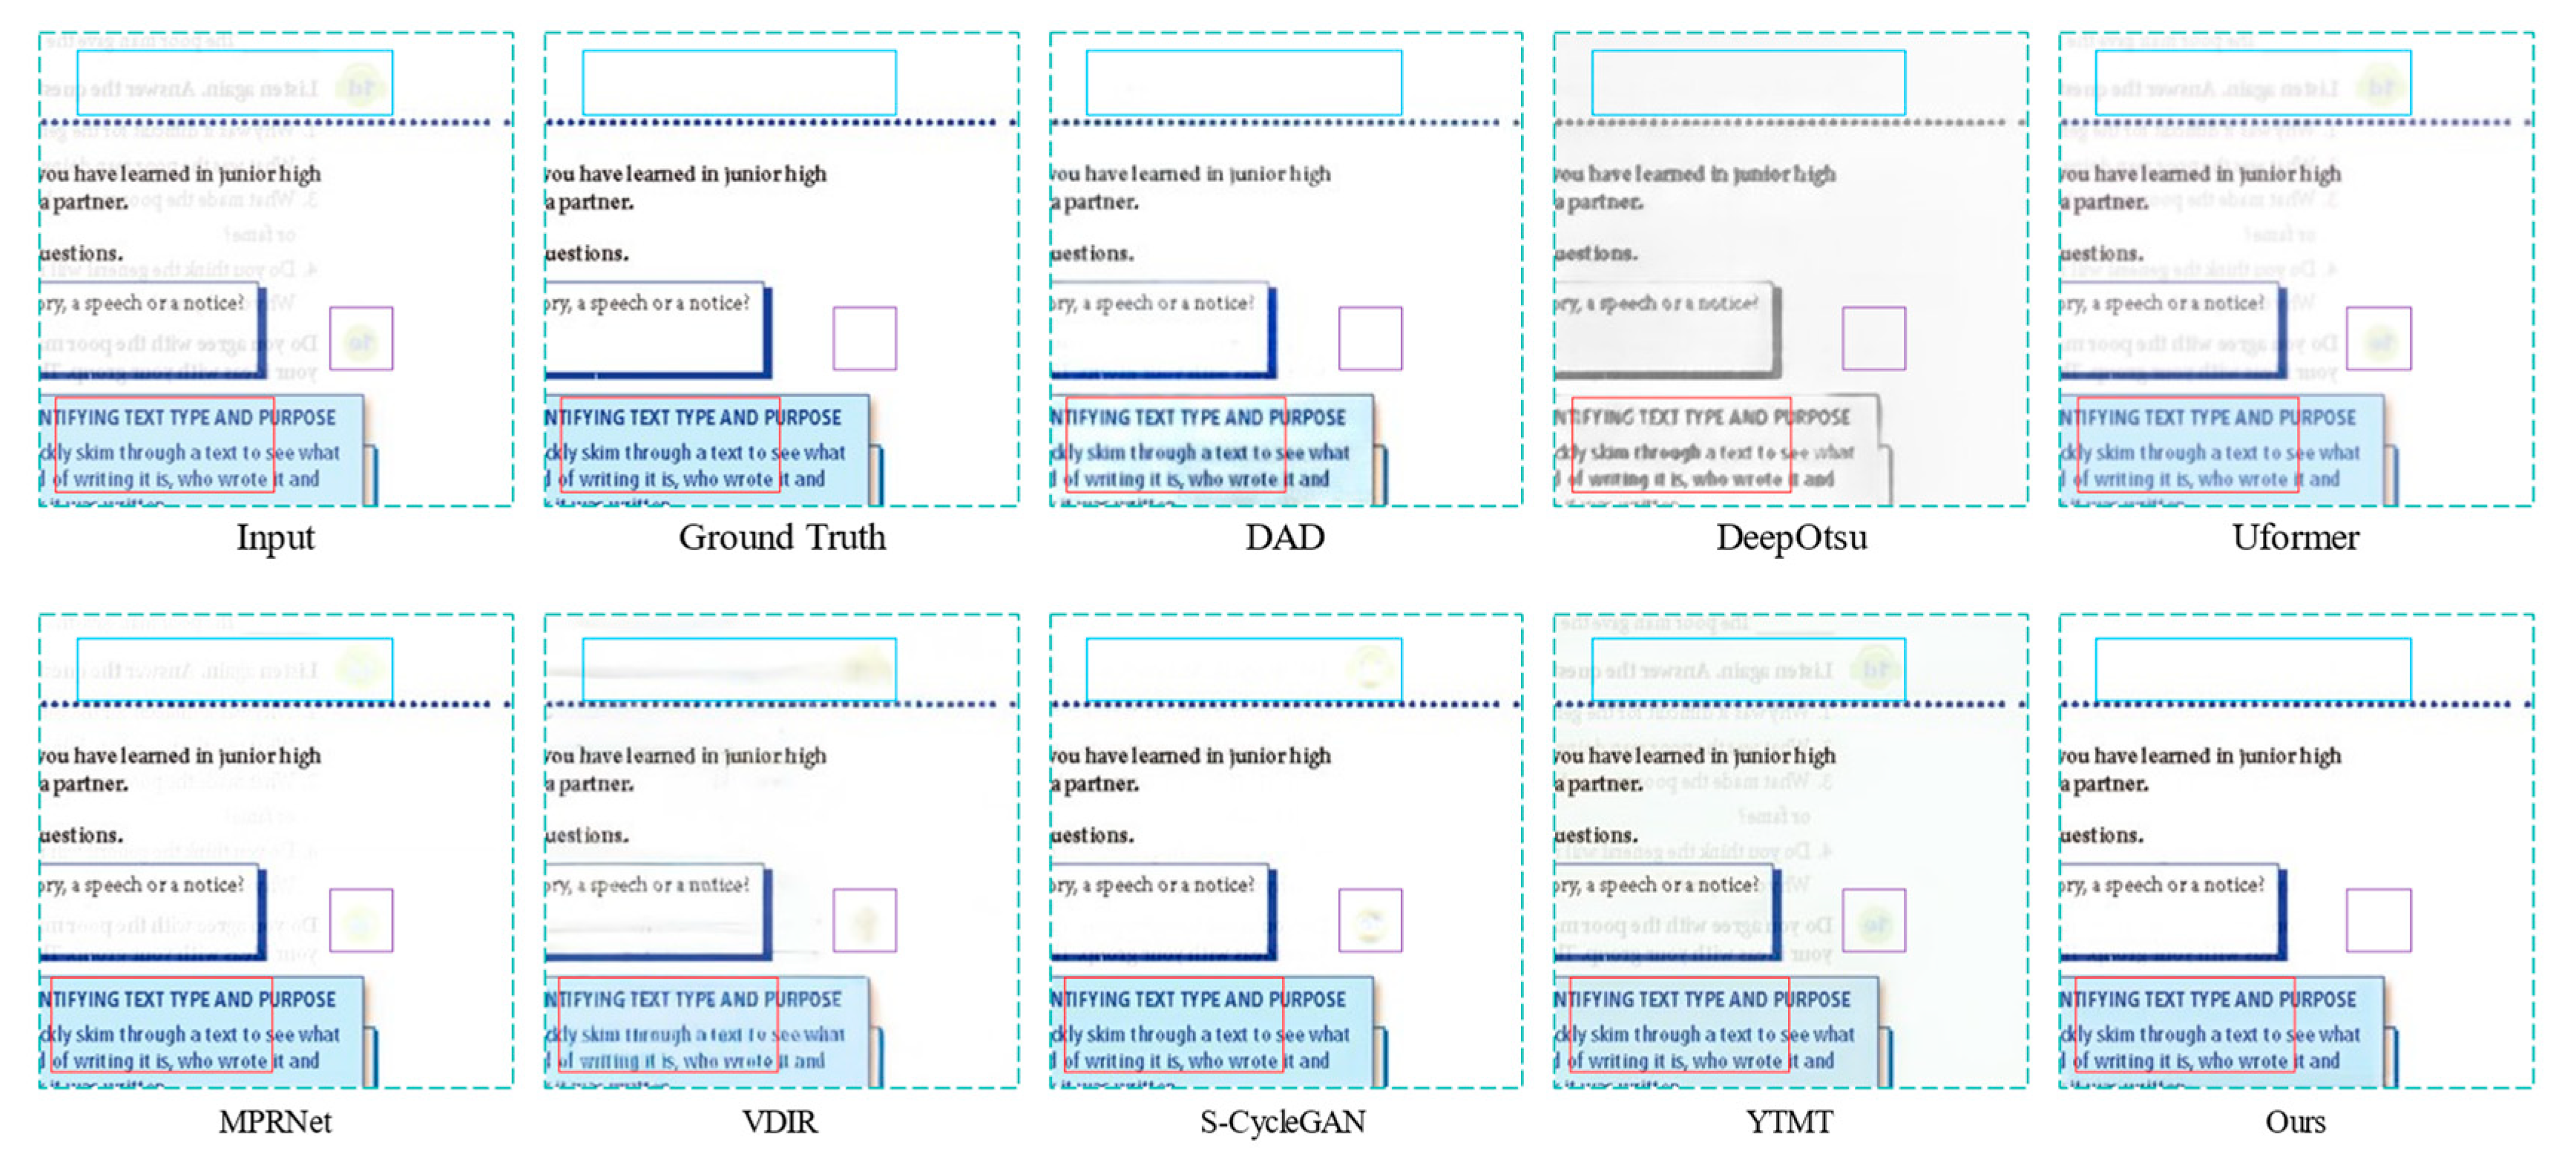
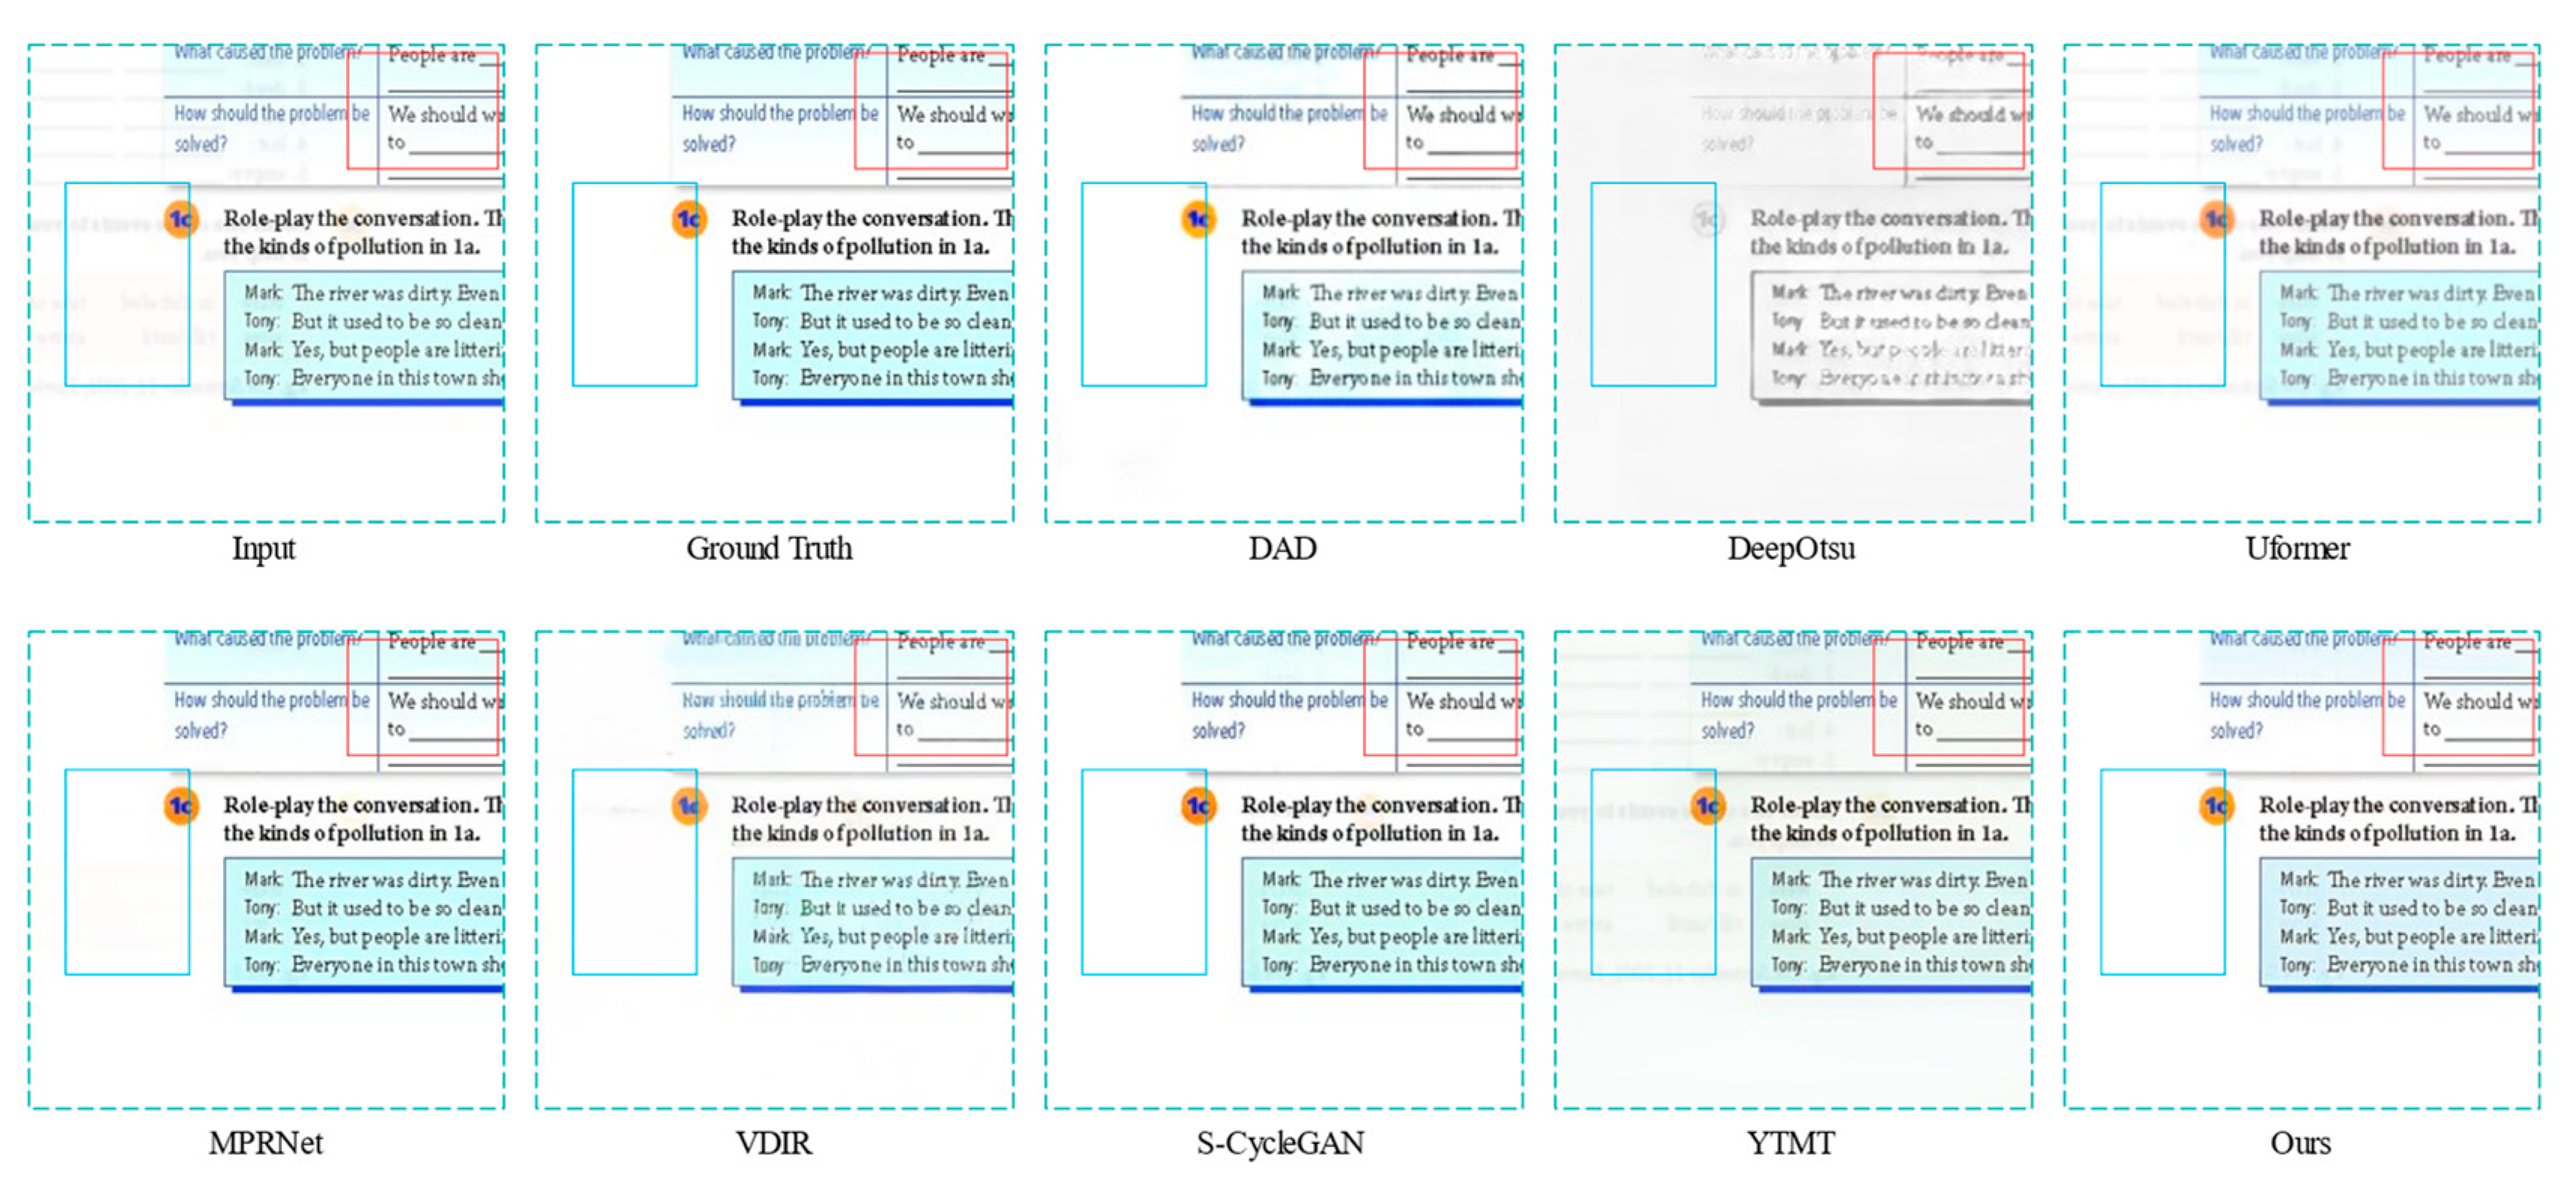
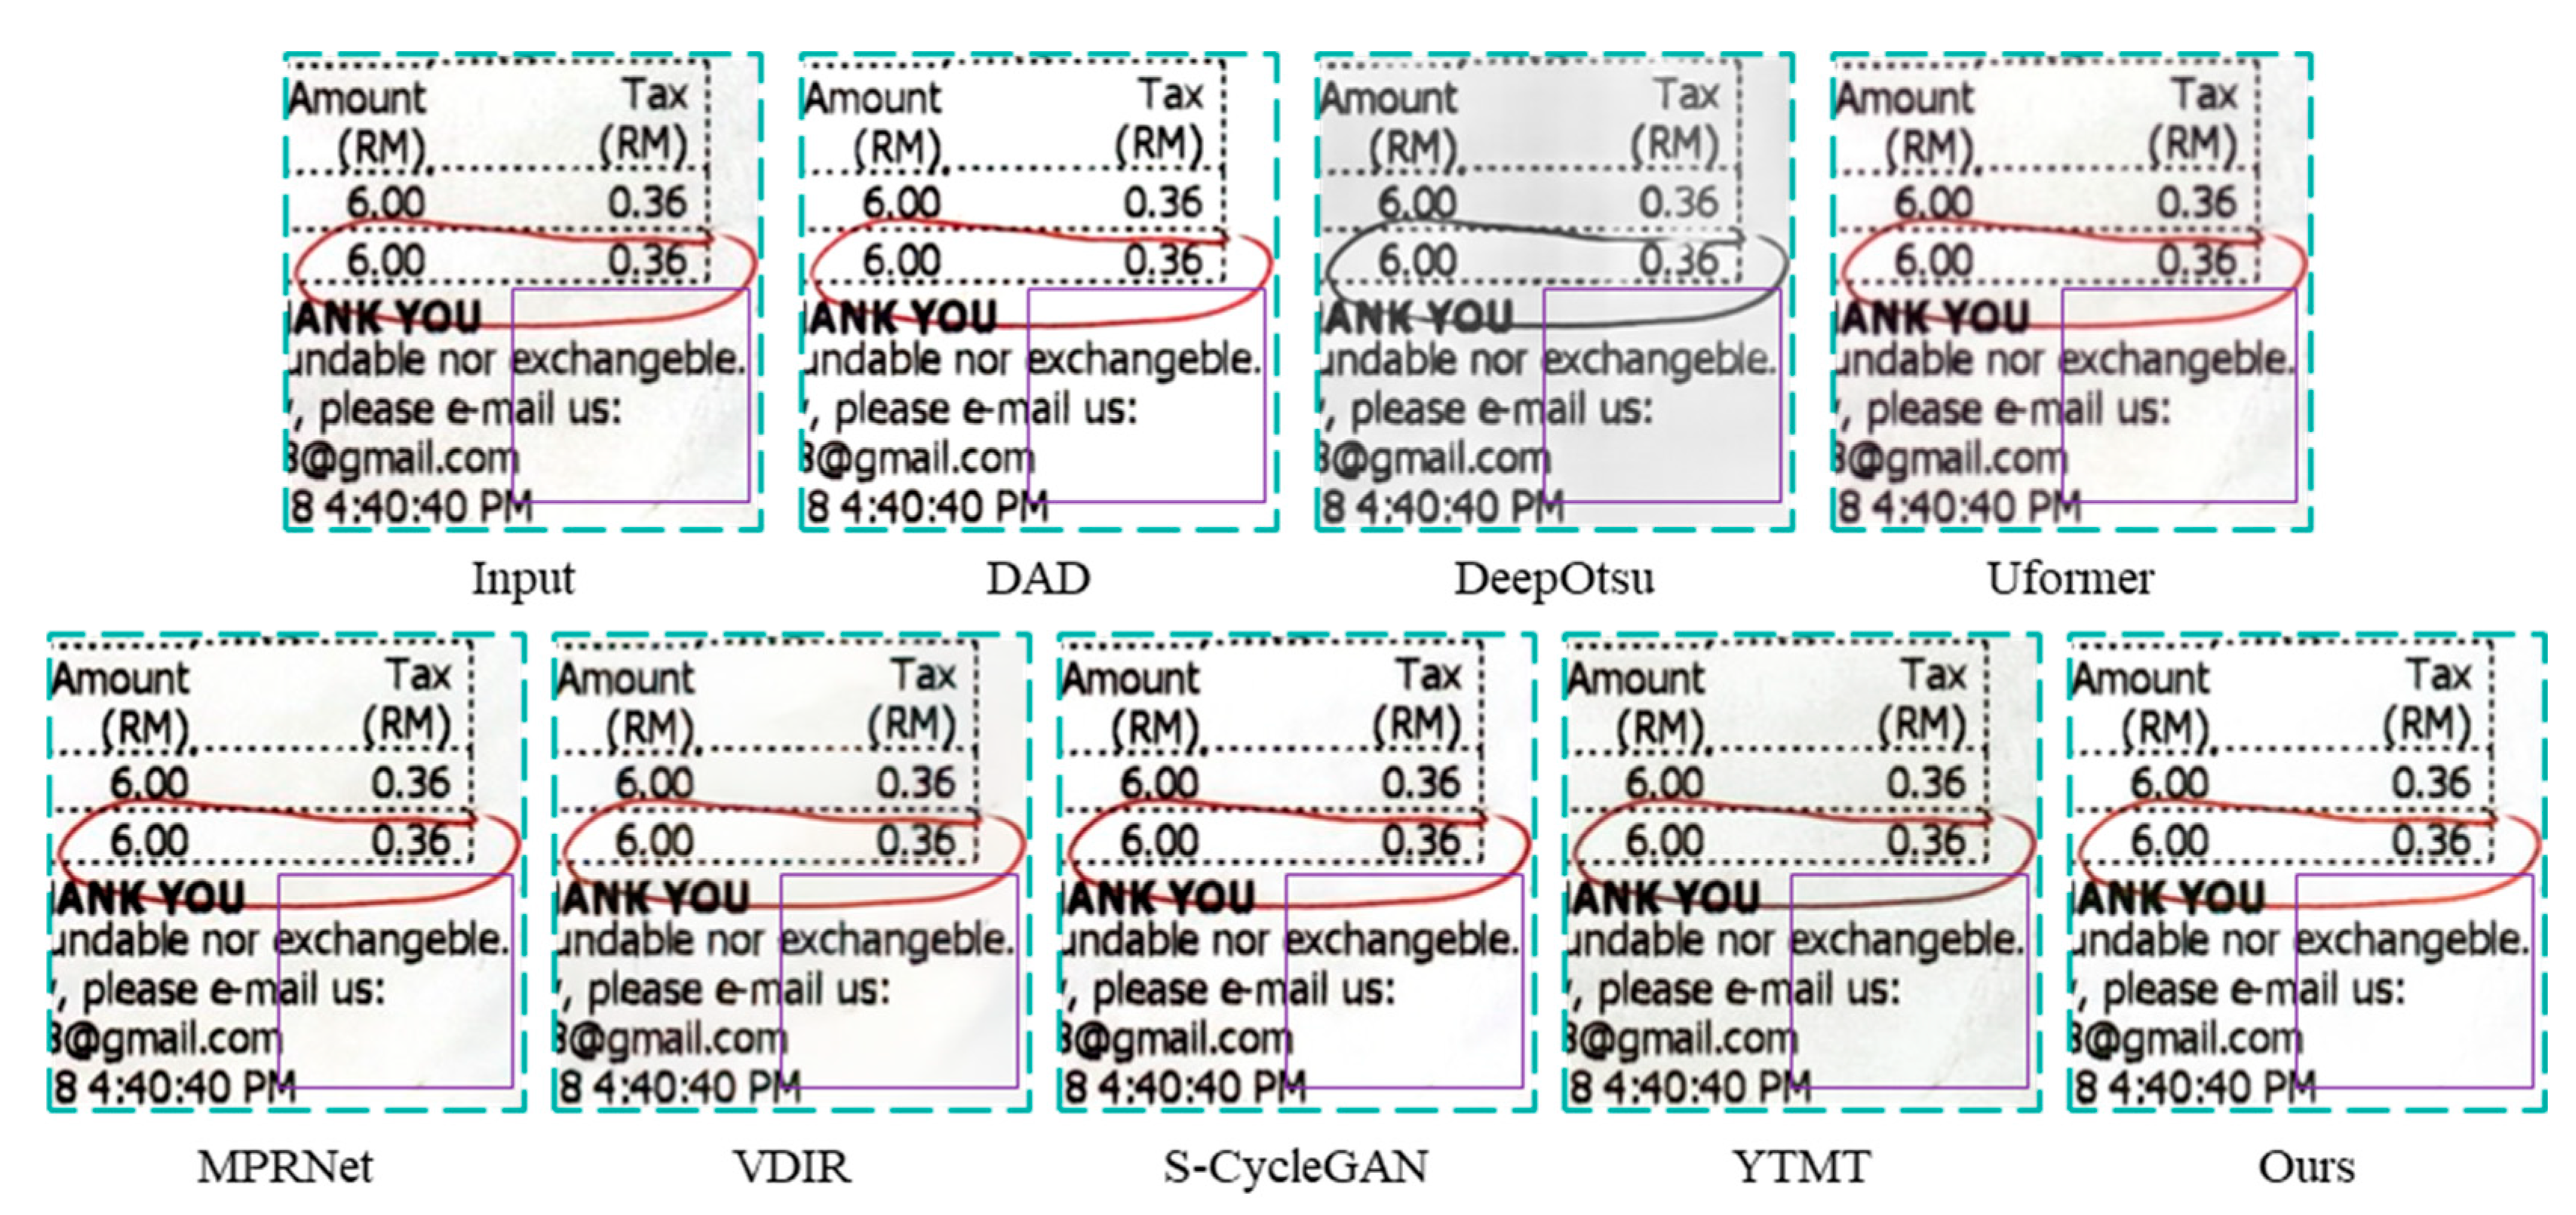
4.4. Analysis of Experimental Results on Real Show-through Dataset
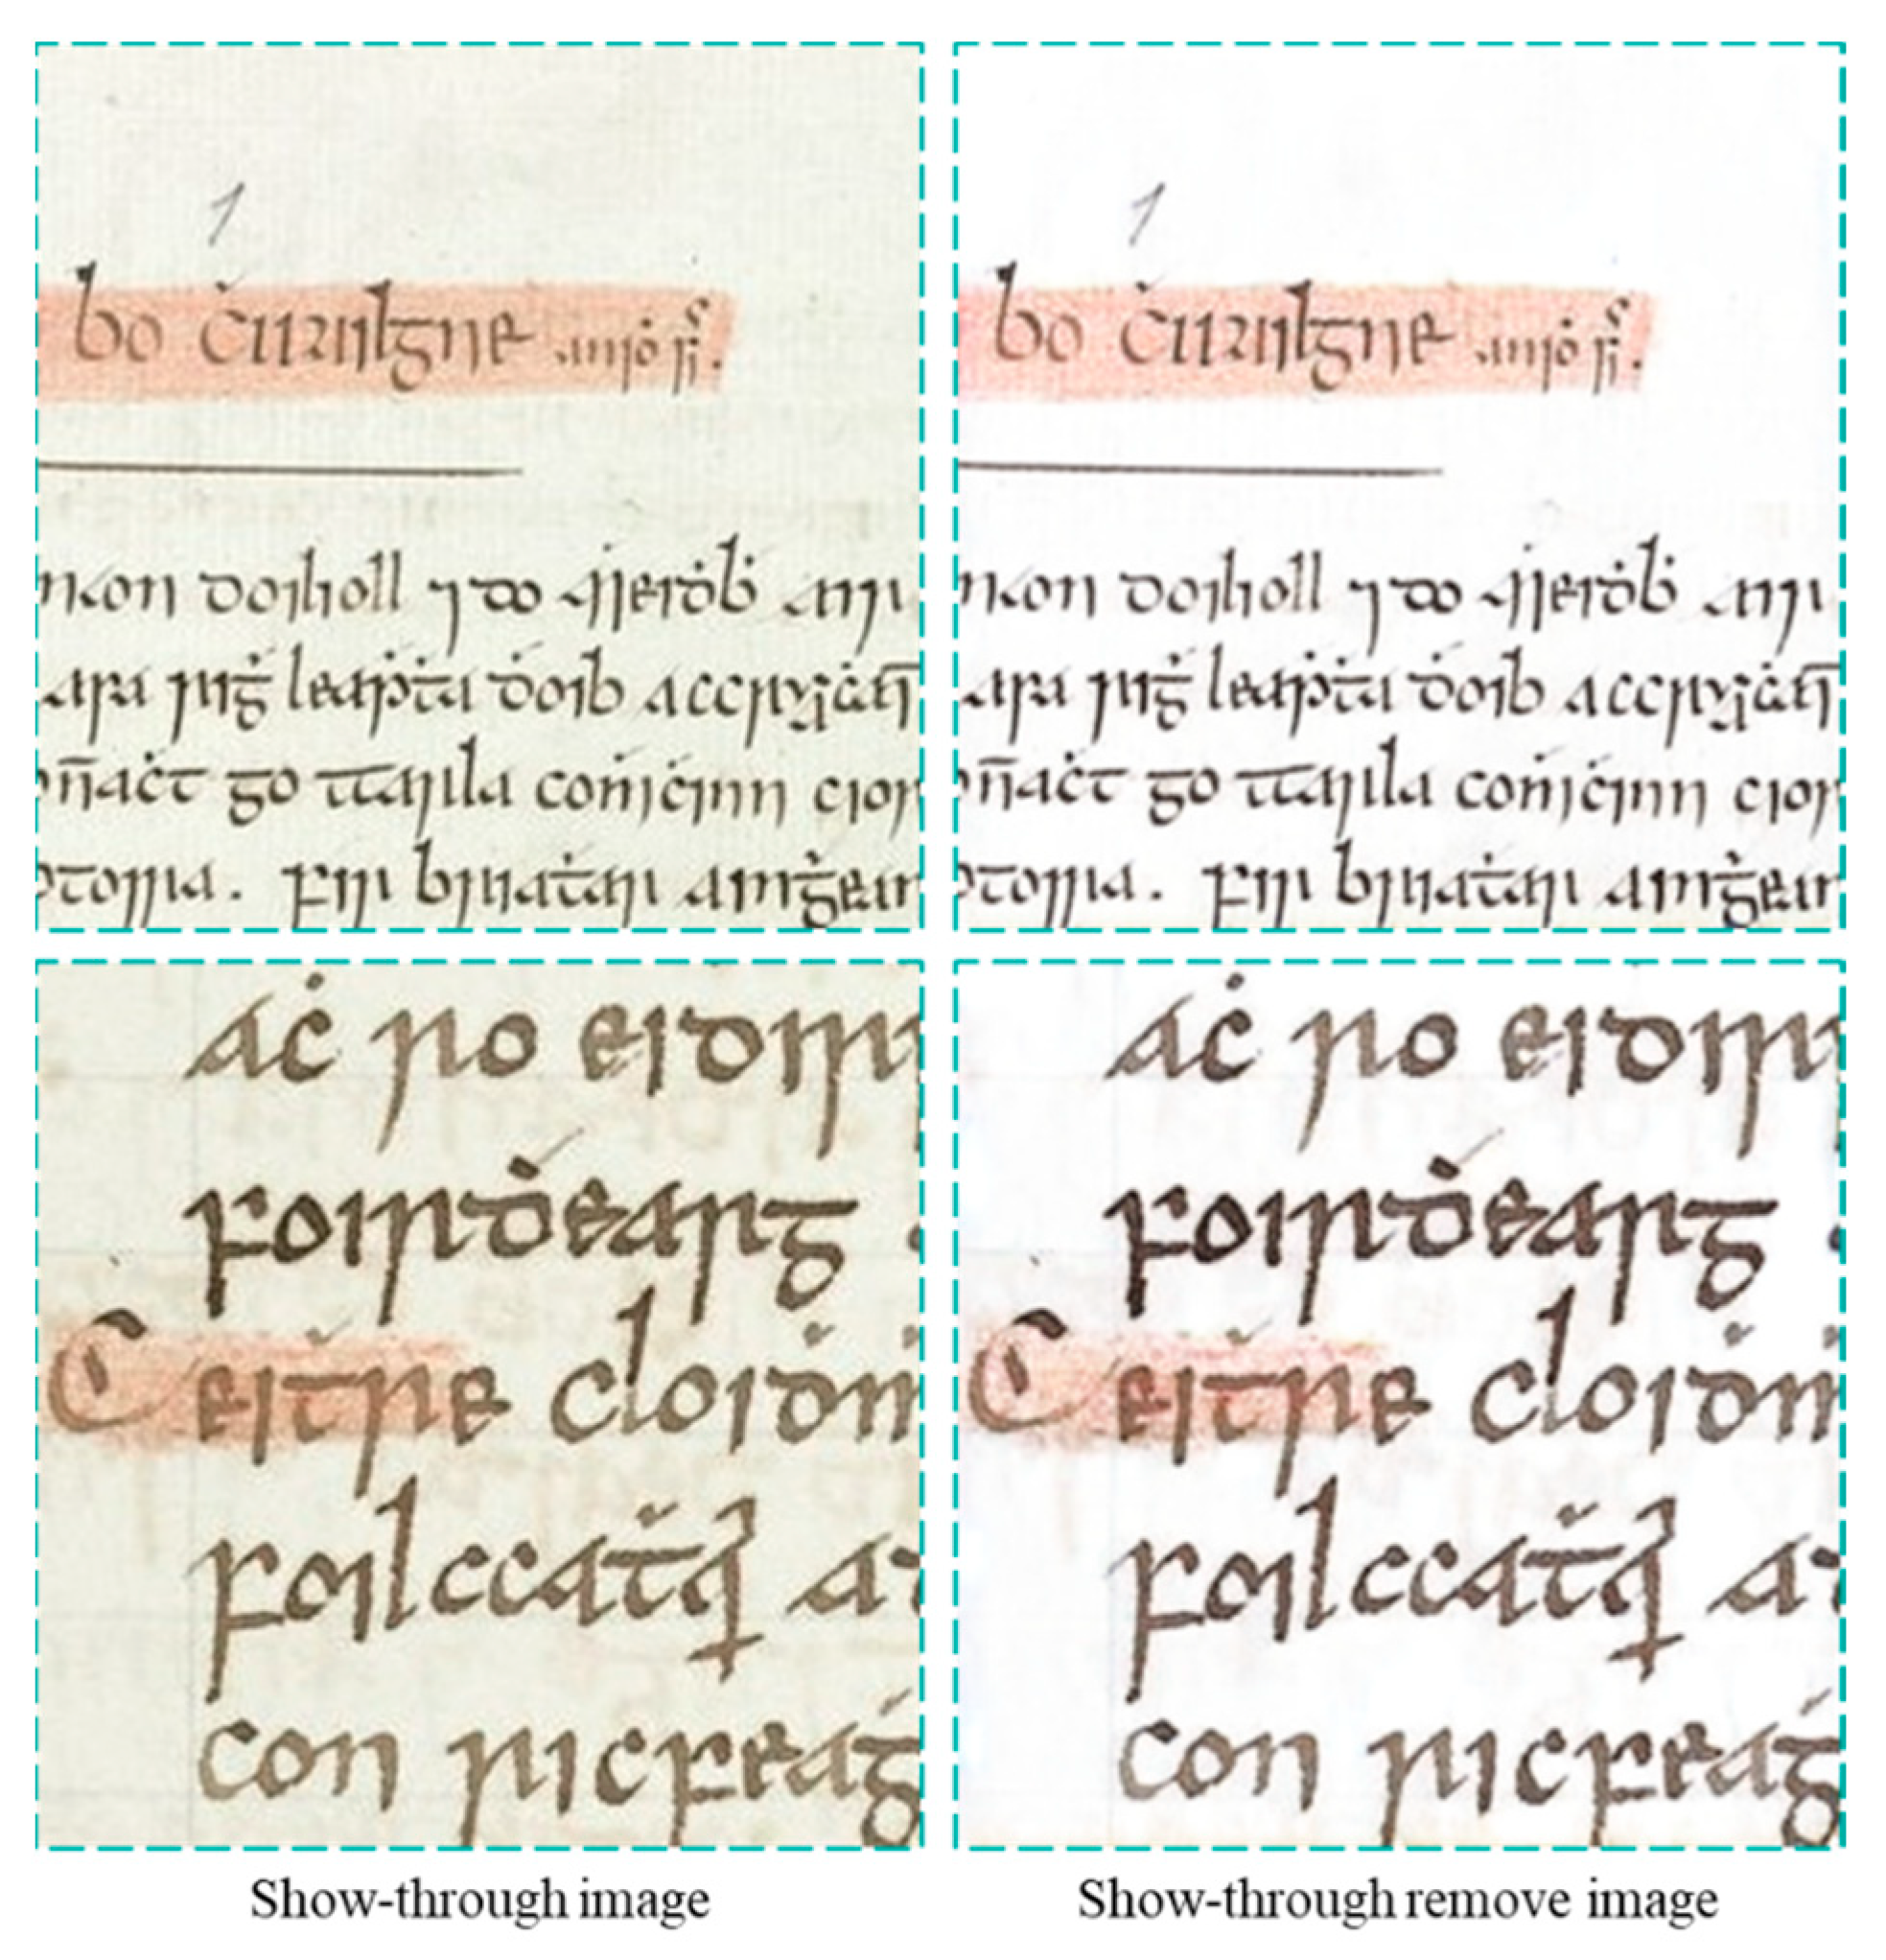
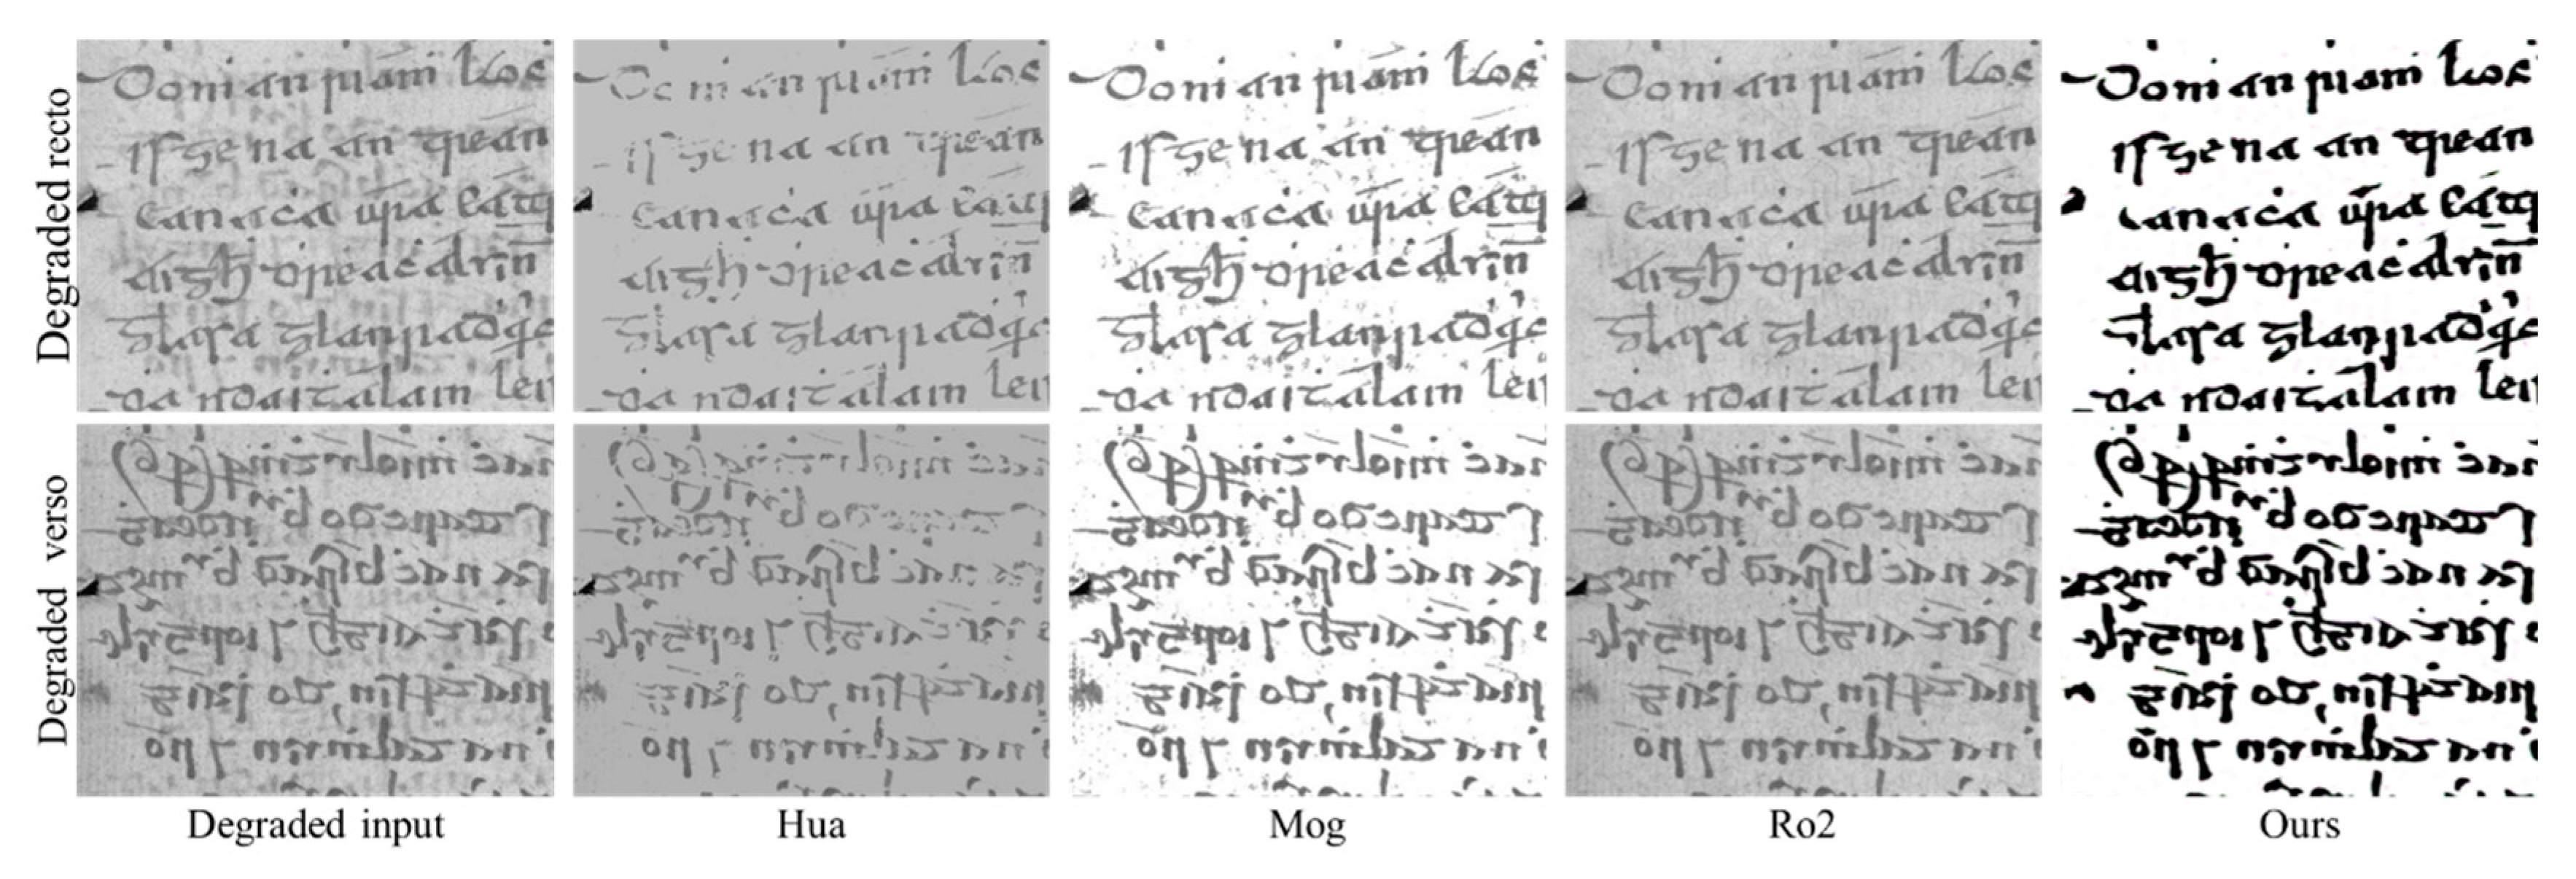
4.5. Quantitative and Qualitative Analysis on the Bleed-through Database
4.6. Runtime Analysis
4.7. Analysis of Ablation-Experiment Results
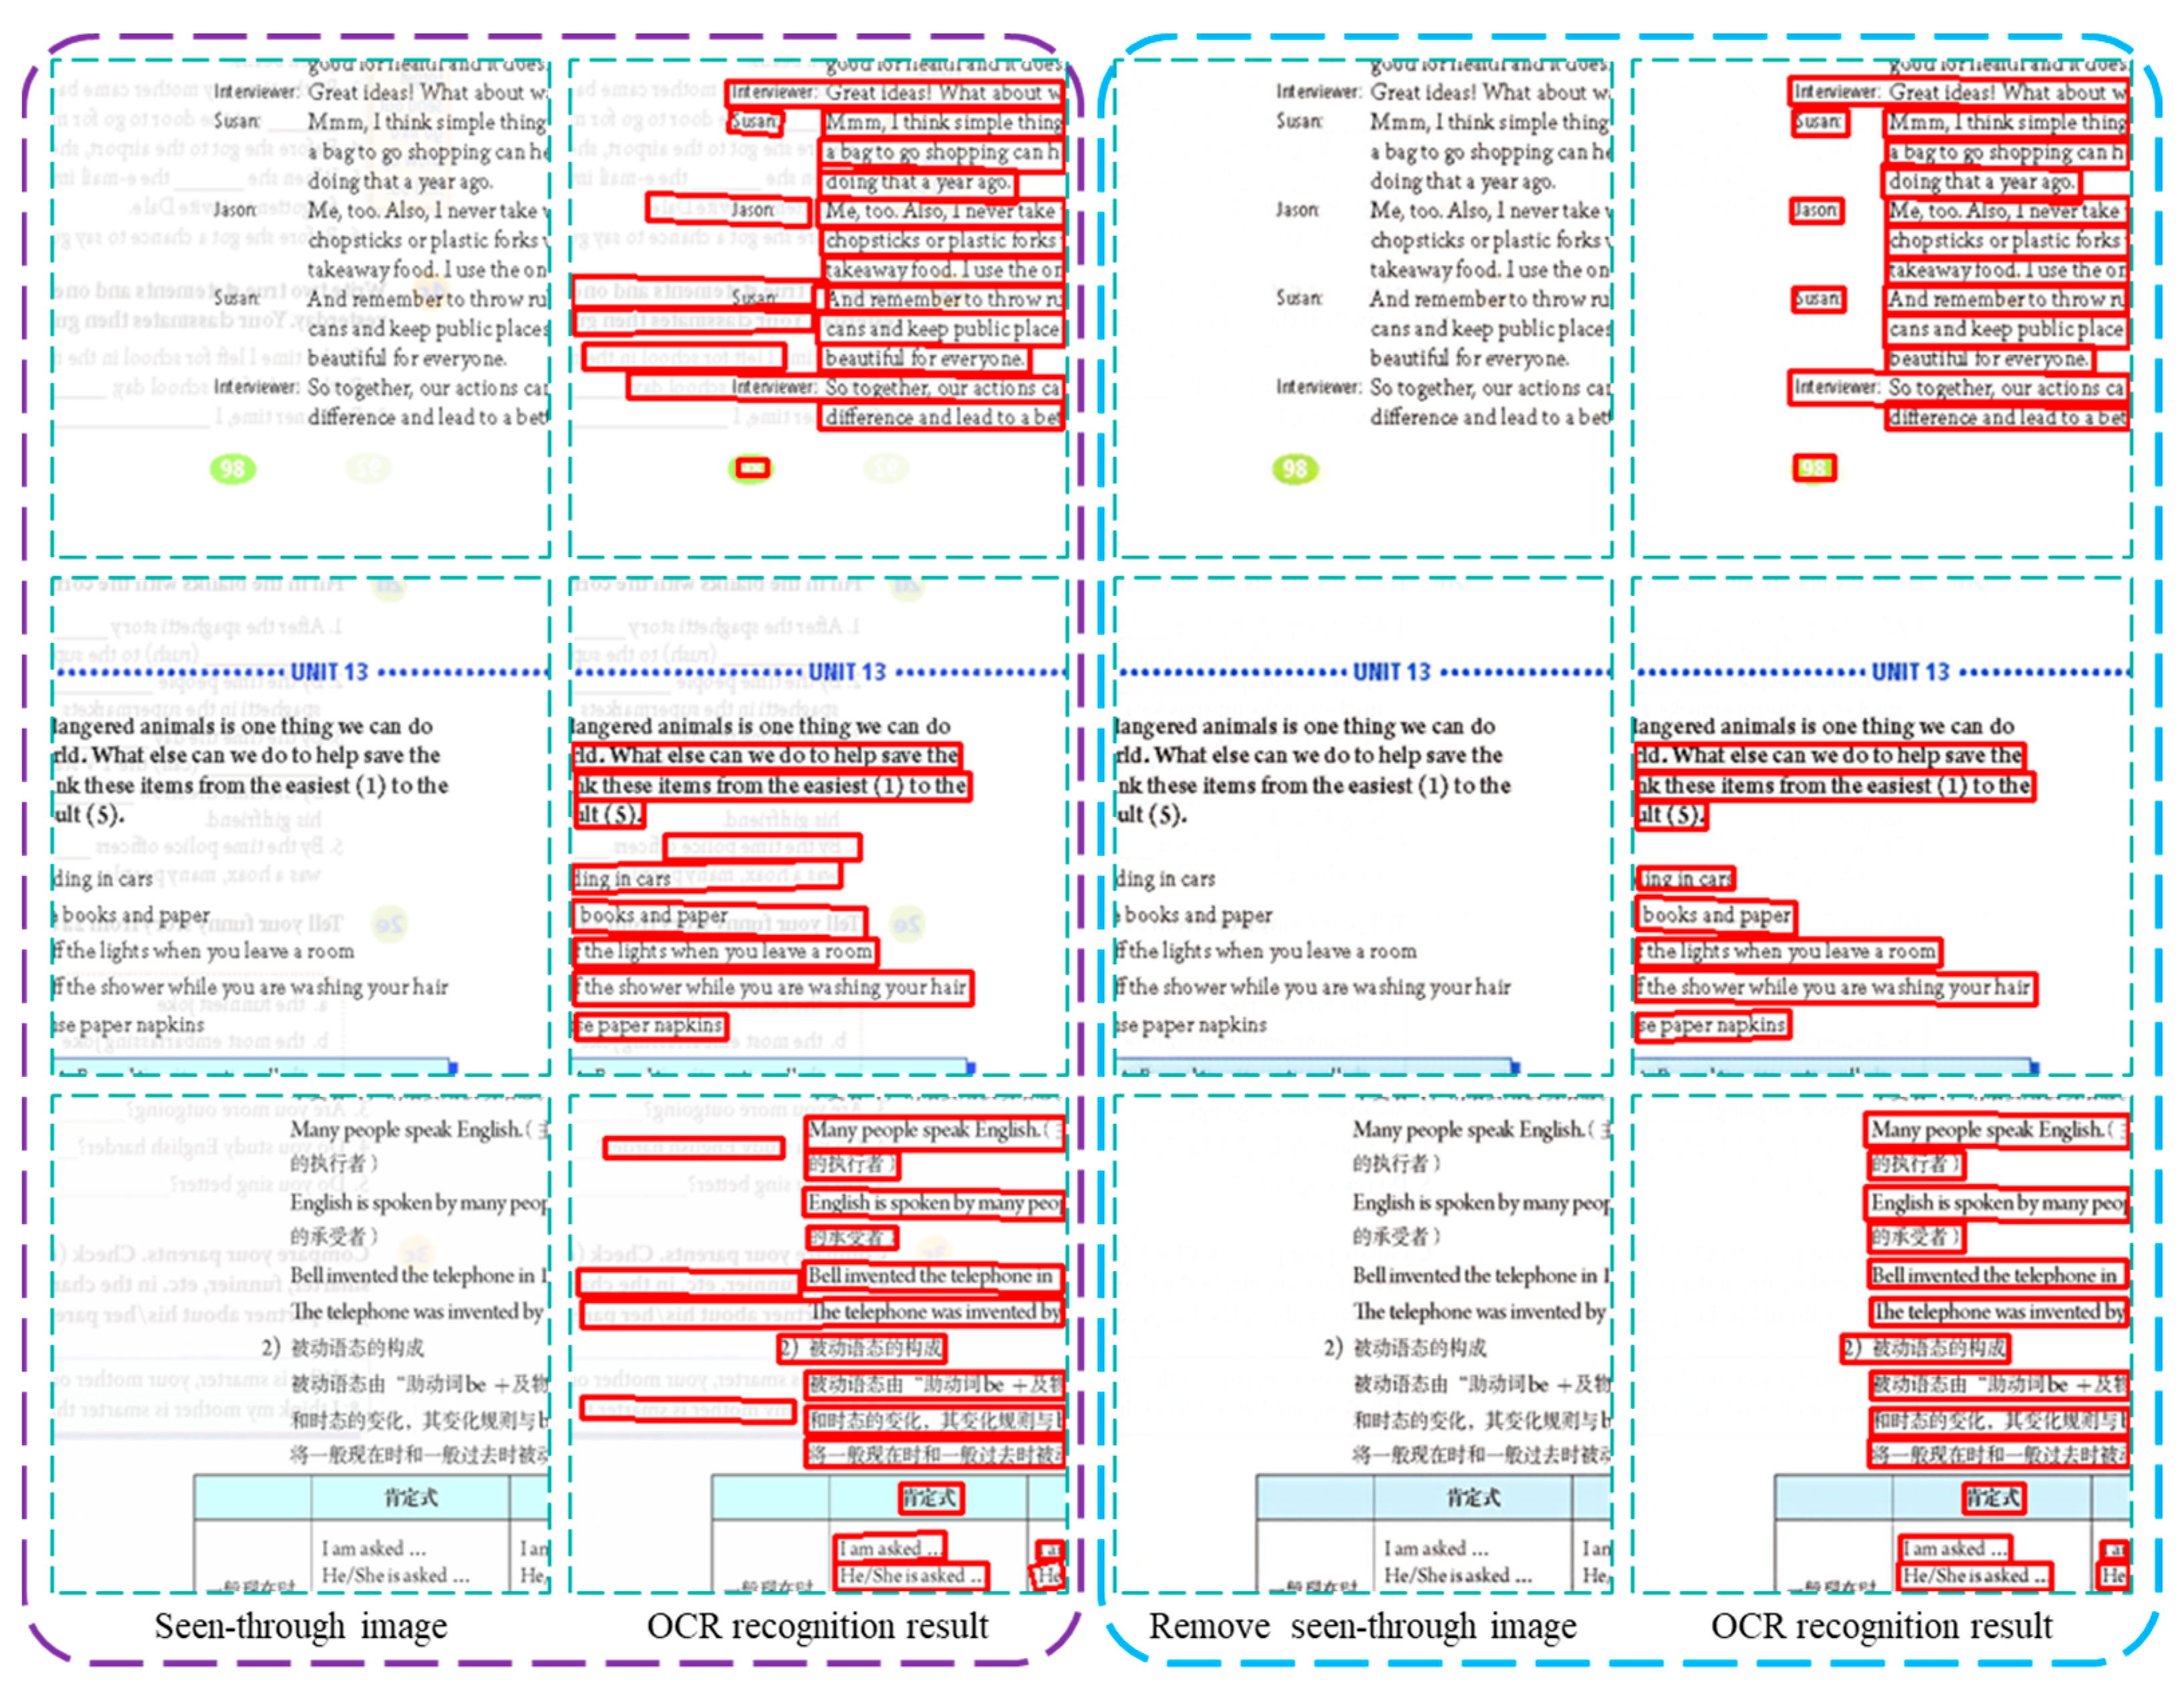
4.8. OCR Recognition Analysis
5. Discussion
6. Conclusions
Author Contributions
Funding
Institutional Review Board Statement
Informed Consent Statement
Data Availability Statement
Conflicts of Interest
References
- Chandio, A.A.; Asikuzzaman, M.; Pickering, M.R.; Leghari, M. Cursive text recognition in natural scene images using deep convolutional recurrent neural network. IEEE Access 2022, 10, 10062–10078. [Google Scholar] [CrossRef]
- Goodfellow, I.; Pouget-Abadie, J.; Mirza, M.; Xu, B.; Warde-Farley, D.; Ozair, S.; Courville, A.; Bengio, Y. Generative adversarial nets. Adv. Neural Inf. Process. Syst. 2014, 2, 2672–2680. [Google Scholar]
- Souibgui, M.A.; Kessentini, Y. DE-GAN: A conditional generative adversarial network for document enhancement. IEEE Trans. Pattern Anal. Mach. Intell. 2020, 44, 1180–1191. [Google Scholar] [CrossRef] [PubMed]
- Mirza, M.; Osindero, S. Conditional generative adversarial nets. arXiv 2014, arXiv:1411.1784. [Google Scholar]
- Liu, W.; Hou, X.; Duan, J.; Qiu, G. End-to-end single image fog removal using enhanced cycle consistent adversarial networks. IEEE Trans. Image Process. 2020, 29, 7819–7833. [Google Scholar] [CrossRef]
- Zhu, J.-Y.; Park, T.; Isola, P.; Efros, A.A. Unpaired image-to-image translation using cycle-consistent adversarial networks. In Proceedings of the IEEE International Conference on Computer Vision, Venice, Italy, 22–29 October 2017; pp. 2223–2232. [Google Scholar]
- Lins, R.D.; Neto, M.G.; Neto, L.F.; Rosa, L.G. An environment for processing images of historical documents. Microprocess. Microprogramming 1994, 40, 939–942. [Google Scholar] [CrossRef]
- Sharma, G. Show-through cancellation in scans of duplex printed documents. IEEE Trans. Image Process. 2001, 10, 736–754. [Google Scholar] [CrossRef] [PubMed]
- Rowley-Brooke, R.; Pitié, F.; Kokaram, A. A ground truth bleed-through document image database. In Theory and Practice of Digital Libraries: Second International Conference, TPDL 2012, Paphos, Cyprus, September 23–27, 2012. Proceedings 2; Springer: Berlin/Heidelberg, Germany, 2012; pp. 185–196. [Google Scholar]
- Moghaddam, R.F.; Cheriet, M. A variational approach to degraded document enhancement. IEEE Trans. Pattern Anal. Mach. Intell. 2009, 32, 1347–1361. [Google Scholar] [CrossRef] [PubMed]
- He, S.; Schomaker, L. DeepOtsu: Document enhancement and binarization using iterative deep learning. Pattern Recognit. 2019, 91, 379–390. [Google Scholar] [CrossRef]
- Hanif, M.; Tonazzini, A.; Hussain, S.F.; Khalil, A.; Habib, U. Restoration and content analysis of ancient manuscripts via color space based segmentation. PLoS ONE 2023, 18, e0282142. [Google Scholar] [CrossRef] [PubMed]
- LeCun, Y.; Bengio, Y.; Hinton, G. Deep learning. Nature 2015, 521, 436–444. [Google Scholar] [CrossRef] [PubMed]
- Poddar, A.; Dey, S.; Jawanpuria, P.; Mukhopadhyay, J.; Kumar Biswas, P. TBM-GAN: Synthetic document generation with degraded background. In Proceedings of the International Conference on Document Analysis and Recognition, San José, CA, USA, 21–26 August 2023; pp. 366–383. [Google Scholar]
- De, R.; Chakraborty, A.; Sarkar, R. Document image binarization using dual discriminator generative adversarial networks. IEEE Signal Process. Lett. 2020, 27, 1090–1094. [Google Scholar] [CrossRef]
- Suh, S.; Kim, J.; Lukowicz, P.; Lee, Y.O. Two-stage generative adversarial networks for binarization of color document images. Pattern Recognit. 2022, 130, 108810. [Google Scholar] [CrossRef]
- Lin, Y.-S.; Lin, T.-Y.; Chiang, J.-S.; Chen, C.-C. Binarization of color document image based on adversarial generative network and discrete wavelet transform. In Proceedings of the 2022 IET International Conference on Engineering Technologies and Applications (IET-ICETA), Changhua, Taiwan, 14–16 October 2022; pp. 1–2. [Google Scholar]
- Ju, R.-Y.; Lin, Y.-S.; Chiang, J.-S.; Chen, C.-C.; Chen, W.-H.; Chien, C.-T. CCDWT-GAN: Generative adversarial networks based on color channel using discrete wavelet transform for document image binarization. In Proceedings of the Pacific Rim International Conference on Artificial Intelligence (PRICAI), Jakarta, Indonesia, 15–19 November 2023; pp. 186–198. [Google Scholar]
- Zou, Z.; Lei, S.; Shi, T.; Shi, Z.; Ye, J. Deep adversarial decomposition: A unified framework for separating superimposed images. In Proceedings of the IEEE/CVF Conference on Computer Vision and Pattern Recognition, Seattle, WA, USA, 13–19 June 2020; pp. 12806–12816. [Google Scholar]
- Gangeh, M.J.; Plata, M.; Nezhad, H.R.M.; Duffy, N.P. End-to-end unsupervised document image blind denoising. In Proceedings of the IEEE/CVF International Conference on Computer Vision, Montreal, BC, Canada, 11–17 October 2021; pp. 7888–7897. [Google Scholar]
- Torbunov, D.; Huang, Y.; Yu, H.; Huang, J.; Yoo, S.; Lin, M.; Viren, B.; Ren, Y. Uvcgan: Unet vision transformer cycle-consistent gan for unpaired image-to-image translation. In Proceedings of the IEEE/CVF Winter Conference on Applications of Computer Vision, Waikoloa, HI, USA, 2–7 January 2023; pp. 702–712. [Google Scholar]
- Wu, S.; Dong, C.; Qiao, Y. Blind image restoration based on cycle-consistent network. IEEE Trans. Multimed. 2022, 25, 1111–1124. [Google Scholar] [CrossRef]
- Wang, Y.; Zhou, W.; Lu, Z.; Li, H. Udoc-gan: Unpaired document illumination correction with background light prior. In Proceedings of the 30th ACM International Conference on Multimedia, Lisboa, Portugal, 10–14 October 2022; pp. 5074–5082. [Google Scholar]
- Xu, J.D.; Ma, Y.L.; Liang, Z.B.; Ni, M.Y. Single bleed-through image restoration with self-supervised learning. Acta Autom. Sin. 2023, 49, 219–228. [Google Scholar]
- Simonyan, K.; Zisserman, A. Very Deep convolutional networks for large-Scale image recognition. In Proceedings of the International Conference on Learning Representations (ICLR), San Diego, CA, USA, 7–9 May 2015; pp. 1–14. [Google Scholar]
- Kingma, D.P.; Ba, J. Adam: A method for stochastic optimization. In Proceedings of the International Conference on Learning Representations (ICLR), San Diego, CA, USA, 7–9 May 2015. [Google Scholar]
- Sauvola, J.; Kauniskangas, H. MediaTeam Document Database II, a CD-ROM Collection of Document Images; University of Oulu: Oulu, Finland, 1999. [Google Scholar]
- Huang, Z.; Chen, K.; He, J.; Bai, X.; Karatzas, D.; Lu, S.; Jawahar, C. Icdar2019 competition on scanned receipt ocr and information extraction. In Proceedings of the 2019 International Conference on Document Analysis and Recognition (ICDAR), Sydney, Australia, 20–25 September 2019; pp. 1516–1520. [Google Scholar]
- Irish Script On Screen Project (2012). Available online: www.isos.dias.ie (accessed on 8 May 2024).
- Hore, A.; Ziou, D. Image quality metrics: PSNR vs. SSIM. In Proceedings of the 2010 20th International Conference on Pattern Recognition, Istanbul, Turkey, 23–26 August 2010; pp. 2366–2369. [Google Scholar]
- Wang, Z.; Cun, X.; Bao, J.; Zhou, W.; Liu, J.; Li, H. Uformer: A general u-shaped transformer for image restoration. In Proceedings of the IEEE/CVF Conference on Computer Vision and Pattern Recognition, New Orleans, LA, USA, 18–24 June 2022; pp. 17683–17693. [Google Scholar]
- Zamir, S.W.; Arora, A.; Khan, S.; Hayat, M.; Khan, F.S.; Yang, M.-H.; Shao, L. Multi-stage progressive image restoration. In Proceedings of the IEEE/CVF Conference on Computer Vision and Pattern Recognition, Nashville, TN, USA, 20–25 June 2021; pp. 14821–14831. [Google Scholar]
- Soh, J.W.; Cho, N.I. Variational deep image restoration. IEEE Trans. Image Process. 2022, 31, 4363–4376. [Google Scholar] [CrossRef] [PubMed]
- Hu, Q.; Guo, X. Trash or treasure? an interactive dual-stream strategy for single image reflection separation. Adv. Neural Inf. Process. Syst. 2021, 34, 24683–24694. [Google Scholar]
- Huang, Y.; Brown, M.S.; Xu, D. User assisted ink-bleed reduction. IEEE Trans. Image Process. 2010, 19, 2646–2658. [Google Scholar] [CrossRef] [PubMed]
- Rowley-Brooke, R.; Pitié, F.; Kokaram, A. A non-parametric framework for document bleed-through removal. In Proceedings of the IEEE Conference on Computer Vision and Pattern Recognition, Portland, OR, USA, 23–28 June 2013; pp. 2954–2960. [Google Scholar]


| Dataset | Index | Methods | |||||||
|---|---|---|---|---|---|---|---|---|---|
| DAD | DeepOtsu | Uformer | MPRNet | VDIR | S-Cycle GAN | YTMT | Ours | ||
| S-color0.5 | PSNR | 28.65 | 21.49 | 24.69 | 32.86 | 27.81 | 32.92 | 25.17 | 33.79 |
| SSIM | 0.977 | 0.861 | 0.902 | 0.972 | 0.956 | 0.979 | 0.912 | 0.984 | |
| S-color1.0 | PSNR | 28.87 | 21.48 | 24.68 | 32.98 | 27.80 | 32.99 | 25.40 | 33.91 |
| SSIM | 0.980 | 0.861 | 0.914 | 0.981 | 0.958 | 0.983 | 0.948 | 0.989 | |
| Average | PSNR | 28.76 | 21.49 | 24.69 | 32.92 | 27.81 | 32.96 | 25.29 | 33.85 |
| SSIM | 0.979 | 0.861 | 0.908 | 0.977 | 0.957 | 0.981 | 0.930 | 0.987 | |
| Index | Methods | |||
|---|---|---|---|---|
| Hua | Mog | Ro2 | Ours | |
| FgError | 0.2308 | 0.0746 | 0.0696 | 0.0633 |
| BgError | 0.0012 | 0.0148 | 0.0085 | 0.0008 |
| TotError | 0.0413 | 0.0244 | 0.0196 | 0.0160 |
| Methods | Framework | Time (s) |
|---|---|---|
| DAD | PyTorch | 0.4649 |
| DeepOtsu | TensorFlow | 1.3982 |
| Uformer | PyTorch | 0.5203 |
| MPRNet | PyTorch | 0.1363 |
| VDIR | TensorFlow | 0.5729 |
| S-CycleGAN | PyTorch | 0.2438 |
| YTMT | PyTorch | 0.2134 |
| CDSR-CycleGAN | PyTorch | 0.1303 |
| Index | Methods | |||||||
|---|---|---|---|---|---|---|---|---|
| w/o S | w/o CAB | w/o | w/o | CDSR-CycleGAN | ||||
| PSNR | 32.52 | 33.73 | 29.87 | 33.75 | 32.94 | 30.45 | 33.71 | 33.79 |
| SSIM | 0.978 | 0.981 | 0.969 | 0.983 | 0.982 | 0.974 | 0.983 | 0.984 |
| Index | Methods | ||||||
|---|---|---|---|---|---|---|---|
| Ground Truth | Show-Through Image | DeepOtsu | DAD | YTMT | Ours | ||
| Numbers | Words | 65 | 76 | 46 | 59 | 71 | 65 |
| Characters | 303 | 353 | 266 | 295 | 375 | 303 | |
| Correct Numbers | Words | 65 | 48 | 36 | 54 | 32 | 64 |
| Characters | 303 | 290 | 244 | 293 | 295 | 303 | |
Disclaimer/Publisher’s Note: The statements, opinions and data contained in all publications are solely those of the individual author(s) and contributor(s) and not of MDPI and/or the editor(s). MDPI and/or the editor(s) disclaim responsibility for any injury to people or property resulting from any ideas, methods, instructions or products referred to in the content. |
© 2024 by the authors. Licensee MDPI, Basel, Switzerland. This article is an open access article distributed under the terms and conditions of the Creative Commons Attribution (CC BY) license (https://creativecommons.org/licenses/by/4.0/).
Share and Cite
Ni, M.; Liang, Z.; Xu, J. Removal of Color-Document Image Show-Through Based on Self-Supervised Learning. Appl. Sci. 2024, 14, 4568. https://doi.org/10.3390/app14114568
Ni M, Liang Z, Xu J. Removal of Color-Document Image Show-Through Based on Self-Supervised Learning. Applied Sciences. 2024; 14(11):4568. https://doi.org/10.3390/app14114568
Chicago/Turabian StyleNi, Mengying, Zongbao Liang, and Jindong Xu. 2024. "Removal of Color-Document Image Show-Through Based on Self-Supervised Learning" Applied Sciences 14, no. 11: 4568. https://doi.org/10.3390/app14114568
APA StyleNi, M., Liang, Z., & Xu, J. (2024). Removal of Color-Document Image Show-Through Based on Self-Supervised Learning. Applied Sciences, 14(11), 4568. https://doi.org/10.3390/app14114568