
The Impact of Pulsed Electric Field Treatment and Shelf Temperature on Quality of Freeze-Dried Pumpkin


 ,
,  , ,
, ,  , and
, and
Abstract
1. Introduction
2. Materials and Methods
2.1. Raw Materials
2.2. PEF Treatment
2.3. Determination of Cell Disintegration
2.4. Freezing
2.5. Freeze-Drying
2.6. Water Activity
2.7. Color Analysis
2.8. Total Phenolic Content (TPC)
2.8.1. Extract Preparation for TPC Measurements
2.8.2. TPC Measurements
2.9. Total Carotenoid Content (TCC)
2.10. Sugars Content
2.11. Hygroscopic Properties
2.12. Statistical Analysis
3. Results and Discussion
3.1. Electroporation Efficiency
3.2. Residual Moisture Content and Water Activity
3.3. Color
3.4. Total Phenolic Content and Total Carotenoid Content
3.5. Sugars Content
3.6. Hygroscopic Properties
4. Conclusions
Author Contributions
Funding
Institutional Review Board Statement
Informed Consent Statement
Data Availability Statement
Conflicts of Interest
References
- Sakare, P.; Prasad, N.; Thombare, N.; Singh, R.; Sharma, S.C. Infrared Drying of Food Materials: Recent Advances. Food Eng. Rev. 2020, 12, 381–398. [Google Scholar] [CrossRef]
- Dai, J.-W.; Rao, J.-Q.; Wang, D.; Xie, L.; Xiao, H.-W.; Liu, Y.-H.; Gao, Z.-J. Process-Based Drying Temperature and Humidity Integration Control Enhances Drying Kinetics of Apricot Halves. Dry. Technol. 2015, 33, 365–376. [Google Scholar] [CrossRef]
- Ratti, C. Freeze-Drying Process Design. In Handbook of Food Process Design; Ahmed, J., Rahman, M.S., Eds.; Wiley: New York, NY, USA, 2012; pp. 621–647. ISBN 144433011X. [Google Scholar]
- Zhou, L.; Cao, Z.; Bi, J.; Yi, J.; Chen, Q.; Wu, X.; Zhou, M. Degradation kinetics of total phenolic compounds, capsaicinoids and antioxidant activity in red pepper during hot air and infrared drying process. Int. J. Food Sci. Technol. 2016, 51, 842–853. [Google Scholar] [CrossRef]
- Qu, H.; Masud, M.H.; Islam, M.; Khan, M.I.H.; Ananno, A.A.; Karim, A. Sustainable food drying technologies based on renewable energy sources. Crit. Rev. Food Sci. Nutr. 2022, 62, 6872–6886. [Google Scholar] [CrossRef] [PubMed]
- Lee, C.-W.; Oh, H.-J.; Han, S.-H.; Lim, S.-B. Effects of hot air and freeze drying methods on physicochemical properties of citrus ‘hallabong’ powders. Food Sci. Biotechnol. 2012, 21, 1633–1639. [Google Scholar] [CrossRef]
- Grace, M.H.; Hoskin, R.T.; Hayes, M.; Iorizzo, M.; Kay, C.; Ferruzzi, M.G.; Lila, M.A. Spray-dried and freeze-dried protein-spinach particles; effect of drying technique and protein type on the bioaccessibility of carotenoids, chlorophylls, and phenolics. Food Chem. 2022, 388, 133017. [Google Scholar] [CrossRef] [PubMed]
- Tang, R.; Yu, H.; Ruan, Z.; Zhang, L.; Xue, Y.; Yuan, X.; Qi, M.; Yao, Y. Effects of food matrix elements (dietary fibres) on grapefruit peel flavanone profile and on faecal microbiota during in vitro fermentation. Food Chem. 2022, 371, 131065. [Google Scholar] [CrossRef] [PubMed]
- Michailidis, P.A.; Krokida, M.K. Drying and Dehydration Processes in Food Preservation and Processing. In Conventional and Advanced Food Processing Technologies; Bhattacharya, S., Ed.; Wiley: New York, NY, USA, 2014; pp. 1–32. ISBN 9781118406281. [Google Scholar]
- Rahaman, A.; Siddeeg, A.; Manzoor, M.F.; Zeng, X.-A.; Ali, S.; Baloch, Z.; Li, J.; Wen, Q.-H. Impact of pulsed electric field treatment on drying kinetics, mass transfer, colour parameters and microstructure of plum. J. Food Sci. Technol. 2019, 56, 2670–2678. [Google Scholar] [CrossRef]
- Alam, M.R.; Lyng, J.G.; Frontuto, D.; Marra, F.; Cinquanta, L. Effect of Pulsed Electric Field Pretreatment on Drying Kinetics, Color, and Texture of Parsnip and Carrot. J. Food Sci. 2018, 83, 2159–2166. [Google Scholar] [CrossRef]
- Neri, L.; Giancaterino, M.; Rocchi, R.; Tylewicz, U.; Valbonetti, L.; Faieta, M.; Pittia, P. Pulsed electric fields (PEF) as hot air drying pre-treatment: Effect on quality and functional properties of saffron (Crocus sativus L.). Innov. Food Sci. Emerg. Technol. 2021, 67, 102592. [Google Scholar] [CrossRef]
- Lebovka, N.I.; Shynkaryk, N.V.; Vorobiev, E. Pulsed electric field enhanced drying of potato tissue. J. Food Eng. 2007, 78, 606–613. [Google Scholar] [CrossRef]
- Liu, C.; Grimi, N.; Lebovka, N.; Vorobiev, E. Effects of pulsed electric fields treatment on vacuum drying of potato tissue. LWT—Food Sci. Technol. 2018, 95, 289–294. [Google Scholar] [CrossRef]
- Liu, C.; Pirozzi, A.; Ferrari, G.; Vorobiev, E.; Grimi, N. Effects of Pulsed Electric Fields on Vacuum Drying and Quality Characteristics of Dried Carrot. Food Bioprocess Technol. 2020, 13, 45–52. [Google Scholar] [CrossRef]
- Liu, C.; Pirozzi, A.; Ferrari, G.; Vorobiev, E.; Grimi, N. Impact of pulsed electric fields on vacuum drying kinetics and physicochemical properties of carrot. Food Res. Int. 2020, 137, 109658. [Google Scholar] [CrossRef]
- Liu, C.; Grimi, N.; Lebovka, N.; Vorobiev, E. Convective air, microwave, and combined drying of potato pre-treated by pulsed electric fields. Dry. Technol. 2019, 37, 1704–1713. [Google Scholar] [CrossRef]
- Yang, W.; Huang, X.-L.; Zhang, F.-J.; Li, P. Microwave Drying Kinetics of Potato Slices with Pulsed Electric Field Pre-treatment. J. Kunming Univ. Sci. Technol. 2012, 37. Available online: https://www.semanticscholar.org/paper/Microwave-Drying-Kinetics-of-Potato-Slices-with-Pei/b9c67c206dd8fa6e7e463ff3dc22e99579931bd0 (accessed on 29 April 2024).
- Lammerskitten, A.; Wiktor, A.; Siemer, C.; Toepfl, S.; Mykhailyk, V.; Gondek, E.; Rybak, K.; Witrowa-Rajchert, D.; Parniakov, O. The effects of pulsed electric fields on the quality parameters of freeze-dried apples. J. Food Eng. 2019, 252, 36–43. [Google Scholar] [CrossRef]
- Parniakov, O.; Bals, O.; Lebovka, N.; Vorobiev, E. Pulsed electric field assisted vacuum freeze-drying of apple tissue. Innov. Food Sci. Emerg. Technol. 2016, 35, 52–57. [Google Scholar] [CrossRef]
- Zhang, Z.; Zhang, B.; Yang, R.; Zhao, W. Recent Developments in the Preservation of Raw Fresh Food by Pulsed Electric Field. Food Rev. Int. 2022, 38, 247–265. [Google Scholar] [CrossRef]
- Saulis, G. Electroporation of Cell Membranes: The Fundamental Effects of Pulsed Electric Fields in Food Processing. Food Eng. Rev. 2010, 2, 52–73. [Google Scholar] [CrossRef]
- Bassey, E.J.; Cheng, J.-H.; Sun, D.-W. Novel nonthermal and thermal pretreatments for enhancing drying performance and improving quality of fruits and vegetables. Trends Food Sci. Technol. 2021, 112, 137–148. [Google Scholar] [CrossRef]
- Lammerskitten, A.; Wiktor, A.; Mykhailyk, V.; Samborska, K.; Gondek, E.; Witrowa-Rajchert, D.; Toepfl, S.; Parniakov, O. Pulsed electric field pre-treatment improves microstructure and crunchiness of freeze-dried plant materials: Case of strawberry. LWT—Food Sci. Technol. 2020, 134, 110266. [Google Scholar] [CrossRef]
- Mannozzi, C.; Cecchini, J.P.; Tylewicz, U.; Siroli, L.; Patrignani, F.; Lanciotti, R.; Rocculi, P.; Dalla Rosa, M.; Romani, S. Study on the efficacy of edible coatings on quality of blueberry fruits during shelf-life. LWT—Food Sci. Technol. 2017, 85, 440–444. [Google Scholar] [CrossRef]
- Lebovka, N.; Bazhal, M.; Vorobiev, E. Estimation of characteristic damage time of food materials in pulsed-electric fields. J. Food Eng. 2002, 54, 337–346. [Google Scholar] [CrossRef]
- Kasim, R.; Kasim, M.U. Biochemical changes and color properties of fresh-cut green bean (Phaseolus vulgaris L. cv.gina) treated with calcium chloride during storage. Food Sci. Technol. 2015, 35, 266–272. [Google Scholar] [CrossRef]
- Singleton, V.L.; Orthofer, R.; Lamuela-Raventós, R.M. Analysis of total phenols and other oxidation substrates and antioxidants by means of folin-ciocalteu reagent. In Methods in Enzymology; Academic Press: New York, NY, USA, 1999; Volume 299, pp. 152–178. [Google Scholar]
- Wiktor, A.; Sledz, M.; Nowacka, M.; Rybak, K.; Chudoba, T.; Lojkowski, W.; Witrowa-Rajchert, D. The impact of pulsed electric field treatment on selected bioactive compound content and color of plant tissue. Innov. Food Sci. Emerg. Technol. 2015, 30, 69–78. [Google Scholar] [CrossRef]
- Nowacka, M.; Wiktor, A.; Anuszewska, A.; Dadan, M.; Rybak, K.; Witrowa-Rajchert, D. The application of unconventional technologies as pulsed electric field, ultrasound and microwave-vacuum drying in the production of dried cranberry snacks. Ultrason. Sonochem. 2019, 56, 1–13. [Google Scholar] [CrossRef]
- Bazhal, M.; Lebovka, N.; Vorobiev, E. Optimisation of Pulsed Electric Field Strength for Electroplasmolysis of Vegetable Tissues. Biosyst. Eng. 2003, 86, 339–345. [Google Scholar] [CrossRef]
- Fauster, T.; Giancaterino, M.; Pittia, P.; Jaeger, H. Effect of pulsed electric field pretreatment on shrinkage, rehydration capacity and texture of freeze-dried plant materials. LWT—Food Sci. Technol. 2020, 121, 108937. [Google Scholar] [CrossRef]
- Buera, M.D.P.; Chirife, J.; Resnik, S.L.; Lozano, R.D. Nonenzymatic Browning in Liquid Model Systems of High Water Activity: Kinetics of Color Changes due to Caramelization of Various Single Sugars. J. Food Sci. 1987, 52, 1059–1062. [Google Scholar] [CrossRef]
- Stamp, J.A.; Labuza, T.P. Kinetics of the Maillard Reaction Between Aspartame and Glucose in Solution at High Temperatures. J. Food Sci. 1983, 48, 543–544. [Google Scholar] [CrossRef]
- Montesano, D.; Rocchetti, G.; Putnik, P.; Lucini, L. Bioactive profile of pumpkin: An overview on terpenoids and their health-promoting properties. Curr. Opin. Food Sci. 2018, 22, 81–87. [Google Scholar] [CrossRef]
- Matys, A.; Witrowa-Rajchert, D.; Parniakov, O.; Wiktor, A. Assessment of the effect of air humidity and temperature on convective drying of apple with pulsed electric field pretreatment. LWT 2023, 188, 115455. [Google Scholar] [CrossRef]
- Afolabi, I.S. Moisture Migration and Bulk Nutrients Interaction in a Drying Food Systems: A Review. Food Nutr. Sci. 2014, 5, 692–714. [Google Scholar] [CrossRef]
- Bastola, K.P.; Guragain, Y.N.; Bhadriraju, V.; Vadlani, P.V. Evaluation of Standards and Interfering Compounds in the Determination of Phenolics by Folin-Ciocalteu Assay Method for Effective Bioprocessing of Biomass. Am. J. Anal. Chem. 2017, 08, 416–431. [Google Scholar] [CrossRef]
- Haase, P.T.; Kanzler, C.; Hildebrandt, J.; Kroh, L.W. Browning Potential of C 6 -α-Dicarbonyl Compounds under Maillard Conditions. J. Agric. Food Chem. 2017, 65, 1924–1931. [Google Scholar] [CrossRef] [PubMed]
- Wiktor, A.; Dadan, M.; Nowacka, M.; Rybak, K.; Witrowa-Rajchert, D. The impact of combination of pulsed electric field and ultrasound treatment on air drying kinetics and quality of carrot tissue. LWT—Food Sci. Technol. 2019, 110, 71–79. [Google Scholar] [CrossRef]
- Goldberg, R.N.; Tewari, Y.B.; Ahluwalia, J.C. Thermodynamics of the hydrolysis of sucrose. J. Biol. Chem. 1989, 264, 9901–9904. [Google Scholar] [CrossRef] [PubMed]
- Ohshima, T.; Tamura, T.; Sato, M. Influence of pulsed electric field on various enzyme activities. J. Electrostat. 2007, 65, 156–161. [Google Scholar] [CrossRef]
- Verma, A.K.; Singh, S.B.; Agarwal, A.K.; Solomon, S. Influence of postharvest storage temperature, time, and invertase enzyme activity on sucrose and weight loss in sugarcane. Postharvest Biol. Technol. 2012, 73, 14–21. [Google Scholar] [CrossRef]
- de Souza Soares, A.; Augusto, P.E.D.; Leite Júnior, B.R.d.C.; Nogueira, C.A.; Vieira, É.N.R.; de Barros, F.A.R.; Stringheta, P.C.; Ramos, A.M. Ultrasound assisted enzymatic hydrolysis of sucrose catalyzed by invertase: Investigation on substrate, enzyme and kinetics parameters. LWT 2019, 107, 164–170. [Google Scholar] [CrossRef]
- Caballero-Cerón, C.; Serment-Moreno, V.; Velazquez, G.; Torres, J.A.; Welti-Chanes, J. Hygroscopic properties and glass transition of dehydrated mango, apple and banana. J. Food Sci. Technol. 2018, 55, 540–549. [Google Scholar] [CrossRef] [PubMed]

 and PEF-treated
  freeze-dried pumpkin depending on the specific energy input Wp. Different heating plate temperatures of 40 and 60 °C have been used. a–c Different letters indicate significant statistical differences (Tukey’s HSD, p < 0.05, n = 3).
and PEF-treated freeze-dried pumpkin depending on the specific energy input Wp. Different heating plate temperatures of 40 and 60 °C have been used. a–c Different letters indicate significant statistical differences (Tukey’s HSD, p < 0.05, n = 3).
freeze-dried pumpkin depending on the specific energy input Wp. Different heating plate temperatures of 40 and 60 °C have been used. a–c Different letters indicate significant statistical differences (Tukey’s HSD, p < 0.05, n = 3).
and PEF-treated freeze-dried pumpkin depending on the specific energy input Wp. Different heating plate temperatures of 40 and 60 °C have been used. a–c Different letters indicate significant statistical differences (Tukey’s HSD, p < 0.05, n = 3).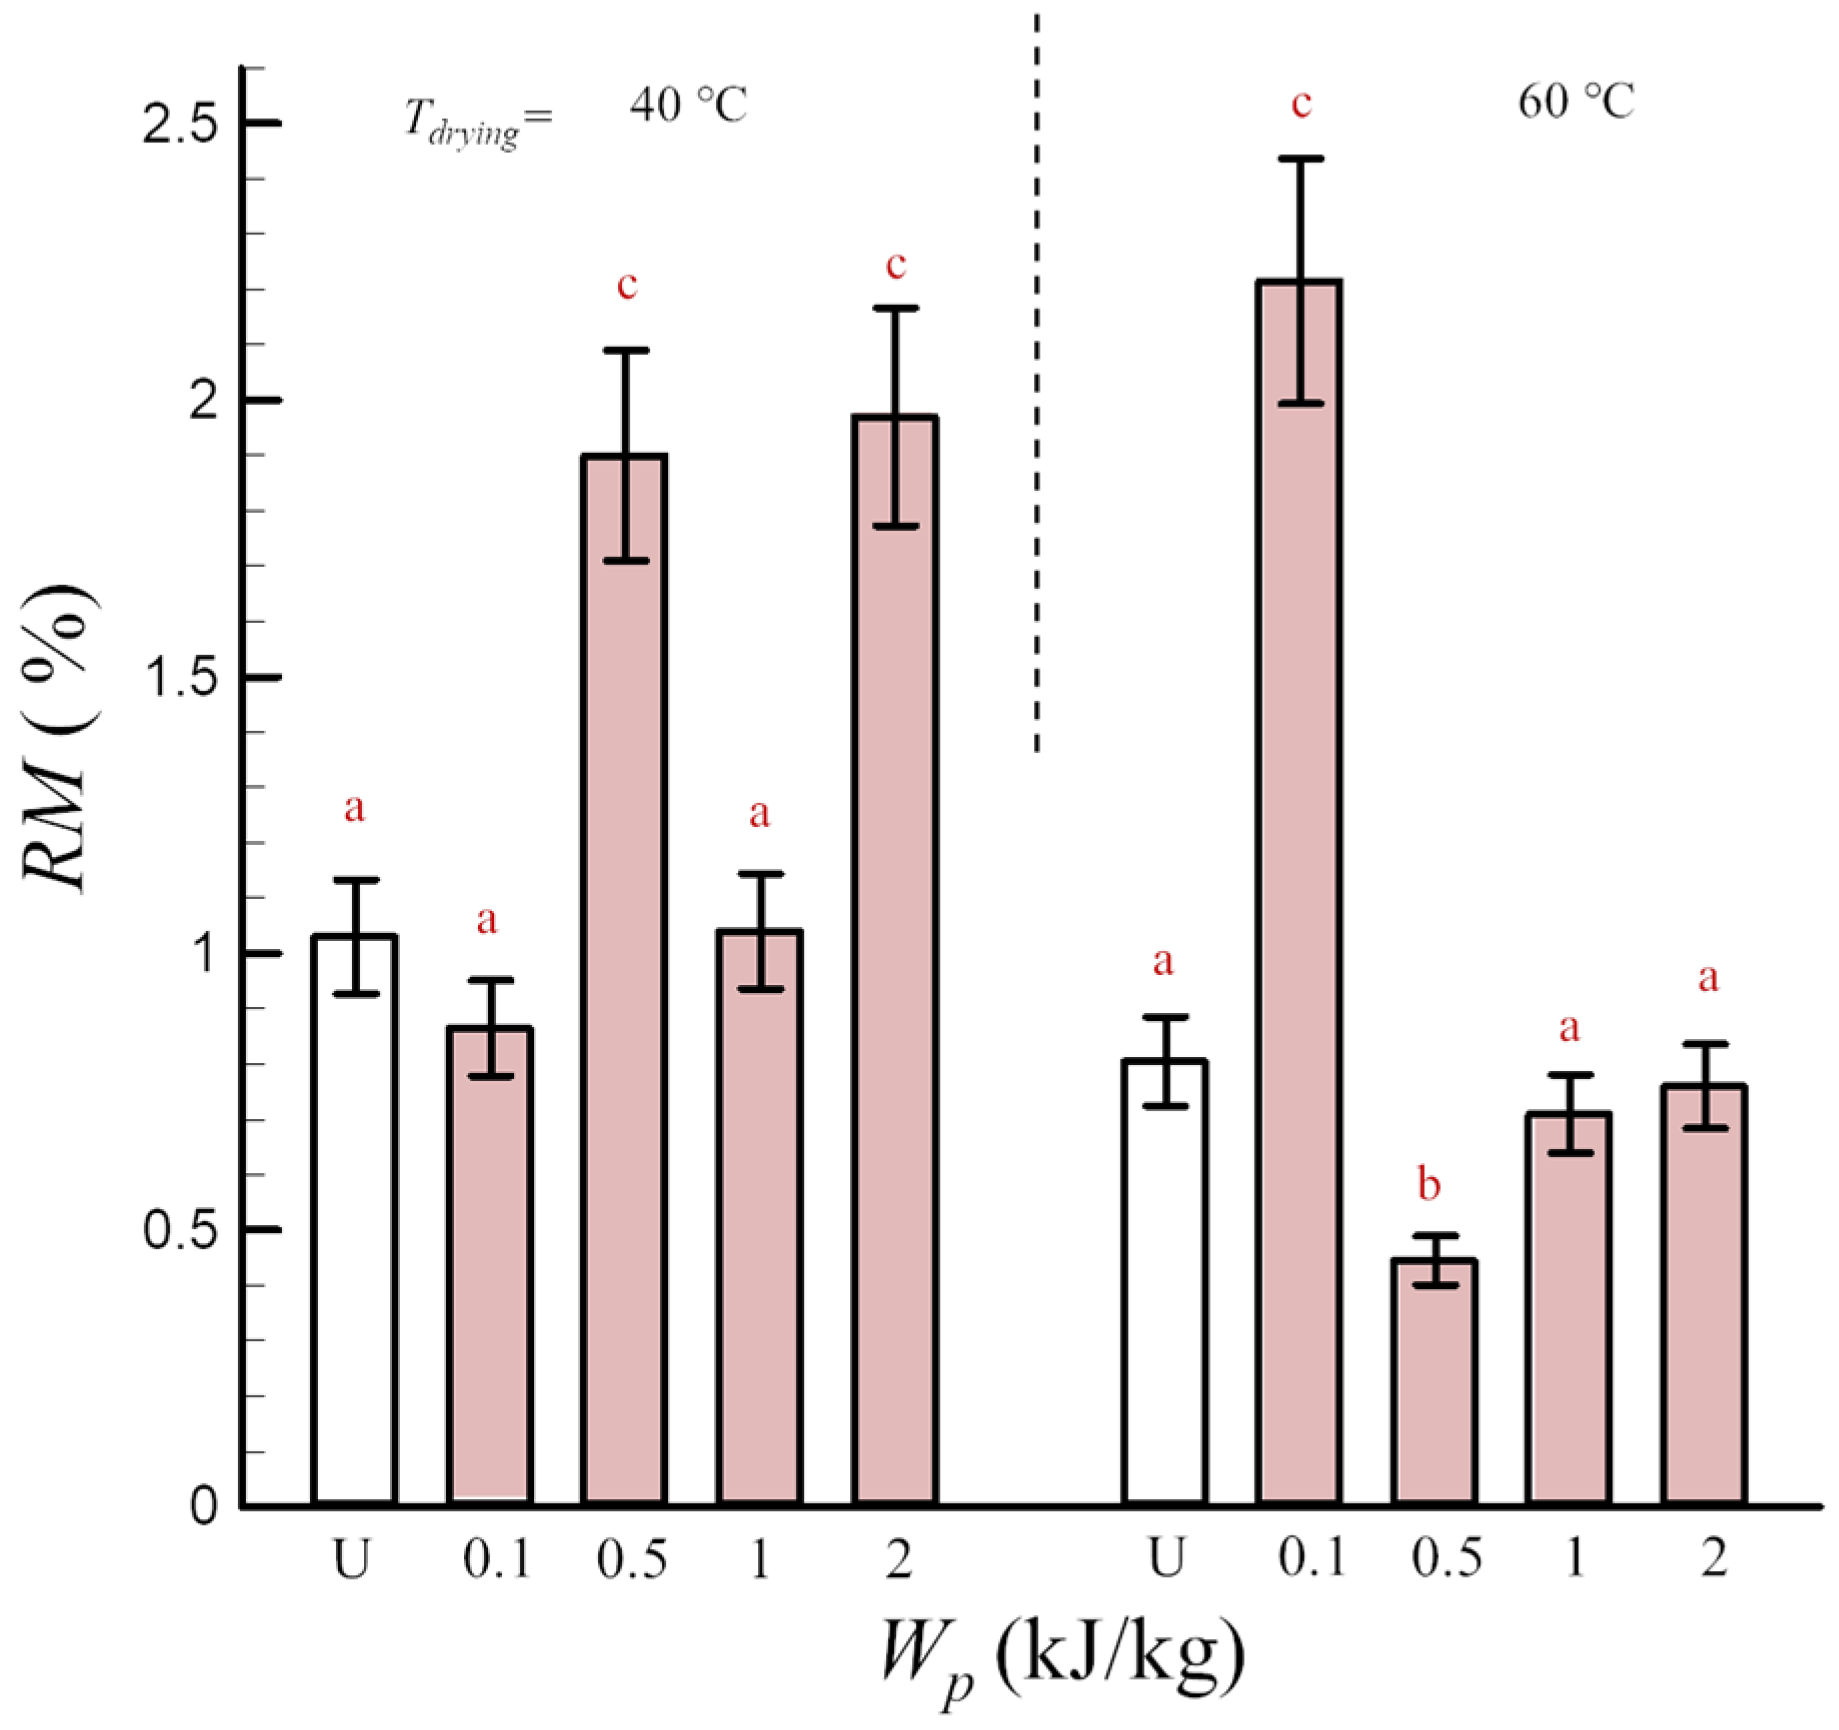
 ) and 60 °C (
 ) depending on the specific energy input Wp. a–e Different letters indicate significant statistical differences (Tukey’s HSD, p < 0.05, n = 3).
) and 60 °C () depending on the specific energy input Wp. a–e Different letters indicate significant statistical differences (Tukey’s HSD, p < 0.05, n = 3).
) depending on the specific energy input Wp. a–e Different letters indicate significant statistical differences (Tukey’s HSD, p < 0.05, n = 3).
) and 60 °C () depending on the specific energy input Wp. a–e Different letters indicate significant statistical differences (Tukey’s HSD, p < 0.05, n = 3).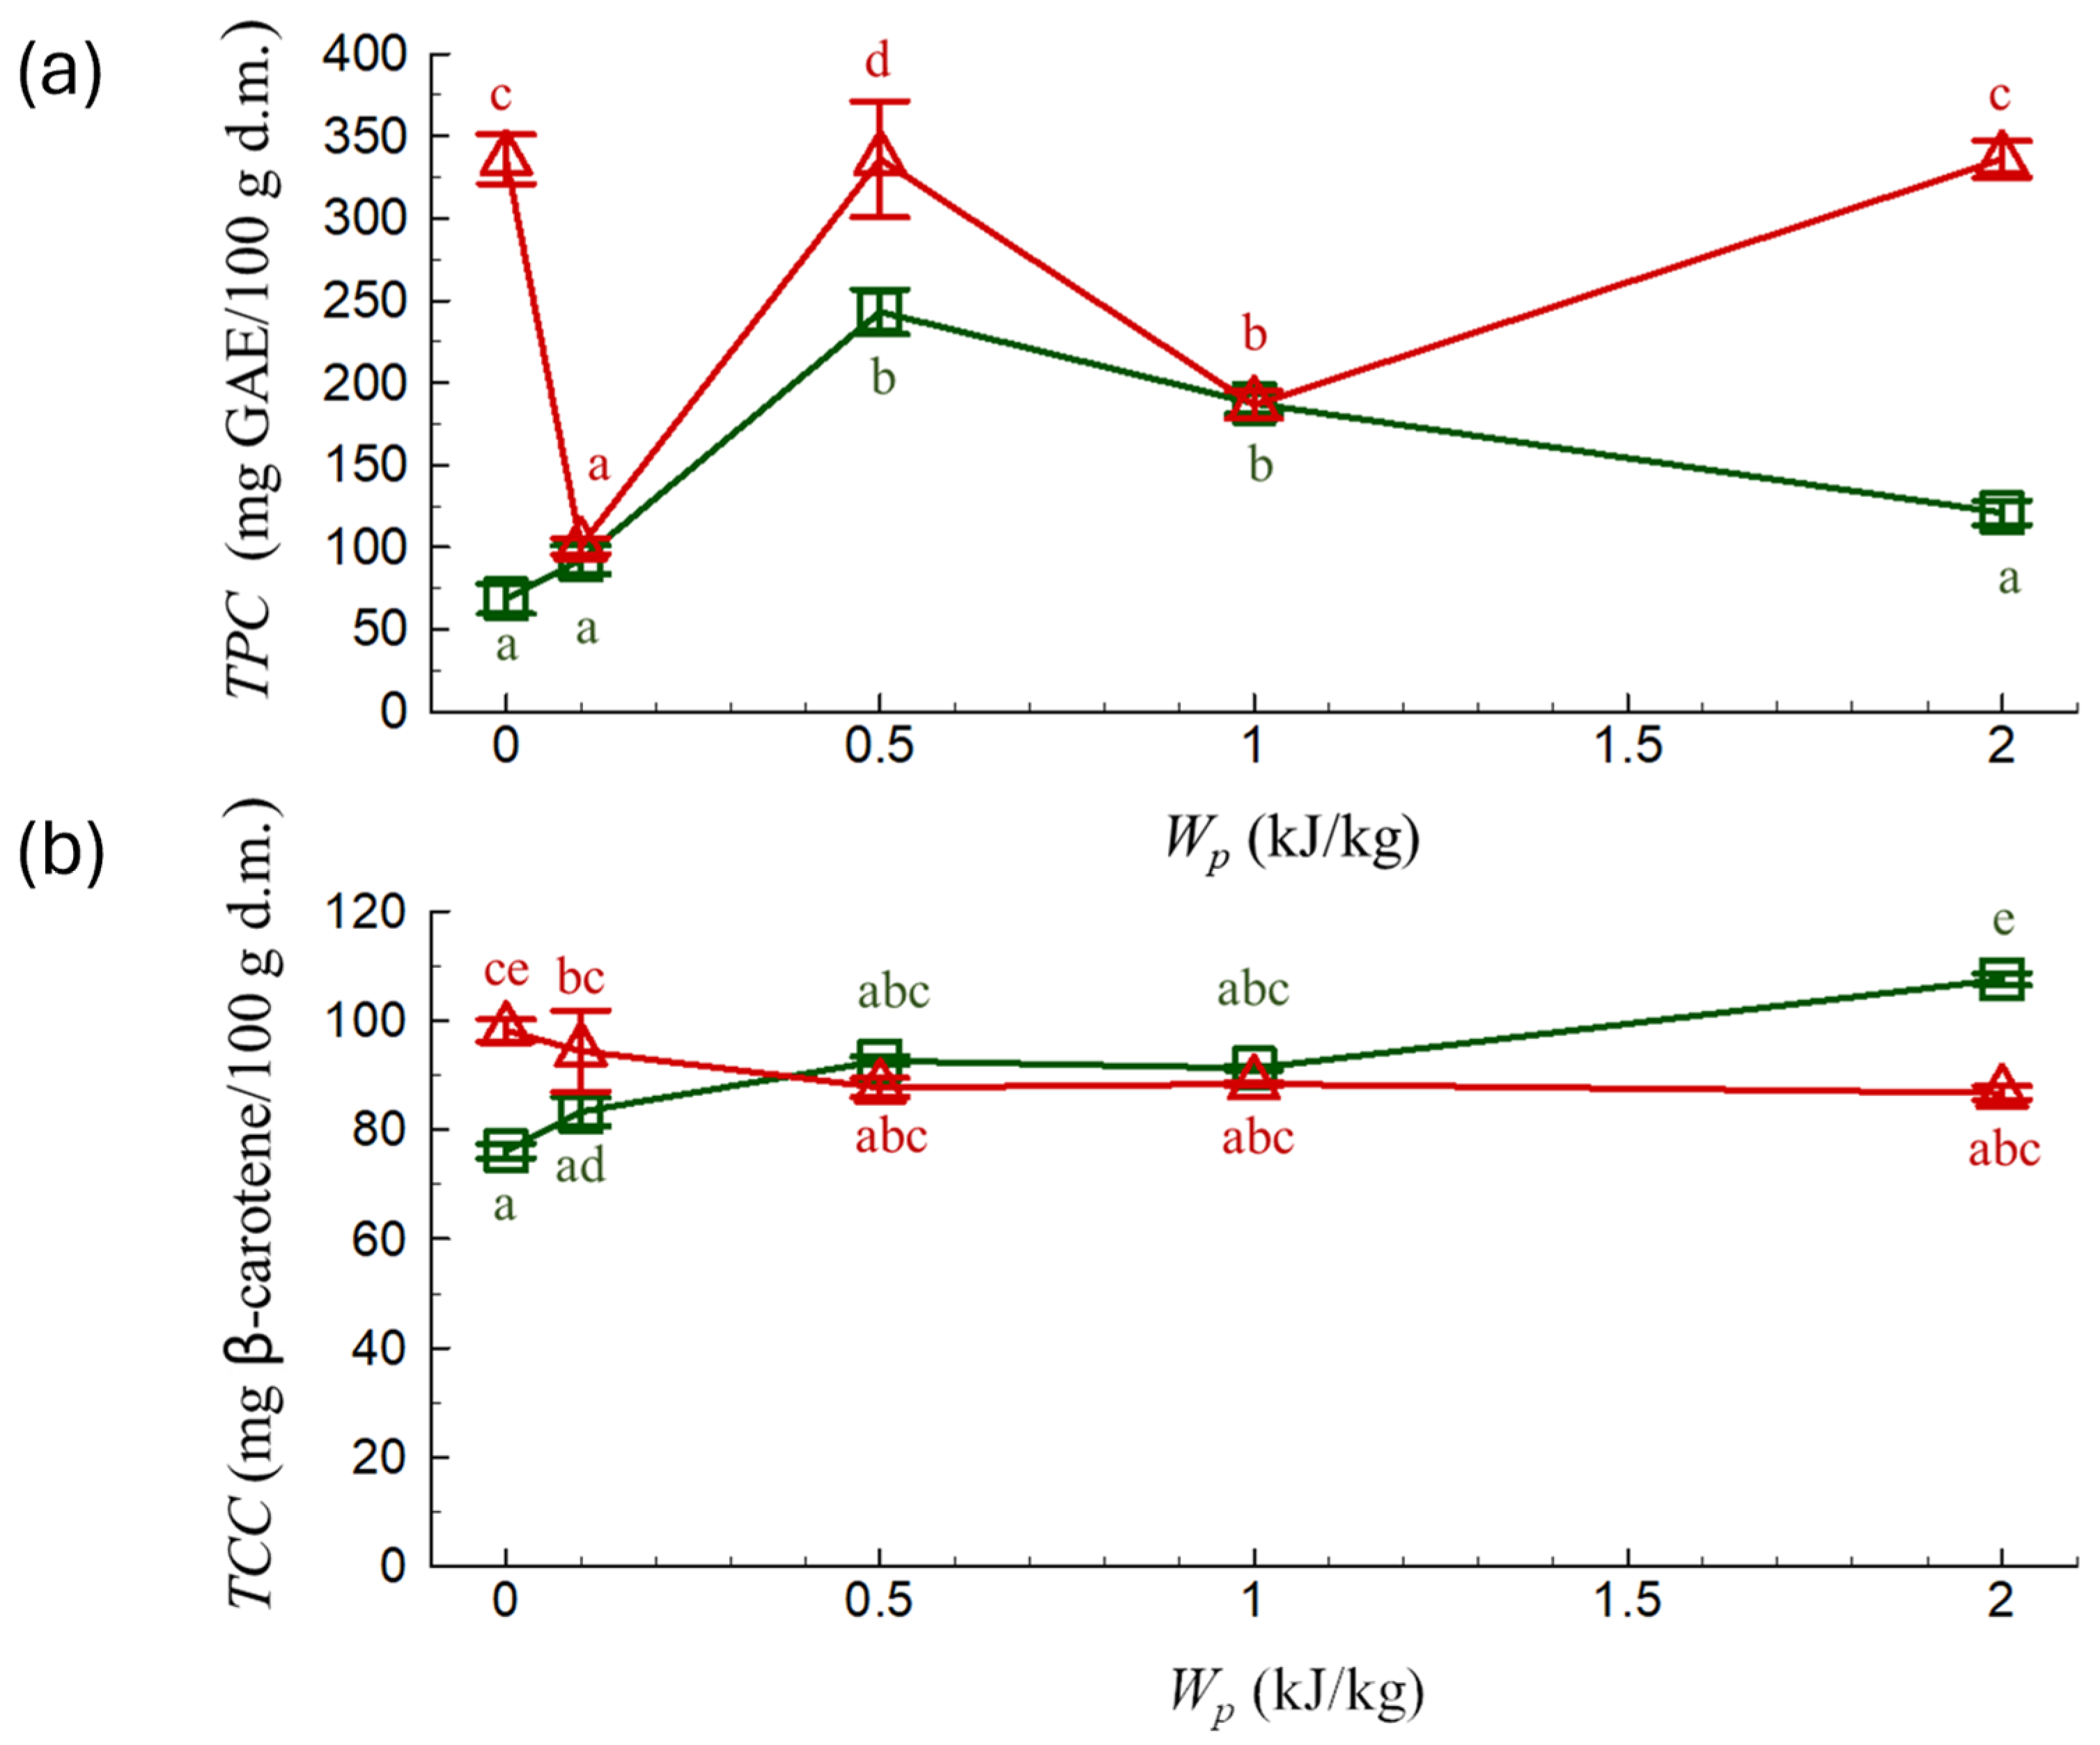
 ), glucose (
 ), and fructose (
 ) in untreated and PEF-treated pumpkin freeze-dried at (a) 40 °C and (b) 60 °C depending on the specific energy input Wp. a–e Different letters indicate significant statistical differences (Tukey’s HSD, p < 0.05, n = 3).
), glucose (), and fructose () in untreated and PEF-treated pumpkin freeze-dried at (a) 40 °C and (b) 60 °C depending on the specific energy input Wp. a–e Different letters indicate significant statistical differences (Tukey’s HSD, p < 0.05, n = 3).
) in untreated and PEF-treated pumpkin freeze-dried at (a) 40 °C and (b) 60 °C depending on the specific energy input Wp. a–e Different letters indicate significant statistical differences (Tukey’s HSD, p < 0.05, n = 3).
), glucose (), and fructose () in untreated and PEF-treated pumpkin freeze-dried at (a) 40 °C and (b) 60 °C depending on the specific energy input Wp. a–e Different letters indicate significant statistical differences (Tukey’s HSD, p < 0.05, n = 3).
 ), PEF1 (
 ), PEF2 (
 ), PEF3 (
 ), PEF4 (
 ).
), PEF1 (), PEF2 (), PEF3 (), PEF4 ().
).
), PEF1 (), PEF2 (), PEF3 (), PEF4 ().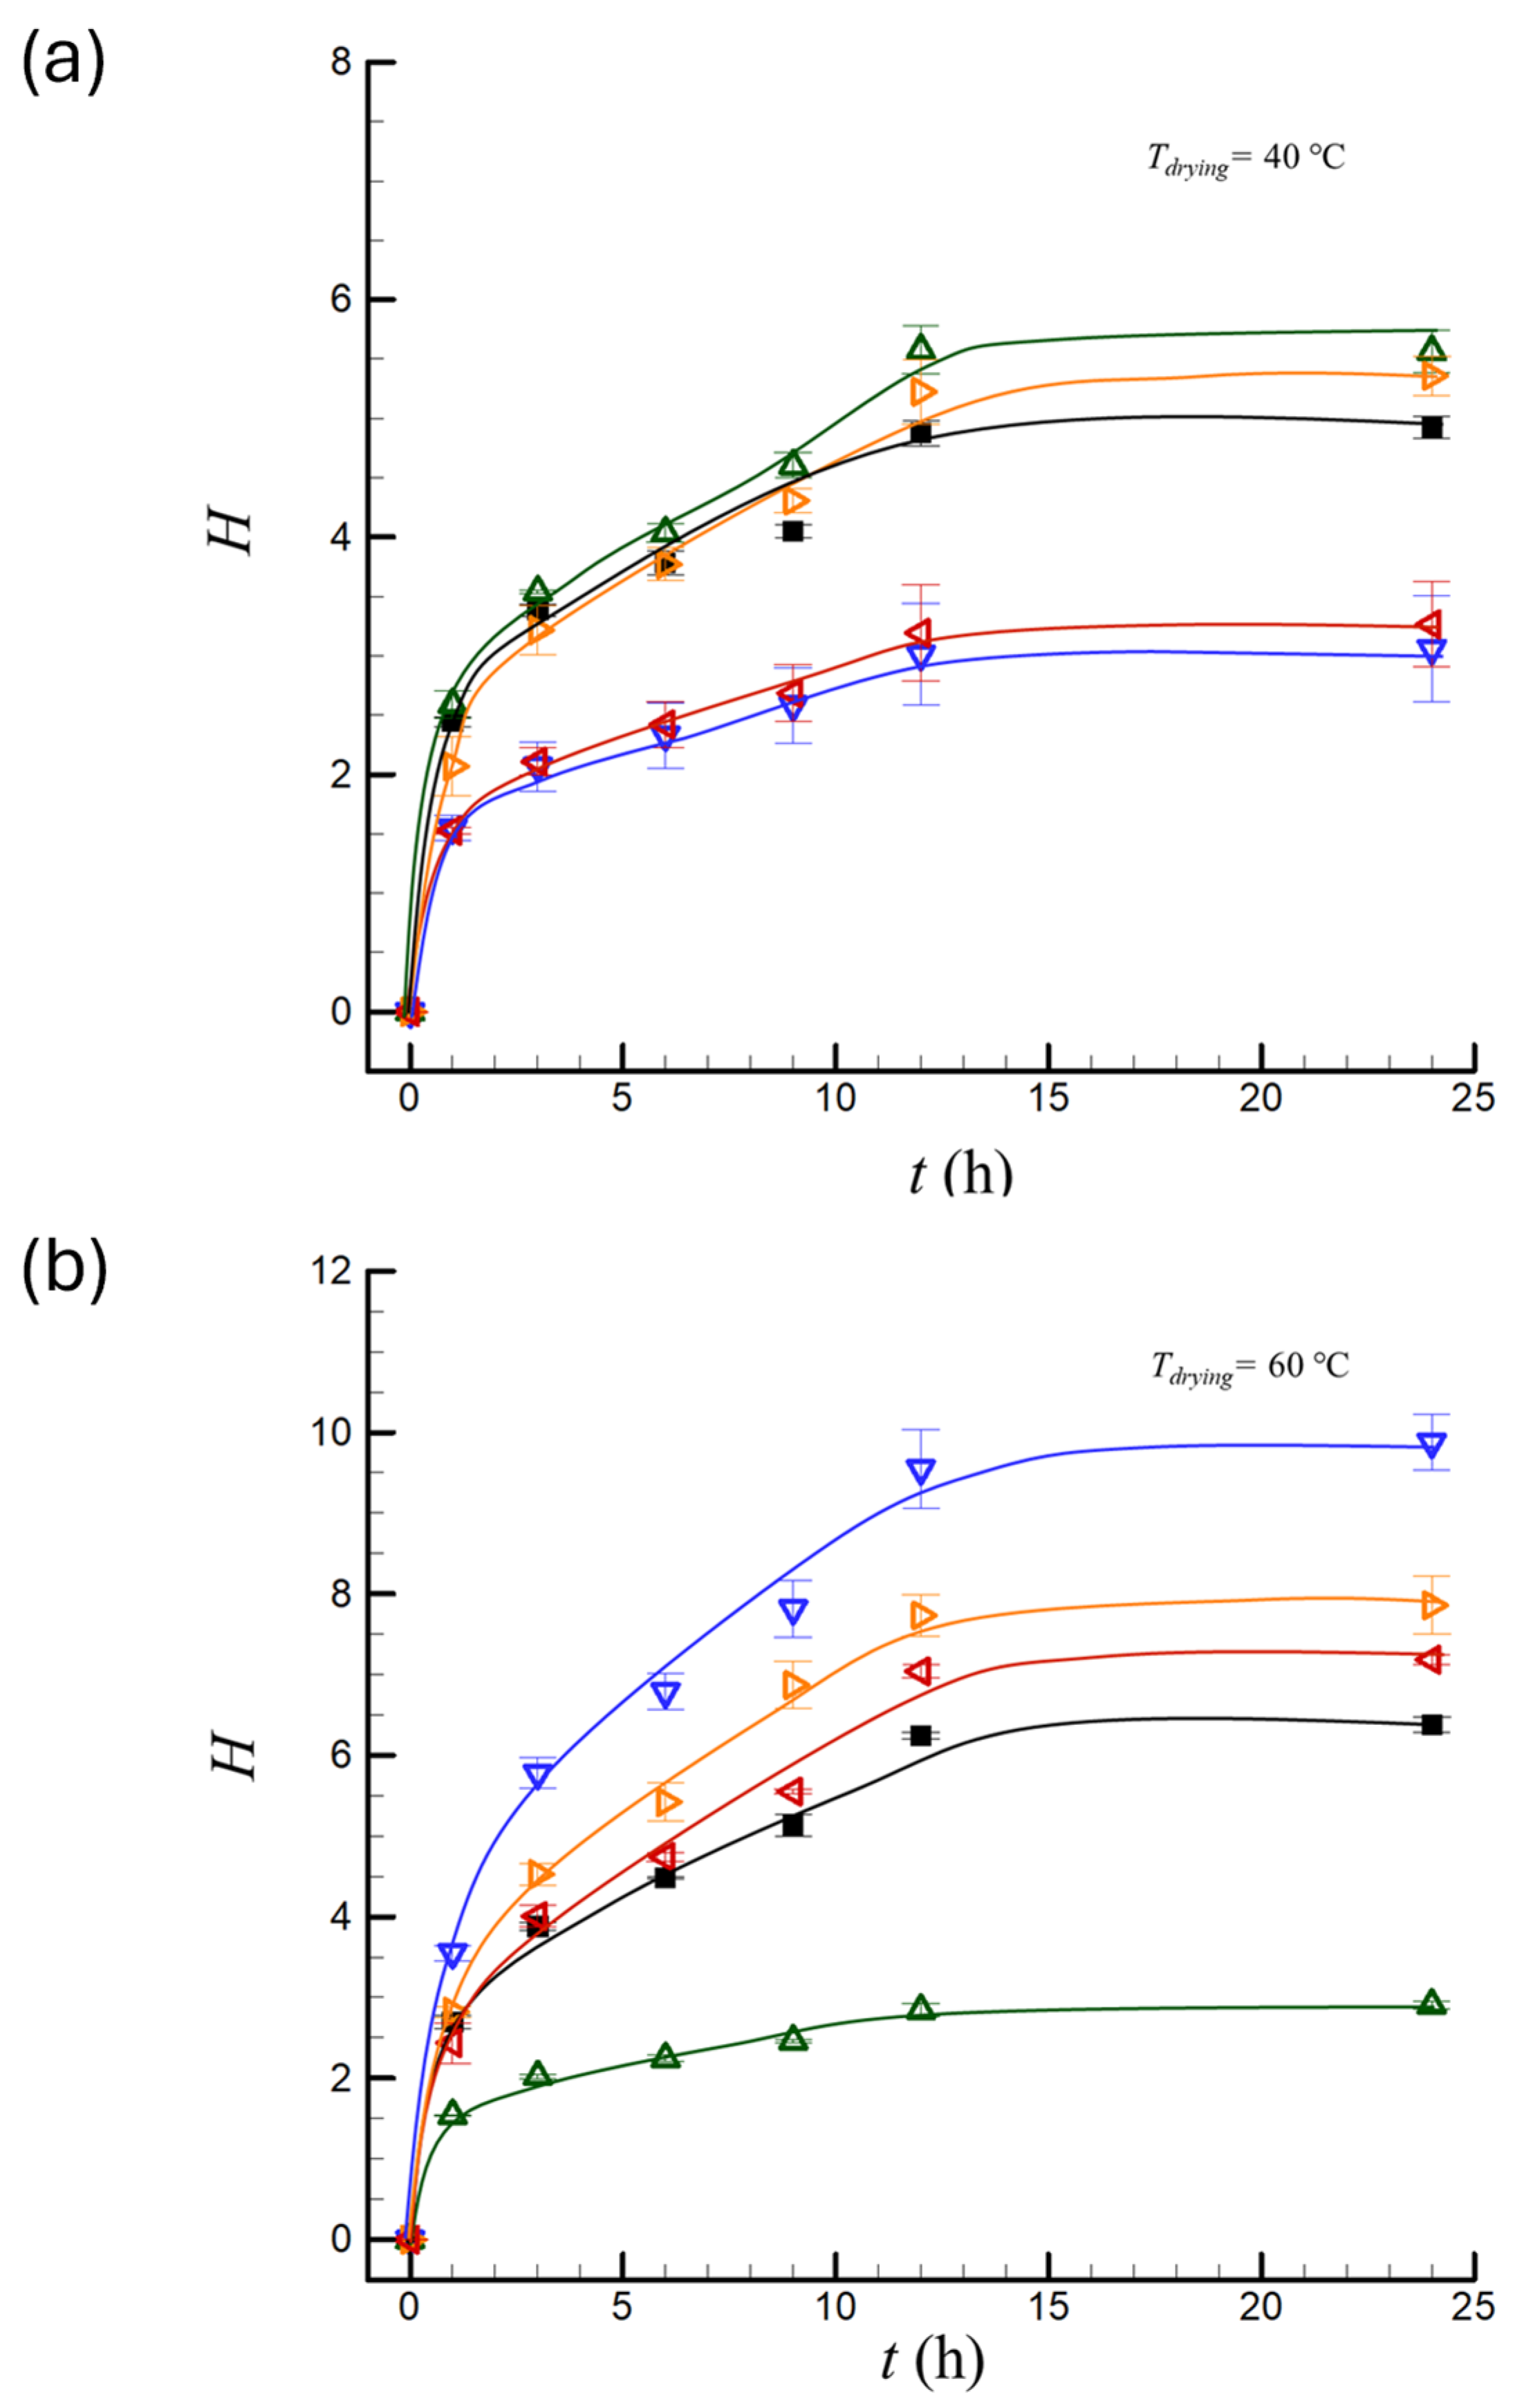

| Sample | L* | a* | b* | ΔE | BI |
|---|---|---|---|---|---|
| Drying at 40 °C | |||||
| U—0 kJ/kg | 76.68 ± 0.05 cd | 18.82 ± 0.15 cd | 72.77 ± 1.31 a | - | 202.4 |
| PEF1—0.1 kJ/kg | 77.31 ± 0.31 ef | 18.59 ± 0.07 cd | 72.69 ± 0.96 a | 0.68 | 198.7 |
| PEF2—0.5 kJ/kg | 76.03 ± 0.67 b | 20.51 ± 0.59 f | 74.66 ± 1.56 b | 2.62 | 216.9 |
| PEF3—1 kJ/kg | 76.66 ± 0.36 bc | 19.48 ± 0.14 e | 74.15 ± 0.90 ab | 1.53 | 210.1 |
| PEF4—2 kJ/kg | 74.25 ± 0.21 a | 22.86 ± 0.09 g | 75.32 ± 0.42 b | 5.35 | 232.7 |
| Drying at 60 °C | |||||
| U—0 kJ/kg | 77.66 ± 0.13 ef | 17.95 ± 0.17 ab | 73.76 ± 0.70 ab | - | 201.8 |
| PEF1—0.1 kJ/kg | 77.79 ± 0.14 e | 17.89 ± 0.02 a | 73.67 ± 0.12 ab | 0.17 | 200.6 |
| PEF2—0.5 kJ/kg | 77.07 ± 0.06 de | 18.86 ± 0.12 d | 74.86 ± 0.42 b | 1.55 | 211.1 |
| PEF3—1 kJ/kg | 76.57 ± 0.41 bcd | 18.38 ± 0.39 bc | 79.06 ± 0.55 c | 5.43 | 236.7 |
| PEF4—2 kJ/kg | 76.22 ± 0.07 bc | 19.43 ± 0.19 e | 78.28 ± 1.11 c | 4.97 | 235.1 |
Disclaimer/Publisher’s Note: The statements, opinions and data contained in all publications are solely those of the individual author(s) and contributor(s) and not of MDPI and/or the editor(s). MDPI and/or the editor(s) disclaim responsibility for any injury to people or property resulting from any ideas, methods, instructions or products referred to in the content. |
© 2024 by the authors. Licensee MDPI, Basel, Switzerland. This article is an open access article distributed under the terms and conditions of the Creative Commons Attribution (CC BY) license (https://creativecommons.org/licenses/by/4.0/).
Share and Cite
Rastorhuiev, O.; Matys, A.; Wiktor, A.; Rybak, K.; Lammerskitten, A.; Toepfl, S.; Schnäckel, W.; Gondek, E.; Parniakov, O. The Impact of Pulsed Electric Field Treatment and Shelf Temperature on Quality of Freeze-Dried Pumpkin. Appl. Sci. 2024, 14, 4561. https://doi.org/10.3390/app14114561
Rastorhuiev O, Matys A, Wiktor A, Rybak K, Lammerskitten A, Toepfl S, Schnäckel W, Gondek E, Parniakov O. The Impact of Pulsed Electric Field Treatment and Shelf Temperature on Quality of Freeze-Dried Pumpkin. Applied Sciences. 2024; 14(11):4561. https://doi.org/10.3390/app14114561
Chicago/Turabian StyleRastorhuiev, Oleksii, Aleksandra Matys, Artur Wiktor, Katarzyna Rybak, Alica Lammerskitten, Stefan Toepfl, Wolfram Schnäckel, Ewa Gondek, and Oleksii Parniakov. 2024. "The Impact of Pulsed Electric Field Treatment and Shelf Temperature on Quality of Freeze-Dried Pumpkin" Applied Sciences 14, no. 11: 4561. https://doi.org/10.3390/app14114561
APA StyleRastorhuiev, O., Matys, A., Wiktor, A., Rybak, K., Lammerskitten, A., Toepfl, S., Schnäckel, W., Gondek, E., & Parniakov, O. (2024). The Impact of Pulsed Electric Field Treatment and Shelf Temperature on Quality of Freeze-Dried Pumpkin. Applied Sciences, 14(11), 4561. https://doi.org/10.3390/app14114561