Article

Seismic Design Procedure for Low-Rise Cold-Formed Steel–Special Bolted Moment Frames

Department of Architecture, Civil Engineering and Industrial Management Engineering, Nagoya Institute of Technology, Nagoya 466-8555, Japan
*
Author to whom correspondence should be addressed.
Appl. Sci. 2024, 14(11), 4520; https://doi.org/10.3390/app14114520
Submission received: 28 April 2024 / Revised: 21 May 2024 / Accepted: 22 May 2024 / Published: 24 May 2024
(This article belongs to the Special Issue Performance-Based Seismic Design)

Abstract

:
In 2007, the American Iron and Steel Institute (AISI) established a standard for cold-formed steel–special bolted moment frames (CFS-SBMFs). This structural system is designed to resist seismic forces. The CFS-SBMF system employs double-channel beams and square hollow structural section (HSS) columns that are bolted together to create a sturdy and robust structural frame. However, the CFS-SBMF system is only suitable for constructing one-storey buildings, and ASCE 7 prohibits its use in buildings with a height of over one storey. This study was conducted to expand the use of CFS-SBMFs to the construction of multi-storey low-rise buildings. Firstly, a new moment connection detail is proposed, and a design procedure is proposed to ensure that bolted connections, instead of beams or columns, have the ductility to withstand seismic forces. Secondly, the proposed design procedure for bolted connections was verified through full-scale cyclic testing. Finally, a comprehensive evaluation was undertaken to evaluate the proposed structural system’s performance under seismic excitation. The evaluation included nonlinear dynamic analysis and incremental dynamic analysis (IDA) according to FEMA P695, which provided a detailed understanding of the seismic design factors (SDFs) in multi-storey low-rise CFS-SBMF buildings.

1. Introduction

The American Iron and Steel Institute (AISI) published the “Standard for Seismic Design of Cold-Formed Steel Structural Systems” in 2007 [1]. This standard introduced cold-formed steel–special bolted moment frames (CFS-SBMFs) as the first seismic force-resisting system. CFS-SBMFs consist of double-channel beams and square hollow structural section (HSS) columns that are connected by snugly tightened high-strength bolts. This type of moment frame is designed for one-storey construction only, as seen in Figure 1. The frame’s ductility is provided through slippage and bearing in the bolted beam-to-column moment connections. The beams and columns remain essentially elastic according to the capacity design principles. Although CFS-SBMFs were initially intended for applications on industrial platforms, some designers have used them to design single-storey buildings. However, using this type of moment frame for structures that are over one storey in height is not currently permitted by ASCE 7 [2]. CFS-SBMFs, which were introduced in AISI S-110, were initially developed by Sato and Uang [3]. Their structural performance and mathematical modelling for the prediction of their inelastic behaviours were also verified and validated by Uang and Sato [4,5]. Sabbagh et al. studied configurations of double-channel beams and the reinforcement effects by testing and using numerical simulations to increase their strength and ductility [6,7,8]. Serror et al. conducted full-scale testing of built-up beams with bolted connections for comparison with the numerical simulation results [9]. Hassan et al. continued to conduct numerical simulations of double-channel beams with several cross-sectional shapes and reinforcement effects to improve their ductility performance with bolted joints [10]. These studies referred to the AISI framing system and similarly focused on how to provide ductility. However, they mainly focused on improving the ductility of built-up beams with bolted end connections to spread the plasticity over the connected members, which is not part of the design concept of CFS-SBMFs. It is crucial to clarify and develop a method of providing ductility in cold-formed steel members. Cold-formed steel members are composed of relatively slender elements; therefore, expecting ductility from them is insufficient, and reinforcement is needed when they are treated similarly to heavy sections (i.e., compact sections). However, reinforcement methods that can be demonstrated in quantitative ways are still under development, and further studies are required. Calderoni et al. surveyed full-scale back-to-back built-up beams under monotonic and cyclic loading to demonstrate the structural performance of the members [11]. It was also mentioned that cold-formed steel members themselves cannot provide ductility, and drastic strength deterioration will happen in monotonic and, especially, cyclic loading. Dubina examined the seismic performance of cold-formed steel houses but did not include the moment-resisting frame system depicted in Figure 1 [12]. Moreover, due to the lack of ductility in cold-formed steel members themselves, small ductility reduction factors (i.e., behaviour factors) are used in designs. As a result, the design force that will be used to determine the members will be large.
This study aims to extend the use of CFS-SBMFs to multi-storey low-rise buildings and create a new moment connection detail for connecting beams and columns that can be utilised in multi-storey building frames. Moreover, a design procedure for beam-to-column connections will be presented for this system to resist seismic forces, which guarantees the potential for ductility from the bolted connections and not from the beams or columns. The advantage of this design concept is that dissipative zones, which accommodate the inelastic behaviour, are expected only in bolted connections, for which the structural performance has already been clarified by Uang and Sato [4,5]. The structural members are essentially designed elastically; therefore, it is possible to use designs according to the current regulations to avoid instability. To clarify the proposed design procedure and assess the structural performance, five full-scale specimens were prepared and tested to validate the effectiveness of the proposed bolted beam-to-column connection.
A ductile structural system has a high response modification coefficient R [2]. The proposed seismic design factors (SDFs) were evaluated according to FEMA P695 [13], which was the same methodology as that used in a previous study [14]. Firstly, to ensure that the maximum storey drift ratio met the ACSE 7 criteria, a nonlinear dynamic analysis was conducted with a seismic intensity equivalent to the design base earthquake (DBE) level [2]. It was also clarified that the assumed value of the designed system’s overstrength factor in the ultimate limit state would be valid. Secondly, an incremental dynamic analysis (IDA) was performed according to the FEMA P695 methodology to confirm the system’s collapse margin ratio (CMR). Finally, the CMRs of archetype frames were assessed, and the assumed response modification coefficient R was validated.

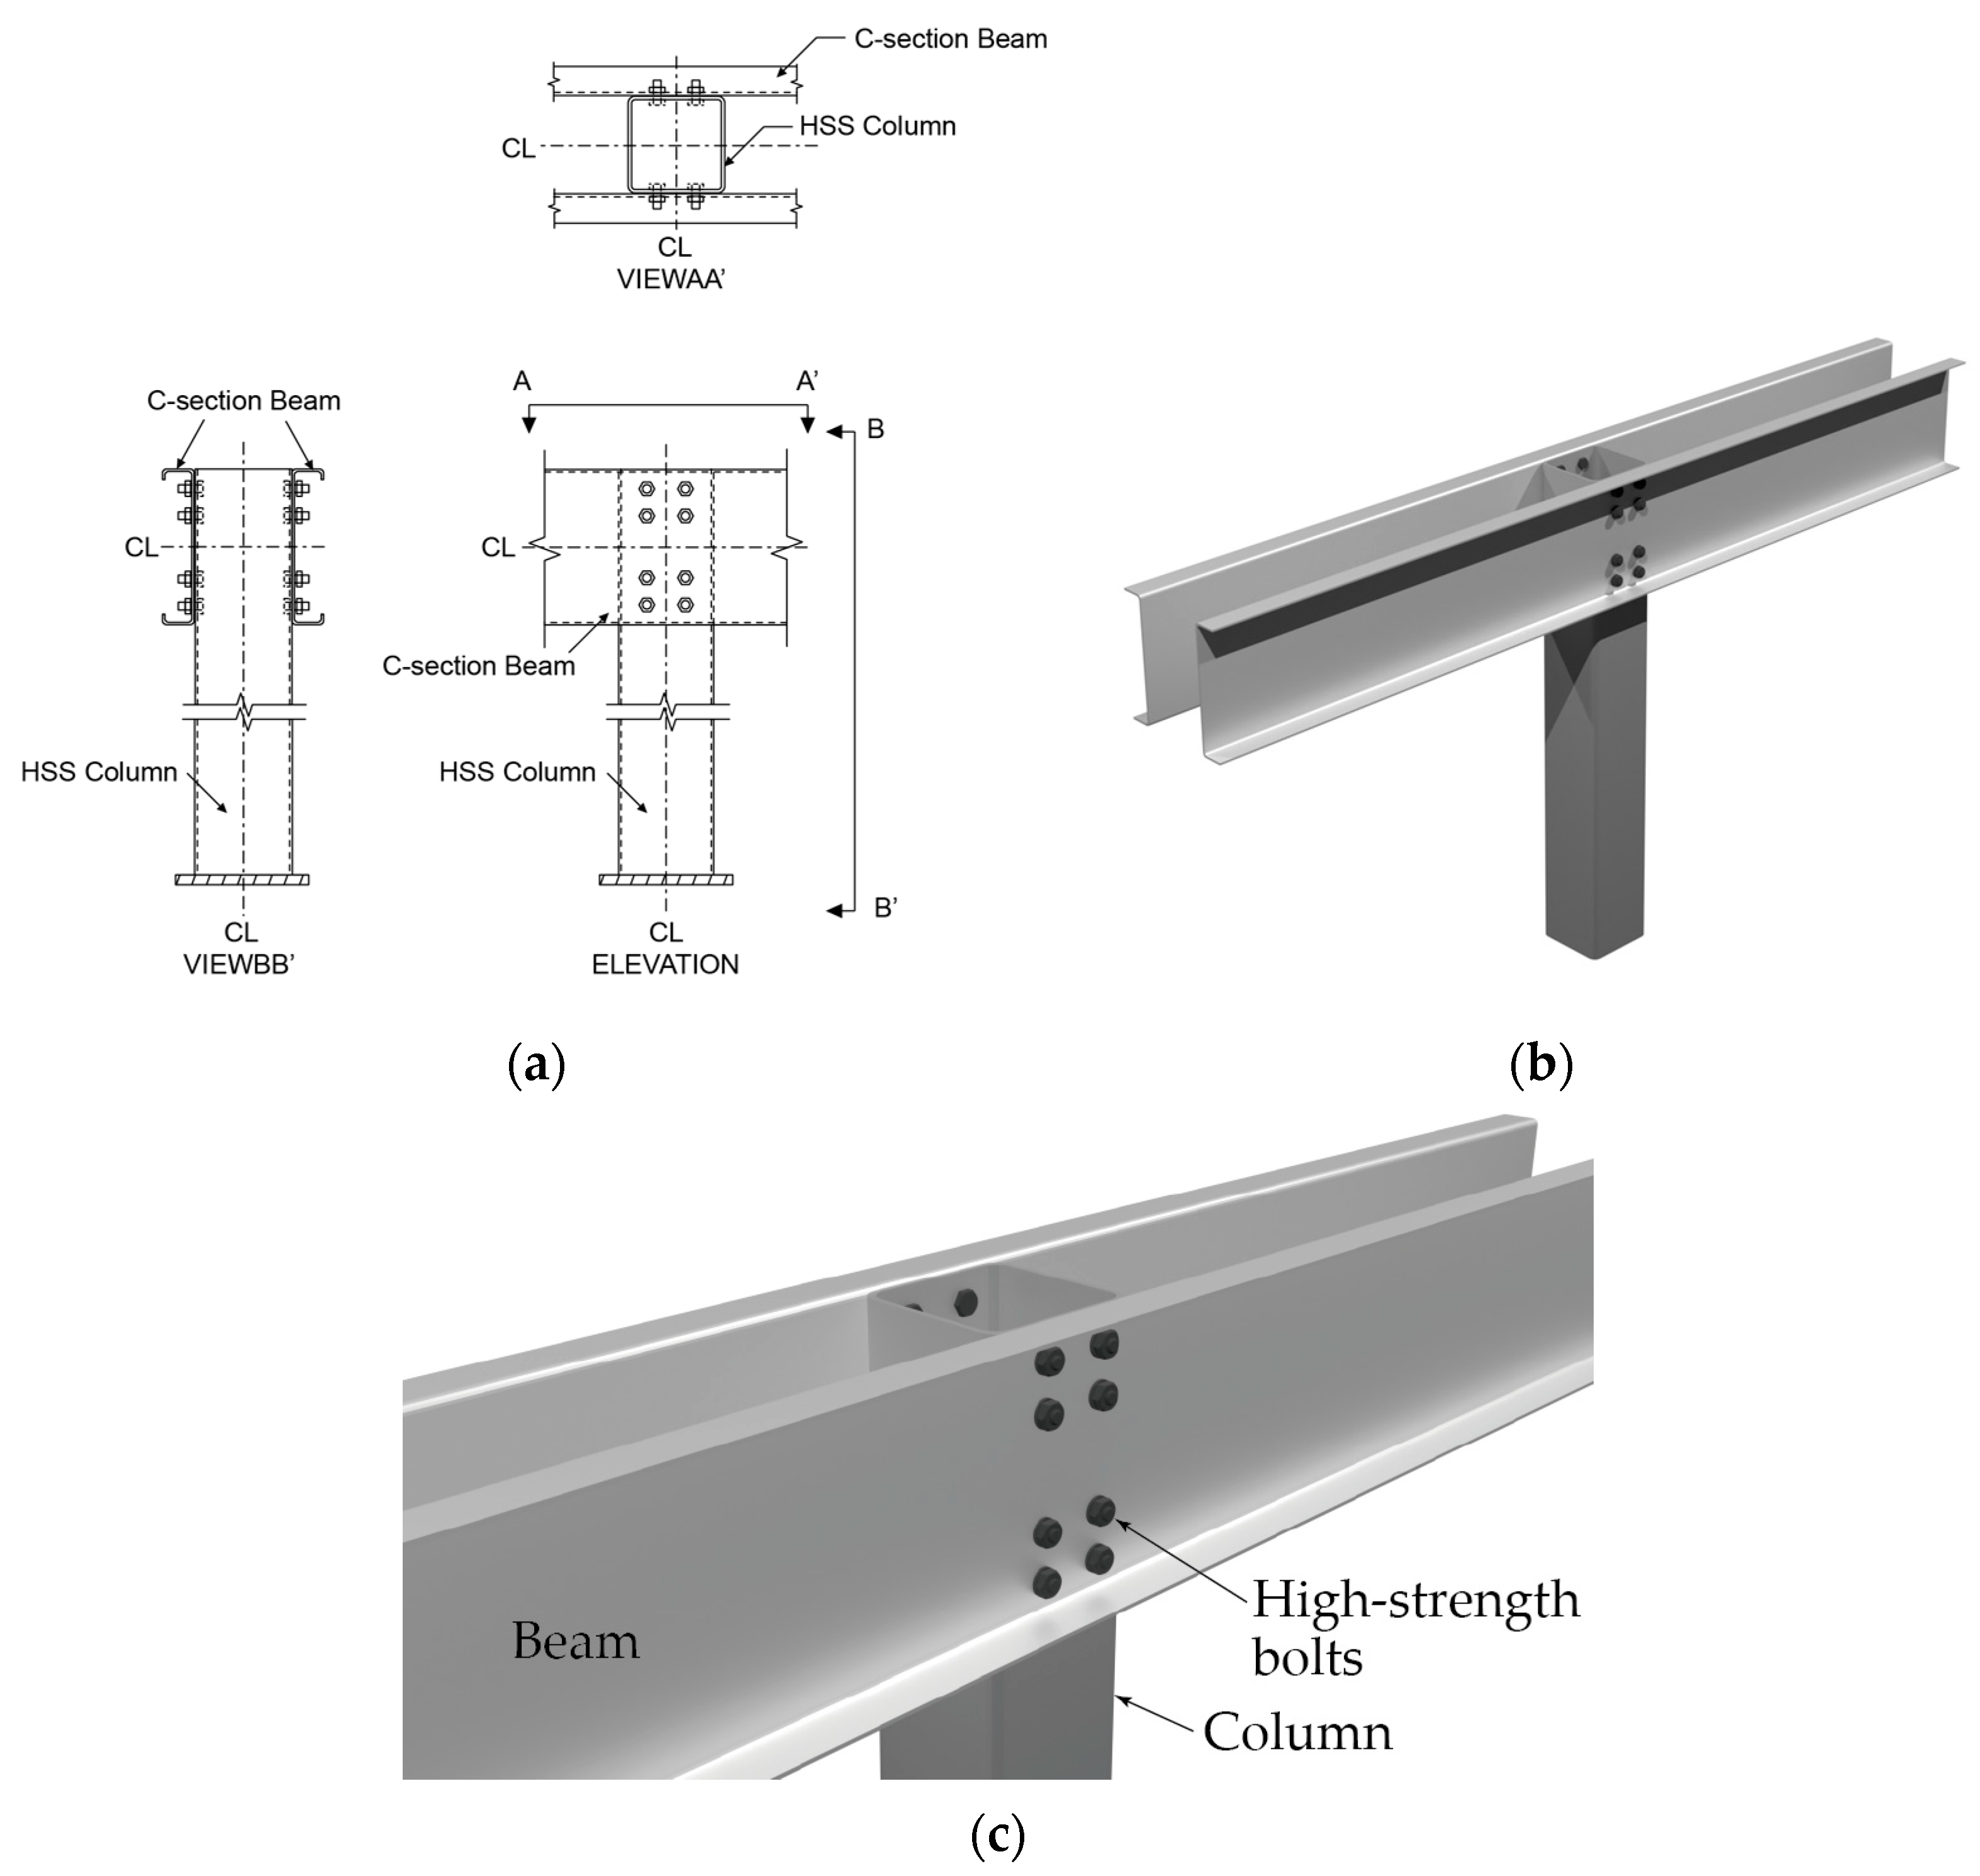
2. Proposed Bolted Connection for CFS-SBMFs

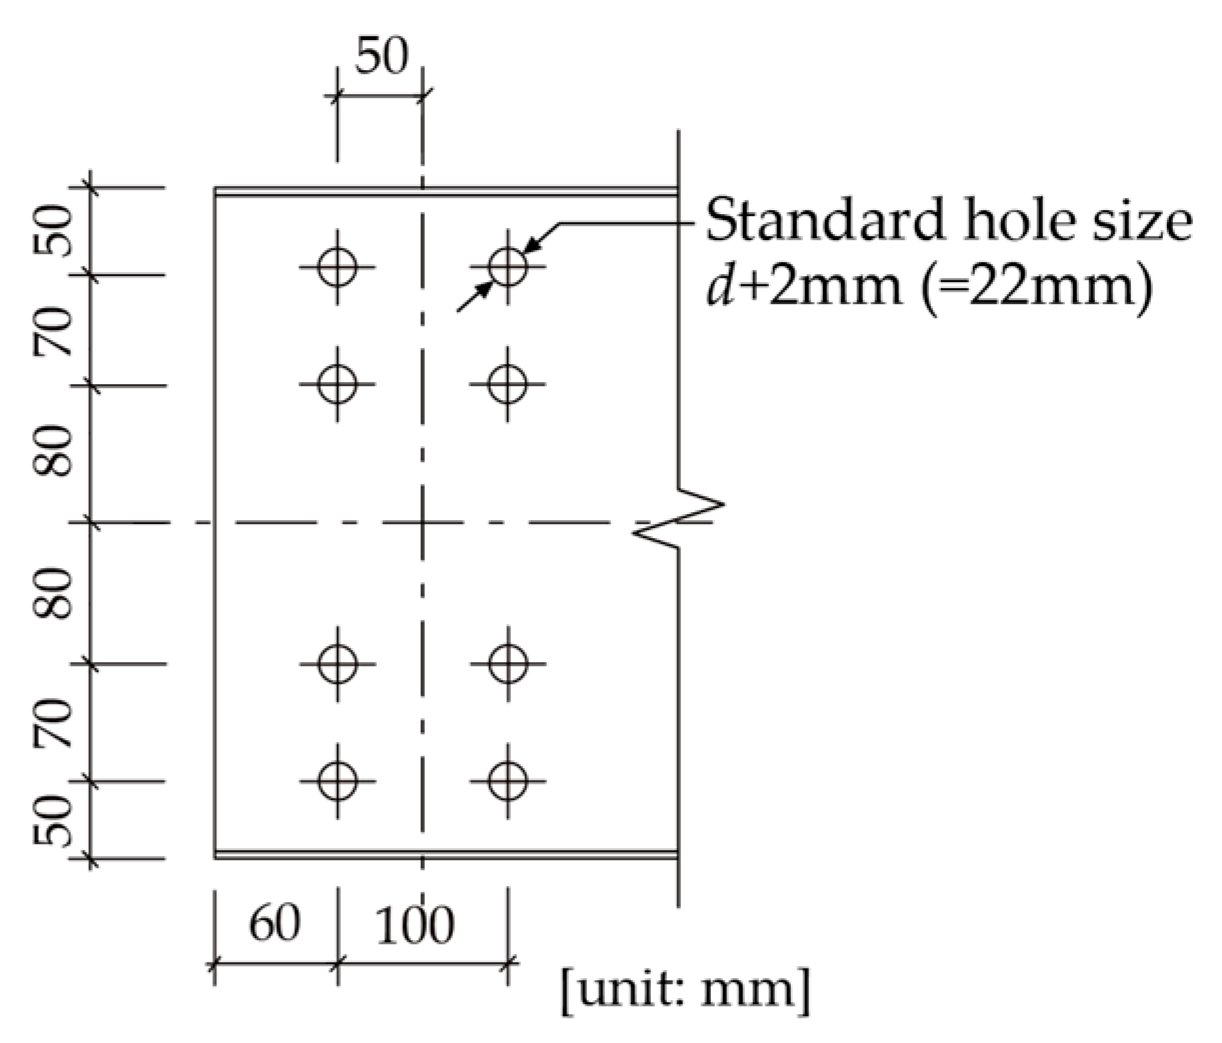
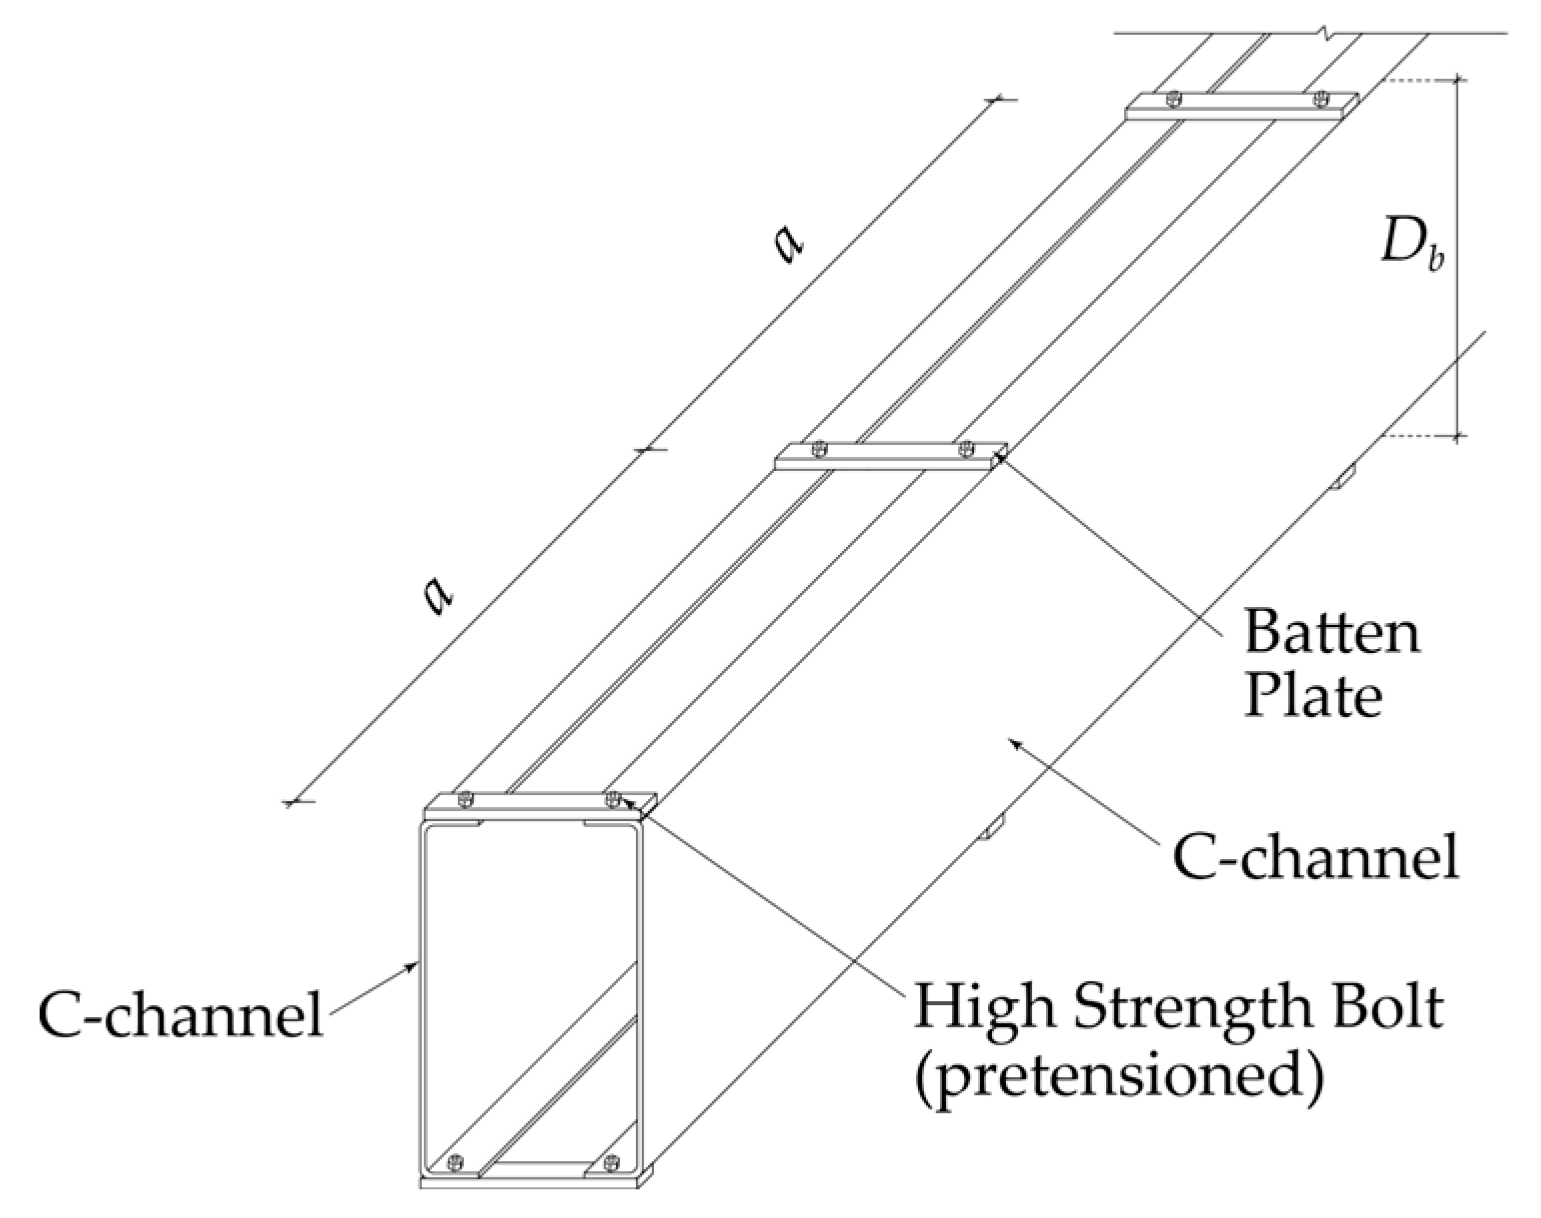
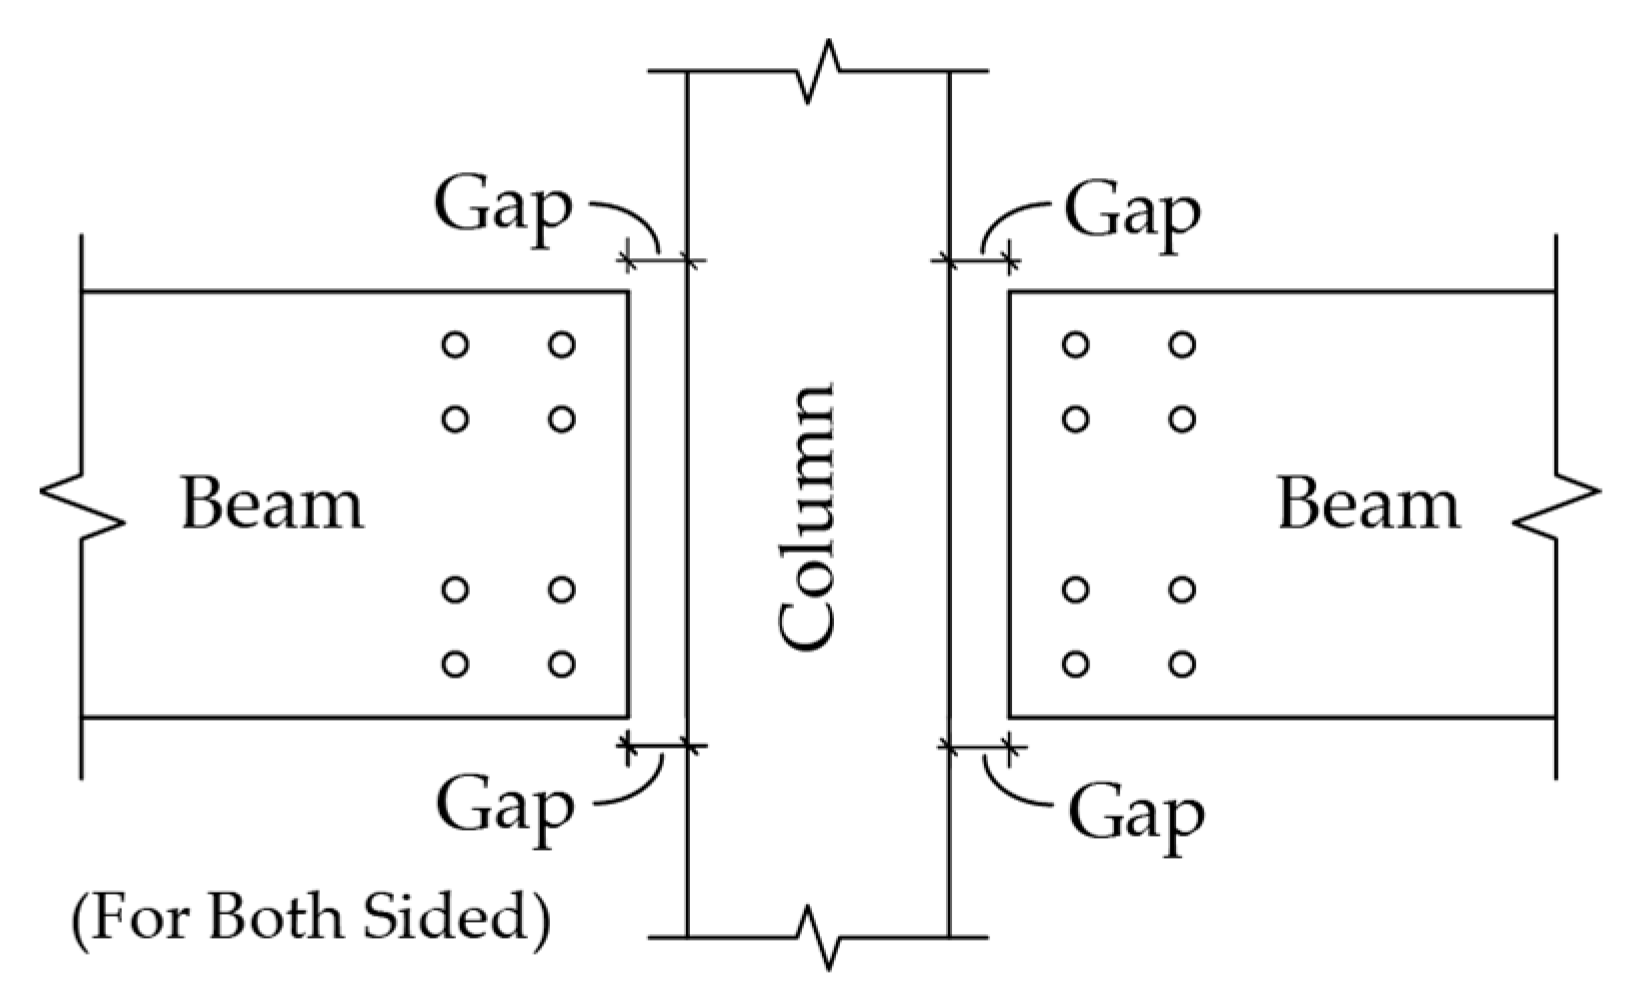
2.1. Connection Details

The original AISI bolted connection for a one-storey CFS-SBMF is shown in Figure 1. A square hollow structural section (HSS) is used for the column, and channel beams are placed on the sides at the top end of the HSS column in back-to-back orientations. This configuration allows for the easy installation of high-strength bolts from the top side space. However, when the column is extended upward to increase the storey numbers, connecting middle-storey beam members to it becomes problematic. One of the ways to connect the beams to the closed-shaped sections is to use the blind bolts, but for economic reasons, they are not appreciated for practical use.
To resolve this constructability issue, the connection details shown in Figure 2 are proposed. In this detail, beams are not directly connected to the column. Instead, the plate named the “connecting plate” will be attached to the column. These plates are welded in the shop to ensure proper tolerances and quality control. Then, the beams are oriented toe to toe and installed between these plates in the construction sites. To ensure the same design concept shown in AISI, the beam and the column are connected by high-strength bolts to provide high ductility through the bolt slippage and bolt bearing at the connections. The slippage and bearing at the bolted connection will provide inelastic behaviours and act like a plastic hinge that is simulated in conventional steel structures. The bolted connection will be a pseudo-plastic hinge in this AISI structural system. The original AISC connection design has only one pseudo-plastic hinge per beam-to-column connection. On the other hand, as an advantage, the proposed connection detail incorporates two plastic hinges at the internal beam-to-column connection, significantly increasing the energy dissipation. Except for the bolt bearing in the beam web, all other limit states, especially the buckling of the built-up beams, should be checked to ensure that the capacity design principles remain essentially elastic for structural members.

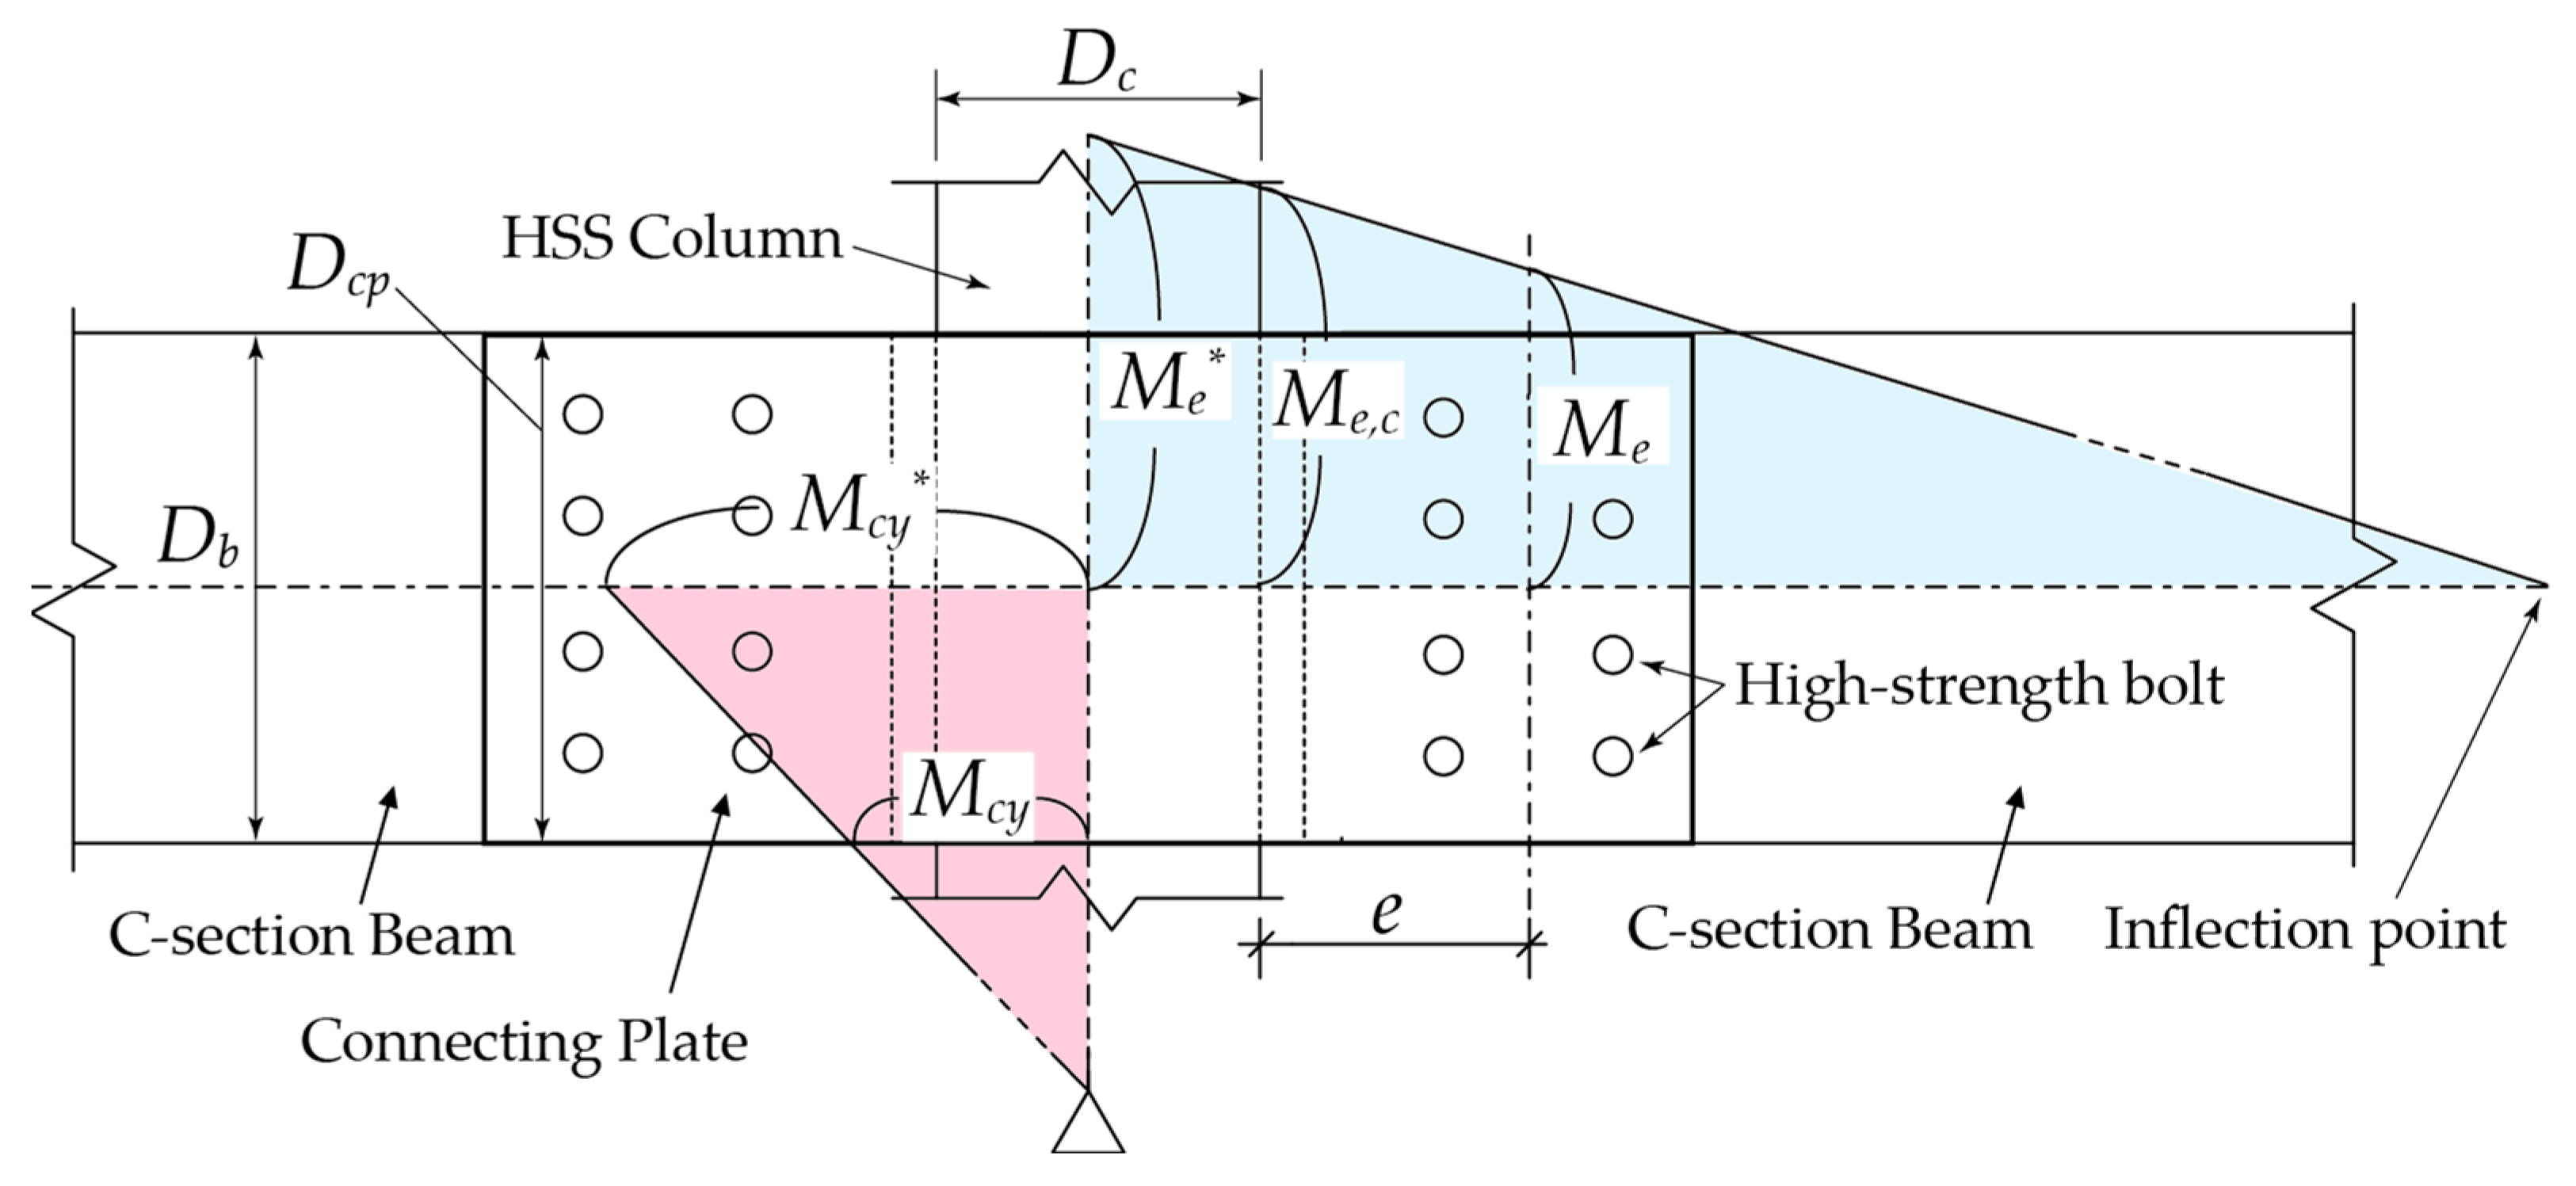
2.2. Proposed Connection Design Procedure

The following is a summary of the proposed design procedure based on the design strategy mentioned above.
  • Flexural strength required for the beam:
The expected moment, Me, required at the bolted connection will be computed from the seismic design procedure. Following the capacity design principle, the beam strength, Mby, must be equal to or greater than this value.
M b y M e
where Me is the expected moment required at the bolted connection, including the effects of bolt slippage and bolt bearing (see Figure 3), and Mby is the effective yield strength of the beam.
2.
Hierarchy criterion:
The beam-to-column connection must satisfy the strong column–weak beam philosophy.
M c y * M e *
where Σ M c y * is the sum of the projections of the nominal flexural strengths of the columns above and below the connection to the beam centreline with a reduction for the axial force in the column, and Σ M e * is the sum of projections of the expected moments at the bolted beam end joints to the column centreline (see Figure 3).
3.
Connecting plate thickness:
In order to determine the thickness of the connecting plate, tcp, the following requirements must be met.
t c p max 12 I b N D c p 3 , 6 N D c p 2 F y c p M c p
where Dcp is the depth of the connecting plate, Fycp is the specified minimum yield stress of the connecting plate, Ib is the moment of inertia of the beam (=NIb1), Ib1 is the moment of inertia of the individual channel section, Mcp is a larger value of the expected moment at the column face or the effective yield strength of the beam, and N is the number of C-section beams (i.e., 1 for a single beam and 2 for double beams).
4.
Weld strength of the connecting plate:
The connecting plates are attached to the column by welding. Due to the configuration limitation, fillet and flare welds will be used. The size of the weld must meet the following requirements.
M w e l d M e + Q b e + D c 2 N
where Mweld is the expected moment that needs to be resisted by welding, Qb is the shear force at the beam, e is the distance from the column face to the centre of the group of bolts, and Dc is the depth of the column (see Figure 3).
5.
Panel zone strength:
The column and the attached connecting plates will compose the panel zone of the beam-to-column connections. Following the capacity design principle, the following inequality must be satisfied in the panel zone to avoid yielding.
0.6 F y c p D c N t c p + 2 t c M e , c D c p 1.0
where tc is the column thickness, and Me,c is the expected moment at the column face.

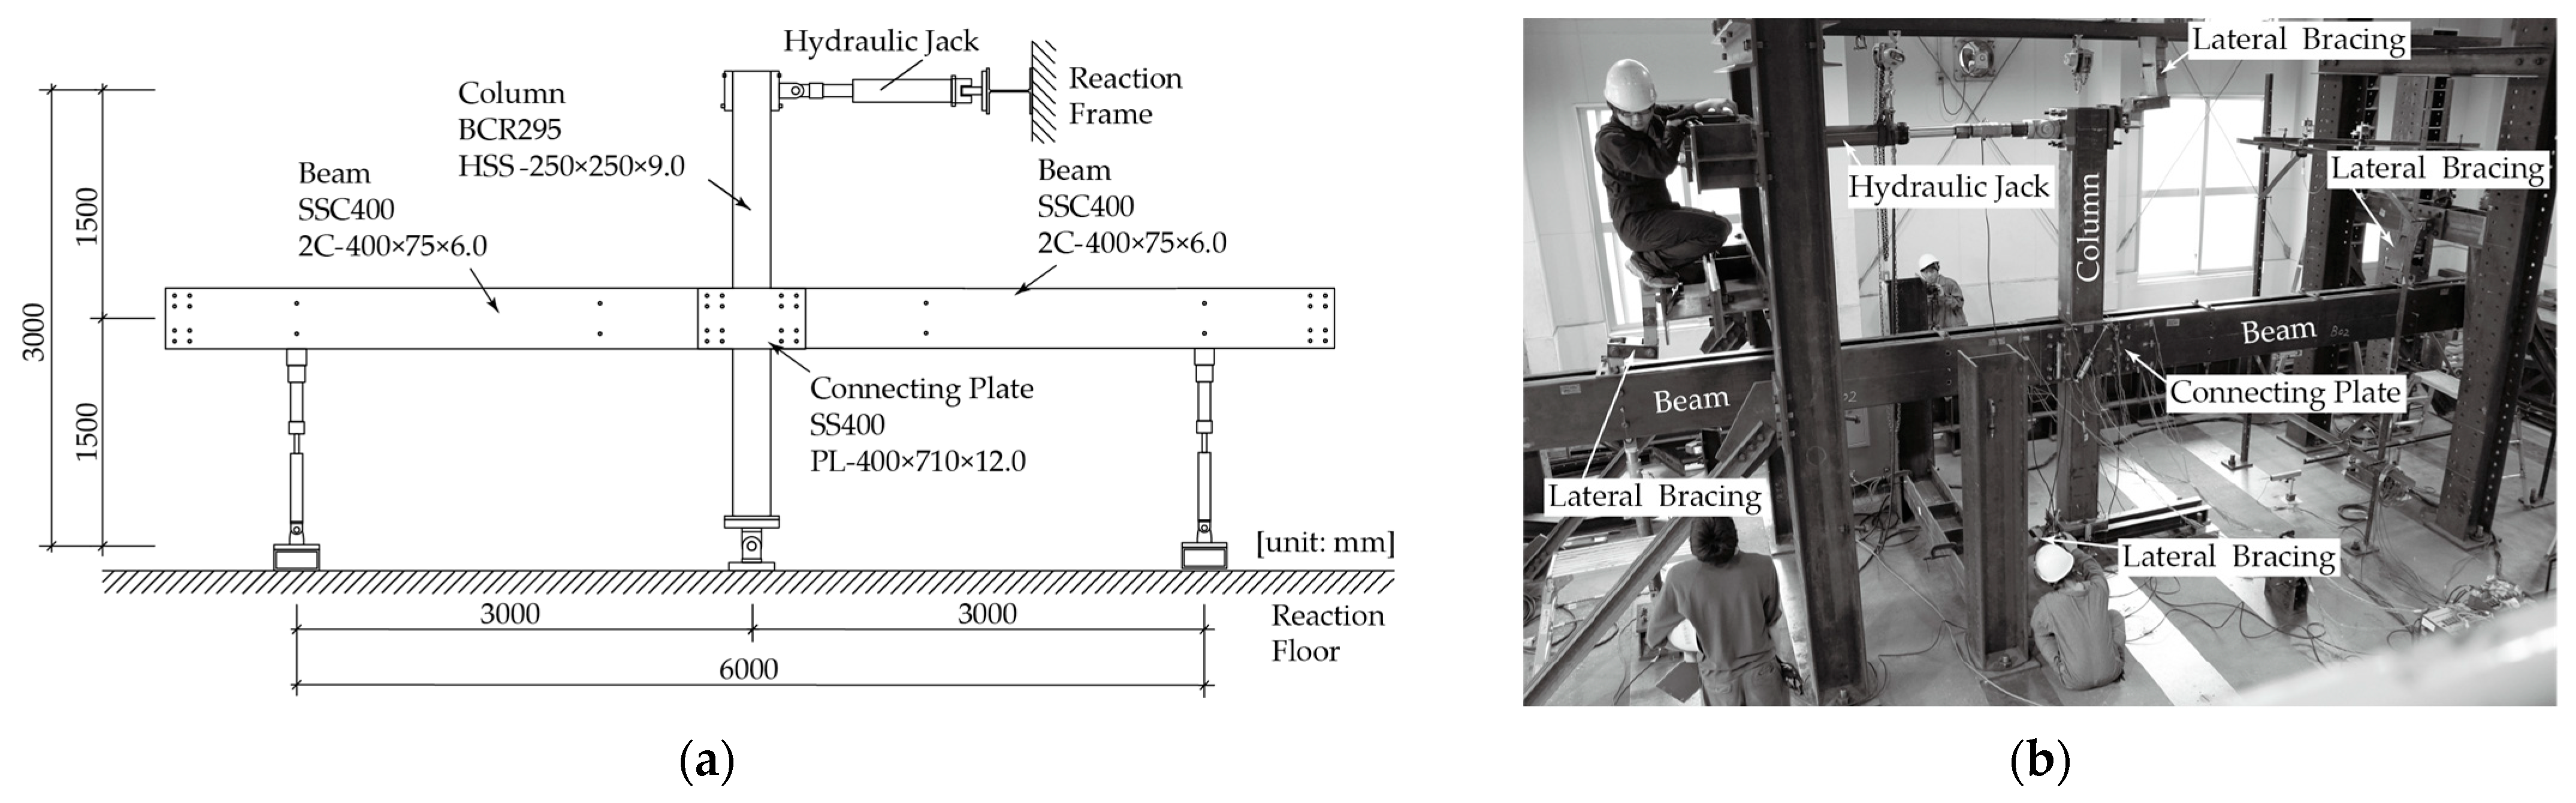
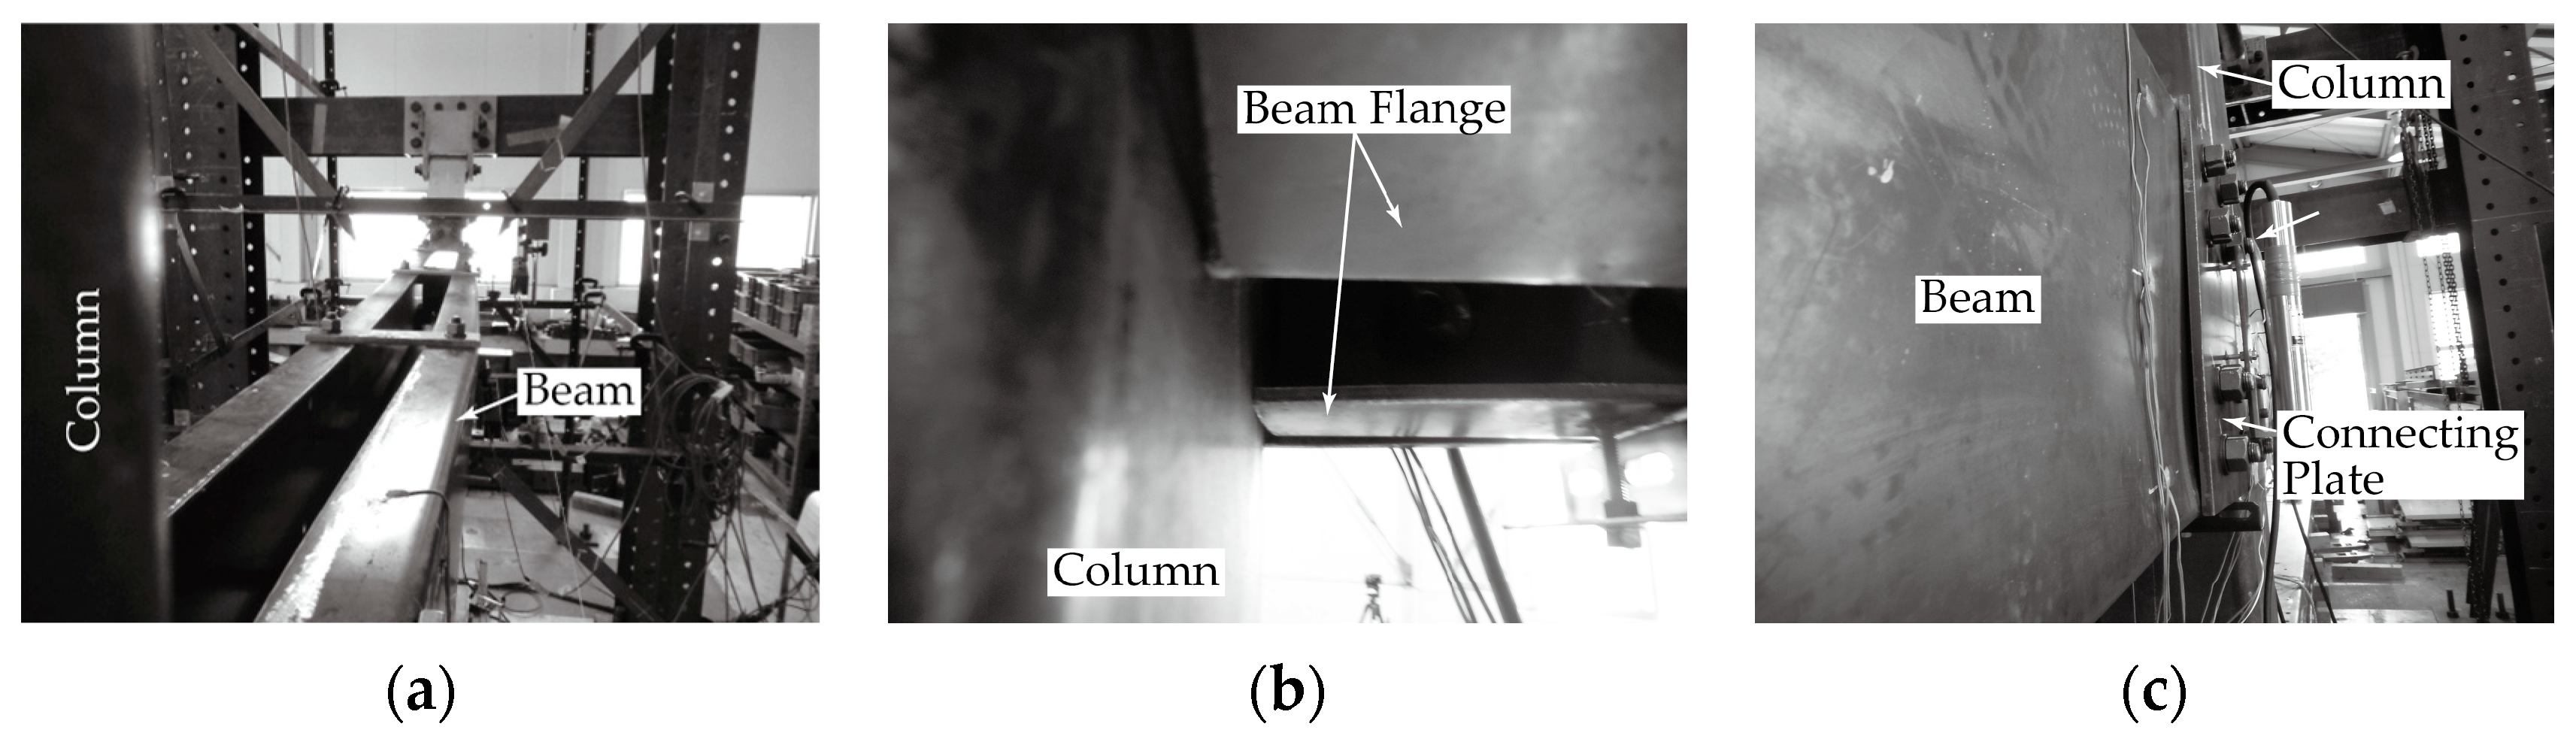
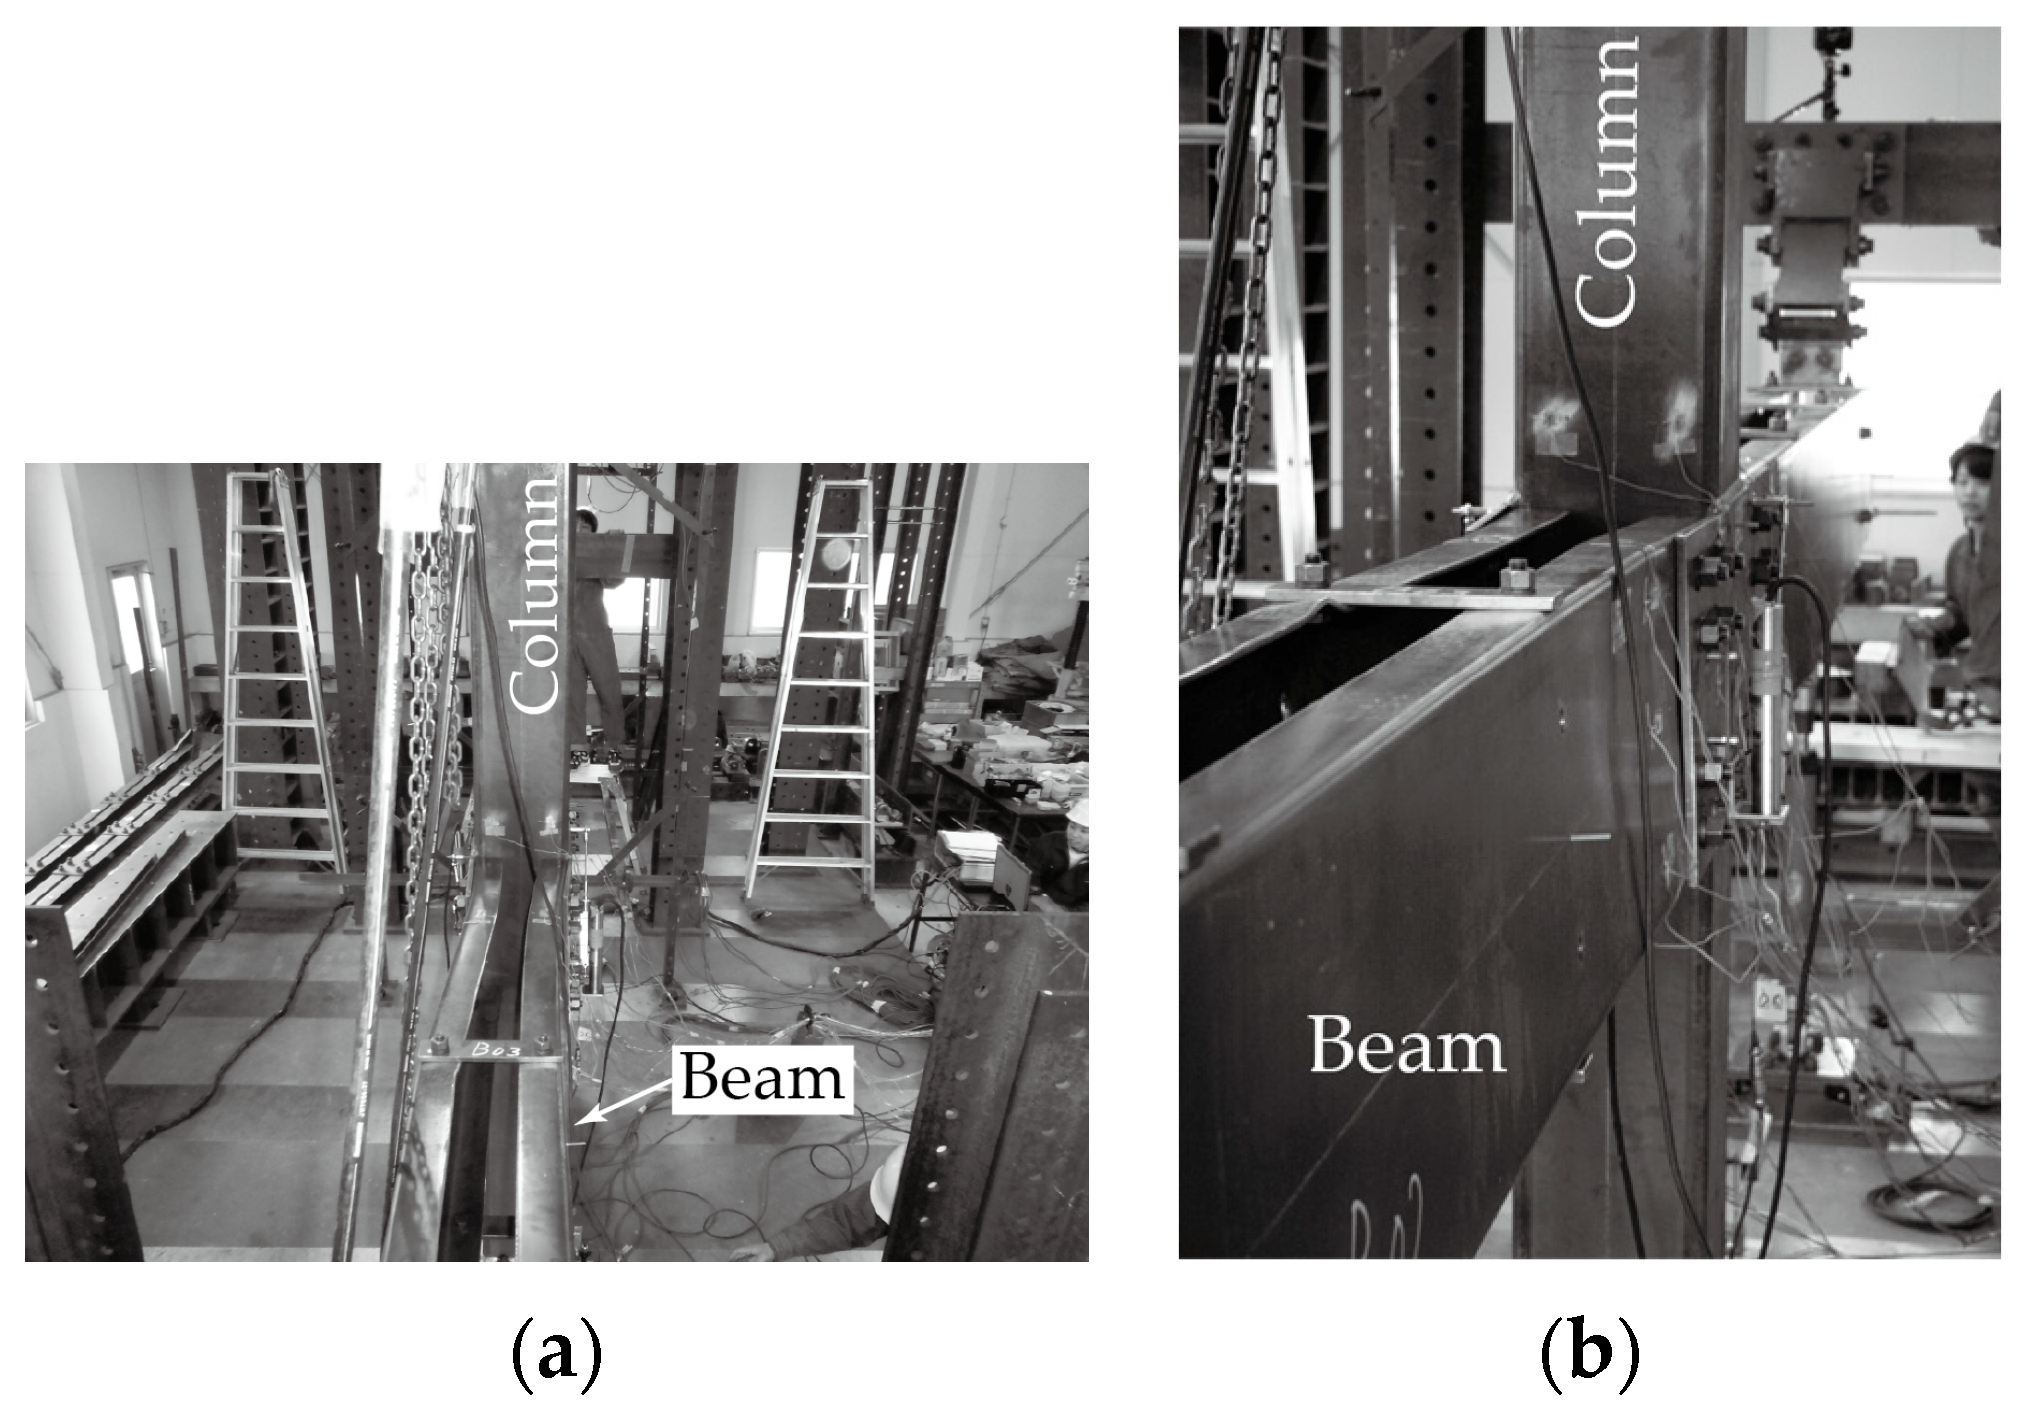
3. Full-Scale Testing Program

In this study, five full-scale specimens were prepared, and cyclic loading was conducted. The configuration of each specimen is summarised in Table 1. The table includes information on the bolt strength, joint type, surface class, and beam location. Each specimen’s section profile in the columns, beams, and plates was the same. The column was a square hollow structural section (HSS) with dimensions of 250 × 250 × 6 (mm), the built-up beam was 2C with dimensions of 400 × 75 × 6 (mm), and the connecting plate was PL with dimensions of 400 × 710 × 12 (mm). The column size determined the toe-to-toe separation in the built-up beam; it was decided that it would be 100 mm (=250 − 75 × 2) in this test. The test parameters were the joint type, surface class, and beam location. The AISI standard stipulates that the beam-to-column connections of CFS-SBMFs be “snug-tightened high-strength bolts” [1]. Following this requirement, high-strength bolts with snugly tightened conditions were used as a parameter. Two classes of high-strength bolts were available for use: ASTM A325 and A490 [15]. In this study, the bolt strength F10T class (fu = 1000 MPa), equivalent to A490, was selected as the default. Additionally, in practical applications, high-strength twist-off bolts (i.e., ASTM F1852 and F2280) are more widely used due to their easier installation. Once the tail of these bolts is twisted off, a specific amount of pre-tension is installed in the bolt [15]. Therefore, pre-tensioned conditions were also included as a parameter. The condition of the faying surface is also an essential aspect of the structural performance. AISI [1] also stipulates that “the faying surfaces of the beam and column in the bolted moment connection region are free of lubrication or debris”, which corresponds to a Class A surface (i.e., a mean slip coefficient μ equal to 0.3) [15]. Therefore, as the default, an unpainted clean mill scale steel surface was used. For specimens 1 to 4, the bolt strength F10T with a Class A surface was used. For the beam location, one-sided beam-to-column connections (OSs) were prepared to simulate an exterior column. Both-sided beam-to-column connections (BSs) were prepared to simulate an interior column. If a bolted connection has sufficient strength to lead to the beam yielding, unexpected behaviour will occur. To simulate this situation, the BS_02 specimen was recycled by changing the surface conditions and bolt class to create the BS_03 specimen. For the BS_03 specimen, a Class B surface (i.e., a mean slip coefficient μ equal to 0.5) [15] and F14T class bolts (fu = 1400 MPa) were used. The bolt strength F14T, which is manufactured for use in building structures, can only be found in the Japanese market. The mechanical properties of the members obtained in coupon tests are summarised in Table 2.
The experimental setups for the OS series and BS series specimens are shown in Figure 4 and Figure 5, respectively. The beam was assumed to have a length on each side of the column that was equal to half the bay width, with the inflection point in the middle. The bay width was assumed to be 6.0 m. Moreover, it was assumed that the middle of the storey height was the inflection point for the columns; the storey height was assumed to be 3.0 m. The beams were attached to the connecting plates using high-strength bolts with a diameter of 20 mm and standard bolt hole dimensions of d + 2 mm, as shown in Figure 6. Figure 6 also shows the bolted joint configuration. The bolted joint configuration shown in Figure 6 was selected for all specimens in this experiment. Sato and Uang [3] reported that the bolted joint configuration will impact the global response. However, the procedure for computing the expected moment at the bolted joint was also proposed in their article; therefore, a structural engineer can decide on the bolted joint configuration based on the forces that are demanded. Figure 7 shows the cyclic loading protocol applied to the column tip with a hydraulic jack controlled by the storey drift ratio.
It was assumed that the effective beam yield strength was the demand force in the bolted connection. The section profiles of the column and the connecting plate were determined based on the capacity design principles. Plastic analysis was conducted to understand the dominant mode when it reached the mechanisms. The possible mechanisms that need to be considered in this study are summarised in Figure 8. Bolt slippage is also included as a mechanism. Following the plastic analysis principles, all members were assumed to be rigid, except for the yielding component. The calculated results corresponding to each mechanism are summarised in Table 3.
It is evident that the bolted connections OS_01 to BS_02 will initially experience bolt slippage, and beam yielding may occur once the bolt bearing starts to happen in the bolted connection. Bolted connection BS_03 was designed to observe the unexpected failure mode. The bolt slippage strength is greater than the yield strength of the beam. Therefore, during the testing, slippage in the bolted connection will not be observed, and beam yielding may happen first, followed by instability of the beam member.
In the proposed structural system, cold-formed light-gauge channel members will be used for the beams in the same way as AISI. The built-up members can be advantageous in delaying lateral torsional buckling and increasing the bending strength. This advantage is due to the positioning of the channels that make double-symmetrical cross-sections. The configuration of the built-up beams used in this study is shown in Figure 9. The built-up members were of the batten type, and plates with a thickness of 12 mm were equally distributed at a distance of a = 1000 mm at the top and bottom flanges (a/Db = 2.5). The channels and battens are connected with F10T (fu = 1000 MPa) high-strength bolts with a diameter of 16 mm and a slip-critical joint type. As there were limited data for determining the details of the built-up beams, the configuration of the beam was chosen without any specific design method. A quantitative method is needed for the built-up member design to generalise this structural system. This is still under development, and further results are expected.
Friction and bearing are the resistances expected to be provided by bolted joints. Sato and Uang developed a procedure for computing these resistances [3]. However, when the beam and column start to come into contact, another force transfer path will appear, and another resistance that is not expected will be provided. As a result, this may cause an unexpected overloading of the beam. Beams with a relatively high width-to-thickness ratio were used in this system. Inelastic behaviour was not to be expected in the members, and it was designed essentially under elastic considerations. For this reason, an appropriate gap between the column surface and the beam end was needed to accommodate the target storey drift (see Figure 10). According to ASIC 341 [16] and FEMA 350 [17], the acceptance criterion for the inter-storey drift angle capacity for a steel special moment frame (SMF) was set to 0.04 rad (4.0%). Although AISC 341 discusses the range of strength deterioration, to be conservative, the criterion of 4.0% was used to guarantee that there was no contact between the column and the beam. The size of the gap could be determined from the geometric configuration of the beam-to-column connection and the acceptable storey drift ratio. Plastic analysis can be helpful for efficiently calculating the required gap. For the 4.0% storey drift ratio criterion, a 10 mm gap was made between the column surface and the beam end.

4. Test Results

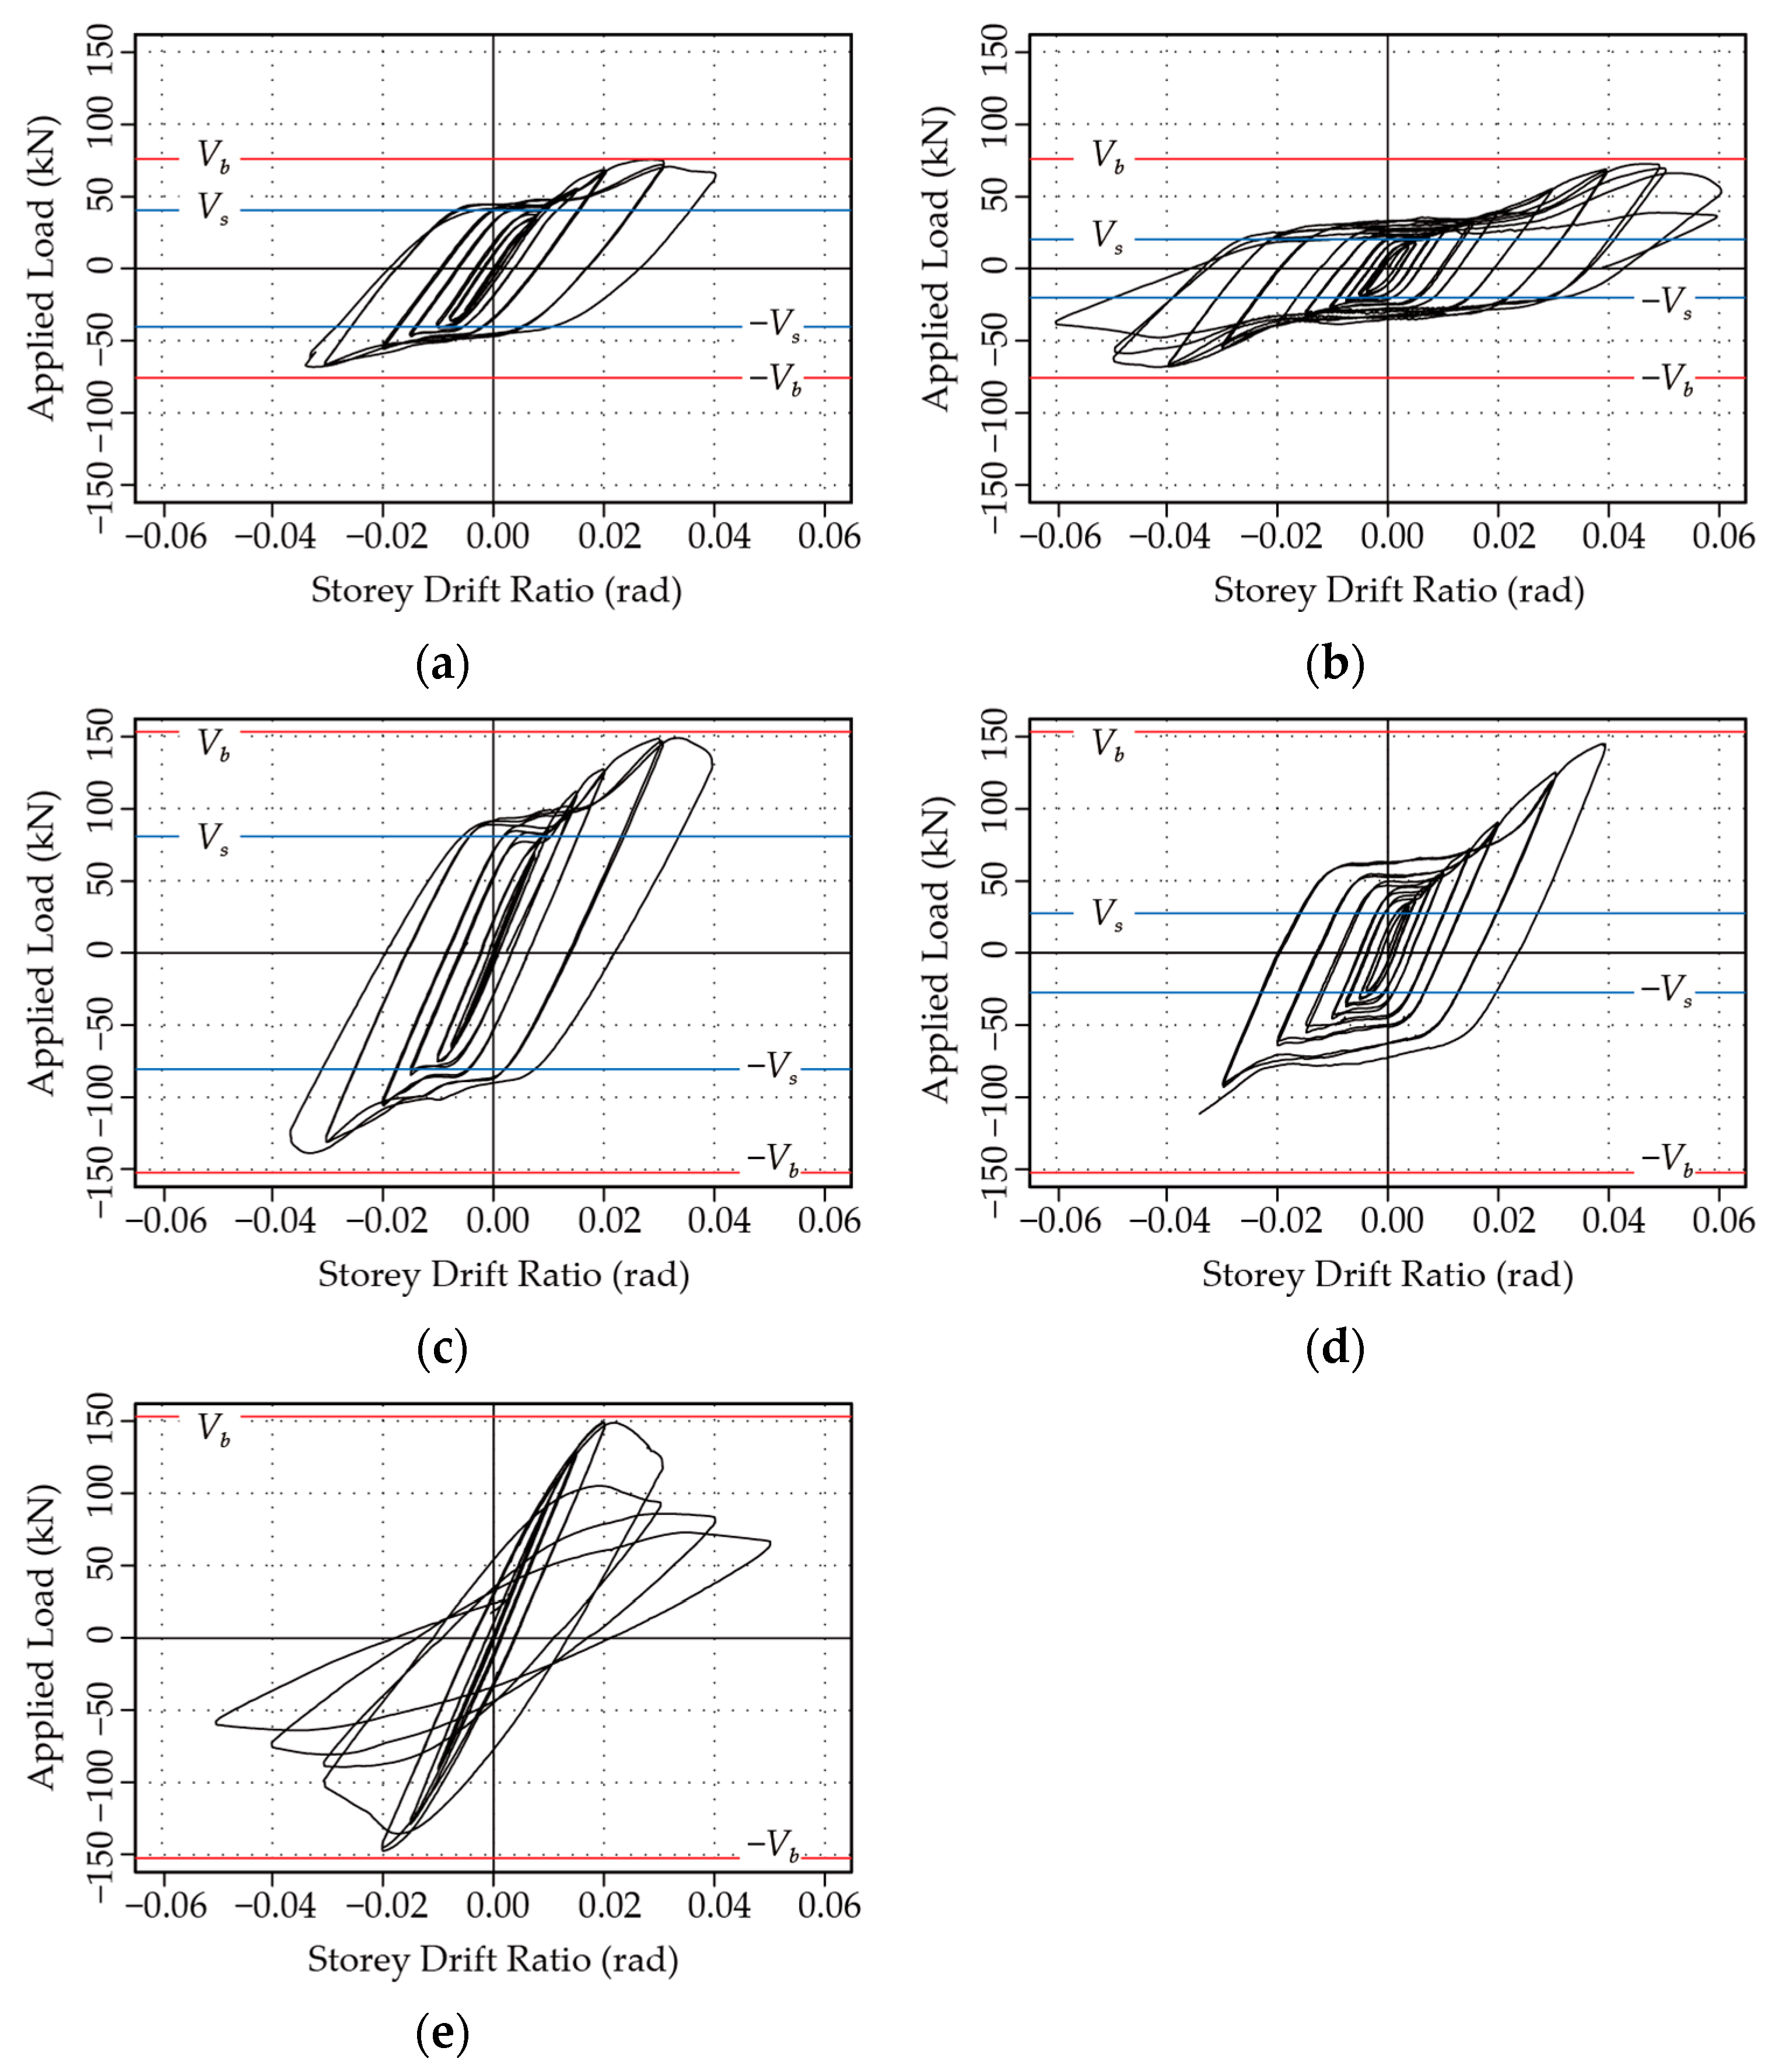
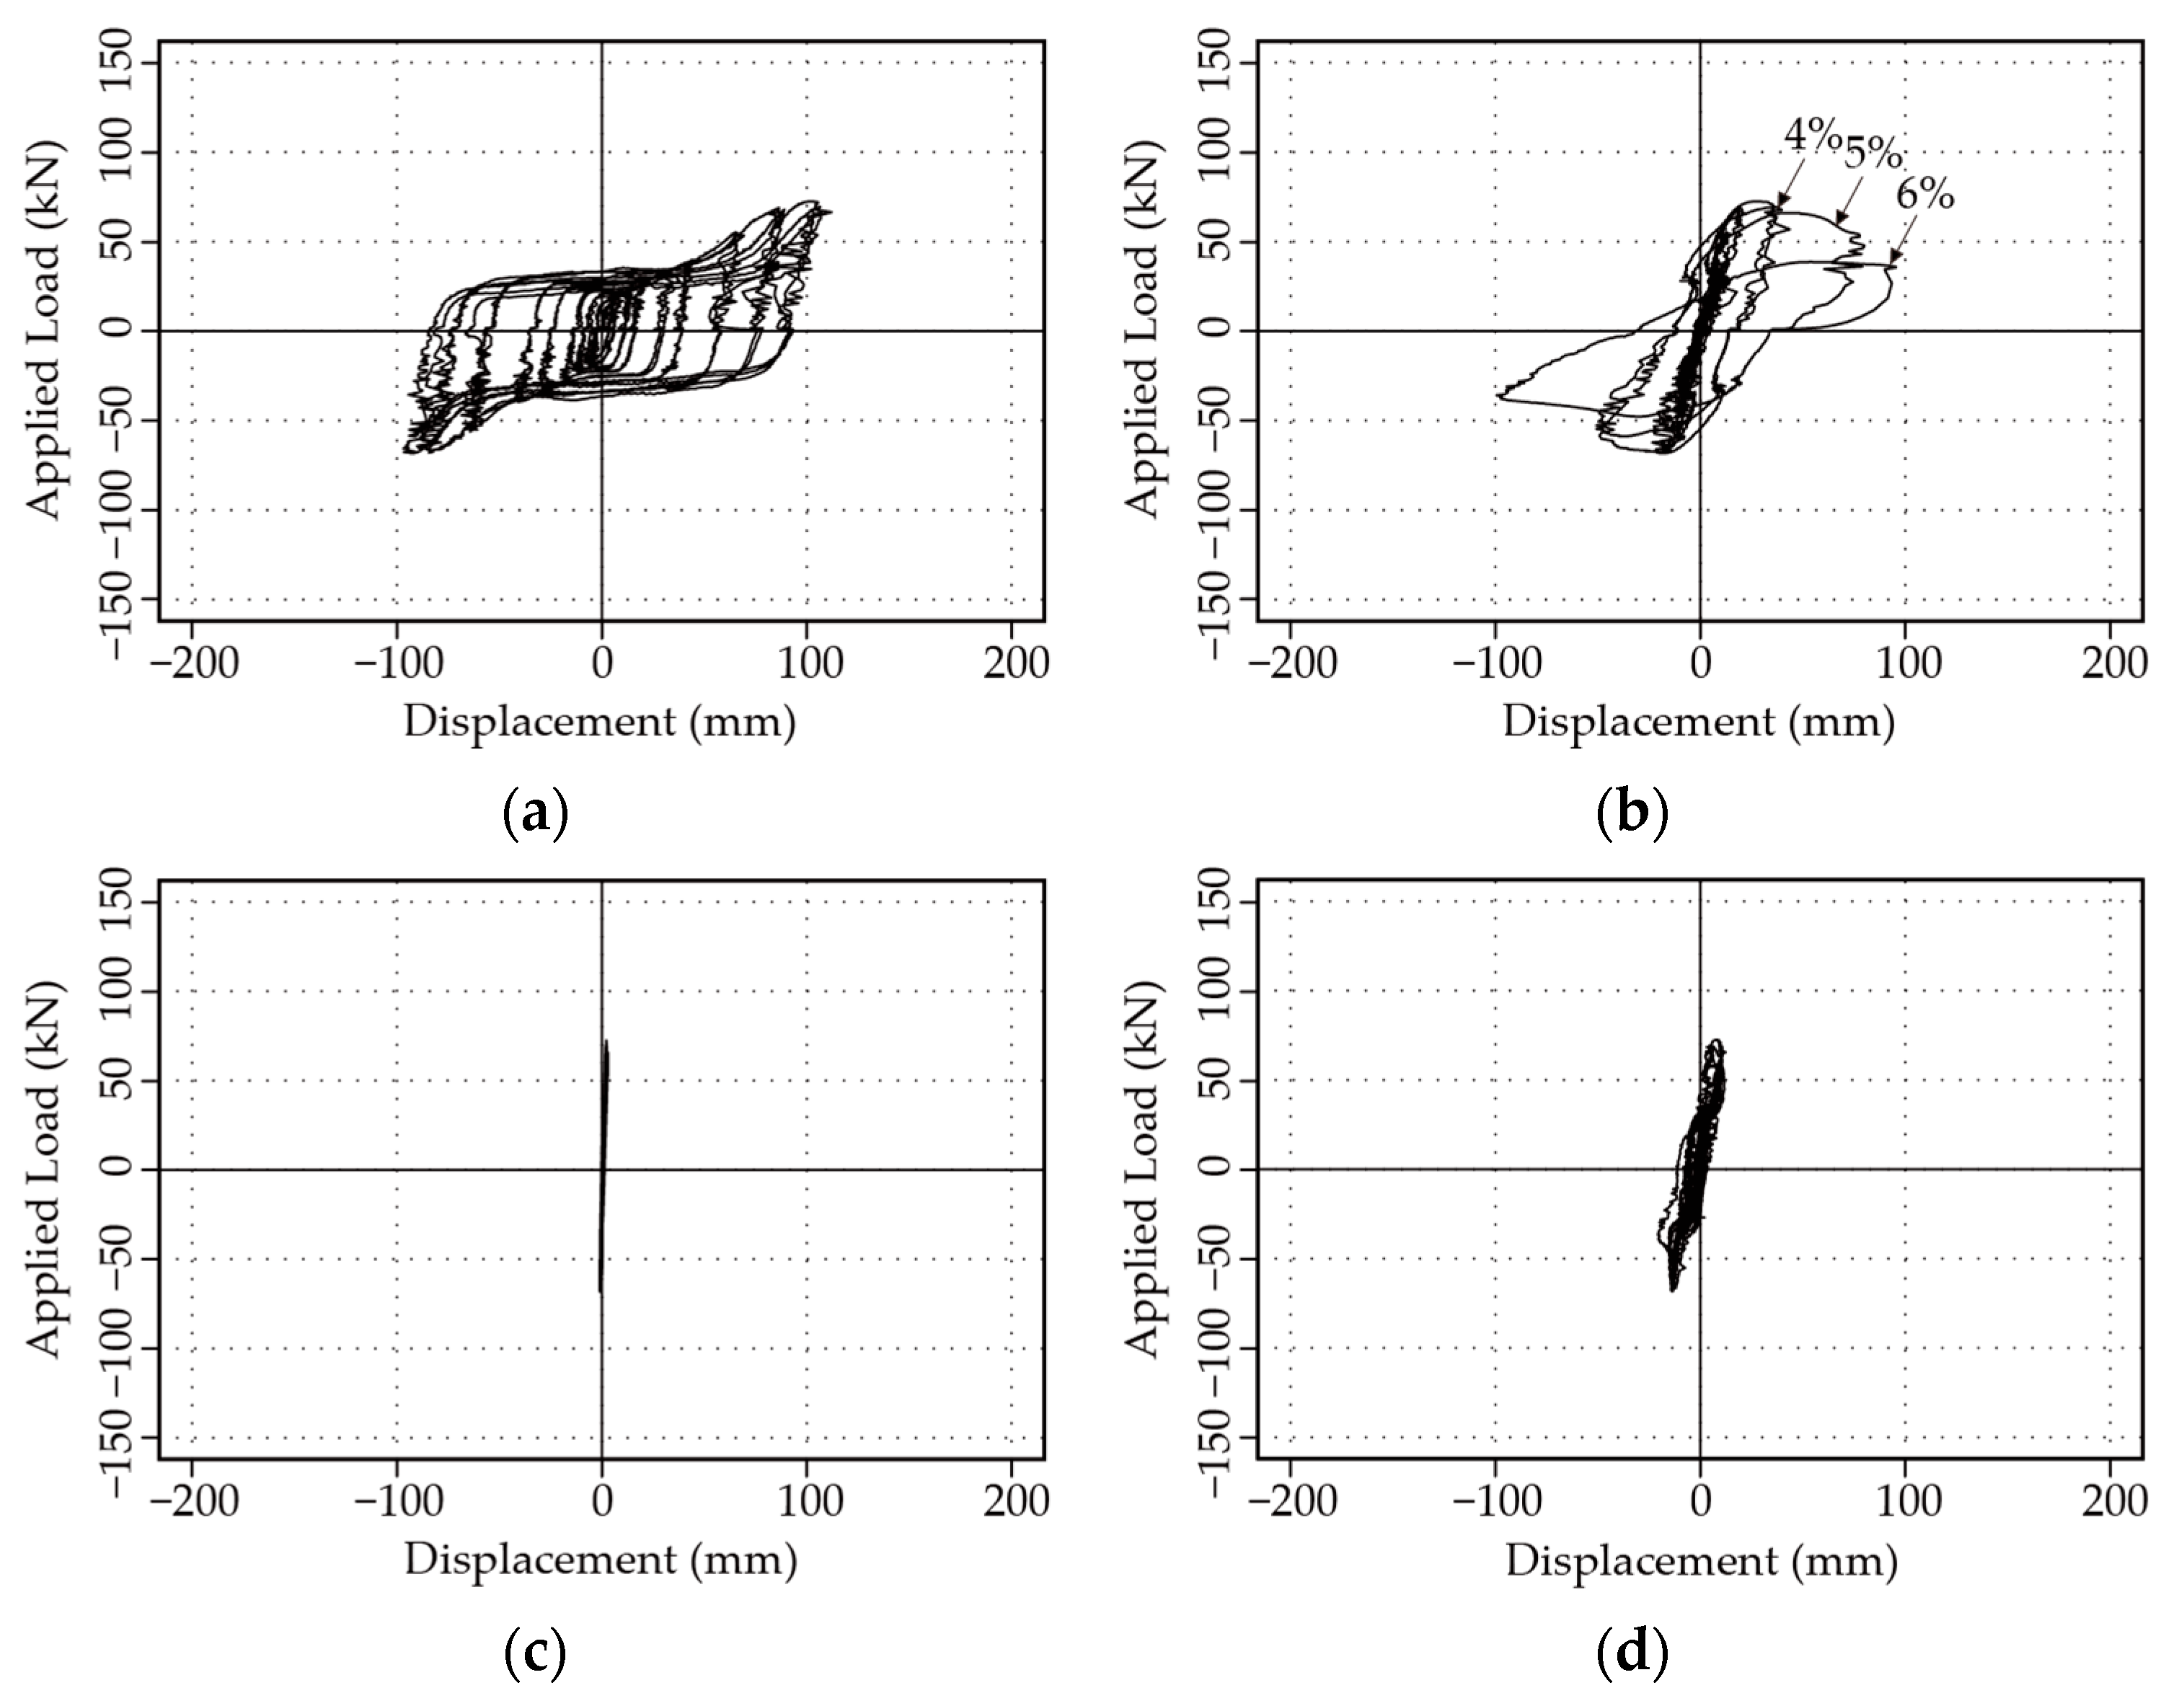
4.1. Global Responses

Figure 11 shows the applied load on the vertical axis and the storey drift ratio on the horizontal axis. The mechanism loads corresponding to bolt slippage (Vs) and beam yielding (Vb) are indicated for each specimen. The corresponding mechanism loads are summarised in Table 3. The specimens OS_01 to BS_02 were designed to carry out the proposed design procedure. Therefore, these specimens exhibited a plateau strength, and strength hardening occurred once the storey drift ratio became large (see Figure 11a–d). These response characteristics were similar to those in a previous study [4]. The plateau strength corresponded fairly well to the slip strength (VS), and the “pre-tensioned (PT)” joint type exhibited a greater plateau strength than that of the “snug-tightened (ST)” joint type. The cross-sectional profile of the beam was the same for all specimens. Therefore, the load at which the beam yielded (Vb) was a fixed value for the OS and BS specimens, as shown in Table 3. It is clear in each figure that strength deterioration began when the load reached the beam yield strength or when the storey drift ratio exceeded 4.0%. The PT joint-type specimens (OS-1 and BS-1) showed strength deterioration when the storey drift ratio was less than 4.0%. According to the design phase, the expected moment at the bolted connection was assumed to be equal to the effective beam yield strength. Therefore, lateral torsional buckling (LTB) occurred in the beam when the load reached this criterion. Additionally, the overstrength margin for the PT joint-type bolted connection was smaller than that for the ST joint type. Furthermore, the storey drift ratio that could be accommodated to avoid strength deterioration was also smaller for the PT joint type than for the ST joint type. The strength of the ST joint-type specimen (OS-2) was degraded when the storey drift ratio exceeded 4.0%. This was due to the LTB, and the contact between the column and the beam led to the beam being overloaded. Once the load reached the beam strength, LTB occurred at the beam, and out-of-plane deformation accumulated along with strength deterioration. From these observations, it can be concluded that the snugly tightened joint, as required by the AISI [1], showed an advantage in both its overstrength capacity and acceptable storey drift ratio.
Specimen BS_03, which had a bolt slippage strength greater than the beam yield strength, did not show a plateau strength (see Figure 11e). Once the load reached the beam yielding strength (Vb), strength deterioration started rapidly due to the beam’s LTB. According to the CFS-SBFM design concept, the beam and column must remain essentially elastic. Otherwise, drastic strength deterioration may occur due to instability in the member, leading to a lack of high system ductility.
In OS_01, LTB of the beam was observed at a storey drift ratio of 3.0% (see Figure 12a), where the applied load reached the beam yielding strength. At a storey drift ratio of 4.0%, the beam flange started to contact the column face (see Figure 12b), as the gap between the beam and column was designed to accommodate this storey drift ratio. After the beam contacted the column, the beam was overloaded, and local buckling (LB) of the beam web was observed (see Figure 12c). After observing LTB, LB, and strength deterioration, the loading was terminated.
In OS_02, a significant LTB of the beam was observed at a storey drift ratio of 5.0% (see Figure 13a). At a storey drift ratio of 6.0%, the accumulated lateral torsional deformation became large (see Figure 13b), and LB of the beam flange was simultaneously observed (see Figure 13c). Significant LB deformation was mainly due to the contact between the column and beam.
In BS_01, LTB of the beam occurred at a storey drift ratio of 4.0% (see Figure 14a), and LB of the web and flange was observed after the beam contacted the column face, which was similar to the situation with OS_01 (see Figure 14b).
To reuse for the test of specimen BS_03, specimen BS_02 was terminated before strength deterioration started, i.e., a storey drift ratio of 4.0%. The bolts of this specimen were snugly tightened; therefore, the load did not reach the beam yielding strength. Stable hysteresis without unexpected behaviour was observed.
In BS_03, it was designed to observe unexpected behaviour. As simulated, the beam started to yield first after a storey drift ratio of 2.0%. No slippage at the bolted connection was observed until the testing was terminated. After the load reached the yielding of the beam, lateral torsional deformation accumulated, and the strength continuously deteriorated (see Figure 15).
After the beam reached its capacity, LTB occurred, and significant strength deterioration was observed. When a frame follows the CFS-SBFM design concept, strength deterioration only occurs after the storey drift ratio exceeds 3.0%. This acceptable storey drift ratio was determined based on the slippage and bearing of the bolted joint. Additionally, greater ductility can be achieved if the joint type meets the design requirements specified in the AISI standard (i.e., snugly tightened). While using the PT joint type makes installation easier and faster, it may result in less overstrength capacity, which affects the ductility.

4.2. Components of Column Tip Displacement

The imposed storey drift at the loading point is composed of four components: beam deformation, column deformation, panel deformation, and slipping with bearing deformation of the bolt group. Based on the instrumentation used in the testing, the imposed storey drift could be decomposed into these four components. As an example, the displacement of each component and applied load for specimen OS_02 are shown in Figure 16. The major inelastic action was delivered from the slipping and bearing of the bolted connection (see Figure 16a). Although inelastic behaviour can be seen from the beam (see Figure 16b), this was because the deformation due to LTB of the beam occurred beyond a storey drift ratio of 4.0% (see Figure 13). A large out-of-plane deformation accumulated in the beam when the storey drift ratio reached 6.0% (see Figure 13b). As a result, the contribution from the beam to the total column tip displacement significantly increased. This increase in beam displacement was not due to the in-plane inelastic deformation; instead, it was delivered by the geometrical change in the beam due to out-of-plane deformation. Specimens OS_01 to BS_02, which reached the beam yielding strength, showed similar results.
Figure 17 summarises the displacement components at the column tip. The specimens where the dominant mechanism is bolt slippage (see Figure 17a–d) show that slippage and bearing deformation in the bolted connection were the major components. On the other hand, for specimen BS_03, the major component of the deformation was the beam, and the deformation due to the bolted connections was minor (see Figure 17e). As explained, BS_03 was the specimen designed not to cause bolt slippage. According to these results, bolted beam-to-column connections that followed the proposed design procedure showed the expected structural behaviours. Inelastic action was mainly contributed by the slippage and bearing action at the bolted connection, which absorbed the energy. The LTB observed in the beam during testing can be prevented when the maximum moment at the bolted connection in the ultimate limit state is equal to or less than the beam strength. Sato and Uang [3] proposed a formula that can calculate the maximum moment in the bolted connection; therefore, this failure mode can also be controlled.

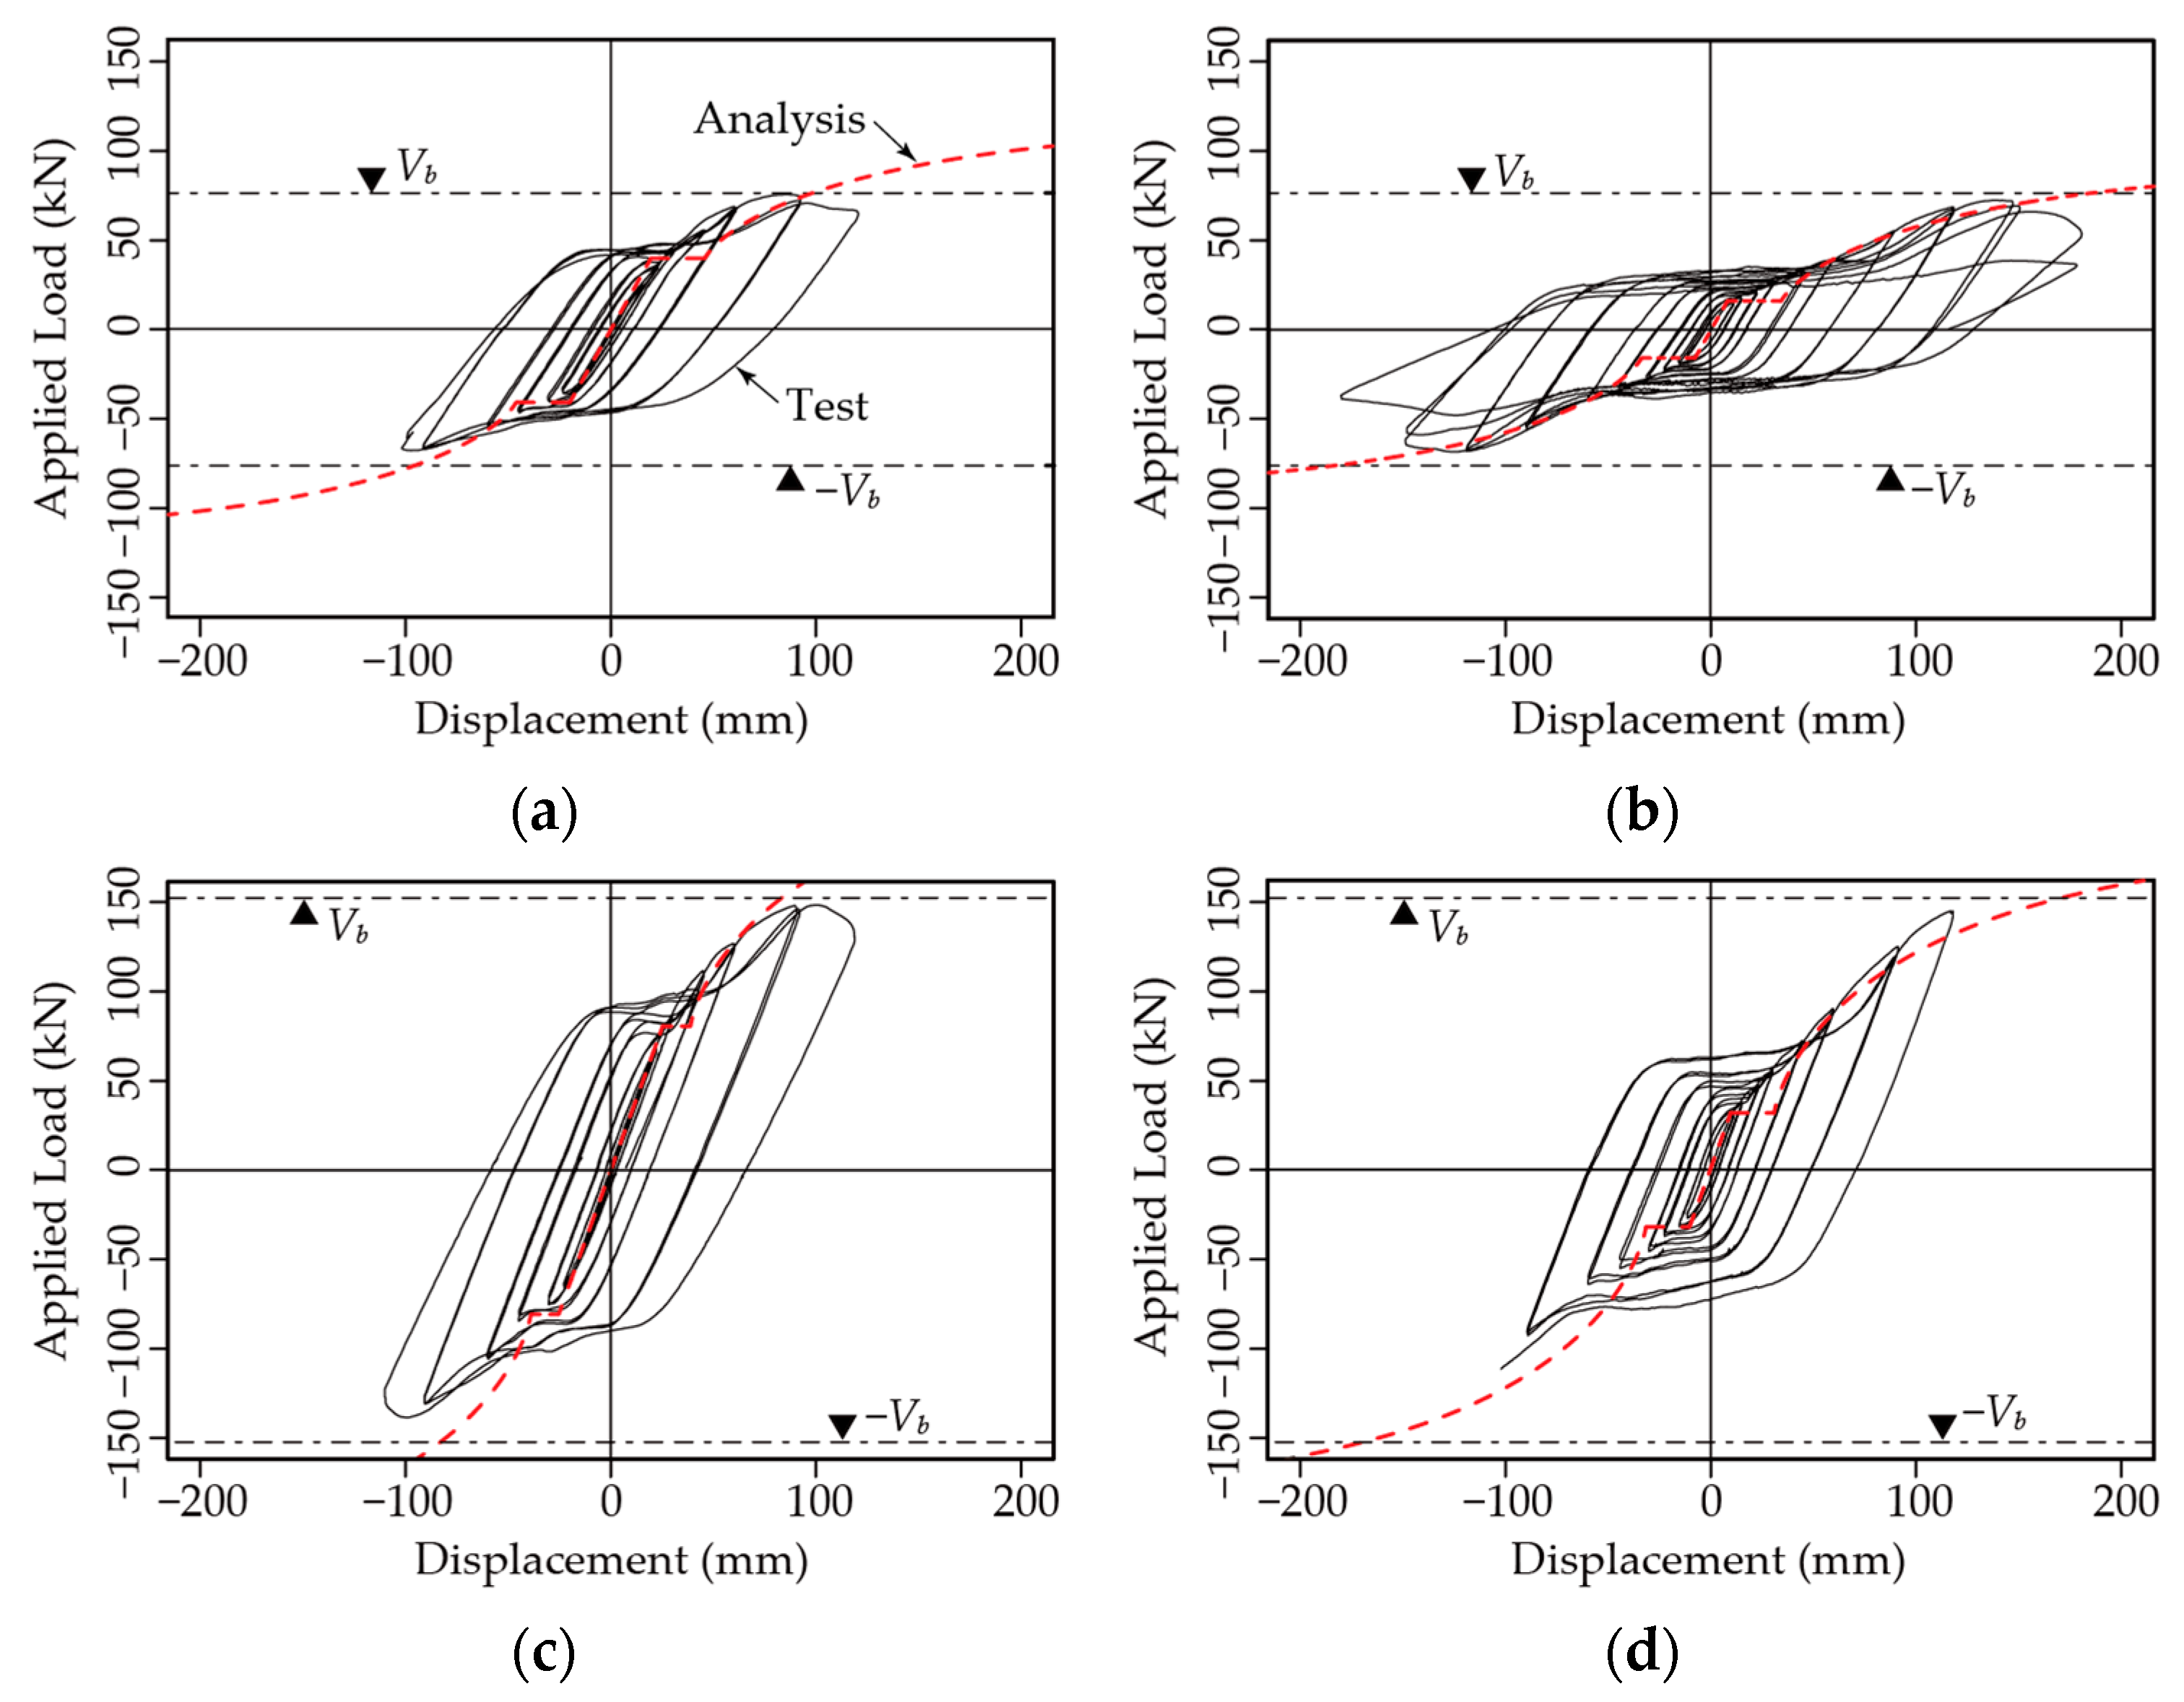
4.3. Mathematical Prediction of the Bolted Connections’ Behaviour

High-strength bolts transfer shear force through bearing in addition to slip resistance once the slip overcomes the hole oversize. In the previous study, a mathematical modelling procedure was proposed to simulate the behaviour of bolted connections [4]. The predicted behaviours of the tested sub-assemblages according to the proposed procedure are compared in Figure 18. The pre-load introduced in the bolts was assumed to be 184 kN for pre-tensioned bolts and 60 kN for snugly tightened bolts, respectively. These values used in the analysis were obtained through calibration testing. The computed results do not consider beam yielding and buckling; therefore, the predicted results are only valid until the applied load reaches the beam yielding strength. The predicted results accurately depict the cyclic behaviour. Furthermore, the cyclic response of the bolted connections was also able to provide predictions with reasonable accuracy, as proposed by Uang et al. [4].

5. Nonlinear Analysis

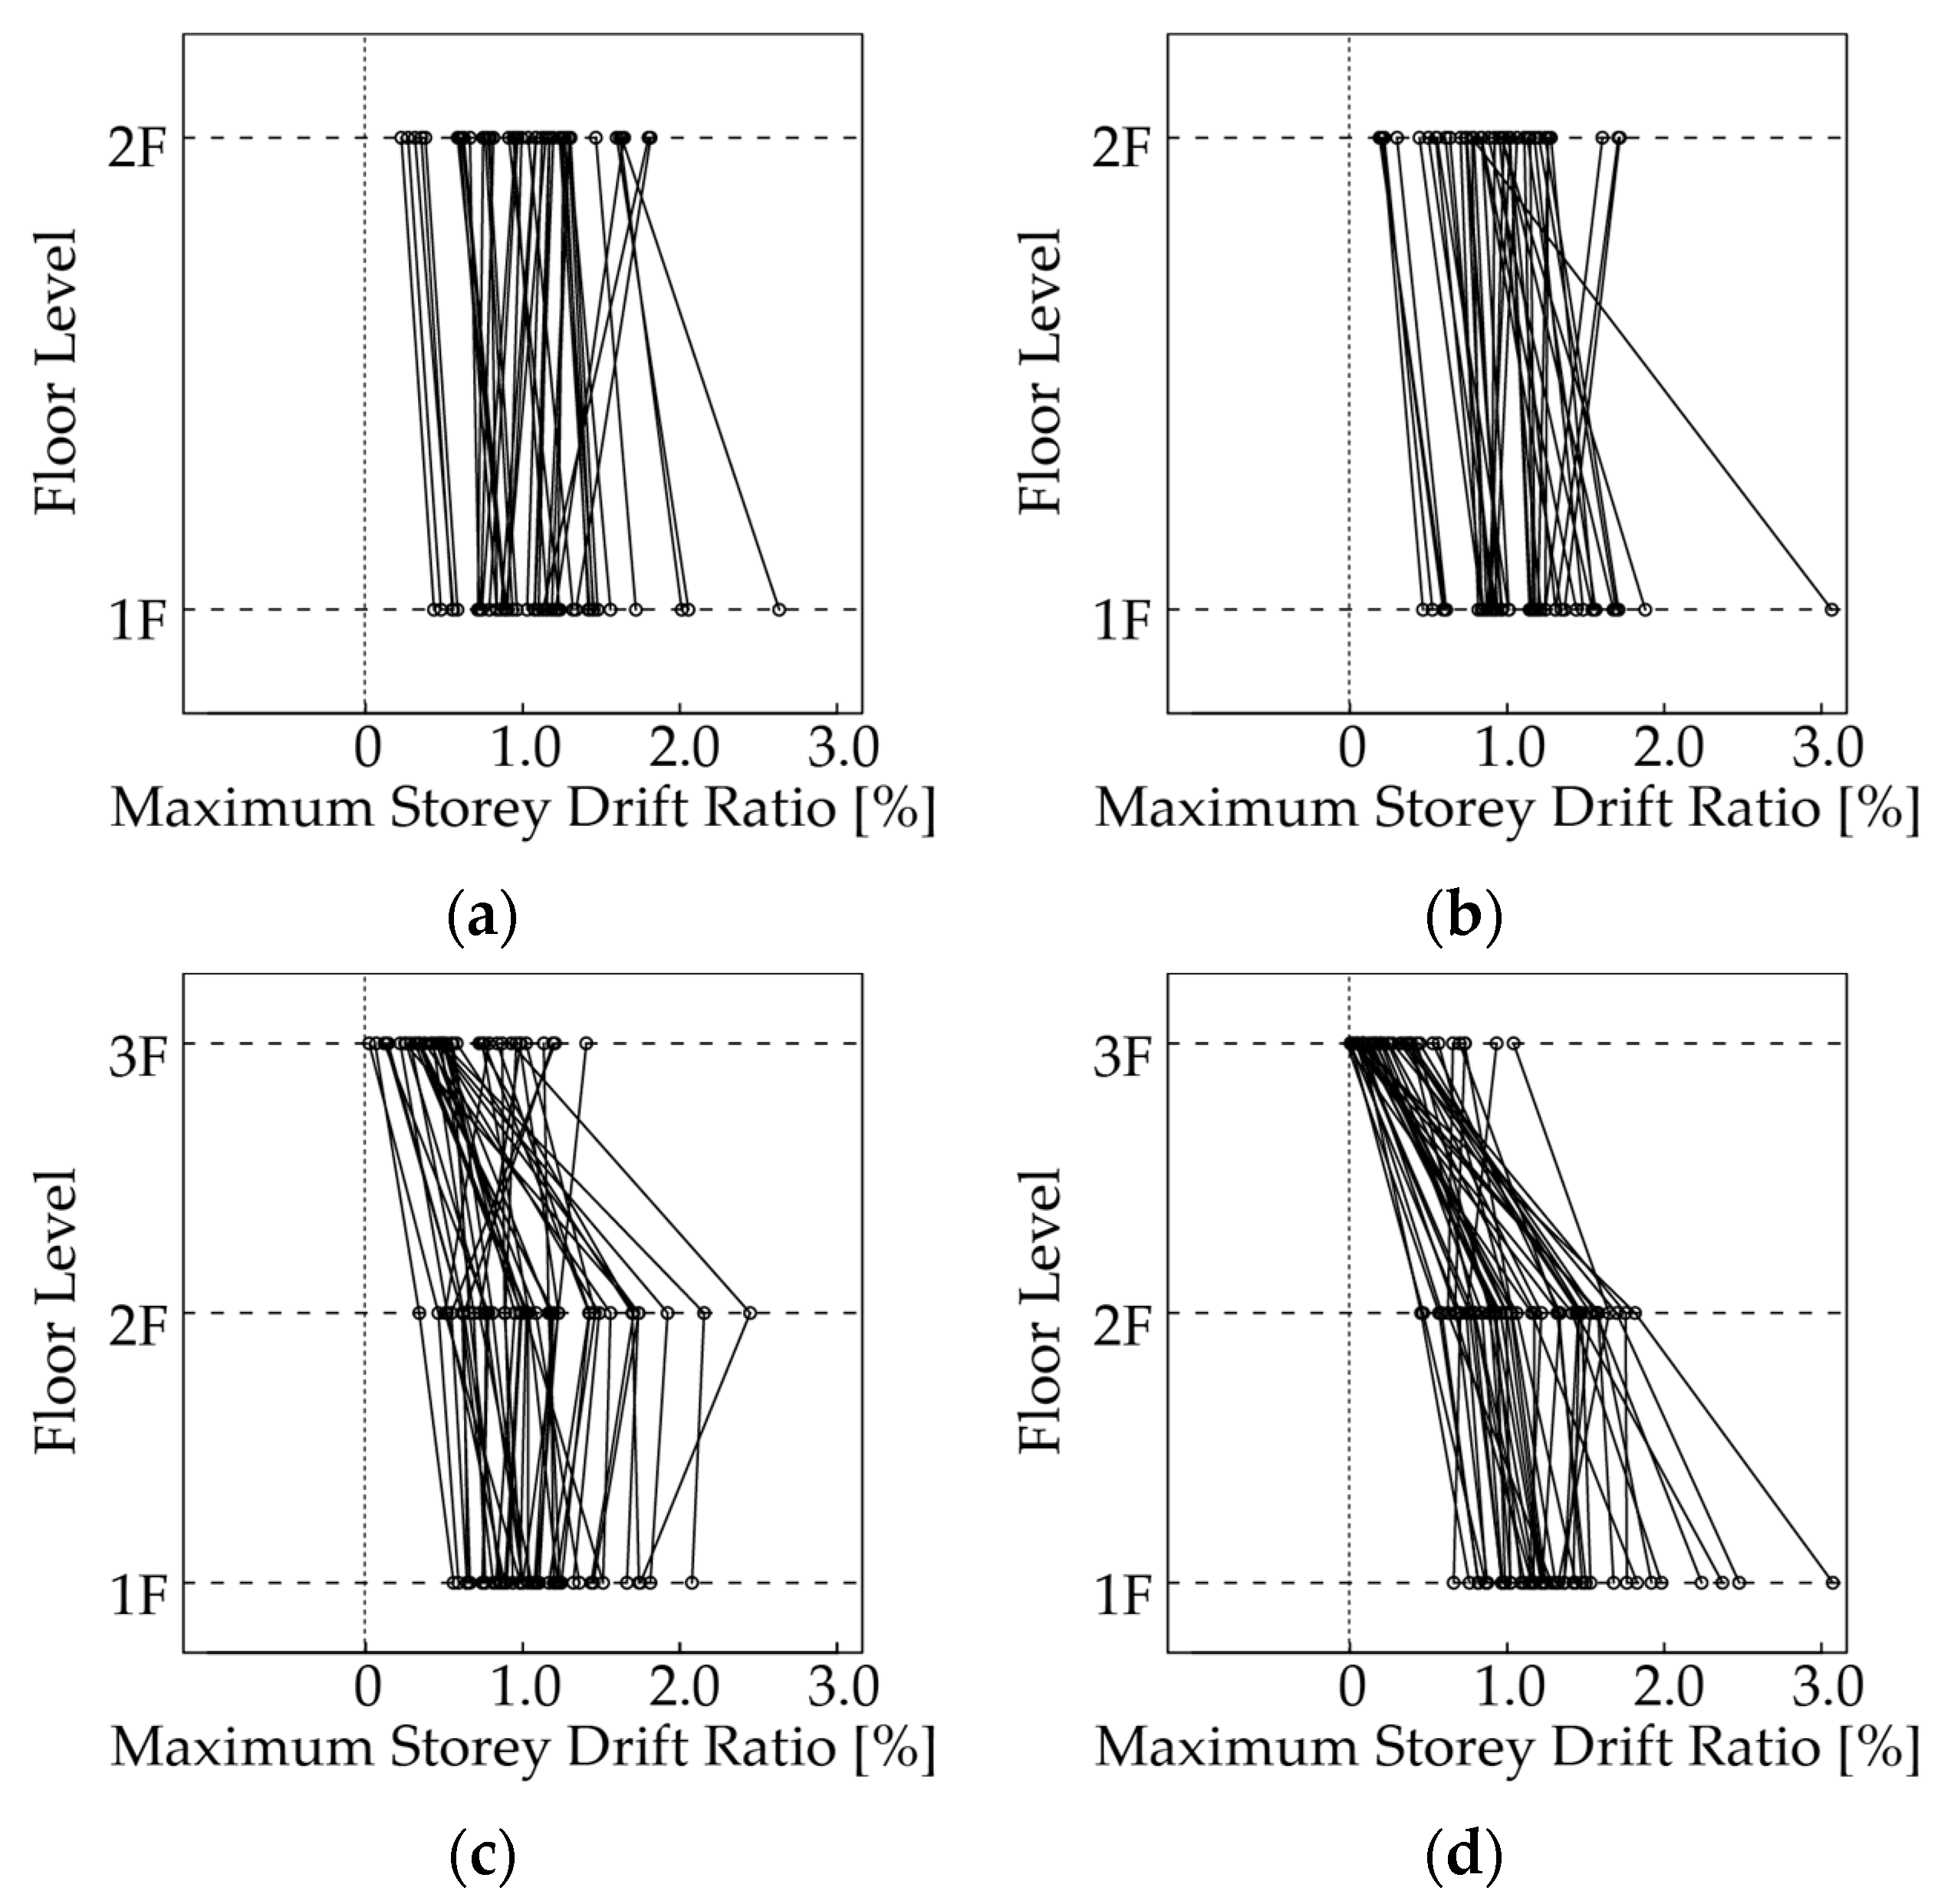
5.1. Archetype Frames

The proposed detailed connections are intended for use in middle-storey low-rise buildings. For the archetype frames, two-storey and three-storey buildings were designed. The configuration of the frame models is shown in Figure 19. The sizes of the members are summarised in Table 4. The steel properties assumed for the column and beam were fy = 317 MPa and fy = 379 MPa, respectively. Fibre elements were used for the beams and columns in the modelling, whereas bolted connections were modelled as rotational springs [5]. High-strength bolts (with a strength grade of 10.9) were assumed to be used with snugly tightened joints. To model the rotational spring characteristics, the bolt diameter was assumed to be 20 mm, and the bolt pre-load for the snugly tightened condition was assumed to be equal to 60.0 kN (see Section 4.3). The layout of the bolts at the connections was selected from the tables in the study by Sato and Uang [3]. The archetype beam-to-column connections followed the design procedure proposed in Section 2; therefore, inelastic behaviour was not expected to happen in the connecting plate, and it was eliminated in the modelling. The mass was lumped at the intersection of the beam and column, corresponding to the tributary area of the floor. Due to the limitations of the connection configuration, the perimeter frame system commonly used in EU and US practices was assumed. The weights used in the preliminary design were assumed to be 4.5 kN/m2 and 3.6 kN/m2 for regular floors and roofs, respectively. The global mechanism [18] was the target limit state; the beams used at the roof level were smaller than those at the regular floor level. The roof beam strength was assumed to be about 0.8 times that of the regular beams in the preliminary design. The member selection was conducted via trial and error until the global mechanism was ensured. The equivalent lateral force procedure from ASCE 7 [2] was used to design the frames. The seismic design factors (SDFs) are summarised in Table 5. These values were the same as those of “steel special moment frames”. An open-source program, “OpenSees”, was utilised to conduct the numerical simulations [19].

5.2. Pushover Analysis and Dynamic Analysis

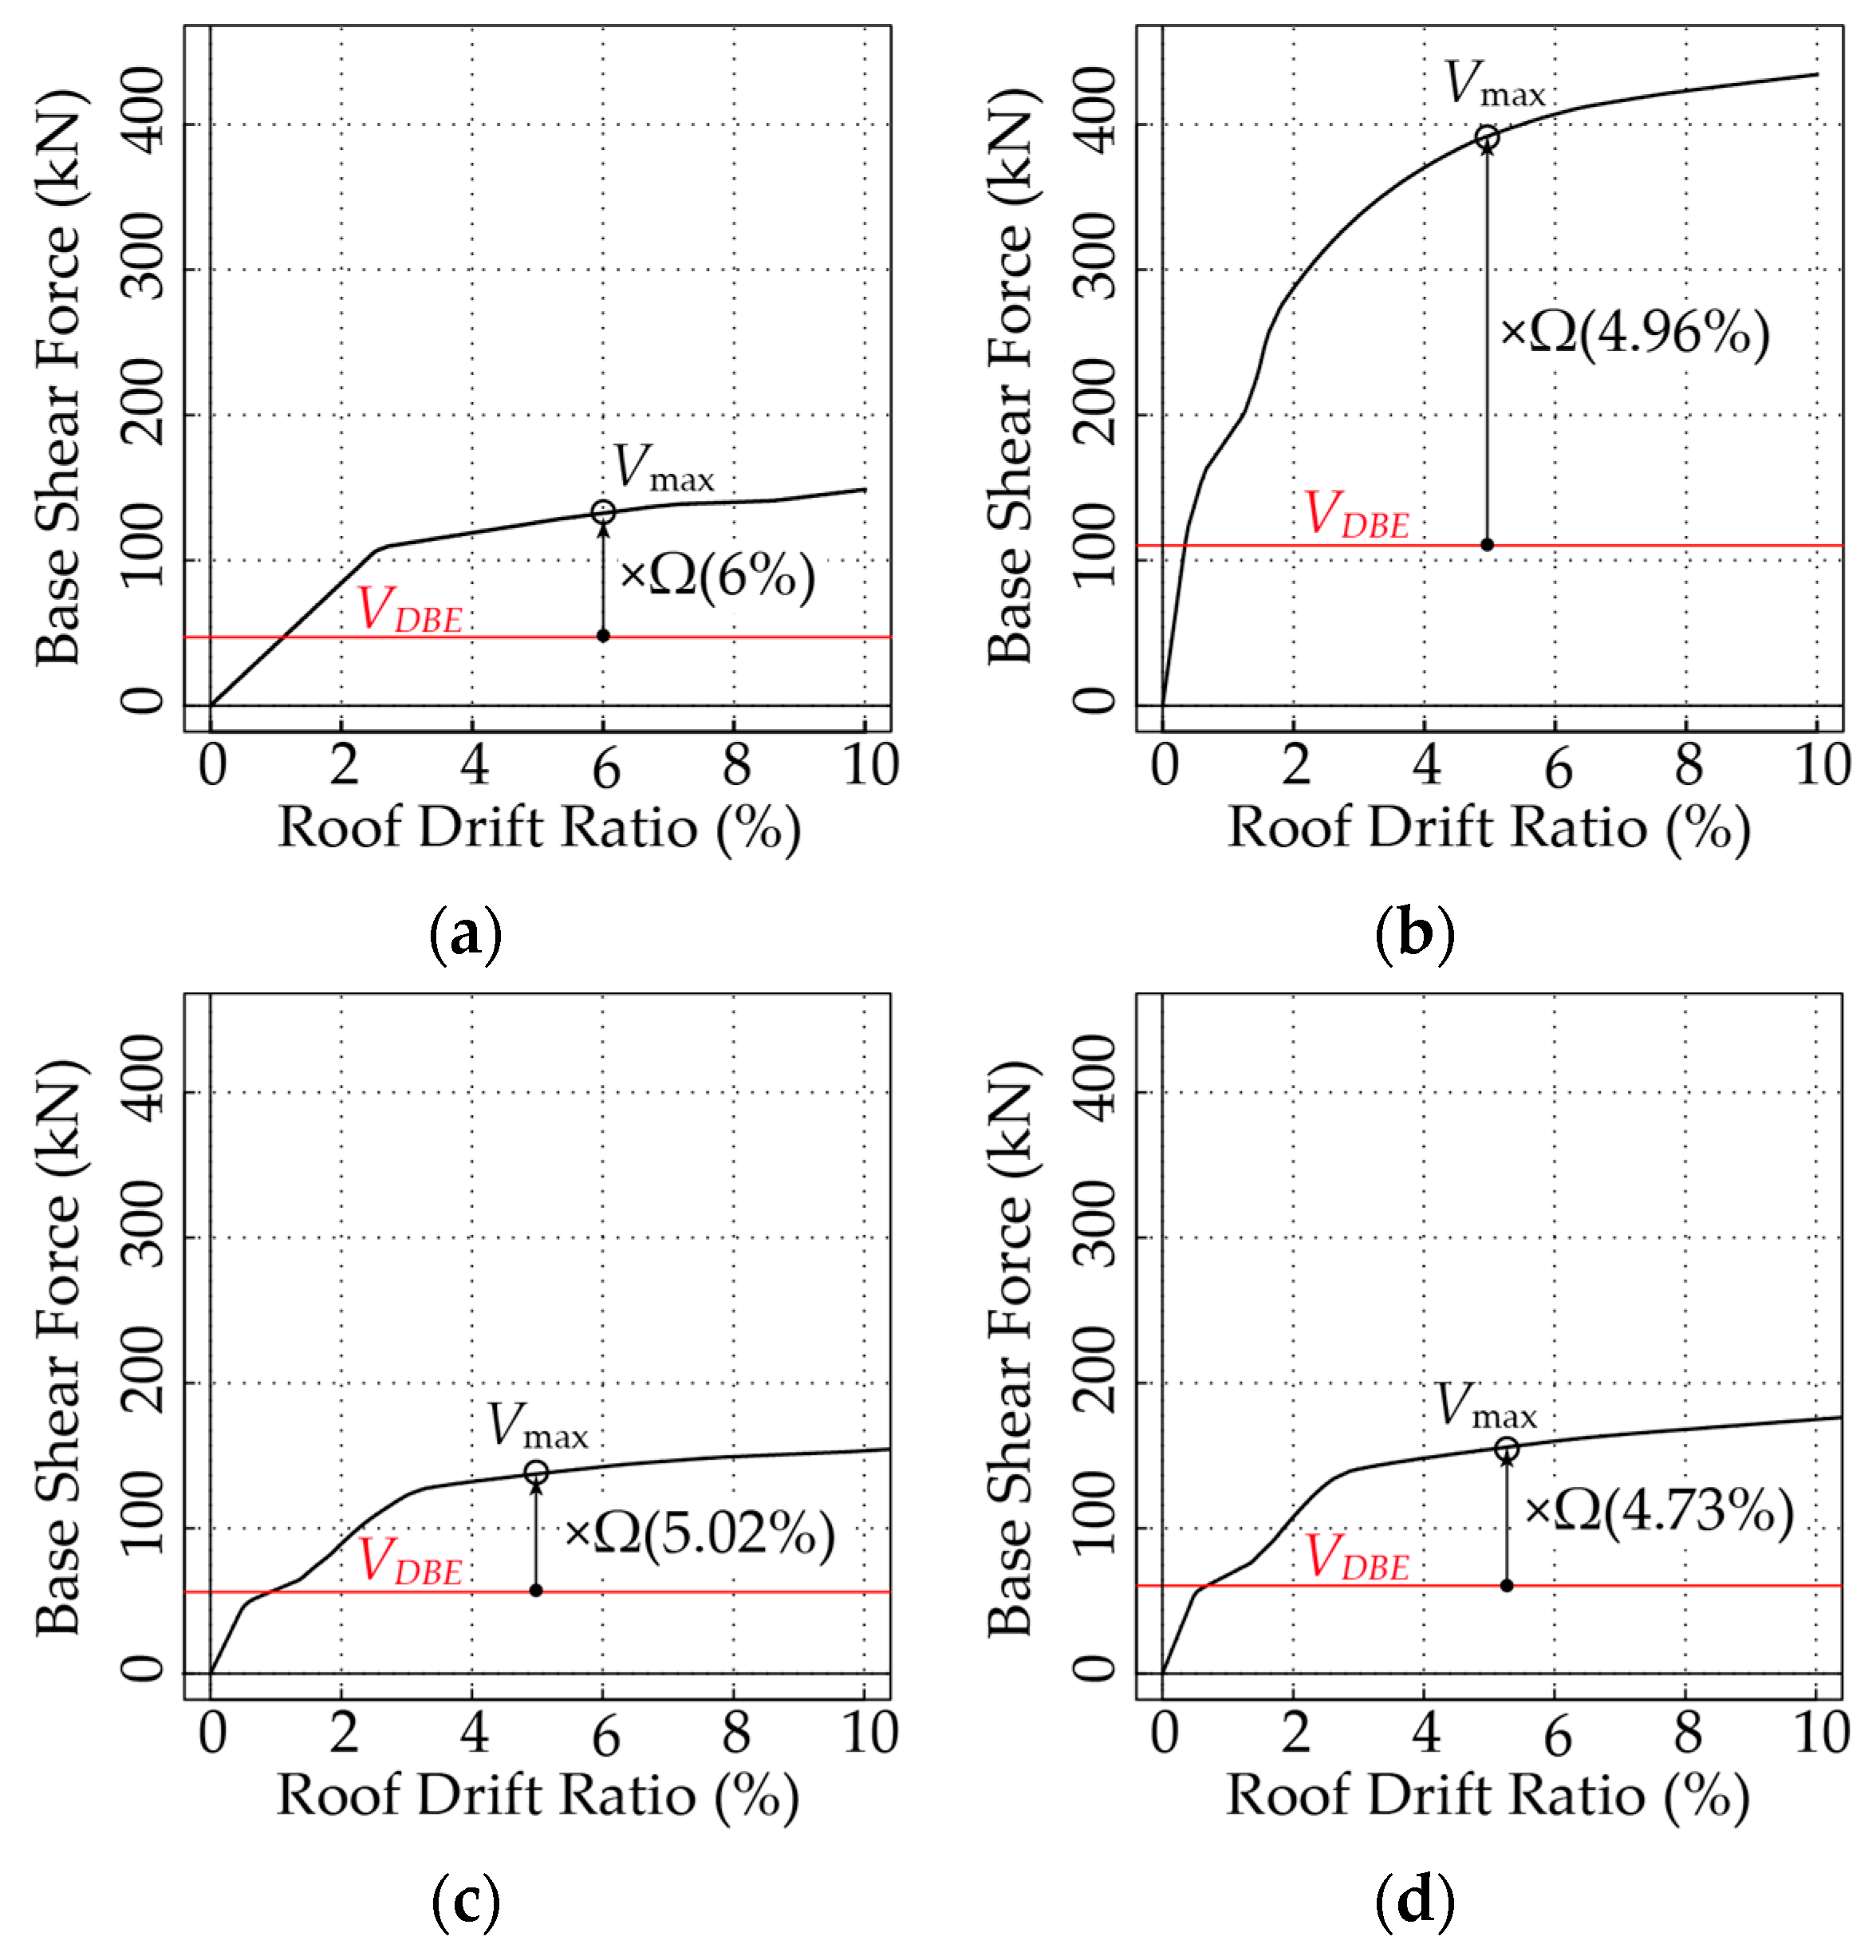
5.2.1. Pushover Analysis

Pushover analysis was conducted to determine the system overstrength factor. The lateral force distribution applied to the archetype frames followed the equivalent lateral force stipulated in ASCE 7 [2]. Figure 20 shows the relationship between the base shear force and the roof drift ratio. As seen in the figures, deviation from the elastic range, i.e., system yielding, corresponded to the design base earthquake (DBE) level VDBE. Inelastic behaviour in this archetype frame happened due to bolt slippage at the bolted joints. Unexpected slippage did not occur when the frames were designed according to the proposed design procedure. Table 6 summarises the design base share (DBE level) when the response modification coefficient was R = 8.0; the maximum base share Vmax is also shown. Vmax was determined when a pseudo-plastic hinge (equal to the yield strength of the connected beam) appeared in the rotational springs on the specific floor. The maximum base share Vmax was defined as a conservative assumption; however, the beams and columns needed to be kept essentially elastic in the proposed framing system.
The system overstrength factor, Ω, for each archetype model was computed with the following formula:
Ω = V max / V DBE
As summarised in Table 6, the system overstrength factor, Ω, ranged from 2.45 to 3.55, with an average of 2.84. This value was slightly smaller than the assumed design value of 3.0. Moreover, it can be recognised that the conservative mechanism was only reached when the roof drift ratio went beyond 4.0%. From these results, it can be concluded that the design system overstrength factor of Ω0 = 3.0 was an appropriate value.

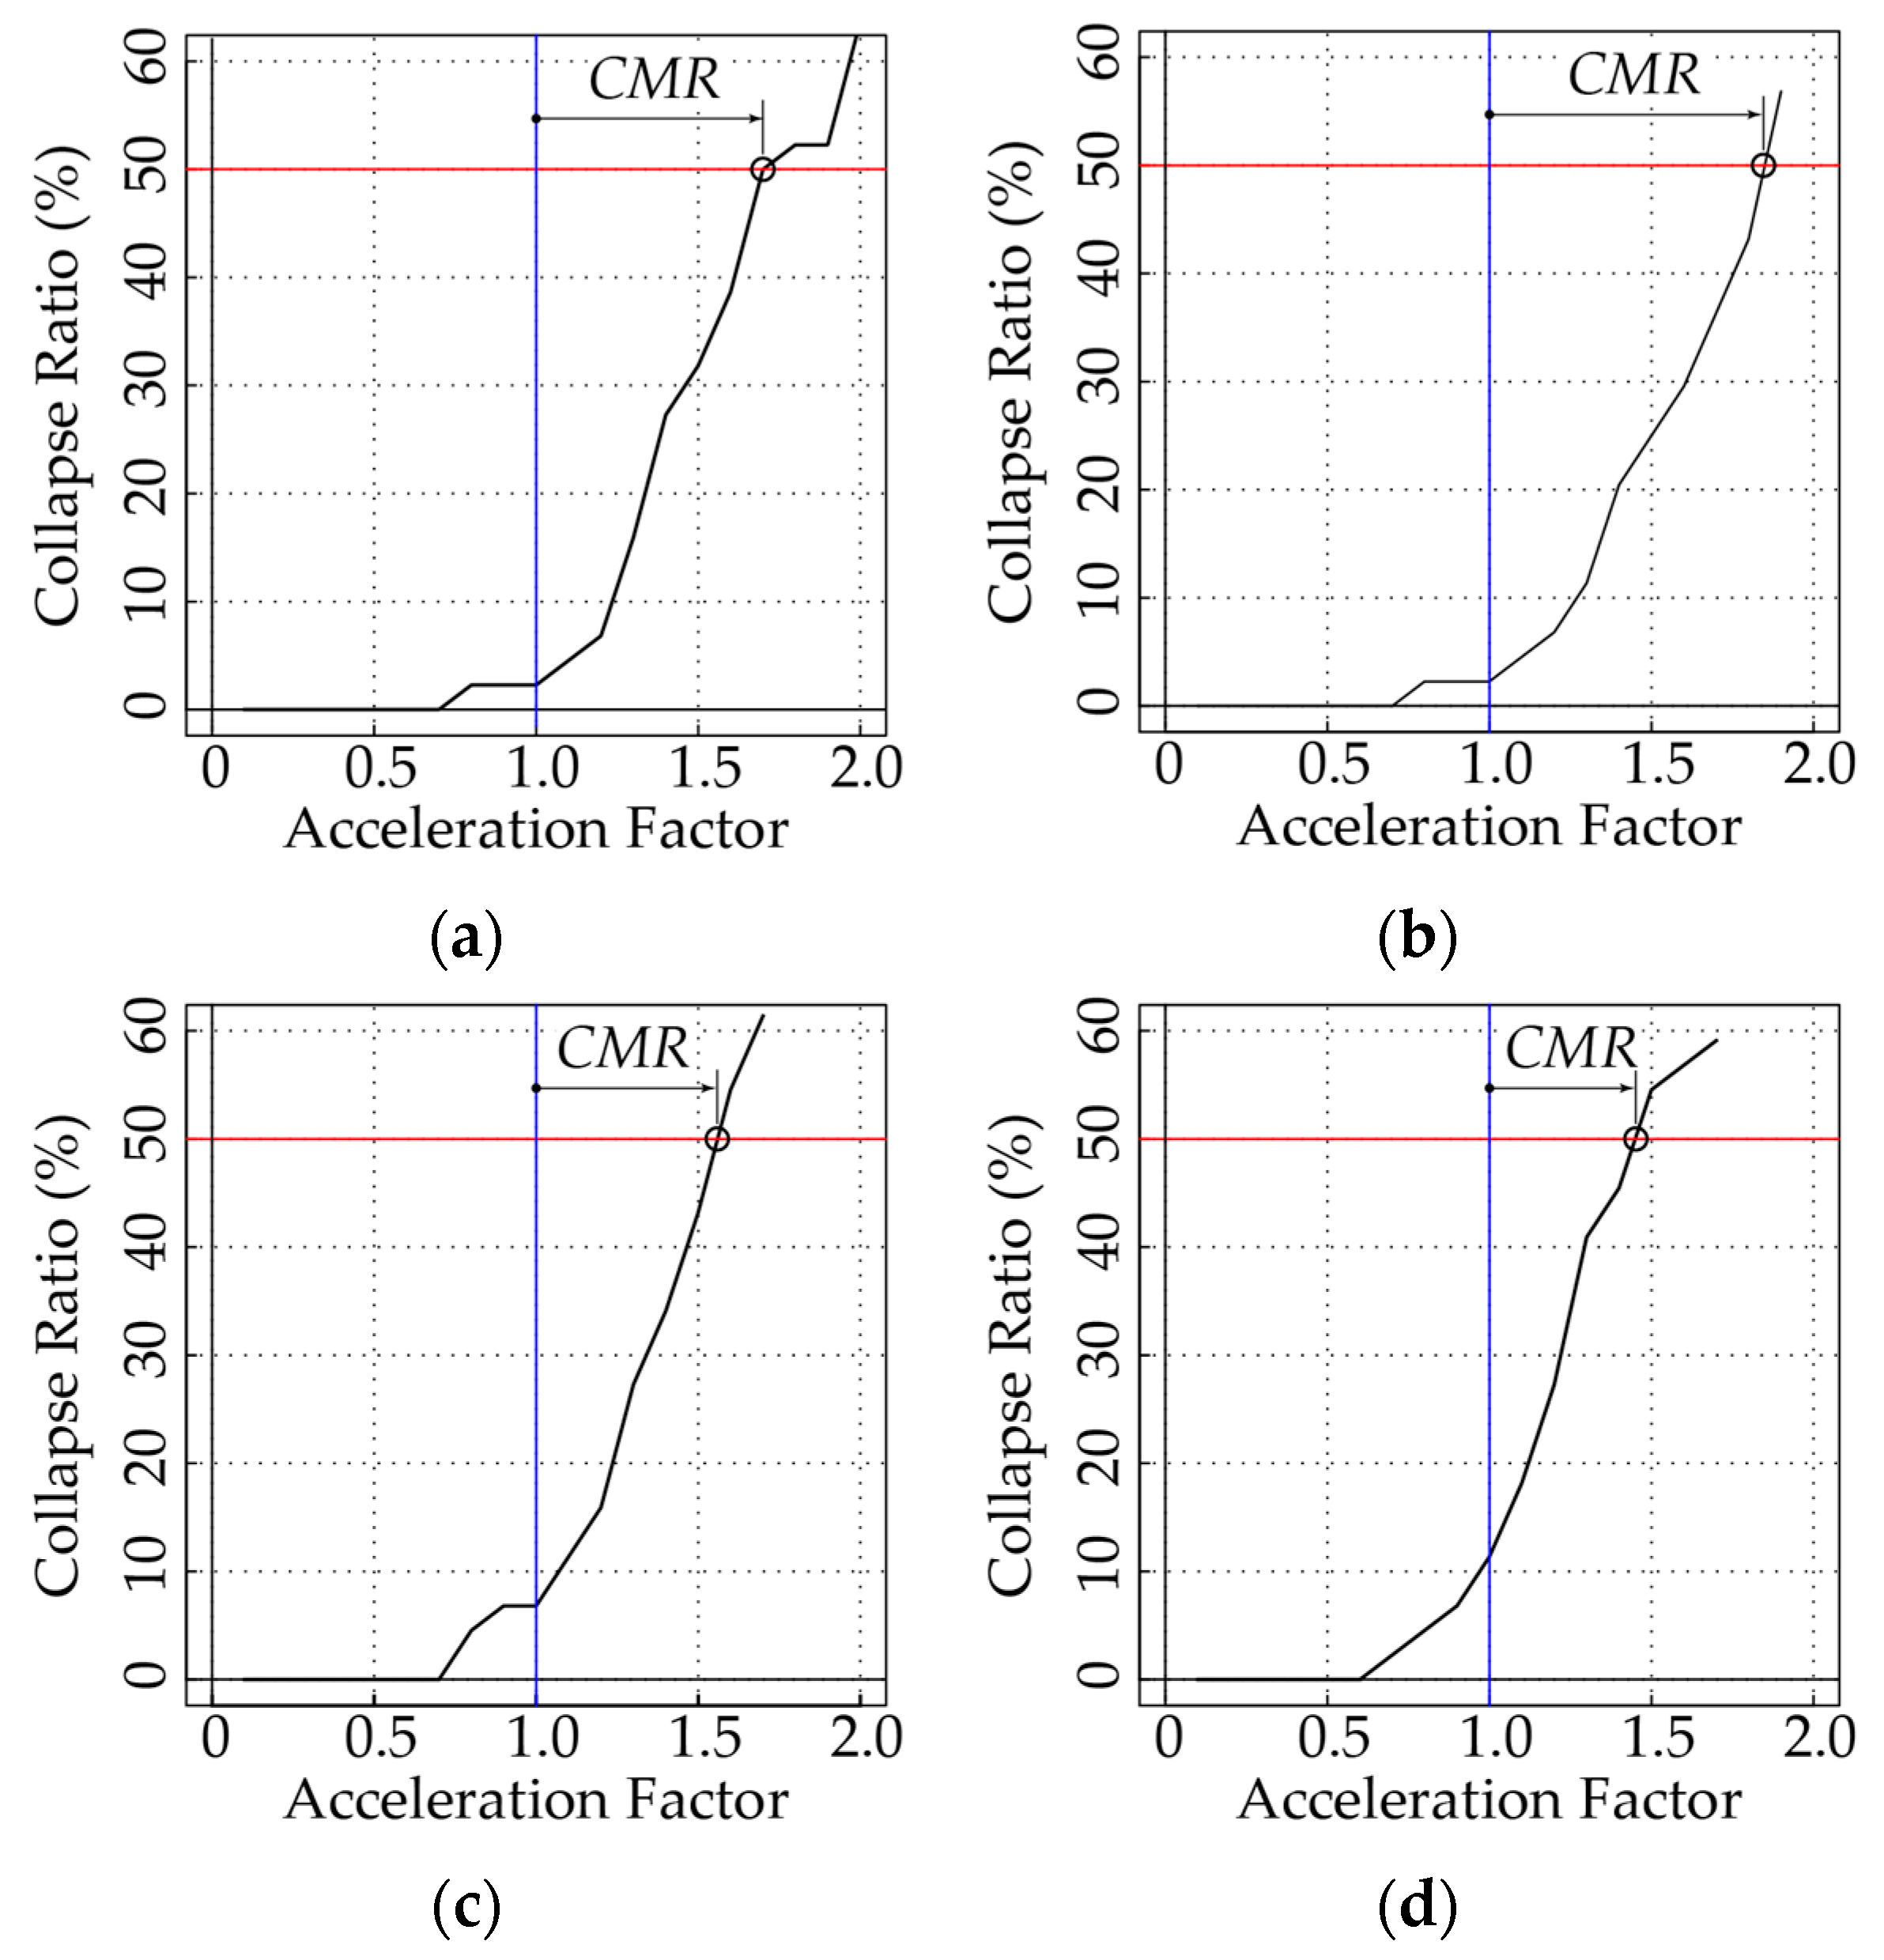
5.2.2. Dynamic Analysis

It was also essential to determine the maximum storey drift ratio at the DBE level of the seismic intensity. ASCE 7 provides the storey drift ratio limit at the ultimate limit state (ULS), which is 2.0%. Figure 21 shows the results for the maximum storey drift ratio with 44 ground motions (i.e., 22 earthquake events with two components) at the DBE level. The ground motion sets stipulated in FEMA P695 [13] were normalised and scaled to match the maximum considered earthquake (MCE) level; therefore, all ground motions were scaled to two-thirds to be equal to the DBE level [2]. The ground motions stipulated in FEMA P695 are summarised in Appendix A. Table 7 summarises the average values of the maximum storey drift ratio at each storey. As the results show, no storey exceeded the 2.0% limitation.
The deflection application factor, Cd, was also assumed in this study to predict the storey drift ratio in the ULS. The designed maximum storey drift ratio, Δd,max, was calculated from the following equation and checked with the drift limit.
Δ d , max = C d Δ DBE
Δ DBE = V DBE / K 0
where K0 is the elastic stiffness (see Table 8).
As shown in Table 5, a deflection application factor of Cd = 5.5 was assumed as the design value. Table 8 summarises the storey drift ratios. The deflection application factors calculated from the dynamic analysis results, Cd,cal, ranged from 2.38 to 4.03, with an average of 3.26. This value was smaller than the assumed design value of 5.5; therefore, it can be concluded that the designed deflection application factor of Cd = 5.5 was on the conservative side. These conservative results might be due to the significant strength-hardening effects due to the bolt bearing, which was different from that in conventional steel moment-resisting frames [3].
To assess the collapse margin ratio (CMR) of the archetype frames, incremental dynamic analysis (IDA) was performed. Ground motions were normalised and scaled to adjust the seismic intensity equal to the maximum considered earthquake (MCE) level according to FRMA P695. The exceedance probability was 2% in 50 years for the MCE level, which was equal to 1.5 times the DBE level [3].
FEMA P695 defines the system collapse as being evaluated when the collapse ratio reaches 50% of the ground motions, i.e., twenty-two ground motions will take down the frame. The CMR is defined as follows:
C M R = S ^ M T S M T
where S M T is the ground motion intensity corresponding to the MCE level, and S ^ M T is the ground motion intensity where the ground motion intensity is equal to a collapse ratio equal to 50%.
Figure 22 shows the results from the IDA; the vertical axis is the collapse ratio, and the horizontal axis is the acceleration factor (AF). The AF is defined as follows:
A F = S a S M T
where Sa is the input ground motion intensity. Therefore, the AF is equal to 1.0 when the input ground motion intensity is equal to the MCE level.
The collapse ratio started to increase when the AF approached 1.0; a collapse ratio of 50% was approached once the AF approached 1.5. The CMR values computed with Equation (9) are summarised in Table 9. The fundamental period of the structure T1 shown in the table was computed from the empirical equation given in ASCE 7. It can be seen that the CMR ranged from 1.45 to 1.85. The evaluation of the collapse margin ratio will be discussed in the next section.

5.3. Evaluation of the Proposed Structural System

FEMA P695 defines the adjusted collapse margin ratio (ACMR) for evaluation. This is due to the shape of the acceleration spectrum; the spectral shape factor (SSF) is considered. The SSF is determined from the system ductility and the fundamental period (T1) of the structure. When the structure is ductile, the SSF will be greater than 1.0. As shown in Figure 20, the mechanism formed after a storey drift ratio of 4.0% was reached; therefore, it can be stated that this system was ductile. The SSF values computed using the FEMA P695 methodology are also shown in Table 9. The value of the SSF ranged from 1.14 to 1.22. The ACMR was computed as follows:
A C M R = S S F C M R
FEMA P695 provided the methodology used to evaluate the seismic design factors (SDFs), and the evaluation procedure was based on a probabilistic approach. The total collapse uncertainty βTOT was used to decide on the criteria; it corresponded to (1) the quality of the test data, (2) the preciseness of the structural design, and (3) the modelling of the analysis model. The βTOT ranged from 0.275 to 0.950. A larger value of βTOT meant that there was much uncertainty. The structural system studied here was based on full-scale testing and precise inelastic modelling of the bolted connections [3,4,5]. The beams and columns were designed to be essentially elastic; therefore, this system can be classified as “good” according to FEMA P695. Consequently, in this study, βTOT = 0.525 could be used as a reasonable value.
If the randomness was assumed to be lognormally distributed, the acceptable CMR could be determined from the total collapse uncertainty βTOT and collapse probability [13]. Collapse probabilities of 10% and 20% were used in the FEMA P695 evaluation. The acceptable values that were used in this evaluation are summarised in Table 10.
FEMA P695 provides two criteria for checking the safety margin. The following two inequalities needed to be satisfied for the proposed system. If not, the assumed R value (response modification coefficient) needed to be modified. Equation (12) is the average from the system group; Equation (13) is for the individuals. The values in Table 9 and Table 10 were used for these checks.
A C M R ¯ i A C M R 10 %
A C M R i A C M R 20 %
where A C M R ¯ i is the average of the adjusted collapse margin ratio of the archetype frame group.
As seen in Table 9 and Table 10, the two inequalities shown above were fulfilled. In the member design, R was assumed to be equal to 8.0. From these results, it can be concluded that this assumed response modification coefficient can be used for middle-storey low-rise buildings with CFS-SBMF systems.

6. Conclusions

The original cold-formed steel–special bolted moment frames (CFS-SBMFs) were introduced in an AISI seismic standard. However, the current ASCE 7 only permits buildings using this system to be one storey in height. Therefore, this study aimed to extend the concept of the original CFS-SBMFs to multi-storey low-rise buildings by utilising the advantage of system ductility provided by bolted connections’ slippage and bearing.
This study was divided into two parts. In the first part, a new beam-to-column moment connection detail was proposed for utilisation in multi-storey structures. Additionally, a design procedure for this connection was proposed to ensure ductility from the bolted connections rather than the beams or columns. Full-scale specimens were prepared, and the structure’s performance was clarified through cyclic testing. The testing showed that the proposed bolted beam-to-column connection performed as designed; inelastic behaviour was delivered by the bolted connection, while the beam and column essentially remained elastic. It was also demonstrated that the inelastic behaviour of the proposed bolted beam-to-column connection could be predicted through mathematical modelling with reasonable accuracy.
In the second part of the study, nonlinear analyses of archetype frames were conducted by following the FEMA P695 methodology. Four configurations of archetype frames were designed using the proposed connection design procedure. Seismic design factors (SDFs) were considered during the frame design, assuming their use in multi-storey low-rise buildings (see Table 5). A static nonlinear pushover analysis demonstrated that the assumed design system overstrength factor was appropriate. Moreover, the ultimate limit state mechanism formed after the storey drift ratio exceeded 4.0%. Two different dynamic analyses were carried out to assess the dynamic characteristics. The first nonlinear time history analysis was conducted with a seismic intensity equal to the design base earthquake (DBE) level. The average maximum storey drift ratio of the archetype frames did not exceed the criterion provided in ASCE 7, which was 2.0%. Additionally, the deflection amplification factor computed in the dynamic analysis was smaller than the assumed design value, indicating that the assumed design value was appropriate. A second nonlinear time history analysis was conducted using incremental dynamic analysis (IDA), and the collapse margin ratio of the archetype frames was assessed. Based on the probabilistic approach, the designed multi-storey low-rise CFS-SBMF building met the requirements of FEMA P695, and the assumed response modification coefficient was shown to be appropriate.

Author Contributions

Conceptualisation, A.S.; methodology, A.S.; software, A.S. and H.K.; validation, A.S. and H.K.; formal analysis, A.S. and H.K.; investigation, A.S. and H.K.; resources, A.S. and H.K.; data curation, A.S. and H.K.; writing—original draft preparation, A.S.; writing—review and editing, A.S.; visualisation, A.S. and H.K.; supervision, A.S.; project administration, A.S. All authors have read and agreed to the published version of the manuscript.

Funding

This research received no external funding.

Institutional Review Board Statement

Not applicable.

Informed Consent Statement

Not applicable.

Data Availability Statement

The original contributions presented in the study are included in the article, further inquiries can be directed to the corresponding author.

Conflicts of Interest

The authors declare that they have no personal circumstances or interests that could improperly influence the representation or interpretation of the reported study results.

Appendix A

The Far-Field record set includes twenty-two records (44 individual components) selected from the PEER NGA database (see Table A1). The event magnitudes range from M6.5 to M7.6, with an average magnitude of M7.0.
Table A1. Summary of earthquake events and recording station data for the Far-Field record set [13].
ID
No.
EarthquakeRecording Station
MYearNameNameOwner
16.71994NorthridgeBeverly Hills—MulholUSC
26.71994NorthridgeCanyon Country-WLCUSC
37.11999Duzce, TurkeyBoluERD
47.11999Hector MineHectorSCSN
56.51979Imperial ValleyDeltaUNAMUCSD
66.51979Imperial ValleyEl Centro Array #11USGS
76.91995Kobe, JapanNishi-AkashiCUE
86.91995Kobe, JapanShin-OsakaCUE
97.51999Kocaeli, TurkeyDuzceERD
107.51999Kocaeli, TurkeyArcelikKOERI
117.31992LandersYermo Fire StationCDMG
127.31992LandersCoolwaterSCE
136.91989Loma PrietaCapitolaCDMG
146.91989Loma PrietaGilroy Array #3CDMG
157.41990Manjil, IranAbbarBHRC
166.51987Superstition HillsEl Centro Imp. Co.CDMG
176.51987Superstition HillsPoe Road (temp)USGS
187.01992Cape MendocinoRio Dell OverpassCDMG
197.61999Chi-Chi, TaiwanCHY101CWB
207.61999Chi-Chi, TaiwanTCU045CWB
216.61971San FernandoLA—Hollywood StorCDMG
226.51976Friuli, ItalyTolmezzo-

References

  1. AISI S110; Standard for Seismic Design of Cold-Formed Steel Structural Systems—Special Bolted Moment Frames. American Iron and Steel Institute: Washington, DC, USA, 2007.
  2. ASCE/ACI 7-16; Minimum Design Loads for Buildings and Other Structures. American Society of Civil Engineering: Reston, VA, USA, 2016.
  3. Sato, A.; Uang, C.M. Seismic Design Procedure Developed for Cold-Formed Steel-Special Bolted Moment Frames. J. Constr. Steel Res. 2009, 65, 860–868. [Google Scholar] [CrossRef]
  4. Uang, C.M.; Sato, A.; Hong, J.K.; Wood, K. Cyclic Testing and Modeling of Cold-Formed Steel Special Bolted Moment Frame Connections. J. Struct. Eng. 2010, 138, 953–960. [Google Scholar] [CrossRef]
  5. Sato, A.; Uang, C.M. Seismic Performance Factors for Cold-Formed Steel Special Bolted Moment Frames. J. Struct. Eng. 2010, 138, 961–967. [Google Scholar] [CrossRef]
  6. Sabbagh, A.B.; Petkovski, M.; Pilakoutas, K.; Mirghaderi, R. Ductile Moment-Resisting Frames using Cold-Formed Steel Section: An Analytical Investigation. J. Constr. Steel Res. 2011, 67, 634–646. [Google Scholar] [CrossRef]
  7. Sabbagh, A.B.; Petkovski, M.; Pilakoutas, K.; Mirghaderi, R. Development of Cold-Formed Steel Elements for Earthquake Resistant Moment Frame Buildings. Thin-Walled Struct. 2012, 53, 99–108. [Google Scholar] [CrossRef]
  8. Sabbagh, A.B.; Petkovski, M.; Pilakoutas, K.; Mirghaderi, R. Cyclic Behaviour of Bolted Cold-Formed Steel Moment Connections: FE modelling including slip. J. Constr. Steel Res. 2013, 80, 100–108. [Google Scholar] [CrossRef]
  9. Serror, M.H.; Hassan, E.; Mourad, S.A. Experimental Study on the Rotation Capacity of Cold-Formed Steel Beams. J. Constr. Steel Res. 2016, 121, 84–97. [Google Scholar] [CrossRef]
  10. Hassan, E.; Serror, M.H.; Mourad, S.A. Numerical Prediction of Available Rotation Capacity of Cold-Formed Steel Beams. J. Constr. Steel Res. 2017, 128, 216–228. [Google Scholar] [CrossRef]
  11. Caldernoi, B.; Martino, A.D.; Formisano, A.; Fiorino, L. Cold Formed Steel Beams under Monotonic and Cyclic Loading: Experimental Investigation. J. Constr. Steel Res. 2009, 65, 219–227. [Google Scholar] [CrossRef]
  12. Dubina, D. Behavior and Performance of Cold-Formed Steel-Framed Houses under Seismic Action. J. Constr. Steel Res. 2008, 64, 896–913. [Google Scholar] [CrossRef]
  13. FEMA P695; Qualification of Building Seismic Performance Factors. Federal Emergency Management Agency: Washinton, DC, USA, 2009.
  14. Sato, A.; Uang, C.M. A FEMA P695 Study for the Proposed Seismic Performance Factors for Cold-Formed Steel Special Bolted Moment Frames. Earthq. Spectra 2013, 29, 259–282. [Google Scholar] [CrossRef]
  15. ANSI/AISC 360; Specification of Structural Steel Buildings. American Institute of Steel Construction: Chicago, IL, USA, 2022.
  16. ANSI/AISC 341; Seismic Provisions for Structural Steel Buildings. American Institute of Steel Construction: Chicago, IL, USA, 2022.
  17. FEMA-350; Recommended Seismic Design Criteria for New Steel Moment Frame Buildings. Federal Emergency Management Agency: Washington, DC, USA, 2000.
  18. Montouri, R.; Nastri, E.; Piluso, V. Advances in Theory of Plastic Mechanism Control: Closed Form Solution for MR-Frames. Earthq. Eng. Struct. Dyn. 2015, 44, 1035–1054. [Google Scholar] [CrossRef]
  19. OpenSees. Available online: https://opensees.berkeley.edu (accessed on 3 August 2015).
Figure 1. Original bolted AISI connection [1]: (a) 2D drawings; (b) 3D configuration; (c) closeup of the bolted connection.
Applsci 14 04520 g001
Figure 2. Proposed bolted connection: (a) 2D drawings; (b) 3D configuration; (c) closeup of the bolted connection.
Applsci 14 04520 g002
Figure 3. Required strength at the beam-to-column connection.
Applsci 14 04520 g003
Figure 4. Test setup for the one-sided (OS) specimens: (a) elevation; (b) configuration in the laboratory.
Applsci 14 04520 g004
Figure 5. Test setup for the both-sided (BS) specimens: (a) elevation; (b) configuration in the laboratory.
Applsci 14 04520 g005
Figure 6. Bolted joint configuration.
Applsci 14 04520 g006
Figure 7. Loading protocol.
Applsci 14 04520 g007
Figure 8. The mechanisms considered (corresponding to the yield strength of each component): (a) bolt slippage; (b) beam yielding; (c) panel yielding; (d) column yielding.
Applsci 14 04520 g008
Figure 9. Built-up beam configuration.
Applsci 14 04520 g009
Figure 10. The gap between the column and beam.
Applsci 14 04520 g010
Figure 11. Applied load vs. storey drift ratio: (a) OS_01; (b) OS_02; (c) BS_01_03; (d) BS_02; (e) BS_03.
Applsci 14 04520 g011
Figure 12. Specimen OS_01: (a) LTB (3.0% storey drift ratio); (b) contact of the beam and column (4.0% storey drift ratio); (c) local buckling of the web (4.0% storey drift ratio).
Applsci 14 04520 g012
Figure 13. Specimen OS_02: (a) LTB (5.0% storey drift ratio); (b) LTB (6.0% storey drift ratio); (c) local buckling of the flange (6.0% storey drift ratio).
Applsci 14 04520 g013
Figure 14. Specimen BS_01: (a) LTB (4.0% storey drift ratio); (b) local buckling of the web and flange (4.0% storey drift ratio).
Applsci 14 04520 g014
Figure 15. Specimen BS_03: LTB (3.0% storey drift ratio).
Applsci 14 04520 g015
Figure 16. Displacement of each component (OS_02): (a) slipping and bearing; (b) beam; (c) panel; (d) column.
Applsci 14 04520 g016
Figure 17. Storey drift components: (a) OS_01; (b) OS_02; (c) BS_01_03; (d) BS_02; (e) BS_03.
Applsci 14 04520 g017
Figure 18. Predicted envelope curves: (a) OS_01; (b) OS_02; (c) BS_01_03; (d) BS_02.
Applsci 14 04520 g018
Figure 19. Archetype frames: (a) S0202; (b) S0203; (c) S0302T; (d) S0302.
Applsci 14 04520 g019
Figure 20. Response curves from the pushover analysis: (a) S0202; (b) S0203; (c) S0302T; (d) S0302.
Applsci 14 04520 g020
Figure 21. Maximum storey drift ratio: (a) S0202; (b) S0203; (c) S0302T; (d) S0302.
Applsci 14 04520 g021
Figure 22. Collapse ratios of up to 50%: (a) S0202; (b) S0203; (c) S0302T; (d) S0302.
Applsci 14 04520 g022
Table 1. Full-scale bolted connection specimens.
No.NameBolt
Strength
Joint
Type
Surface
Class
Beam
Location
1OS_1F10TPT 1AOne-Sided
2OS_2ST 2
3BS_01PTBoth-Sided
4BS_02ST
5BS_03SHTB (F14T)PTB
1 PT: Pre-tensioned (i.e., slip-critical); 2 ST: snugly tightened; d is equal to 20 mm.
Table 2. Mechanical properties measured from the coupon tests.
ComponentThickness (mm)fy (MPa)fu (MPa)
Column9.21384431
Beam5.58353447
Connecting plate11.7294425
fy: yield stress; fu: ultimate strength.
Table 3. The yielding load corresponding to each component yielding mechanism (see Figure 8).
Mechanism LoadOS_1OS_2BS_01BS_02BS_03
Load
(kN)
Ratio
(VX/Vs)
Load
(kN)
Ratio
(VX/Vs)
Load
(kN)
Ratio
(VX/Vs)
Load
(kN)
Ratio
(VX/Vs)
Load
(kN)
Ratio
(VX/Vs)
Vs40.41.0012.11.0080.81.0024.11.002071.00
Vb76.61.9676.66.331531.891536.351530.74
Vp1463.6114612.11461.811466.061460.71
Vc1884.6518815.51882.331887.801880.91
VX: “X” corresponds to Vs, Vb, Vp, and Vc, respectively.
Table 4. Member sizes in the archetype frames.
Frame NameColumn (mm)Beam (mm)
S0202Box-300 × 300 × 6.35Regular:2-CS300 × 95 × 2.7 (lip d = 12.7)
Roof:2-CS280 × 95 × 2.3 (lip d = 12.7)
S0203Regular:2-CS405 × 95 × 2.3 (lip d = 12.7)
Roof: 2-CS356 × 95×1.9 (lip d = 12.7)
S0302TRegular:2-CS356 × 95 × 1.5 (lip d = 12.7)
Roof:2-CS254 × 95 × 2.3 (lip d = 12.7)
S0302Regular:2-CS356 × 95 × 1.5 (lip d = 12.7)
Roof: 2-CS300 × 95 × 1.5 (lip d = 12.7)
Table 5. Seismic design factors (SDFs) for the archetype frames.
Response Modification
Coefficient, R
System Overstrength
Factor, Ω0
Deflection Amplification
Factor, Cd
8.03.05.5
Table 6. Design base shear and system overstrength factor.
Frame NameS0202S0203S0302TS0302Avg. of Ω
VDBE (kN)47.15110.356.0560.50
Vmax (kN)132.4391.7137.5152.7
Ω2.8083.5522.4542.5242.835
Table 7. Average maximum storey drift ratio at the DBE level.
Frame NameS0202S0203S0302TS0302
1F1.226 (%)1.301 (%)1.141 (%)1.389 (%)
2F1.146 (%)0.9087 (%)1.184 (%)1.219 (%)
3F--0.5977 (%)0.3595 (%)
Table 8. Evaluation of the maximum storey drift ratio.
Frame NameΔmaxΔDBEK0 (×102 kN/rad)Cd,cal (=ΔmaxDBE)
S02021.226 (%)0.304 (%)155.14.03
S02031.301 (%)0.365 (%)302.23.56
S0302T1.184 (%)0.498 (%)112.62.38
S03021.389 (%)0.454 (%)133.33.06
Avg.3.26
Table 9. Collapse margin ratio, spectral shape factor, and adjusted collapse margin ratio.
Frame NameS0202S0203S0302TS0302Avg.
T1 (sec.)0.560.500.780.78
CMR1.691.851.561.45
SSF1.141.221.221.21
ACMR1.932.261.901.751.96
Table 10. Acceptable collapse margin ratio corresponding to the collapse probability.
Total Collapse Uncertainty
βTOT
Collapse Probability of 10%
ACMR10%
Collapse Probability of 20%
ACMR20%
0.5251.961.56
Disclaimer/Publisher’s Note: The statements, opinions and data contained in all publications are solely those of the individual author(s) and contributor(s) and not of MDPI and/or the editor(s). MDPI and/or the editor(s) disclaim responsibility for any injury to people or property resulting from any ideas, methods, instructions or products referred to in the content.

