Article

Finite Element Analysis on the Behavior of Solidified Soil Embankments on Piled Foundations under Dynamic Traffic Loads

1
Key Laboratory of Ministry of Education for Geomechanics and Embankment Engineering, Hohai University, Nanjing 210098, China
2
Research Institute of Geotechnical Engineering, Hohai University, Nanjing 210098, China
3
College of Civil Engineering, Suzhou University of Science and Technology, Suzhou 215009, China
*
Author to whom correspondence should be addressed.
Appl. Sci. 2024, 14(11), 4464; https://doi.org/10.3390/app14114464
Submission received: 7 April 2024 / Revised: 18 May 2024 / Accepted: 19 May 2024 / Published: 23 May 2024

Abstract

:
Most research conducted so far has primarily focused on pile-supported gravel embankments. The ability of solidified soil used as an embankment filling material has been verified, and a clear view on the performance of solidified soil embankments on piled foundations is rather limited. The three-dimensional unit cell models of pile-supported embankments are conducted to investigate the performance of solidified soil embankments in comparison to gravel embankments under static and dynamic loads. Then, a systematic parametric analysis is performed to investigate the effects of various factors, including the cohesion and friction of solidified soil, the velocity and wheel load of vehicles, the pile spacing, the height of embankments. The results show that, compared with the results of gravel embankments, the heights of the outer soil arch plane in solidified soil embankments reduces under static and dynamic loads, and the piles bear more load. In addition, the total settlements of solidified soil embankments decrease with increasing cohesions, and there is an economical cohesion of 25 kPa. The vehicle wheel load, pile spacing, and the height of embankment significantly influence the load transfer mechanism and total settlement of solidified soil embankment, while the friction angles and velocities have little effect on the total settlements and vertical stress. The relationship between the soil arch height and various parameters in solidified soil embankments is established by multiple regression analysis. This investigation highlights the advantage of solidified soil in reducing total settlement and provides an insightful understanding of the load transfer mechanism of solidified soil embankment on piled foundation.

1. Introduction

With the rapid expansion of road construction, there is a growing demand for embankment filling materials [1,2]. Concurrently, significant engineering projects produce substantial amounts of excavated waste soil, posing challenges for disposal. Solidification technologies offer a viable solution to these issues. These treatment technologies not only make the best use of natural resources, but also reduce excavated waste soil and provide high-quality fill materials. Extensive research has been conducted to explore the feasibility of solidified soil as construction fill materials [3,4]. Jamsawang et al. [3] found that cement- and fly ash-stabilized sediment could meet the requirement of subbase materials in terms of unconfined compressive strength and resilient modulus. Niu et al. [4] indicated that the shear strength of the solidified excavated soft soil increased with higher stabilizer content, and the solidified excavated soft soil exhibited excellent stability even after undergoing dry–wet cycles.
Various laboratory experiments and field tests have demonstrated that the solidified soils could meet the specifications of fill materials, including the liquid limit, plastic limit, compaction, unconfined compressive strength, California bearing ratio, and resilient modulus. According to Jamsawang et al. [3], large amounts of hydration products, resulting from the hydration reaction, improve the bond strength between the clusters and soil particles. In addition, the cation exchange reaction (Ca2+ replacing K+) contributed to larger clay particles, which lead to an increase in the friction angle between the clusters [5]. Compared with untreated soils, the cohesion and friction angles of solidified soils significantly increased due to the cementation bond [6]. According to Gupta and Kumar [7], the pond ash and cement solidified soils showed satisfactory strength, cohesion and stiffness. Therefore, the cohesions and friction angles of solidified soil are higher than those of conventional coarse fill or natural cohesion soils. Vukicevic et al. [8,9] pointed out that the solidified soils incorporating fly ash and slag were suitable for backfilling railroad and road embankments in Serbia in terms of the strength and stiffness. According to Chen et al. [10], the cement-solidified lead-contaminated soils could be reused as embankment fill materials in highway construction in terms of the contaminant leachability and strength properties. Tebaldi et al. [11] claimed that lime stabilization of clay soils, due to its economic and high performances, is becoming, if it is not already, one of the most used techniques construction for road and railway embankments. Solidified soils with industrial by-products, such as calcium carbide residue [12] and lignin [13], showed excellent performance, and could be used for highway subgrade. Lime-treated clay has been used as the upper subgrade fill for highways [14]. The cement-stabilized soil was used as embankment fill in the Beijing–Tianjin high-speed railway [15], while the deformation characteristics and load transfer mechanism of cement-solidified soil embankment were not studied.
Pile-supported embankments have been widely applied in infrastructure projects [16]. A number of studies have been performed to investigate the soil-arching mechanism [17,18,19]. Due to the complexity of piled embankments, numerical modelling is considered an effective tool. The soil arching phenomenon in a pile-supported granular embankment was demonstrated based on the two-dimensional finite element modeling approach [20]. The large-scale physical model was also utilized to simulate the behavior of the piled embankment reinforced with the basal geosynthetic reinforcement [21]. However, in the literature review, most studies focus on the load transfer mechanism for coarse materials or cohesionless soils, and the effects of cohesion of embankment soils were not considered in pile-supported embankments [22,23]. Okyay and Dias [23] investigated the load transfer mechanism of the lime- and cement-solidified soil, which is used as a load transfer platform in piled embankments. The results of the two-dimensional numerical analysis show that the solidified soil platform behaves like a beam. In their study, the heights of the solidified soil platform ranged from 0.4 to 1.0 m, which is much lower than the height of the embankment. The theoretical analysis models for pile-supported embankments are also mainly based on coarse materials or cohesionless soils [24]. Eskişar et al. [25] pointed out that in the fill materials, the peak internal friction angle, particle size, and cohesion have a significant effect on the soil arching. Wu et al. [26] stated that, in cohesionless soils, the load is transferred primarily through frictional forces, whereas in cohesive soils, the load is transferred through both friction and cohesion, resulting in a more stable soil arching effect. However, the effects of solidified soil-on-soil arching mechanisms in pile-supported embankments have not yet been adequately studied, especially under dynamic load, and require further investigation.
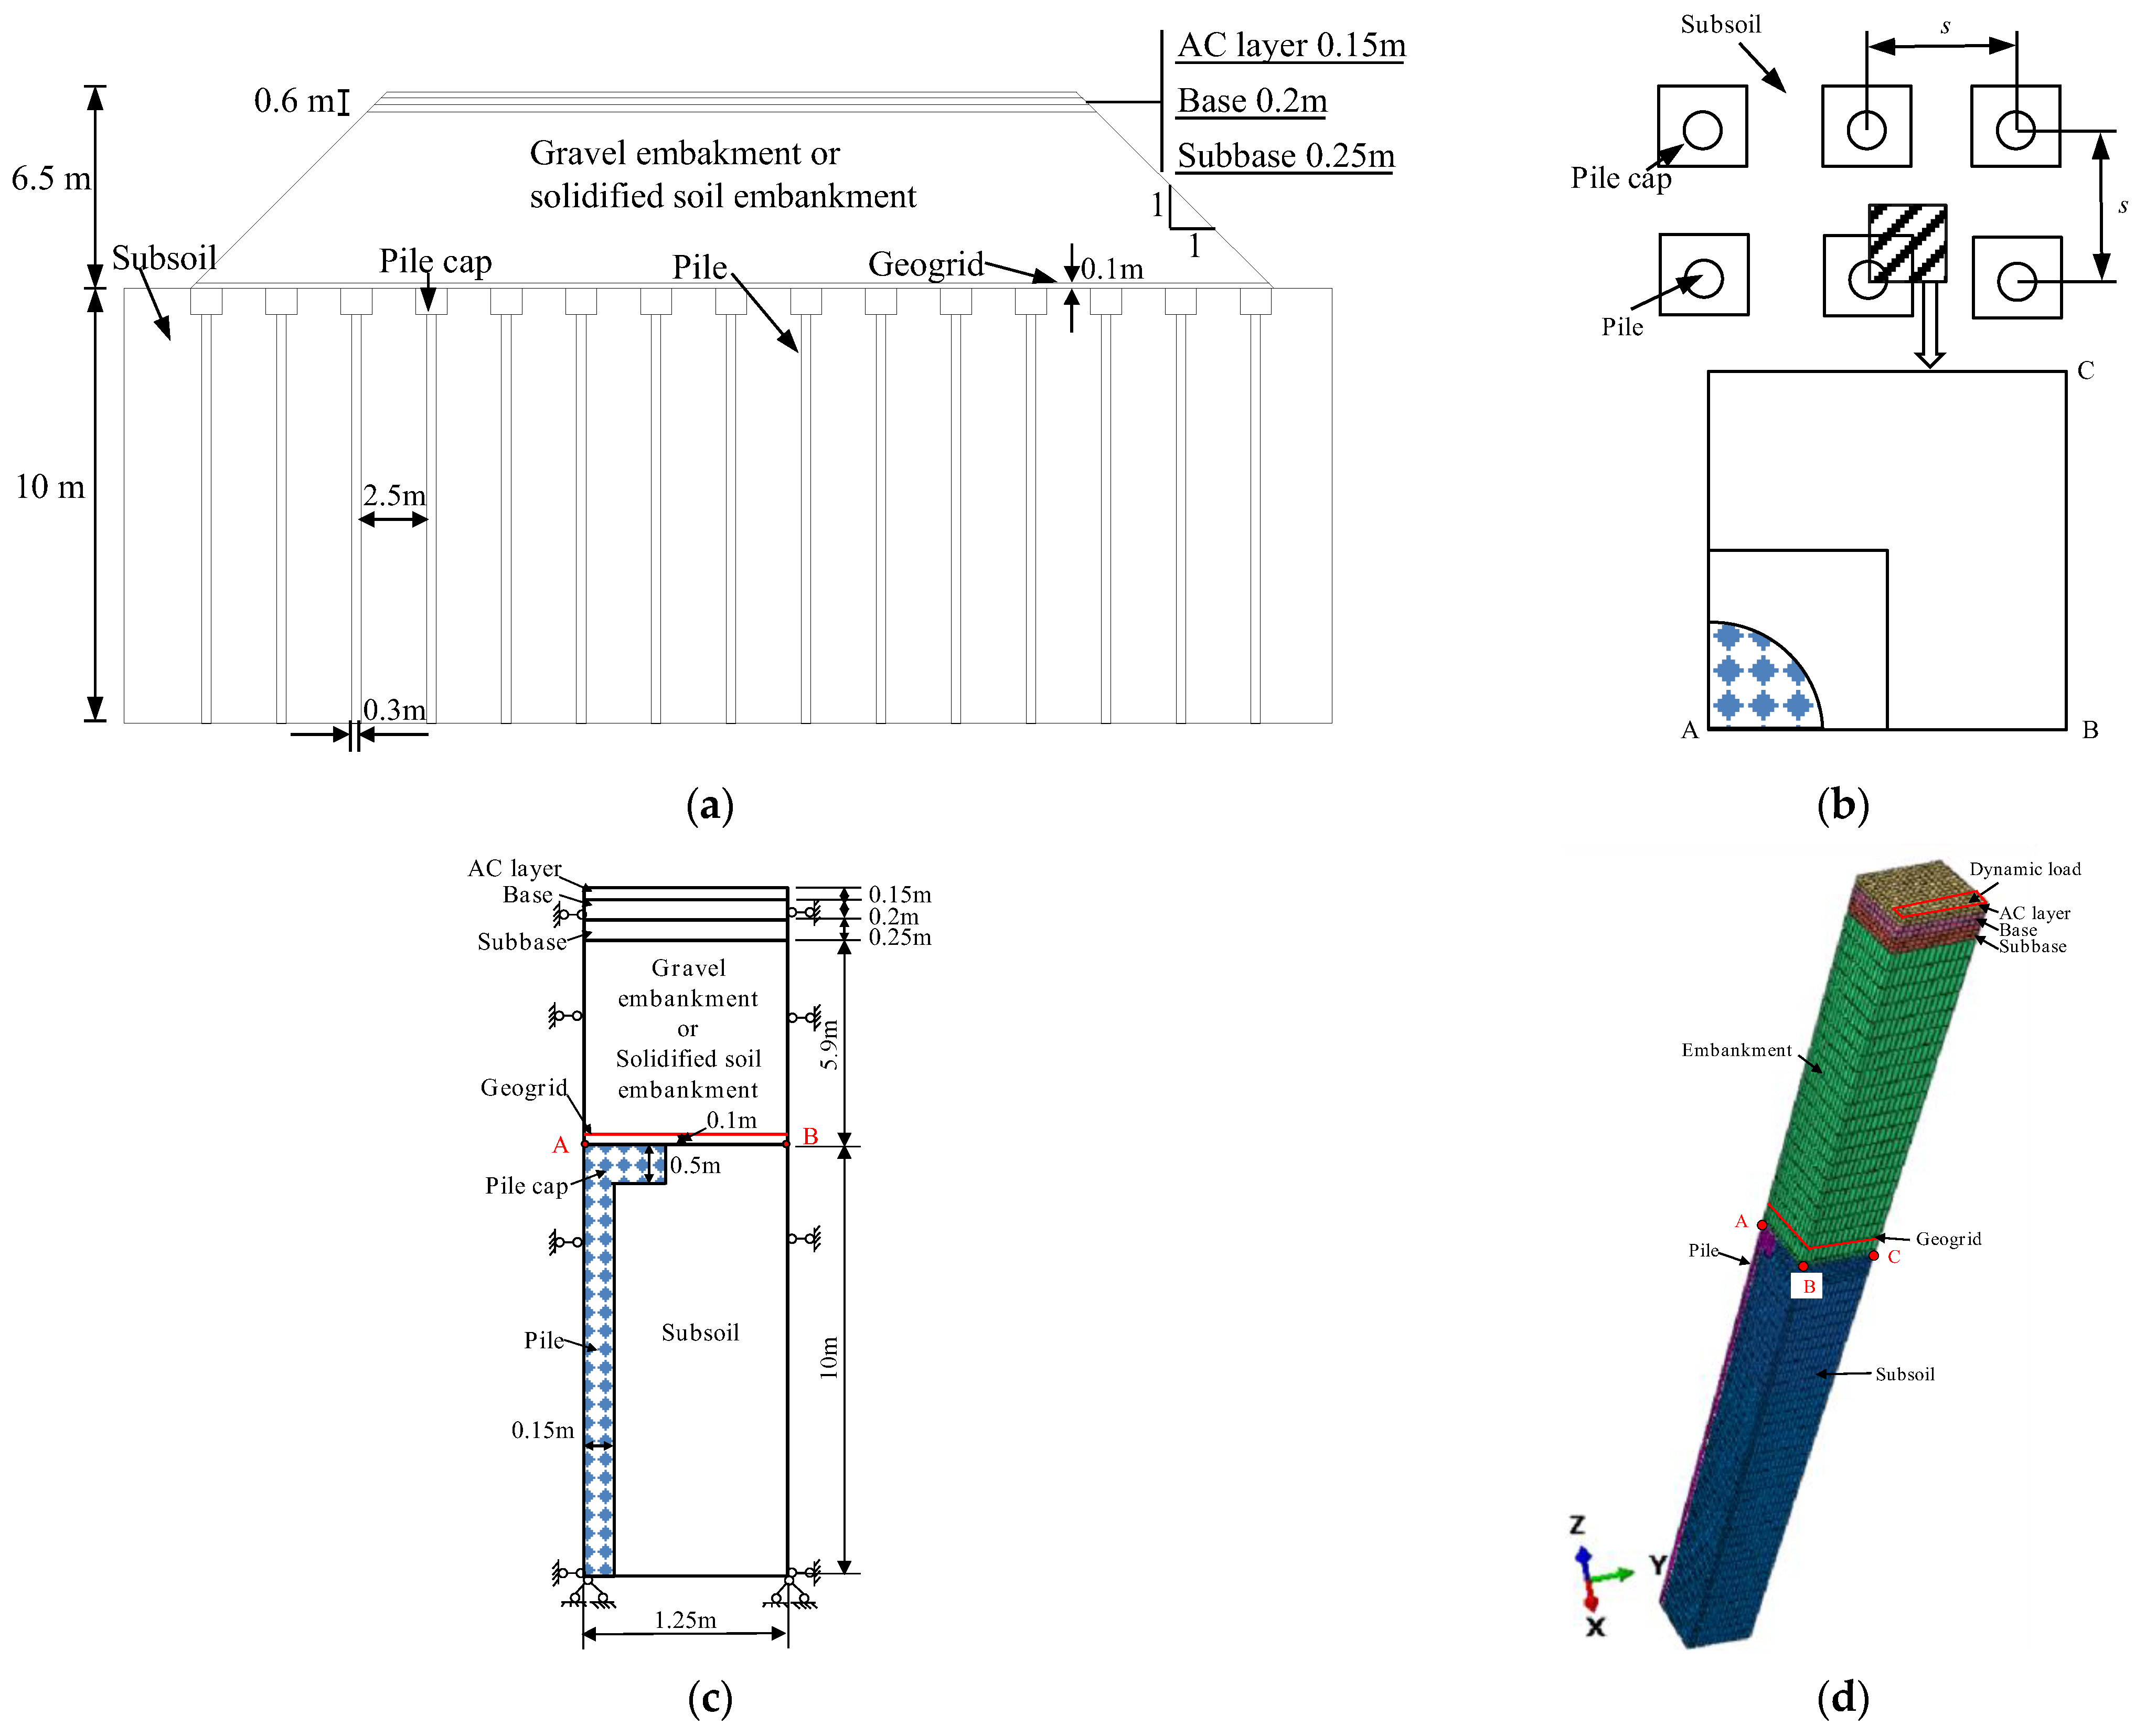
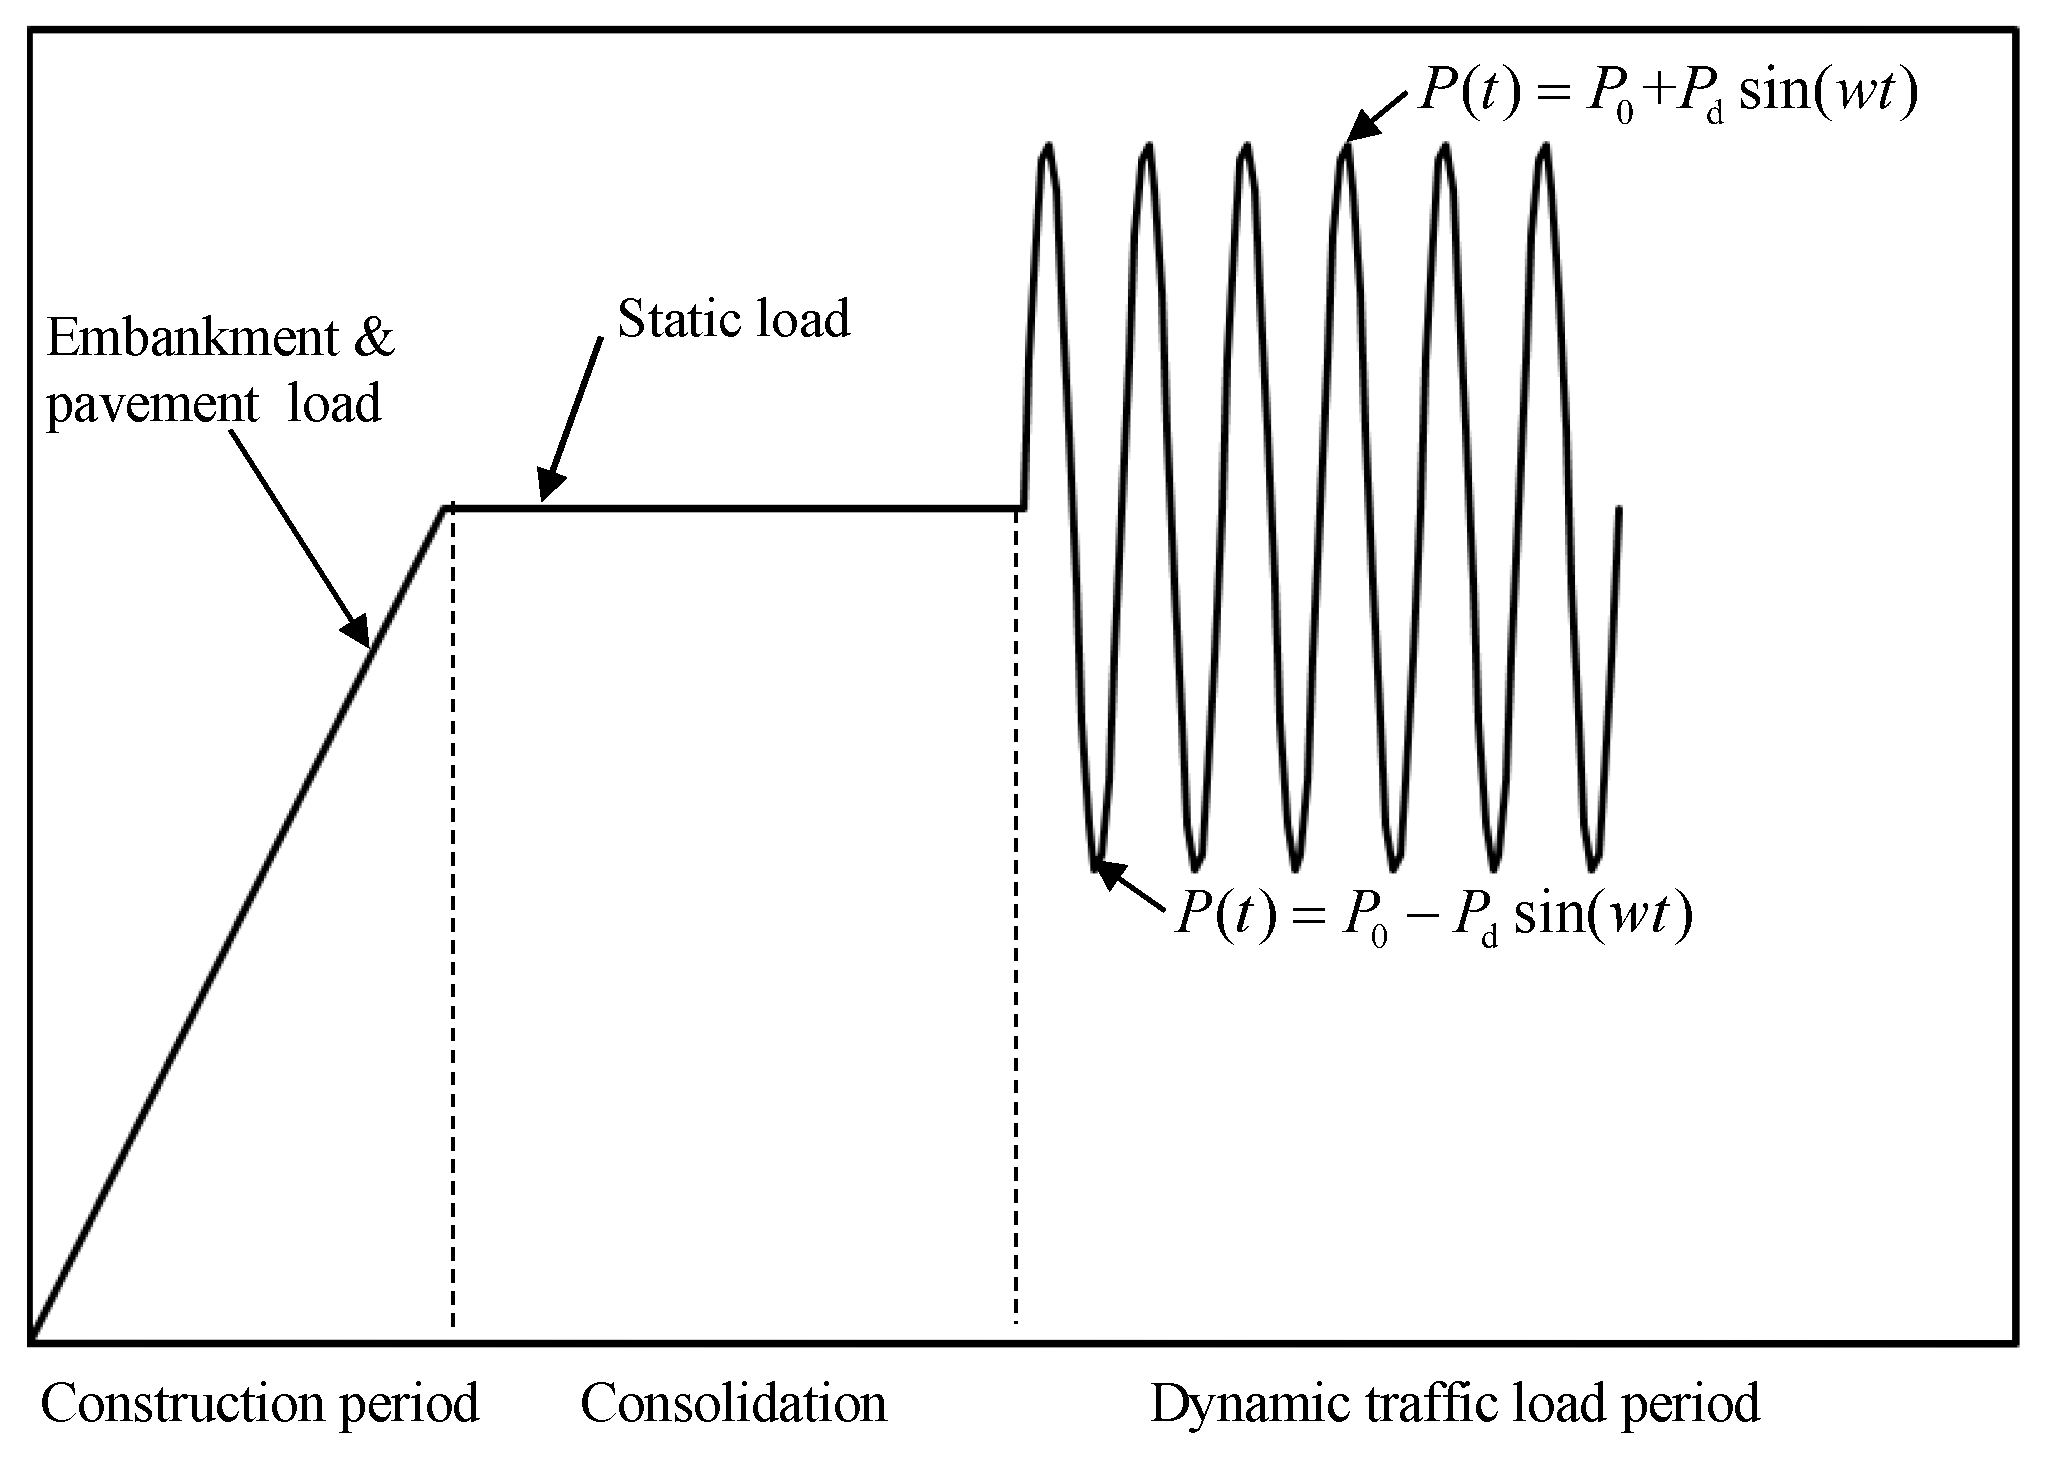
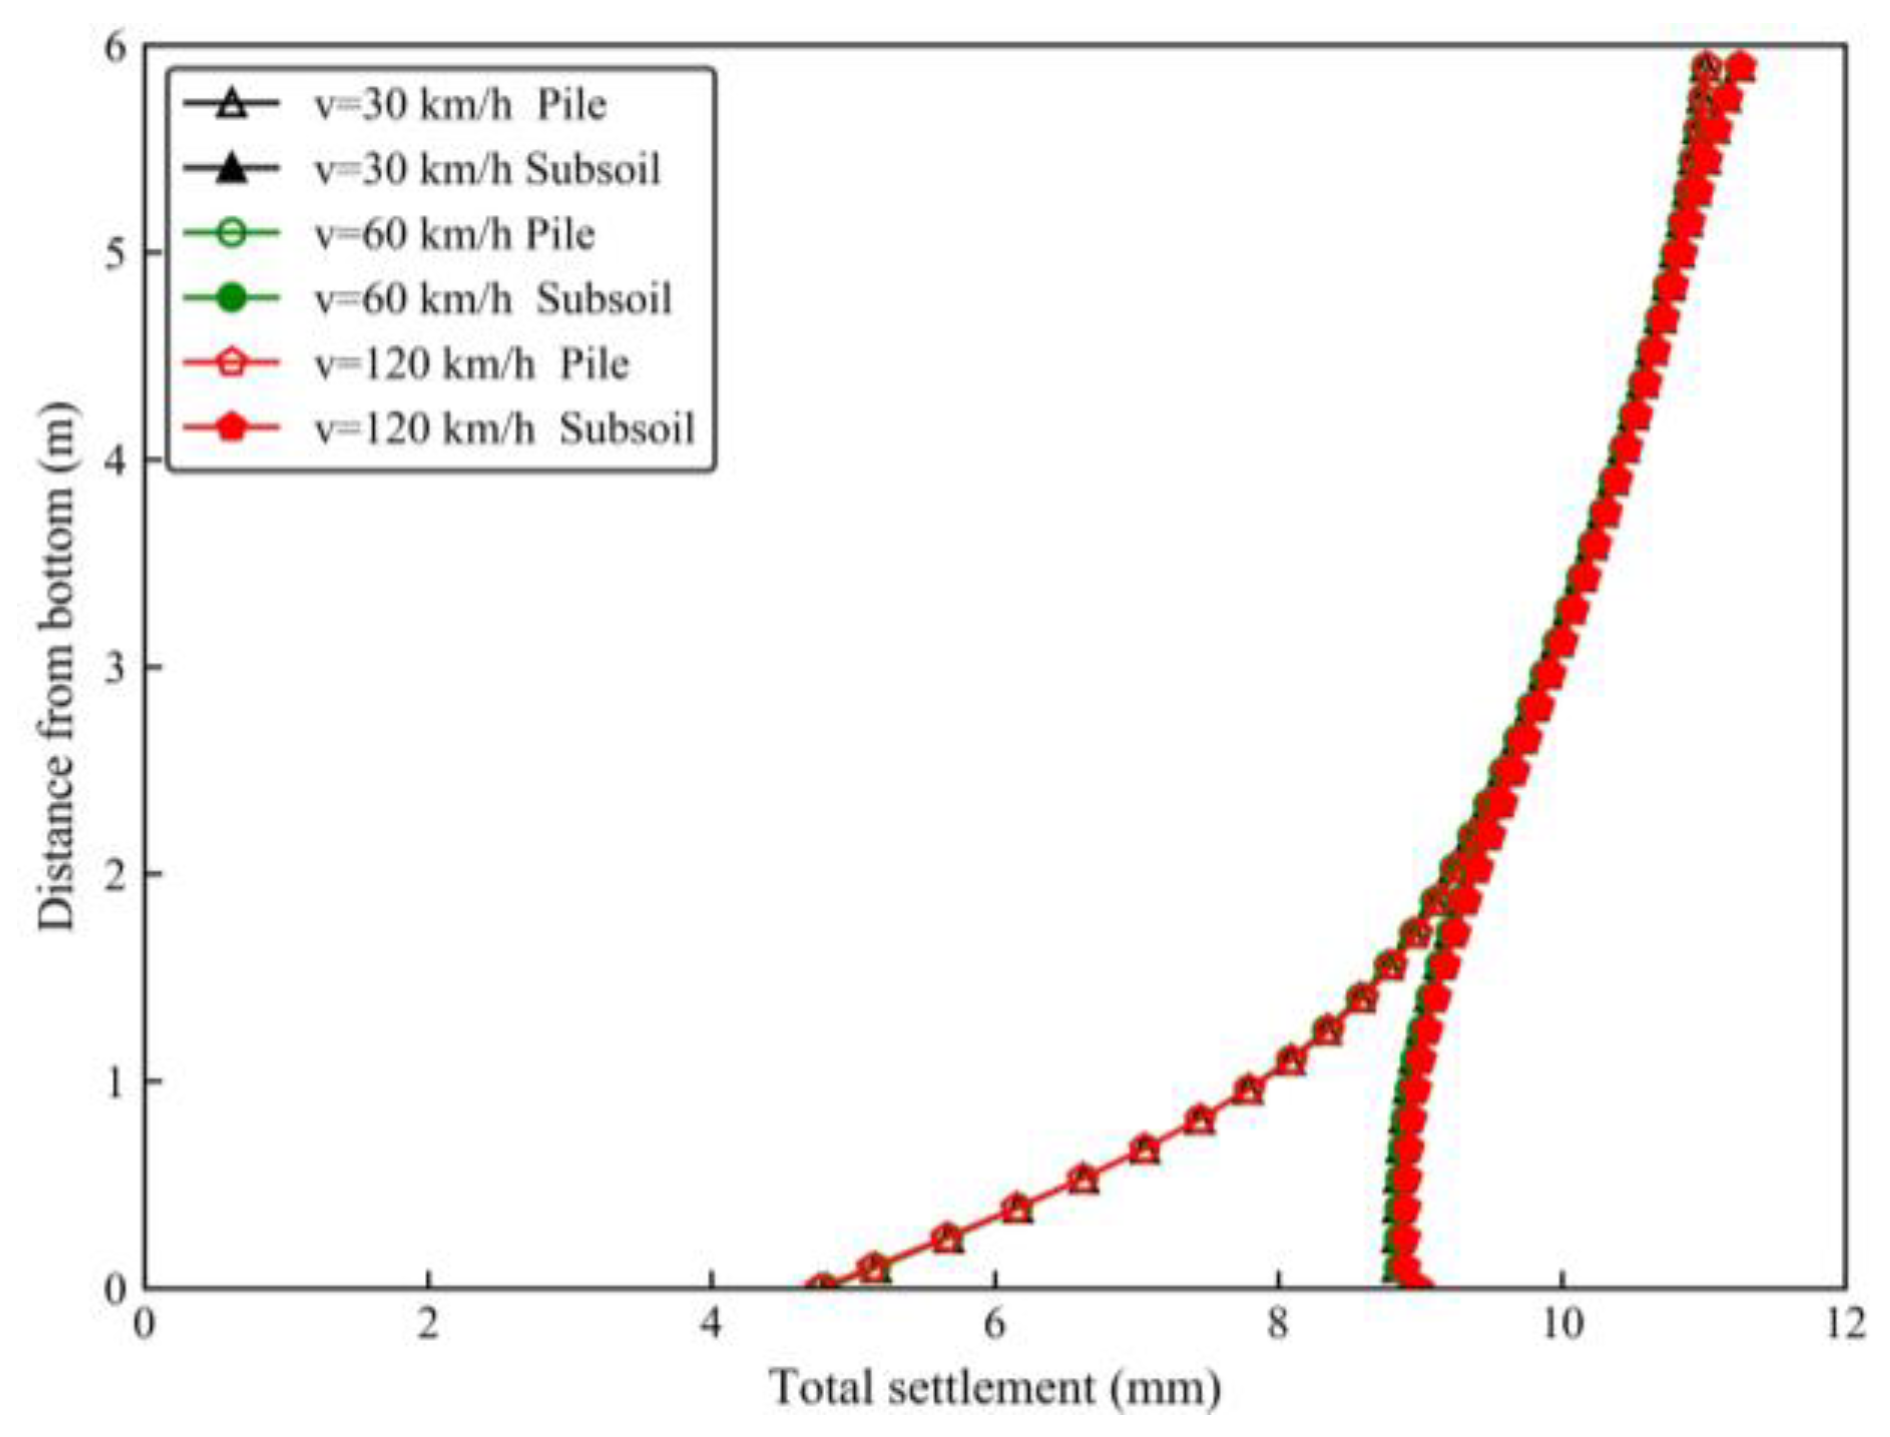
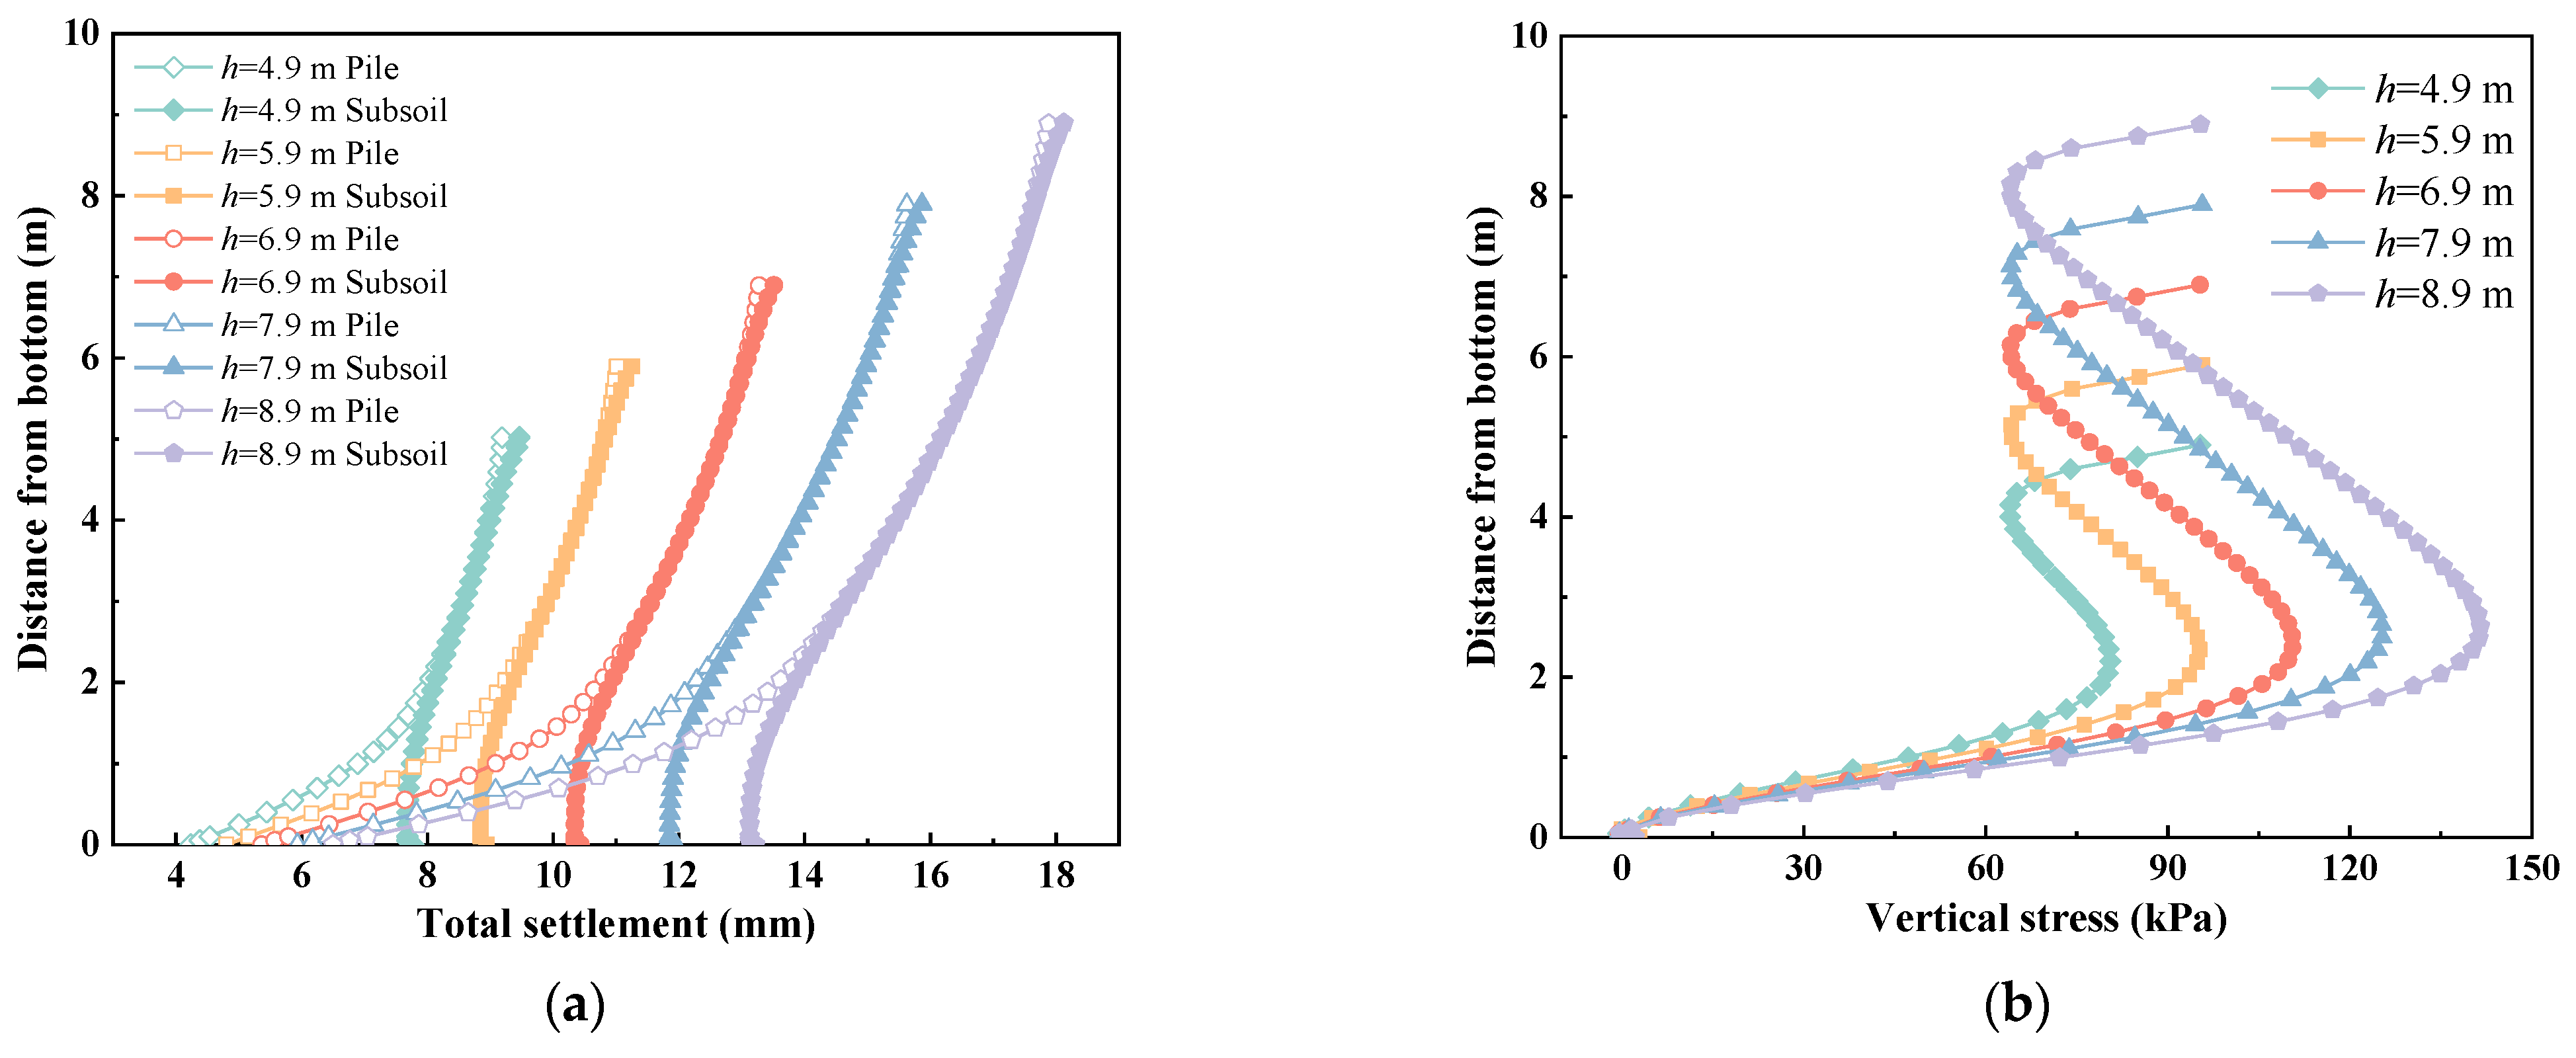
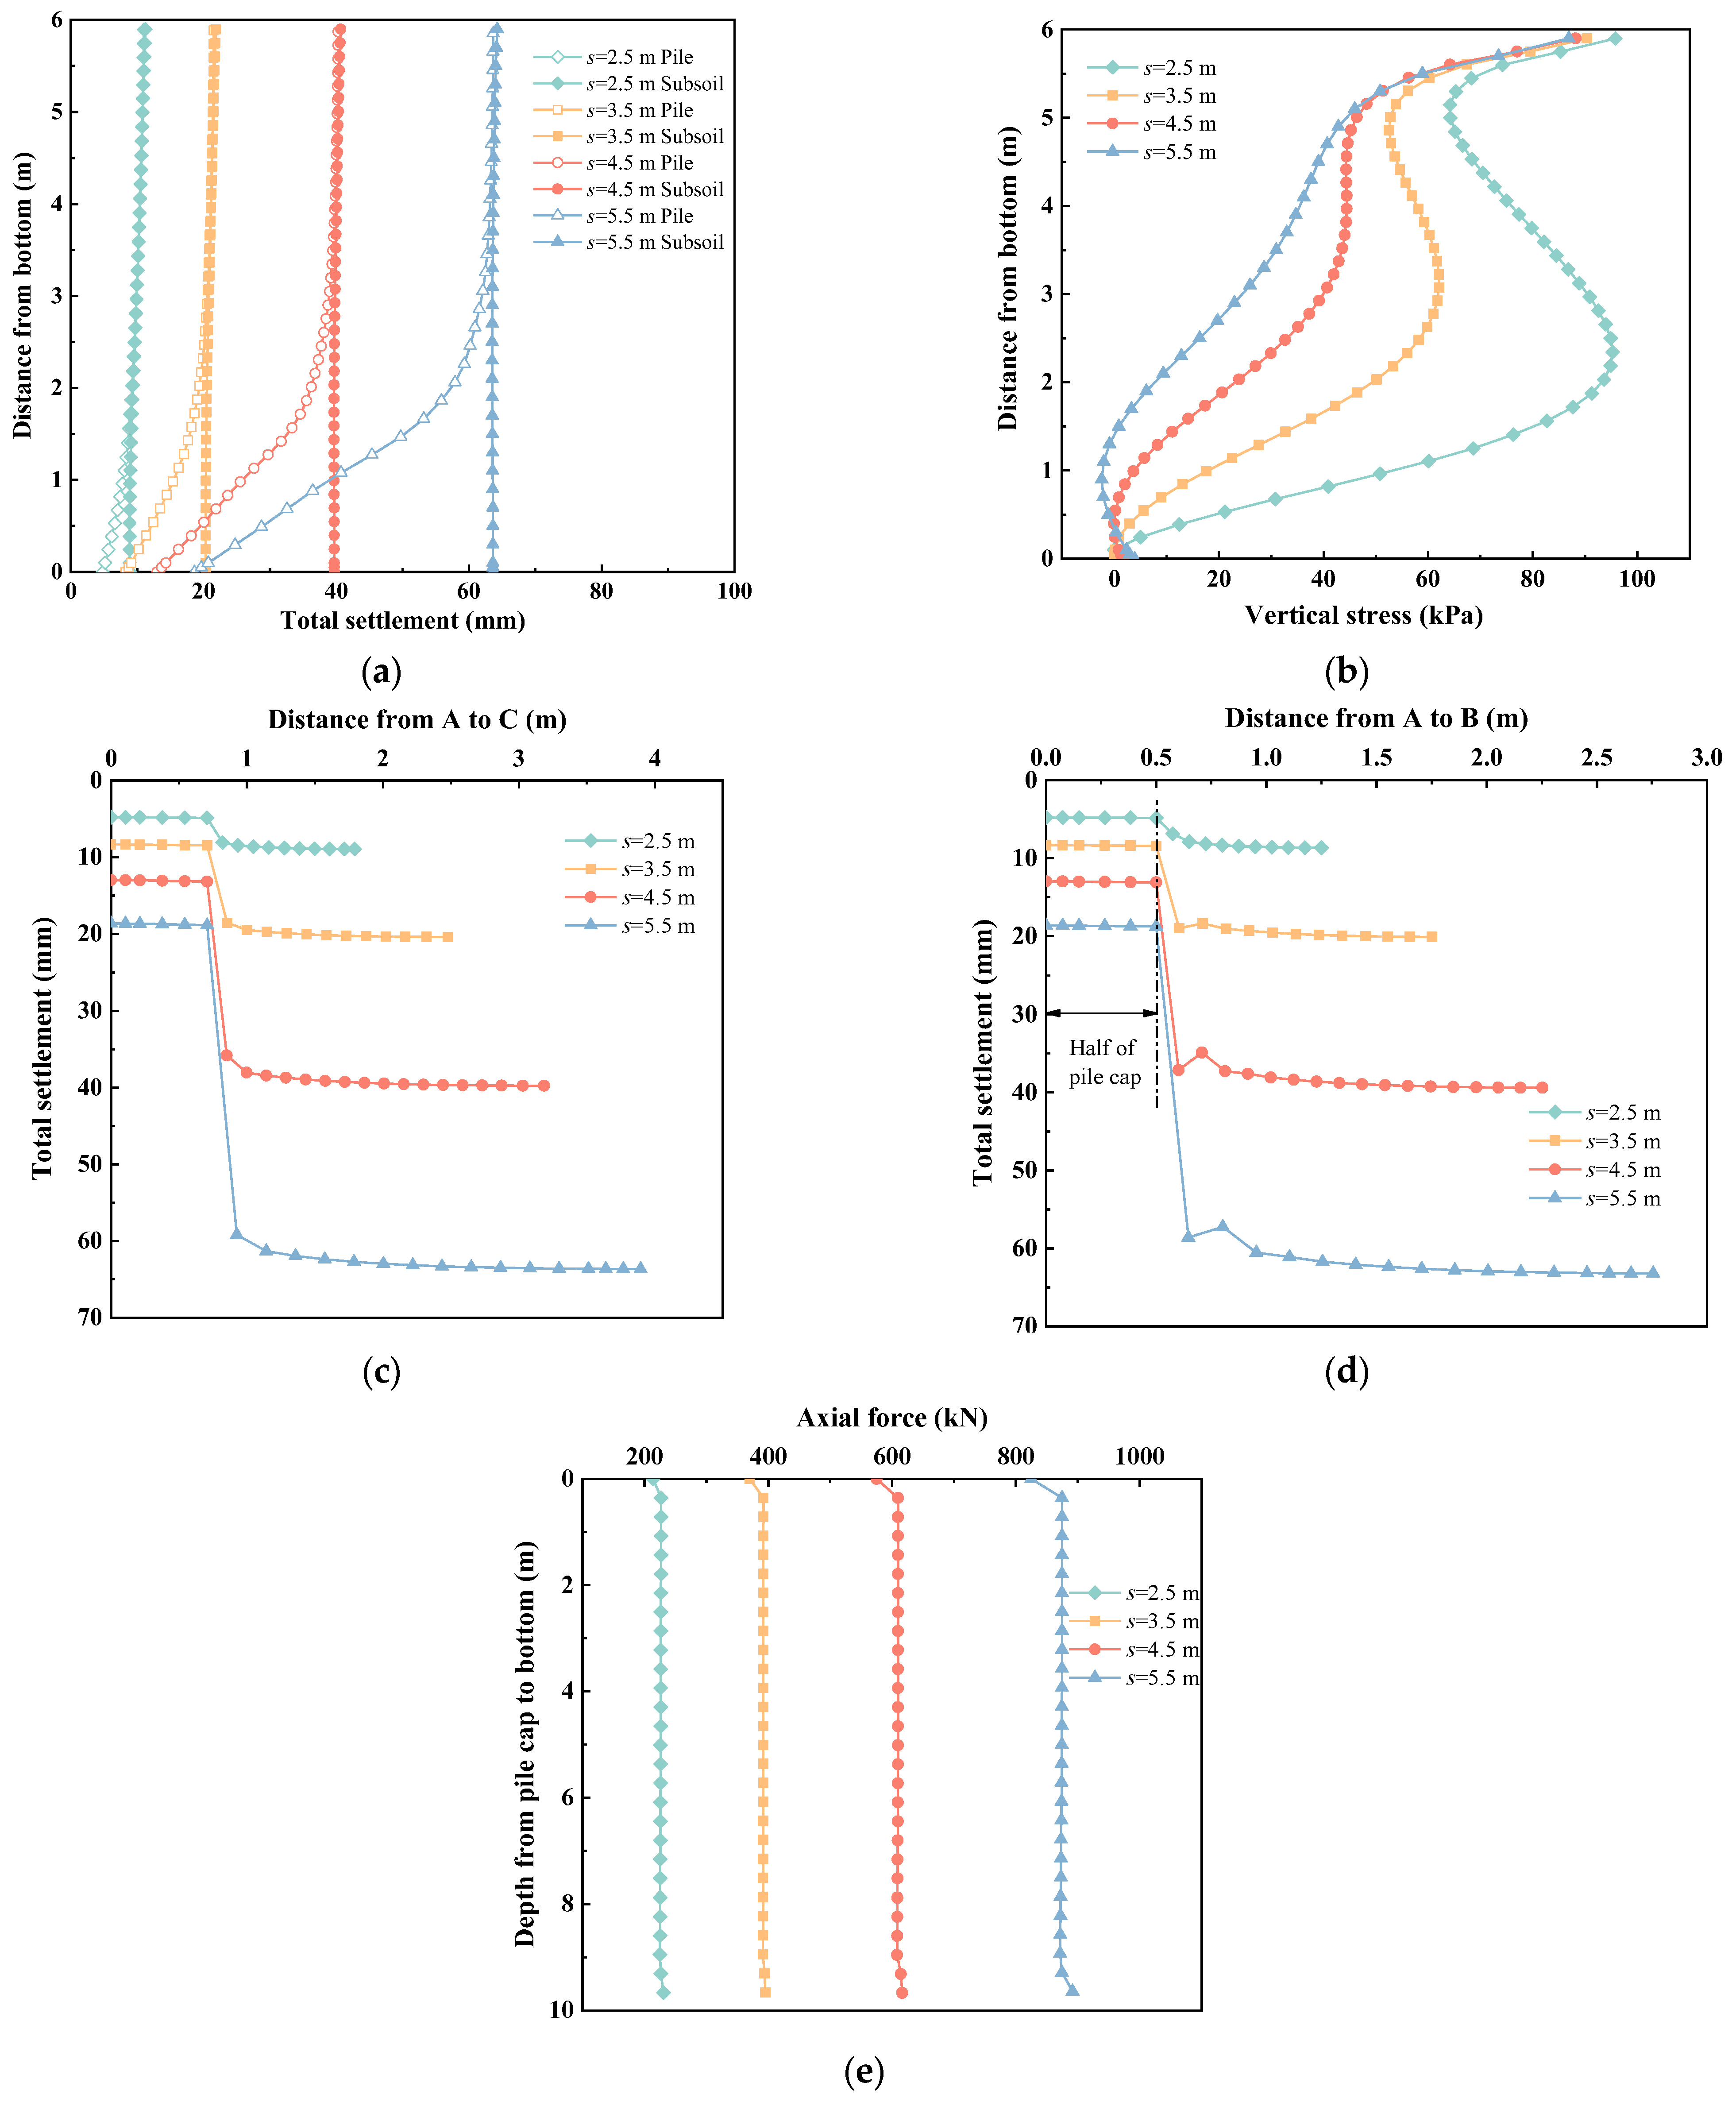
Solidified soil, due to its economic and high performance, has been used for road and railway embankments. In this work, the load transfer mechanism and total settlements of gravel embankments on piled foundations when replaced with solidified soil embankments under static and dynamic loads were investigated. A comparative analysis of gravel embankment and solidified soil embankment under static and dynamic traffic loads was also performed. In addition, a comprehensive parametric study was conducted to investigate the effects of various factors, such as the cohesions (5~75 kPa) and the friction angles (20~45°) of solidified soil, the dynamic vehicle wheel loads (25~137.5 kN), the velocities (30~120 km/h), the embankment heights (5.5~9.5 m) and the pile spacings (2.5~5.5 m) on the total settlements and the load transfer mechanism.

2. Finite Element Modelling

2.1. Model Description

A 5.9 m high embankment and a 0.6 m high pavement were located on a 10 m high subsoil layer, as shown in Figure 1a. The concrete piles with square caps, which were 1 m in width and 0.5 m in thickness, were placed in a square layout through the subsoil. The diameter and spacing of the concrete piles were 0.3 m and 2.5 m, respectively. The geogrid was placed 0.1 m above the base of the embankment. The three-dimensional (3D) unit cell models of gravel and solidified soil embankments were simulated using the finite element package “Abaqus” (version 6.16). The 3D unit cell models (see Figure 1b) include one-quarter of the pile and its tributary area [27]. The bottom boundaries of the 3D unit cell models were completely fixed, as shown in Figure 1c. The vertical side boundaries were horizontally fixed due to the symmetry of the models. In the literature, the 3D unit cell model was widely used for the stress analysis of the pile-supported embankment, considering the structural symmetry and computational efficiency [28,29,30,31]. According to Yoo and Kim [27], the results of the 3D unit cell model of the pile-supported embankment showed good agreement with those from the full model for pile-supported embankment in settlements, vertical stress and lateral deflection. Pham et al. [30] pointed out that the unit cell model has the ability to capture the behavior of a basic volume cell in a larger 3D model and reduce the complexity; meanwhile, it could provide quality results and computational performance. The water table was at the surface of the soft subsoil, and the initial pore pressures before the embankment construction were assumed to be hydrostatic. After the embankment load was applied, the bottom and top boundaries of the subsoil were set to zero pore pressure, indicating that they could drain freely. The vertical boundaries were treated as impermeable surfaces. The subsoil was discretized with 8-node stress-pore pressure-coupled brick elements (C3D8P), while the piles, embankment, and pavement were discretized with 8-node brick elements (C3D8). The geogrid was simulated using 3-dimensional membrane elements with four nodes and full integration (M3D4), with nonzero stiffness only in the X-Y plane. The mesh of 3D unit cell models is shown in Figure 1d. To validate the model settings and parameters, Model A and Model B of pile-supported gravel embankments reported by Zhuang and Wang [29] were remodeled and referred to as “Case A” and “Case B” in this paper, under static and dynamic loads, respectively. The models of solidified soil embankment under static and dynamic loads were performed and referred to as “Case C” and “Case D”, respectively. The summary of the load types and embankment materials is shown in Table 1.
The interaction between the pile and the subsoil was surface-to-surface contact. The interaction between the geogrid and the embankment was tie interaction. The shear resistance angle ( φ i ) between the pile and the soft soil in the horizontal plane was calculated, and the coefficient of friction ( μ i ) was calculated according to Zhuang and Wang [30].
φ i = t a n 1 sin φ × cos φ 1 + sin 2 φ
μ i = tan φ i
where φ represents the effective friction angle of the soft soil. In this work, the effective friction angle of the soft soil was 26°.

2.1.1. Materials

The parameters of 3D unit cell models were summarized in Table 2, where μ represents the Poisson’s ratio; λ represents the compression index; and κ represents rebound index. According to Ding et al. [32], the Young’s modulus (E) of embankments fill and gravel cushion layer were 15 MPa and 30 MPa, respectively. According to Pham et al. [22], the Young’s modulus of embankments fill was 20 MPa. Zhuang et al. [33] and Zhuang and Li [28] adopted a Young’s modulus of 25 MPa for granular embankment materials. In this study, the Young’s modulus of gravel embankment was 25 MPa and other parameters of gravel embankment materials were the same as those described in Zhuang et al. [33]. The Modified Cam Clay constitutive model, due to its excellent performance, was adopted here for the consolidation calculation of the subsoil. The pile, geogrid and pavement (including base, subbase, and AC layer) were linearly elastic. Both gravel and solidified soil were simulated using the Mohr–Coulomb failure criterion. According to Huang et al. [34], the cohesion (c′) of cement-solidified soil increased obviously with increasing curing agents, while the friction angle changed slightly and the average was 38°. The internal friction angle ( φ ) of cement-solidified soil grains ranged from 30° to 45° [35]. According to Zhu et al. [36], the effective cohesion of the cement solidified intermediate-plasticity clay ranged from 10 to 110 kPa. Due to the cementation products and strong interlocking microstructure in the solidified matrix, the solidified soils possessed high cohesion and friction angle than the granular fill materials. In this work, the cohesion and friction angle of the solidified soil were taken as 75 kPa and 39°, respectively.

2.1.2. Simulation Procedure

A construction period of 135 days was adopted, including 125 days for embankment construction and 10 days for pavement construction. The load on the embankment and pavement increased linearly during construction period, as shown in Figure 2. The consolidation period lasted 630 days. The 300 dynamic traffic load cycles as reported by Zhuang and Wang [29], were applied at the top of the AC layer corresponding to dynamic traffic load period.

2.1.3. Dynamic Traffic Loading

In the literature, the dynamic traffic load was simulated as sinusoidal cyclic load [28,29,31] and calculated as follows:
P ( t ) = P 0 + P d sin ( w t )
P d = M 0 μ w r ( y ) w 2
w = 2 π v L
where P0 is static vehicle wheel load and assumed to a quarter of total vehicle load. M0 is the unsprung weight, with a value of 250 N · s2/m. μ w r ( y ) is the road roughness function, with a value of 2 mm according to the roughness of international expressway. v is the velocity of vehicles. L is the geometric curve wavelength of pavement, whose value is 6 m. t is the time of dynamic traffic load period. The static vehicle wheel load, unsprung weight, road roughness function, speed of the vehicles, etc., were taken into consideration in the calculation of the dynamic traffic load.
The vehicle wheel load was assumed to uniformly distribute in a rectangular zone according to Zhuang and Wang [29] and Huang [37]. It was applied to the top of the pavement, shown in Figure 1d. Different vehicle wheel loads were analyzed and shown in Table 3.
σ m = P ( t ) S
where σ m is stress of dynamic vehicle wheel load, kPa. S is the area of the rectangular zone 0.30 m × 0.24 m.

2.2. Parametric Analysis Scheme

Various factors were considered to investigate the effects on the total settlements and load transfer mechanism of solidified soil embankment. A series of 3D unit cell models with the variation in the cohesions (c′) and the friction angles (φ′) of solidified soil, the dynamic vehicle wheel loads (P0), the velocities of vehicles (v), the embankment heights (h) and the pile spacings (s) were performed, as shown in Table 4.

3. Results and Discussion

3.1. Model Validation

The results of gravel embankment under static and dynamic loads, corresponding to case A and case B, are shown in Figure 3. It is indicated that the total settlement and vertical stress of 3D unit cell models in this paper were basically consistent with the results of Zhuang and Wang [29], which has been verified by the field test results. In Figure 3a, the total settlements of pile in Case A and B modelling here were lower than that of the corresponding point in Zhuang and Wang’s models, with errors of 4%, 2.9% for static and dynamic loads, respectively, while the trend of the total settlement at the upper embankment was the opposite, with errors of 4.8% 3.4%, respectively. Figure 3b describes the distribution of the vertical stress along with the height of embankment. The vertical stress at point C (shown in Figure 1) was slightly overestimated, and the error of the vertical stress was 10.7%, 8.1%, within an acceptable range (15%). This error may be caused by the ‘tie boundary’ between geogrid and embankment. Overall, the parameters and settings of 3D unit cell models used here were reasonable and appropriate.

3.2. Effects of Gravel and Solidified Soil Embankment Materials

Figure 4 shows significant differences in the total settlements between gravel embankments and solidified soil embankments. Case A and Case B represented gravel embankments under static and dynamic traffic loads, respectively; and Case C and Case D represented solidified soil embankments under static and dynamic loads, respectively. The total settlements curves of Case A and B exhibited inverted ‘γ’ shape, whereas the total settlement curves of Case C and D exhibited oblique inverted ‘γ’ shape. The red dotted lines represented the equal settlement planes of embankments. In comparison to gravel embankments, the total settlements of solidified soil embankments decreased obviously, the differential settlements between the top of pile (point A in Figure 1) and subsoil (point C in Figure 1) reduced as well. For instance, at point C in Case A, the total settlement reached 139.0 mm, whereas in Case C, it diminished to mere 6.7 mm. This finding indicates that solidified soil could effectively reduce the total settlements of embankments over the pile and soft soil.
Figure 5 shows the distribution of the vertical stresses, along with the height of embankment. The vertical stress distribution exhibited a “Z” shape in the gravel embankment, aligning with the theoretical findings of Hewlett and Randolph [38]. Specifically, as a result of the gravitational forces exerted by the fill materials, the vertical stress initially increased until reaching its maximum value at the outer soil arch surface. Subsequently, the stress decreased to a minimum value due to the soil arching effect occurring at the inner soil arch surface. Finally, the stress rose again under the influence of gravity acting on the fill materials. In contrast, the solidified soil embankment displayed only an outer soil arch surface. This implies that, compared with the gravel embankment, there was a larger soil arch area in solidified soil embankments. Notably, the substantial vertical stresses were observed in the upper portion of solidified soil embankment. Subsequently, the vertical stresses decreased as the distance from the bottom of the embankment decreased under dynamic loads (Case D). The vertical stress in the upper embankments can be attributed to the additional stress transferred from the dynamic loads. Furthermore, the vertical stresses at the top of subsoil (point C) in solidified soil embankment were around 2–3 kPa, merely one-seventh of the corresponding stress observed in the gravel embankment.
The soil arch heights (hsa) in gravel and solidified soil embankments are equal to the height of equal settlement, and are shown in Table 5. As can be clearly seen, dynamic load resulted in a slight increase in soil arching height in gravel embankments, which was consistent with the results proposed by Zhuang and Wang [29]. Similarly, the variation in the soil arch height in the solidified soil embankments followed a similar pattern. Compared with gravel embankments, the soil arch height in solidified soil embankments was significantly reduced, regardless of whether the load was static or dynamic.
Figure 6 shows the variation in the axial force along the pile depth in gravel and solidified soil embankments. Within the height range of the pile cap, due to a sudden decrease in the cross-sectional area of the pile, the axial force increased. It is worth noting that the axial force exhibited a significant increase under dynamic load, particularly in the solidified soil embankment. This observation suggests that the piles bore the majority of the overlying load in the solidified soil embankments. The distribution patterns of axial force along the pile bodies varied depending on the embankment materials. Under the gravel embankments, the axial forces decreased with the increase of the pile depth. Conversely, under the solidified soil embankments, the axial force remained relatively constant throughout the pile depth. This may due to slight differential settlement between the piles and soft soil under solidified soil embankments.

3.3. Parametric Study

3.3.1. Effect of Cohesions of Solidified Soil

Figure 7 shows the effects of the cohesions on solidified soil embankment. The cohesions of solidified soil performed a crucial role in the total settlements of embankment in Figure 7a. When the cohesions were larger than 25 kPa, the total settlements were fairly small, and exhibited minimal changes with increasing cohesions. In contrast, when the cohesions were smaller than 25 kPa, the total settlements significantly increased. Significantly, the total settlements at point C with a cohesion of 10 kPa were approximately ten times larger than those observed at a cohesion of 75 kPa. Additionally, Figure 7b demonstrates the impact of cohesions on the vertical stress values in the upper part of the embankment. Larger cohesions contributed to higher vertical stress, resulting from the additional stresses of the pavement and traffic loads. The vertical stress remained relatively consistent at a depth of approximately 4.5 m, after which it increased with increasing embankment depth. Afterward, there was an obvious difference in the distribution of vertical stress among different cohesions.
When the cohesions were smaller than 25 kPa, the distribution of the vertical stress displayed a “Z” shape, which is similar to the distribution in gravel embankments. Conversely, the vertical stress gradually decreased to near 0 kPa at point C, in solidified soil with cohesions exceeding 25 kPa. It was observed that higher cohesions in the solidified soil led to a more apparent decrease in the soil arch heights.
Figure 7c,d show the total settlements distribution along with AB and AC (as shown in Figure 1). The total settlement within the pile cap range were particularly small under different cohesions. When the cohesions were less than or equal to 25 kPa, the total settlement at the edge of the pile cap increases sharply, while when the cohesion was greater than 25 kPa, it increased slightly. In Figure 7e, the axial force of the pile also exhibited a similar variation pattern with the total settlement along AC and AB. This is because the piles bear more embankment and vehicle loads with increasing the cohesions of the solidified soil embankment. There was an economical cohesion (25 kPa) for solidified soil embankments. The cohesions of solidified soil could be changed by adjusting the amount of curing agent.

3.3.2. Effect of Friction Angles of Solidified Soil

Figure 8 shows the effects of the friction angles of solidified soil on the total settlements, vertical stresses and axial force of solidified soil embankments. The total settlements of solidified soil embankment slightly decreased with the increase of the friction angle of solidified soil in Figure 8a. The total settlements of different friction angles of solidified soil embankment were still small compared to the total settlement in gravel embankment. In Figure 8b, the vertical stresses of the solidified soil embankment exhibited little change across different friction angles. Figure 8c,d show that as the friction angle increased, the total settlements along AB and AC slightly decreased, while the total settlements within the pile cap remained relatively unchanged. The axial force of the pile body slightly increased with increasing friction angles in Figure 8e. The effect of friction angles on total settlements is insignificant in solidified soil embankment. Lai et al. [39] pointed that the friction angle of the gravel embankment fill has a negligible effect on the formation and characteristics of the soil arching.

3.3.3. Effect of Vehicle Wheel Loads

Figure 9 shows the effects of different wheel loads on the total settlements, vertical stresses and axial forces of solidified soil embankments. As shown in Figure 9a, all the total settlements under different wheel loads were upside-down italicized ‘γ’-shaped. As the vehicle wheel load increased, the total settlements at point A and C also increased. However, the total settlements of the subsoil (at point C) under different loads were still small. Furthermore, differential settlements were observed on the top surface of the embankment, and these differentials rose as the vehicle wheel loads increased. These differential settlements may cause tensile stress in the pavement. In Figure 9a, the largest total settlement was 17.5 mm, which was only about one eighth of the total settlement in gravel embankment. The total settlements of solidified soil embankment remained small, even under heavy loads. This indicates that solidified soil embankments possess the ability to withstand heavy wheel loads with minimal settlement. Figure 9b shows that increasing vehicle loads led to a remarkable increase of the vertical stress on the upper part of embankment. The maximum value of the vertical stresses also increased with increasing vehicle loads. There was little change in the vertical stresses at point C, which remained around 0 kPa. However, the axial force significantly increased, as the vehicle loads increased in Figure 9e. Furthermore, the height of soil arch increased with increasing vehicle loads shown in Table 6. When the vehicle loads increased in solidified soil embankment, more loads were transferred to pile due to increasing soil arching height. It is indicated that the pile undertook the majority of embankment and dynamic loads, while the soft soil surrounding the pile contributes less to the load-bearing capacity. Figure 9c,d shows that all total settlements along AB and AC increased with increasing vehicle loads. The differential settlements between point C and point A increased as well. For instance, when the wheel loads increased from 25 kN to 137.5 kN, the total settlements of subsoil (point C) increased from 6 mm to 15 mm. This slight increase means that only a small portion of the load transferred to the soft soil. The total settlements in solidified soil embankment were within acceptable range compared to the gravel embankment.

3.3.4. Effect of Velocities

The total settlements and vertical stresses were almost identical under different velocities (i.e., 30 km/h, 60 km/h, 120 km/h). Only the total settlements are presented in Figure 10. The total settlements of different velocities overlapped with each other. This means that the velocities have minimal influence on the behavior of the solidified soil embankment.

3.3.5. Effect of Embankment Heights

Figure 11 shows the effects of embankment heights on the total settlements, vertical stresses and axial forces of solidified soil embankments. As shown in Figure 11a, increasing the height of embankment led to an increase of the total settlements. The maximum settlements were still within 20 mm, even though the height of solidified soil embankment achieved at 9.5 m. In Figure 11b, the vertical stresses significantly increased, and the distribution curves of the vertical stresses were similar. It is noteworthy that the vertical stress at the bottom of the embankment remained almost constant, ranging from 2 to 3 kPa. The total settlements along AC and AB increased with increasing embankment heights, as shown in Figure 11c,d. The axial forces had a remarkable increase as the heights of solidified soil embankment increased in Figure 11e. The overlying loads over the soft soil were transferred into pile through the soil arch in embankment. Therefore, solidified soil could be applicable to high embankment within acceptable settlement range, as long as the load undertaken by pile is within bearing capacity of pile.

3.3.6. Effect of Pile Spacings

Figure 12 shows the effects of pile spacings on solidified soil embankments. As the pile spacing increased, the total settlements increased significantly in Figure 12a. When the pile spacing increased from 2.5 m to 5.5 m, the total settlement at the top of the embankment increased from 11 mm to 64 mm. With increasing pile spacing, the vertical stress decreased obviously, and there was a notable change in the distribution of the vertical stresses in Figure 12b. Notably, the vertical stress at point C remained relatively small. The total settlements along AC and AB, including the part belonging to the pile, also increased with the increasing pile spacing shown in Figure 12c,d. The axial force increased obviously with the increasing pile spacing in Figure 12e, meaning that more loads were transferred to the piles.

3.3.7. Multiple Regression Analysis of the Heights of Soil Arch

The heights of the soil arch (hsa) are equal to the height of equal settlement in the embankment, and are shown in Appendix A. When the ratio of the embankment height to pile spacing was greater than 1.5, the soil arch existed, which was consistent with the results of Cui et al. [40]. The data in Appendix A were analyzed by multiple regression analysis. The variance inflation factor scores could assess the multicollinearity of the different parameters. The results of the variance inflation factor scores indicated that the friction angles of solidified soil and vehicle velocities were multicollinear with other parameters. Based on previous analyses, it can be seen that the vehicle speeds and friction angles have a little effect on the vertical stress distribution. The relationship among hsa and various parameters was as follows:
hsa = −0.0068 c′ + 0.7188 s + 0.1047 h + 0.0031 P0 + 0.2188

4. Conclusions

The existing research has primarily focused on pile-supported gravel embankments. The ability of solidified soil used as embankment filling materials has been verified, and a clear view on the performance of solidified soil embankments on piled foundation is still lacking. Therefore, this study aims to provide an insightful interpretation of solidified soil embankments. Based on the results, the following conclusions are drawn.
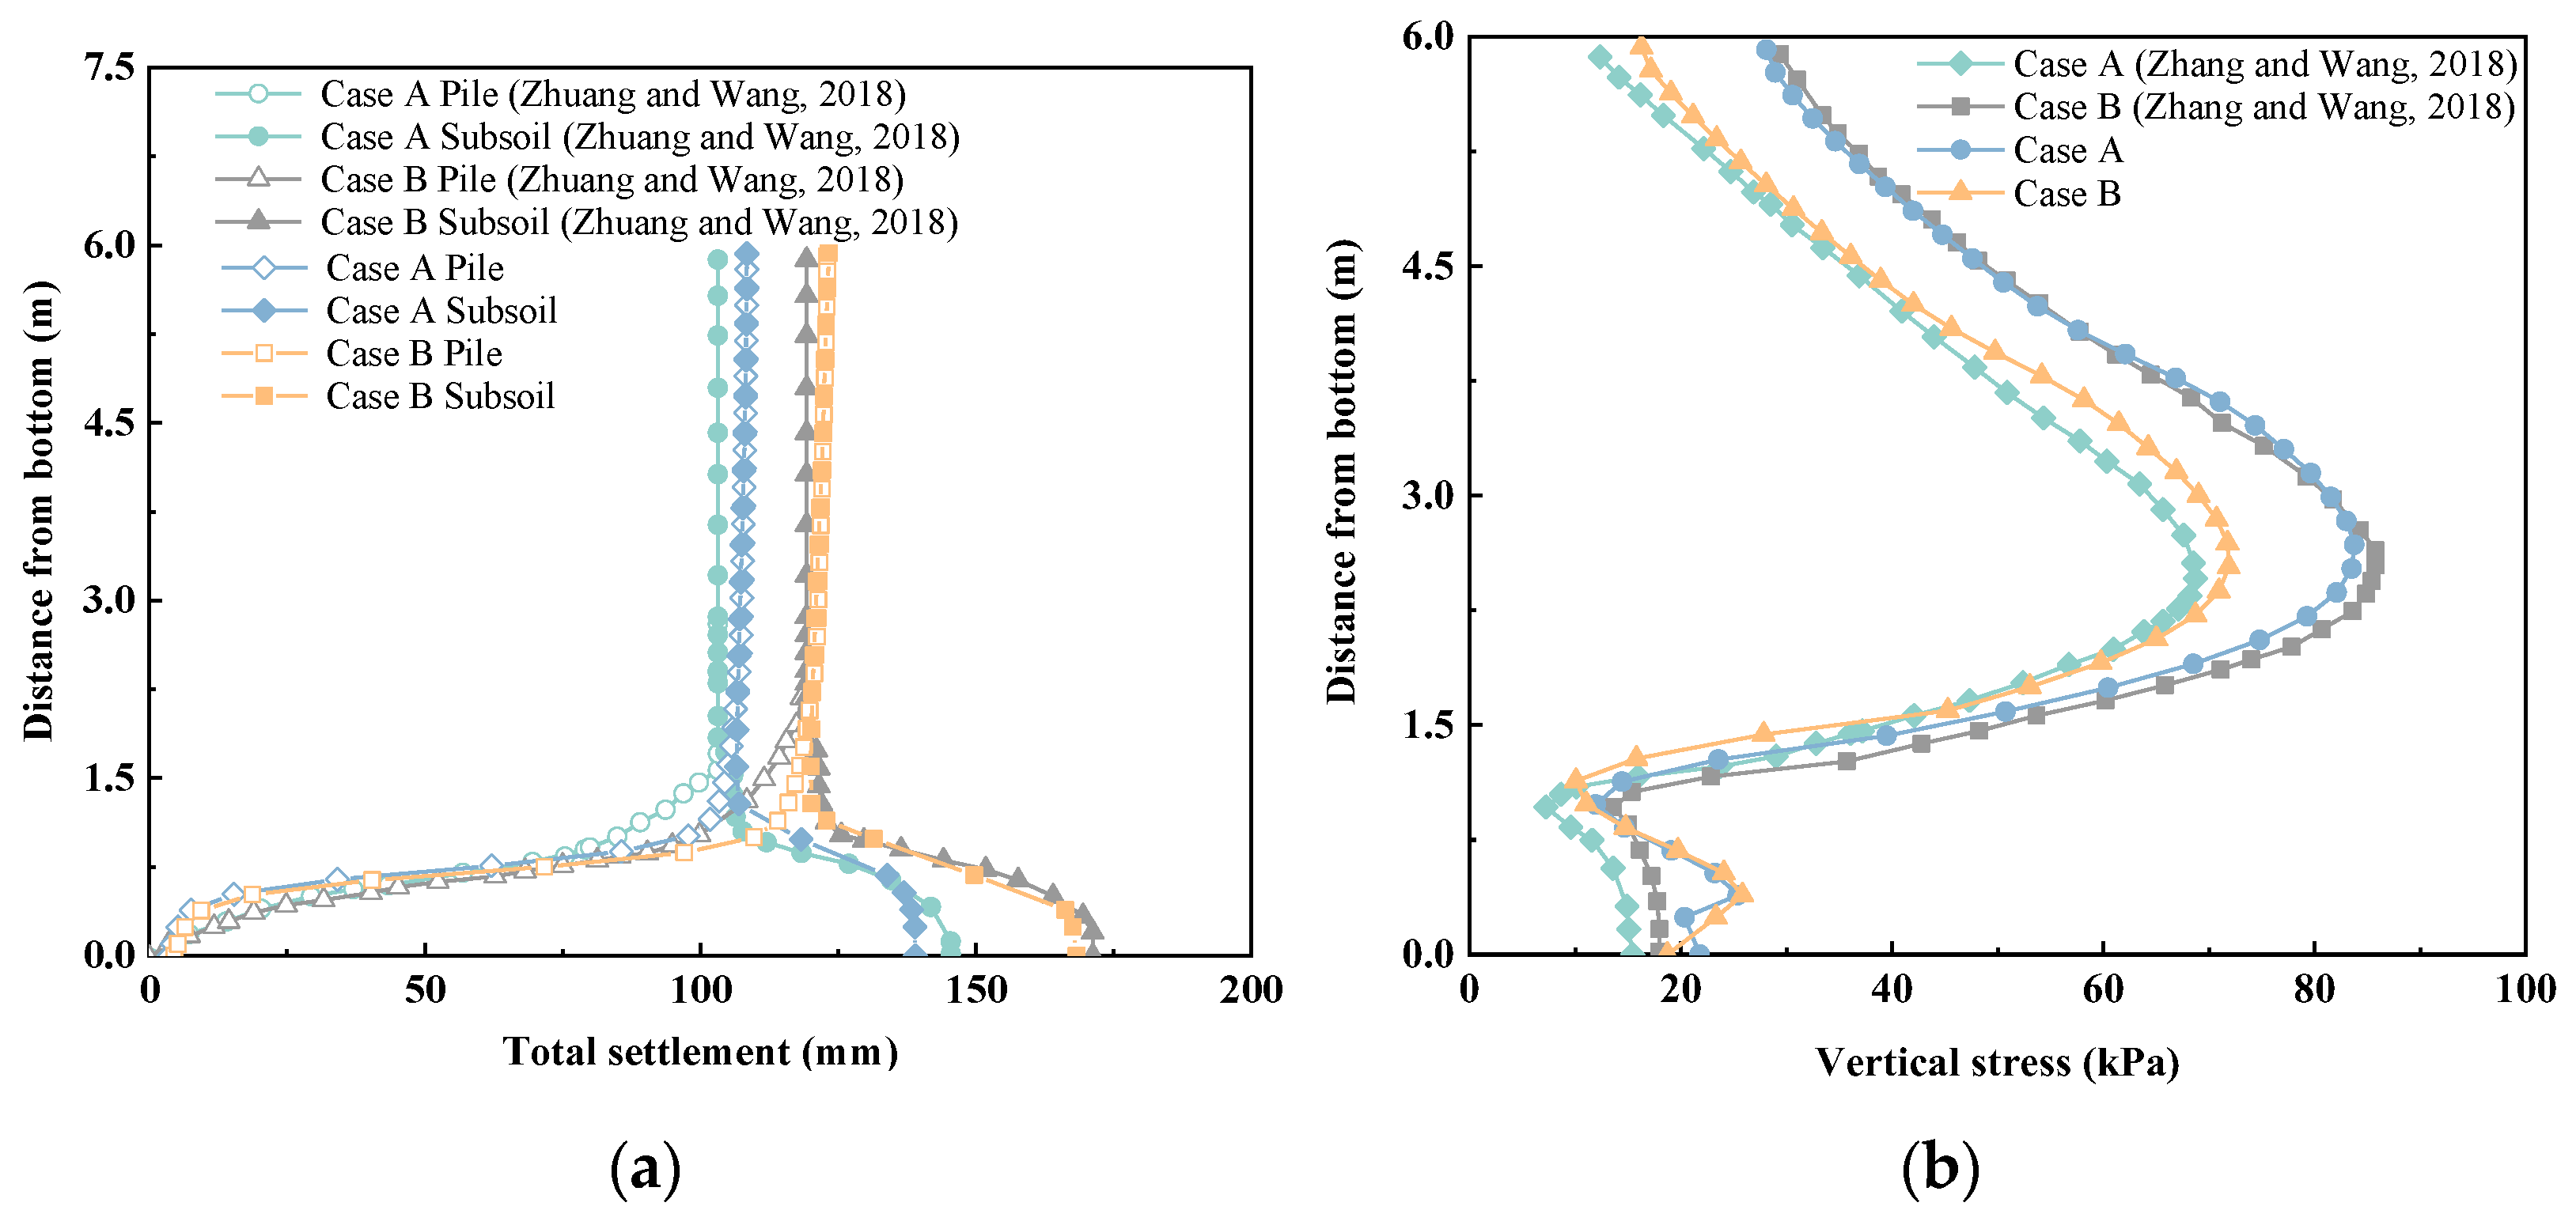
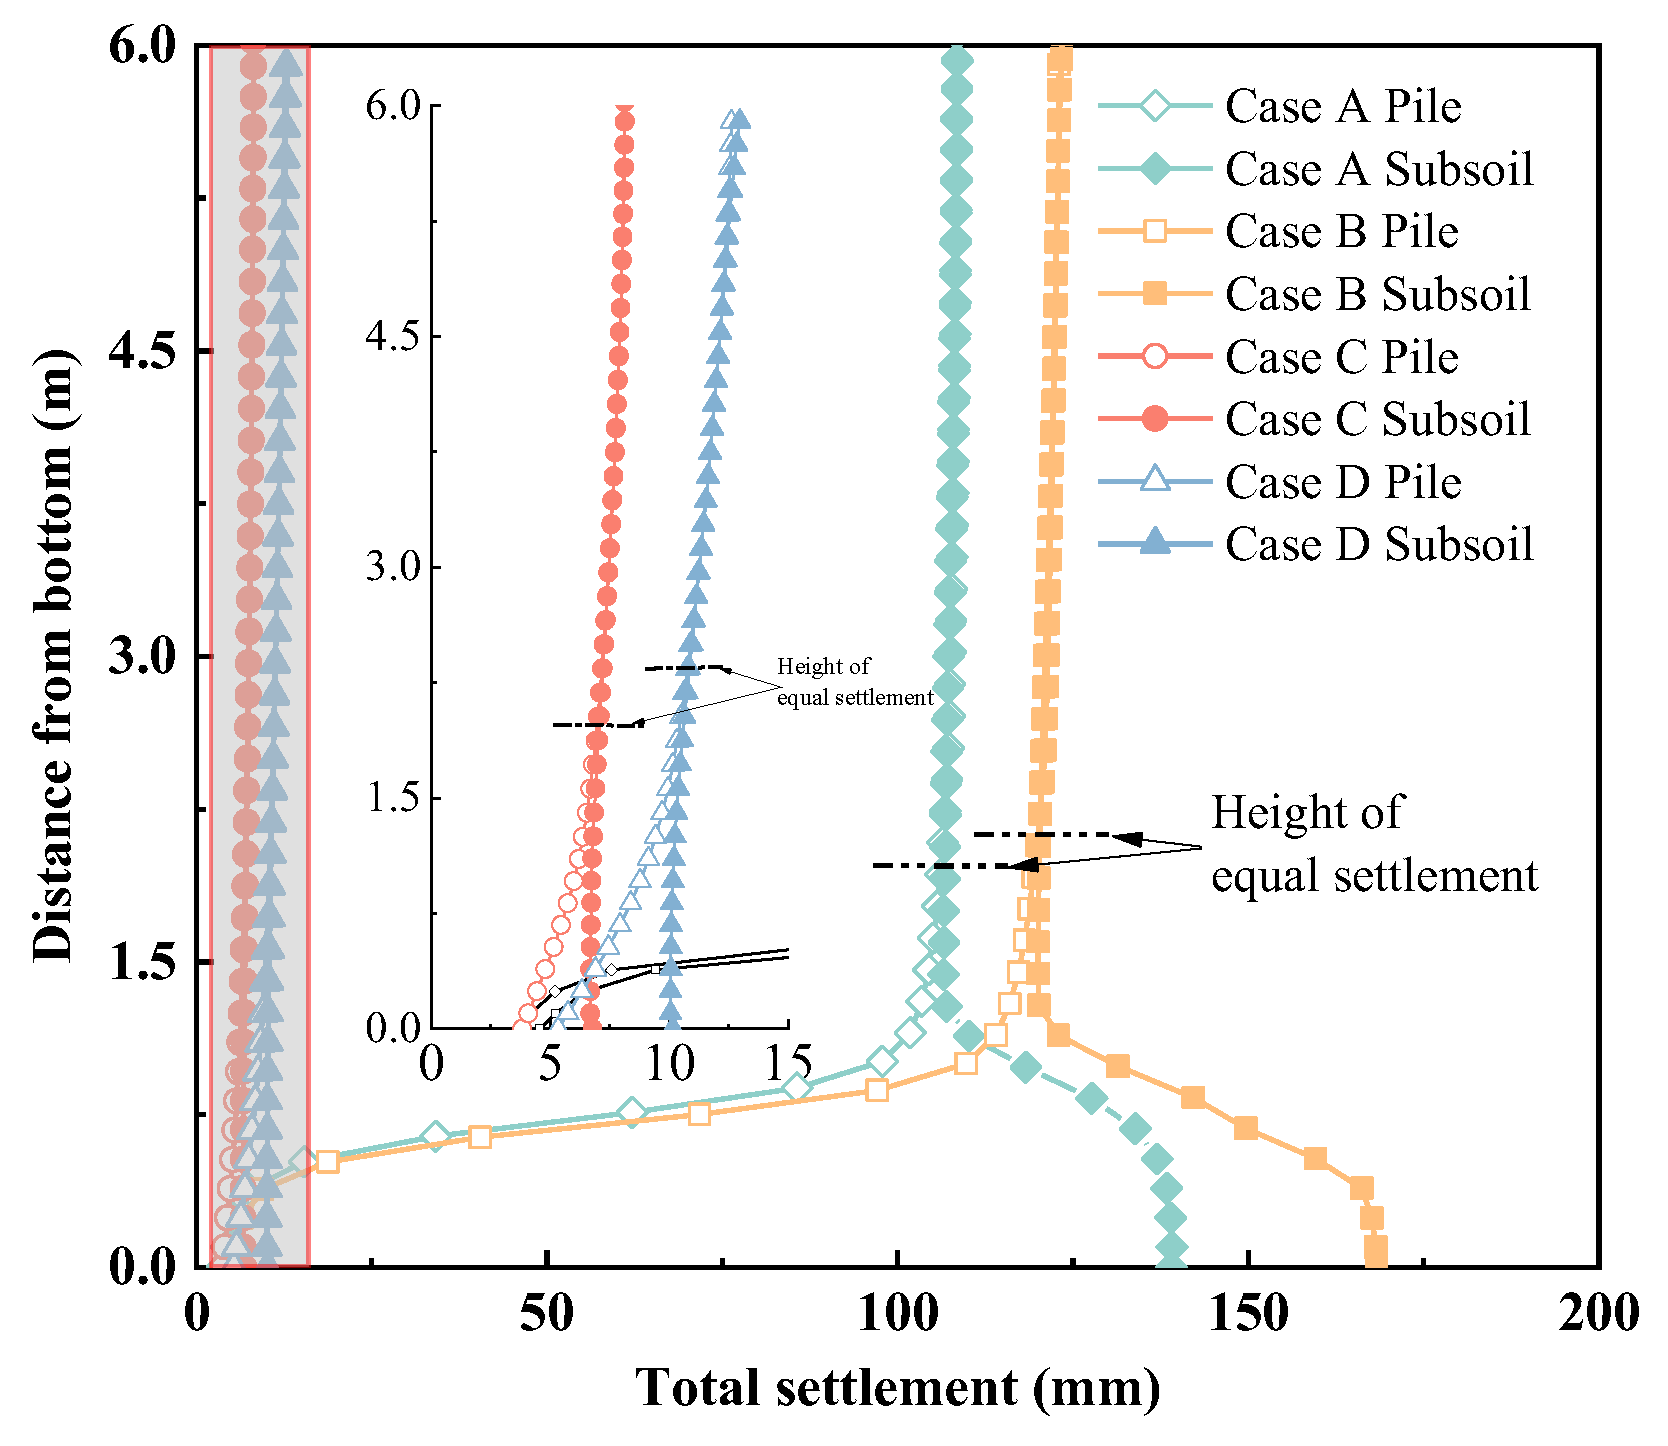
The total settlements and vertical stresses under dynamic loads were larger than those under static loads both in gravel and in solidified soil embankments. Compared with gravel embankments, the total settlements in solidified soil embankment reduced significantly. When the filling height was 6.5 m, the total settlements at the top of the subsoil in the solidified soil embankment was only one-tenth of that at the top of subsoil in the gravel embankment. Compared with gravel embankments, the heights of the outer soil arch plane in solidified soil embankments reduced under static and dynamic loads.
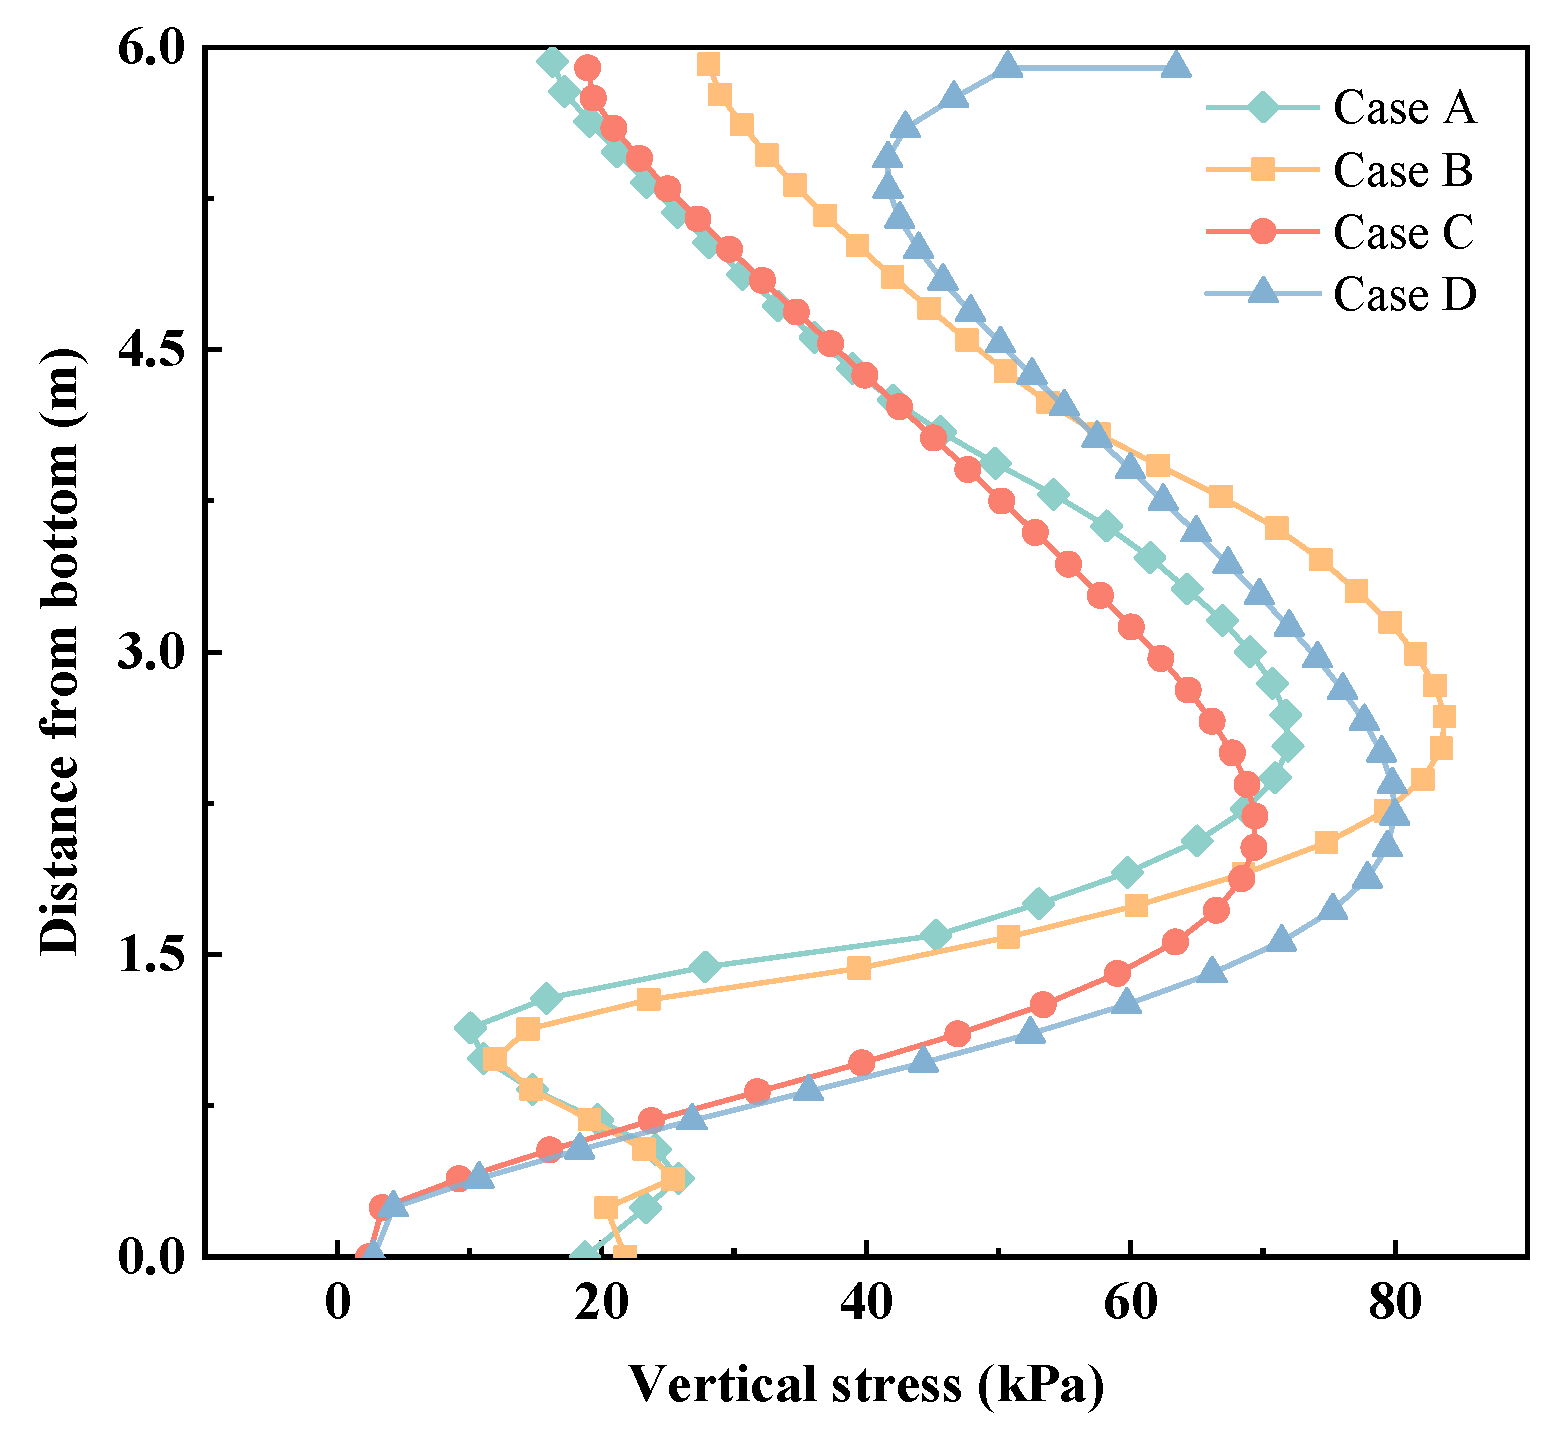
As the cohesion of solidified soil increased, the total settlements of the solidified soil embankment decreased significantly, and the soil arch height showed a decreasing trend. It is worth noting that there was an optimal and economical cohesion of 25 kPa.
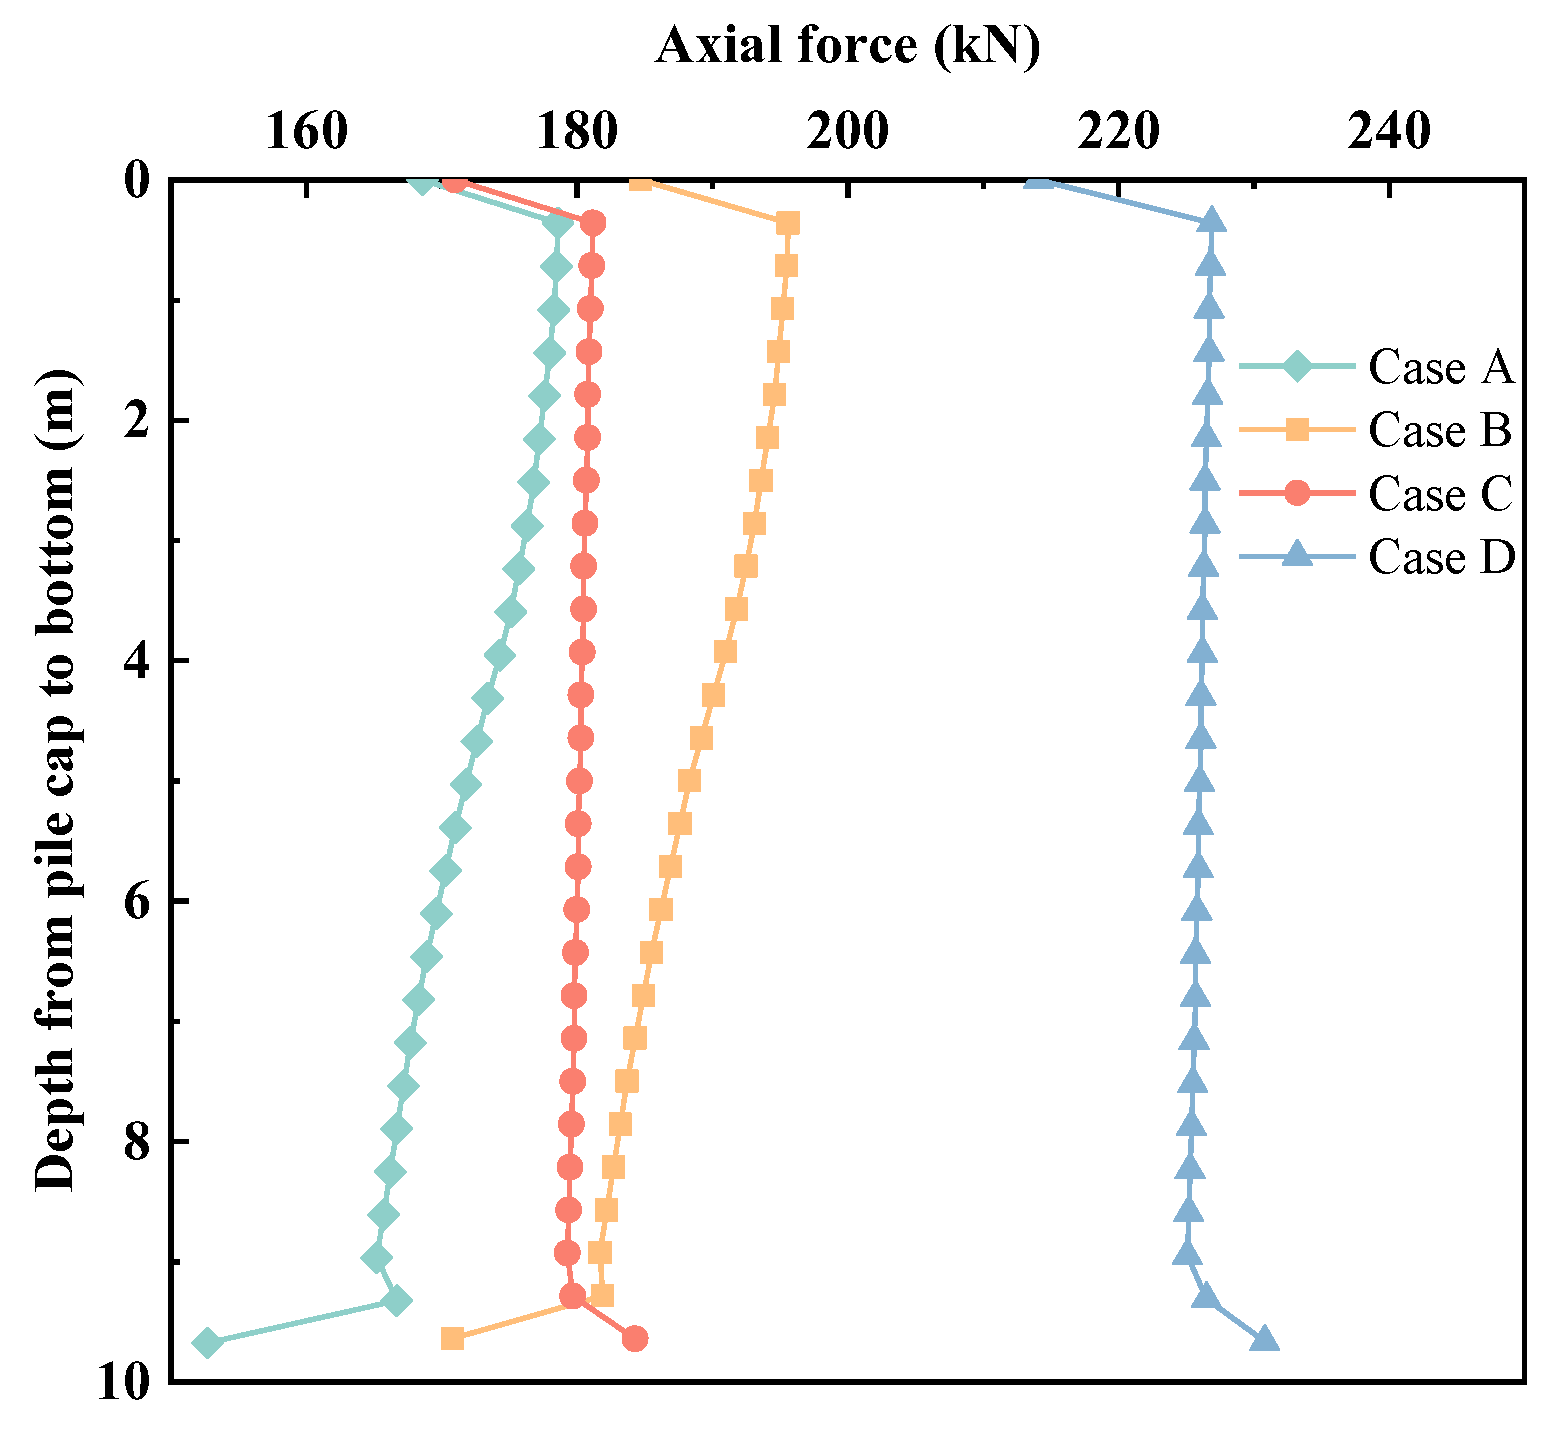
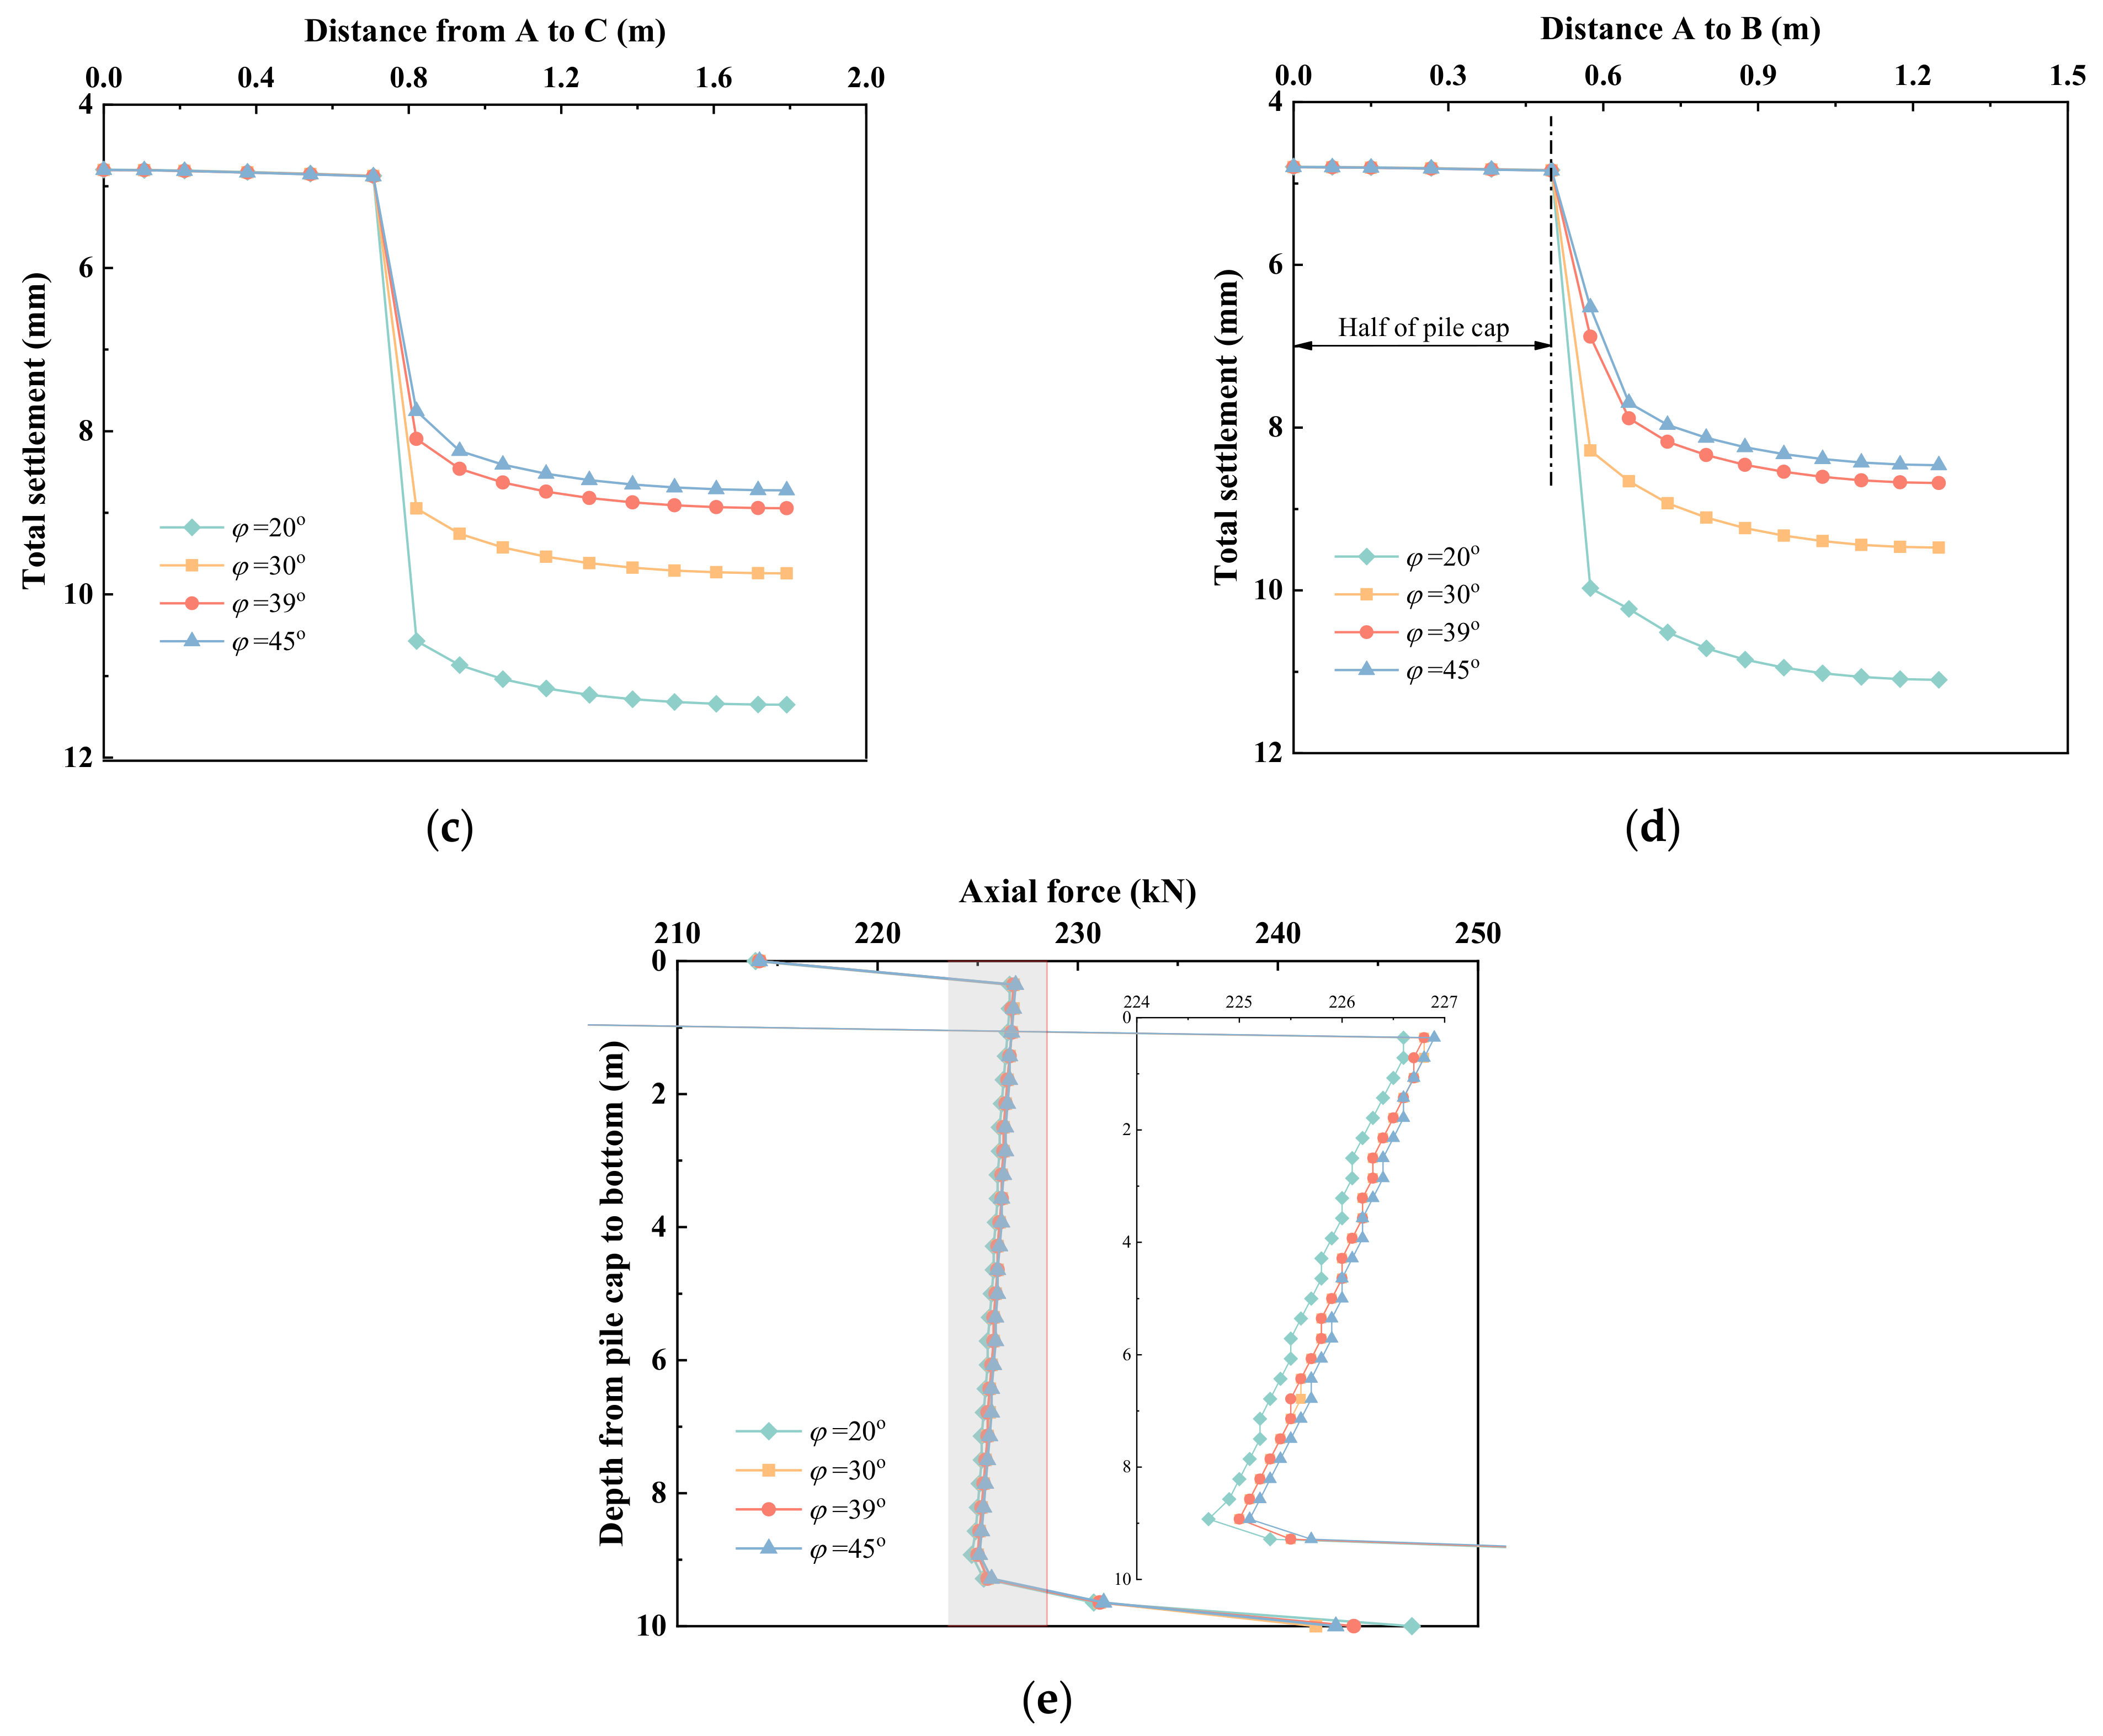
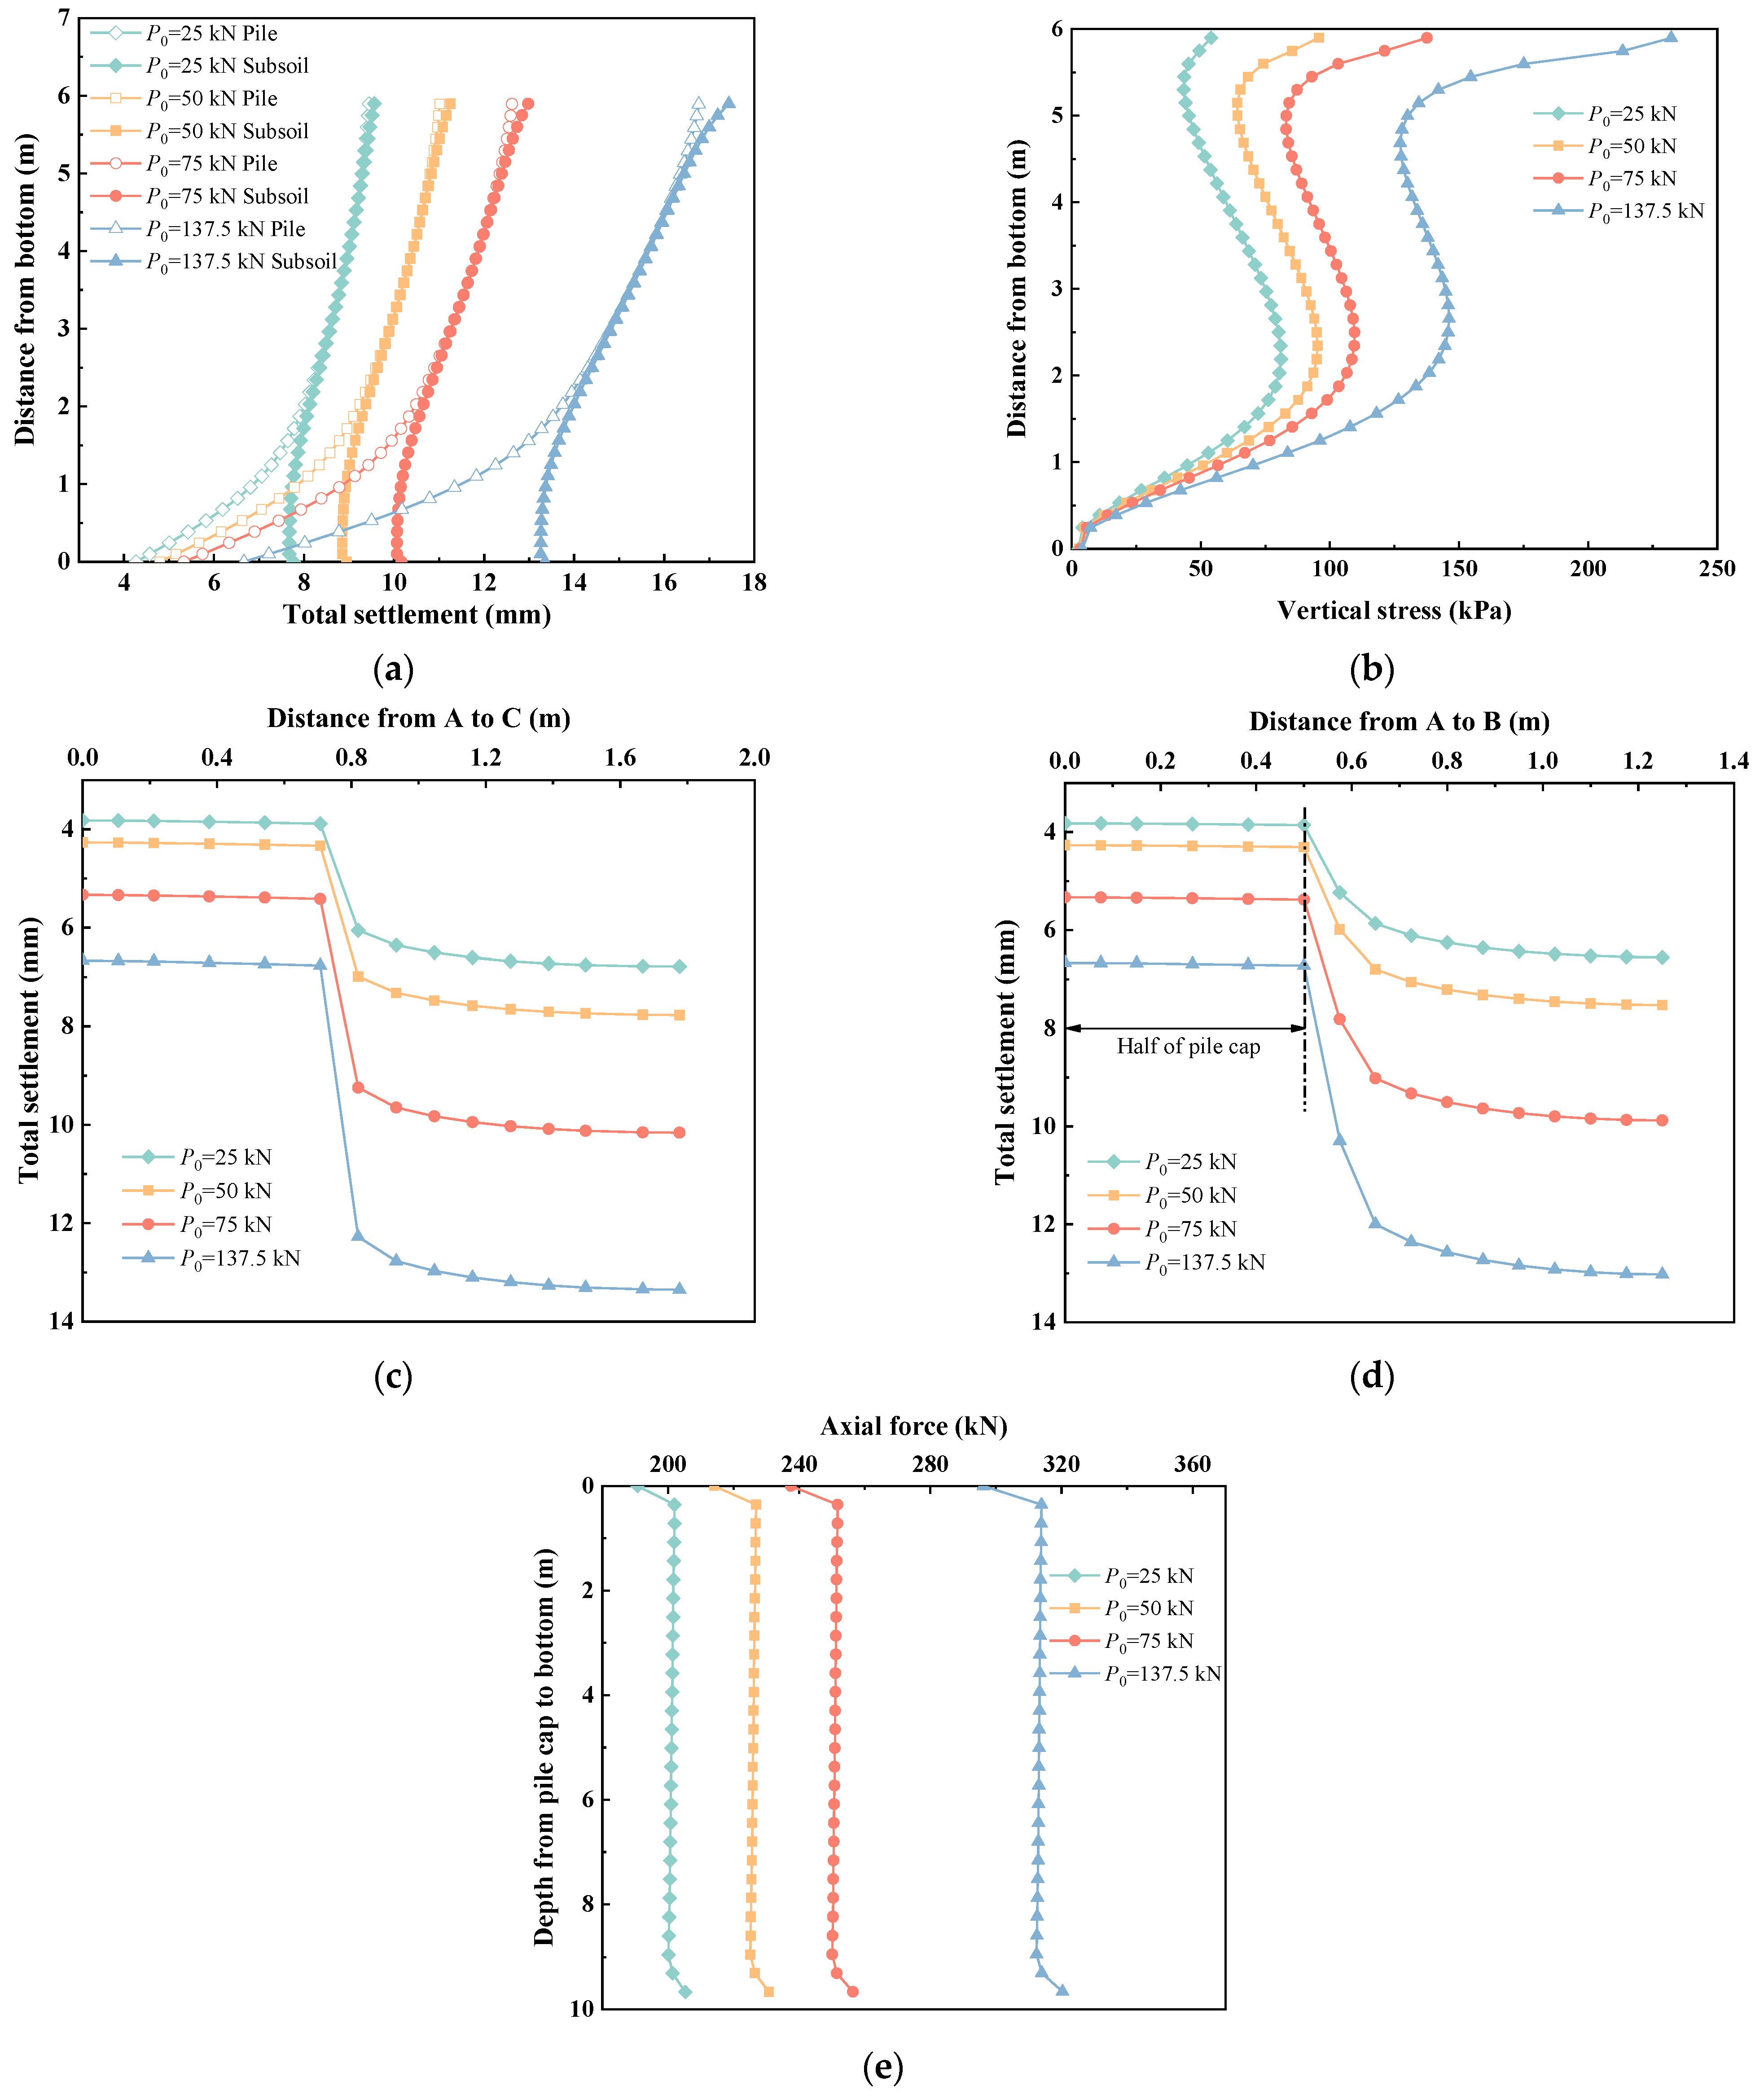
The friction angels of solidified soil have little effect on the total settlements and vertical stresses of solidified soil embankments. An increase in the filling heights results in an increase in vertical stress, although the settlements only exhibited a slight increase. In addition, the total settlements significantly increased as the pile spacings increased, because more loads were transferred to pile cap from the soil. Therefore, the heights of fill and pile spacings could be appropriately increased in piled solidified soil embankment, as long as the loads on the pile cap are within the bearing capacity of piles.

Author Contributions

Conceptualization, Q.G.; Methodology, Software, Q.G. and B.L.; Writing—original draft preparation, Q.G.; Resources, B.L. and Z.Y.; Writing—review and editing, Q.G., B.L. Z.Y. and J.X. All authors have read and agreed to the published version of the manuscript.

Funding

This research was funded by the Central University Basic Research Fund of China (No. B200203083), the National Natural Science Foundation of China (No. 52178327, No. 52308348), and Graduate Research and Innovation Projects of Jiangsu Province (No. KYCX20_0438).

Institutional Review Board Statement

Not applicable.

Informed Consent Statement

Not applicable.

Data Availability Statement

The input file of the 3D unit cell model is freely available at https://github.com/qianqianGuo006/3D_unit_cell_model (accessed on 5 April 2024).

Conflicts of Interest

The authors declare no conflicts of interest.

Appendix A

Table A1. The heights of soil arch at different parameters.
c′ (kPa)s (m)h (m)P0 (kN)hsa (m)h/s
52.56.5252.832.6
102.56.5252.822.6
252.56.5252.662.6
502.56.5252.342.6
752.56.5252.192.6
52.56.5502.832.6
102.56.5502.822.6
252.56.5502.662.6
502.56.5502.502.6
752.56.5502.342.6
52.56.5752.992.6
102.56.5752.822.6
252.56.5752.812.6
502.56.5752.662.6
752.56.5752.502.6
52.56.5137.52.992.6
102.56.5137.52.982.6
252.56.5137.52.972.6
502.56.5137.52.812.6
752.56.5137.52.662.6
752.55.5502.202.6
753.55.5503.251.6
754.55.550/1.2
755.55.550/1.0
753.56.5503.071.9
754.56.550/1.4
755.56.550/1.2
752.57.5502.373.0
753.57.5503.272.1
754.57.5503.881.7
755.57.550/1.4
752.58.5502.503.4
753.58.5503.402.4
754.58.5504.001.9
755.58.5504.601.5
752.59.5502.633.8
753.59.5503.532.7
754.59.5504.132.1
755.59.5504.701.7
502.56.5502.342.6

References

  1. Sharma, A.; Shrivastava, N. Settlement behavior of recycled construction and demolition waste aggregates with sandy soil by performing laboratory model plate load test. Transp. Infrastruct. Geotechnol. 2023, 11, 303–326. [Google Scholar] [CrossRef]
  2. Li, C.; Wang, S.; Ding, J.; Zhang, S.; Gao, M. Mechanical and microstructural properties of lime-treated excavated soil improved with different industry by-products. Constr. Build. Mater. 2024, 419, 135507. [Google Scholar] [CrossRef]
  3. Jamsawang, P.; Charoensil, S.; Namjan, T.; Jongpradist, P.; Likitlersuang, S. Mechanical and microstructural properties of dredged sediments treated with cement and fly ash for use as road materials. Road Mater. Pavement 2020, 22, 2498–2522. [Google Scholar] [CrossRef]
  4. Niu, W.; Guo, B.; Li, K.; Ren, Z.; Zheng, Y.; Liu, J.; Lin, H.; Men, X. Cementitous material based stabilization of soft soils by stabilizer: Feasibility and durabiliy assessment. Constr. Build. Mater. 2024, 425, 136046. [Google Scholar] [CrossRef]
  5. Chew, S.H.; Kamruzzaman, A.H.M.; Lee, F.H. Physicochemical and engineering behavior of cement treated clays. J. Geotech. Geoenviron. 2004, 130, 696–706. [Google Scholar] [CrossRef]
  6. Huang, Y.H.; Zhu, W.; Qian, X.D.; Zhang, N.; Zhou, X.Z. Change of mechanical behavior between solidified and remolded solidified dredged materials. Eng. Geol. 2011, 119, 112–119. [Google Scholar] [CrossRef]
  7. Gupta, D.; Kumar, A. Performance evaluation of cement-stabilized pond ash-rice husk ash-clay mixture as a highway construction material. J. Rock. Mech. Geotech. 2017, 9, 159–169. [Google Scholar] [CrossRef]
  8. Vukicevic, M.; Popovic, Z.; Despotovic, J.; Lazarevic, L. Fly ash and slag utilization for the Serbian railway substructure. Transport 2018, 33, 389–398. [Google Scholar] [CrossRef]
  9. Vukicevic, M.; Marjanovic, M.; Pujevic, V.; Jockovic, S. The alternatives to traditional materials for subsoil stabilization and embankments. Materials 2019, 12, 3018. [Google Scholar] [CrossRef]
  10. Chen, L.; Liu, S.Y.; Du, Y.J.; Jin, F. Unconfined compressive strength properties of cement solidified/stabilized lead-contaminated soils. Chin. J. Geotech. Eng. 2010, 32, 1898–1903. [Google Scholar]
  11. Tebaldi, G.; Orazi, M.; Orazi, U.S. Effect of freeze—Thaw cycles on mechanical behavior of lime-stabilized soil. J. Mater. Civil. Eng. 2016, 28, 06016002. [Google Scholar] [CrossRef]
  12. Du, Y.J.; Jiang, N.J.; Liu, S.Y.; Horpibulsuk, S.; Arulrajah, A. Field evaluation of soft highway subgrade soil stabilized with calcium carbide residue. Soils Found. 2016, 56, 301–314. [Google Scholar] [CrossRef]
  13. Zhang, T.; Cai, G.J.; Liu, S.Y. Application of lignin-based by-product stabilized silty soil in highway subgrade: A field investigation. J. Clean. Prod. 2017, 142, 4243–4257. [Google Scholar] [CrossRef]
  14. Feng, R.; Wu, L.; Liu, D.; Wang, Y.; Peng, B. Lime- and cement-treated sandy lean clay for highway subgrade in China. J. Mater. Civil. Eng. 2020, 32, 04019335. [Google Scholar] [CrossRef]
  15. Zheng, G.; Jiang, Y.; Han, J.; Liu, Y. Performance of cement-fly ash-gravel pile-supported high-speed railway embankments over soft marine clay. Mar. Georesources Geotechnol. 2011, 29, 145–161. [Google Scholar] [CrossRef]
  16. Wang, K.; Ye, J.; Wang, X.; Qiu, Z. The soil-arching effect in pile-supported embankments: A review. Buildings 2024, 14, 126. [Google Scholar] [CrossRef]
  17. Pham, H.V.; Dias, D.; Dudchenko, A. 3D modeling of geosynthetic-reinforced pile-supported embankment under cyclic loading. Geosynth. Int. 2020, 27, 157–169. [Google Scholar] [CrossRef]
  18. Zhuang, Y.; Cui, X.Y.; Zhang, S.; Dai, G.L.; Zhao, X.L. The load transfer mechanism in reinforced piled embankment under cyclic loading and unloading. Eur. J. Environ. Civ. Eng. 2020, 26, 1364–1378. [Google Scholar] [CrossRef]
  19. Low, B.; Tang, S.; Choa, V. Arching in piled embankments. J. Geotech. Eng. 1994, 120, 1917–1938. [Google Scholar] [CrossRef]
  20. Meena, N.K.; Nimbalkar, S.; Fatahi, B.; Yang, G. Effects of soil arching on behavior of pile-supported railway embankment: 2D FEM approach. Comput. Geotech. 2020, 123, 103601. [Google Scholar] [CrossRef]
  21. Vlček, J.; Drusa, M.; Gago, F.; Mihálik, J. Analysis of a large-scale physical model of geosynthetic-reinforced piled embankment and analytical design methods. Buildings 2023, 13, 1464. [Google Scholar] [CrossRef]
  22. Pham, T.A.; Wijesuriya, K.; Dias, D. Analytical model for the design of piled embankments considering cohesive soils. Geosynth. Int. 2022, 29, 369–388. [Google Scholar] [CrossRef]
  23. Okyay, U.; Dias, D. Use of lime and cement treated soils as pile supported load transfer platform. Eng. Geol. 2010, 114, 34–44. [Google Scholar] [CrossRef]
  24. Van Eekelen, S.J.M.; Bezuijen, A.; Van Tol, A.F. Validation of analytical models for the design of basal reinforced piled embankments. Geotext. Geomembr. 2015, 43, 56–81. [Google Scholar] [CrossRef]
  25. Eskişar, T.; Otani, J.; Hironaka, J. Visualization of soil arching on reinforced embankment with rigid pile foundation using X-ray CT. Geotext. Geomembr. 2012, 32, 44–54. [Google Scholar] [CrossRef]
  26. Wu, G.; Zhao, M.; Zhang, C. Investigation on the evolution of soil arching in cohesive soils using a DIC technique. Int. J. Geomech. 2024, 24, 04023270. [Google Scholar] [CrossRef]
  27. Yoo, C.; Kim, S.B. Numerical modeling of geosynthetic-encased stone column-reinforced ground. Geosynth. Int. 2009, 16, 116–126. [Google Scholar] [CrossRef]
  28. Zhuang, Y.; Li, S. Three-dimensional finite element analysis of arching in a piled embankment under traffic loading. Arab. J. Geosci. 2015, 8, 7751–7762. [Google Scholar] [CrossRef]
  29. Zhuang, Y.; Wang, K.Y. Finite element analysis on the dynamic behavior of soil arching effect in piled embankment. Transp. Geotech. 2018, 14, 8–21. [Google Scholar] [CrossRef]
  30. Pham, T.A.; Tran, Q.-A.; Villard, P.; Dias, D. Numerical analysis of geosynthetic-reinforced and pile-supported embankments considering integrated soil-structure interactions. Geotech. Geol. Eng. 2023, 42, 185–206. [Google Scholar] [CrossRef]
  31. Pham, H.V.; Dias, D. 3D numerical modeling of a piled embankment under cyclic loading. Int. J. Geomech. 2019, 19, 04019010. [Google Scholar] [CrossRef]
  32. Ding, X.; Zhao, J.; Ou, Q.; Liu, J. Numerical analysis of geosynthetic-reinforced embankment performance under moving loads. J. Rock. Mech. Geotech. 2024, 16, 682–696. [Google Scholar] [CrossRef]
  33. Zhuang, Y.; Ellis, E.; Yu, H.S. Three-dimensional finite-element analysis of arching in a piled embankment. Géotechnique 2012, 62, 1127–1131. [Google Scholar] [CrossRef]
  34. Huang, Y.H.; Zhu, W.; Zhang, C.L.; Wang, S.C.; Ohki, T. Mechanical characteristics and strength source of remolded solidified dredged material. Rock Soil Mech. 2009, 30, 1352–1356. [Google Scholar]
  35. Shinsha, H.; Kumagai, T. Material properties of solidified soil grains produced from dredged marine clay. Soils Found. 2018, 58, 678–688. [Google Scholar] [CrossRef]
  36. Zhu, W.; Huang, Y.; Zhang, C.; Liu, Q. Effect of curing time on mechanical behavior of crushed solidified dredged material. In Proceedings of the GeoCongress 2008: Characterization, Monitoring, and Modeling of GeoSystems, New Orleans, LA, USA, 9–12 March 2008; pp. 597–604. [Google Scholar]
  37. Huang, Y.H. Pavement Analysis and Design; Pearson/Prentice Hall: Upper Saddle River, NJ, USA, 2004; p. 800. [Google Scholar]
  38. Hewlett, W.J.; Randolph, M.F. Analysis of piled embankments. Ground Eng. 1988, 21, 12–18. [Google Scholar]
  39. Lai, H.; Zheng, J.; Zhang, R.; Cui, M. Visualization of the formation and features of soil arching within a piled embankment by discrete element method simulation. J. Zhejiang Univ.-Sci. A 2016, 17, 803–817. [Google Scholar] [CrossRef]
  40. Cui, X.Y.; Zhuang, Y.; Ning, S.; Wang, K.Y. An analytical method to calculate the settlement of reinforced piled embankment considering three-dimensional deformed geogrid. Eur. J. Environ. Civil. Eng. 2022, 26, 3648–3661. [Google Scholar] [CrossRef]
Figure 1. Layout of numerical model: (a) cross section, (b) plan view, (c) elevation view, (d) mesh.
Applsci 14 04464 g001
Figure 2. Schematic diagram of loading process.
Applsci 14 04464 g002
Figure 3. 3D unit cell models validation results along with the height of embankment: (a) total settlements [29], (b) vertical stress [29].
Applsci 14 04464 g003
Figure 4. The settlements along the height of embankment for different filling materials.
Applsci 14 04464 g004
Figure 5. Distribution of the vertical stresses along with the height of embankment.
Applsci 14 04464 g005
Figure 6. The axial force along the depth of pile for different embankment materials.
Applsci 14 04464 g006
Figure 7. The effects of the cohesion on solidified soil embankment: (a) total settlement along the depth of embankment, (b) vertical stress, (c) total settlement along AC, (d) total settlement along AB, (e) axial force along the depth of pile.
Applsci 14 04464 g007
Figure 8. The effects of friction angles on the solidified soil embankment: (a) total settlement along the depth of embankment, (b) vertical stress, (c) total settlement along AC, (d) total settlement along AB, (e) axial force along the depth of the pile.
Applsci 14 04464 g008aApplsci 14 04464 g008b
Figure 9. The effects of wheel loads on solidified soil embankment: (a) total settlement along the depth of embankment, (b) vertical stress, (c) total settlement along AC, (d) total settlement along AB, (e) axial force along the depth of the pile.
Applsci 14 04464 g009
Figure 10. Total settlements along the depth of the embankment under different velocities.
Applsci 14 04464 g010
Figure 11. The effects of embankment heights on solidified soil embankments: (a) total settlements along the depth of embankment, (b) vertical stress, (c) total settlements along AC, (d) total settlements along AB, (e) axial forces along the depth of the pile.
Applsci 14 04464 g011aApplsci 14 04464 g011b
Figure 12. The effects of pile spacings on solidified soil embankments: (a) total settlements along the depth of embankment, (b) vertical stress, (c) total settlements along AC, (d) total settlements along AB, (e) axial forces along the depth of pile.
Applsci 14 04464 g012
Table 1. Load types and embankment materials in 3D unit cell models.
Load TypesEmbankment Materials
Case AStatic loadsGravel
Case BDynamic traffic loadsGravel
Case CStatic loadsSolidified soil
Case DDynamic traffic loadsSolidified soil
Table 2. Summary of material parameters.
Materialsh (m)γ (kN/m3) c (kPa) φ (°)E (MPa)μλκM
AC layer0.1521.0//40000.25///
Base0.2020.0//10000.25///
Subbase0.2518.0//5000.25///
Gravel embankment5.917.0130250.20///
Solidified soil embankment5.917.075391000.20///
Pile10.017.0//20,0000.20///
Subsoil10.017.0/26/0.300.30.11.03
GeogridTensile stiffness J = 3 MN/m, μ = 0
Table 3. Different vehicle wheel loads.
Vehicle-10Vehicle-20Vehicle-30Vehicle-55
Total load (kN)100200300550
P0 (kN)255075137.5
Table 4. Summary of parametric analysis factors.
Parametersc′ (kPa)φ′ (°)s (m)v (km/h)P0 (kN)h (m)
5, 10, 25, 50, 75392.560505.9
7520, 30, 39, 452.560505.9
75392.5, 3.5, 4.5, 5.560505.9
75392.530, 60, 120505.9
75392.56025, 50, 75, 137.55.9
75392.560504.9, 5.9, 6.9, 7.9, 8.9
Table 5. The heights of the soil arch (m).
Materials TypeStatic LoadDynamic Load
Gravel2.532.68
Solidified soil2.192.34
Table 6. The soil arching heights of different vehicle loads.
Vehicle load P0 (kN)255075137.5
Soil arching height hsa (m)2.192.342.502.66
Disclaimer/Publisher’s Note: The statements, opinions and data contained in all publications are solely those of the individual author(s) and contributor(s) and not of MDPI and/or the editor(s). MDPI and/or the editor(s) disclaim responsibility for any injury to people or property resulting from any ideas, methods, instructions or products referred to in the content.

