
Aging Impairs Unimanual and Bimanual Hand-Grip Force Control Capabilities


Abstract
1. Introduction
2. Materials and Methods
2.1. Participants
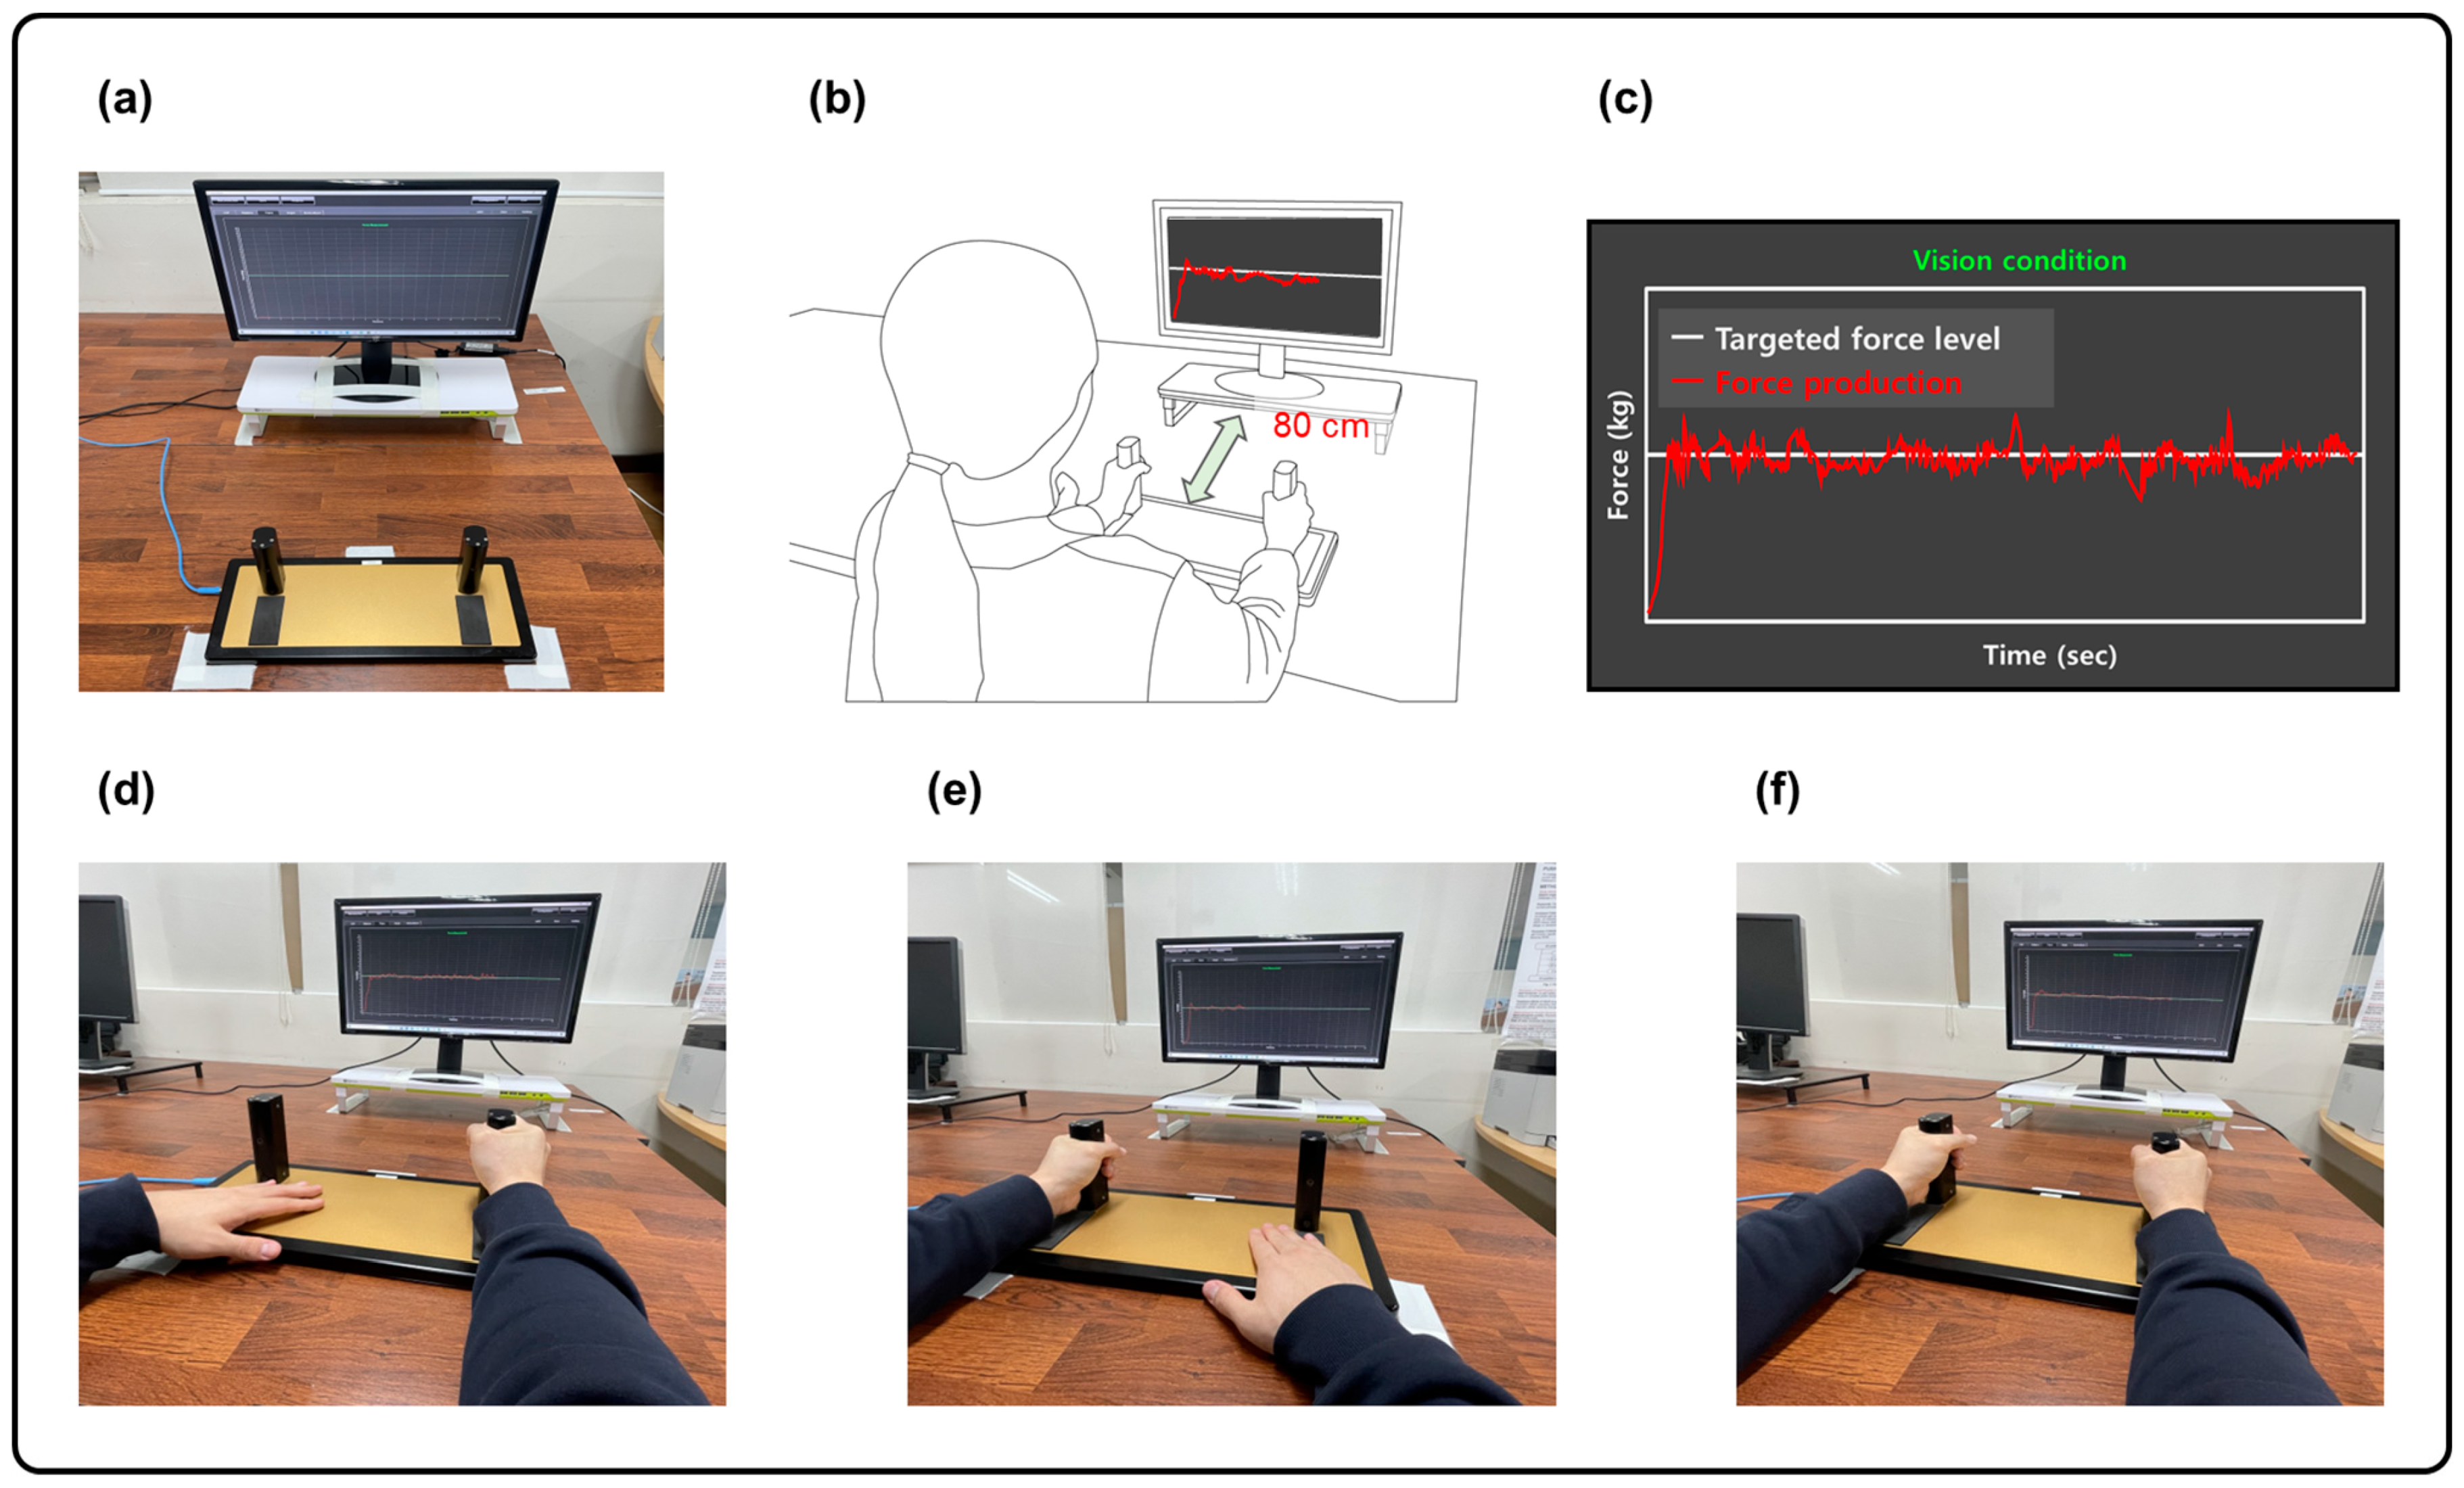
2.2. Experimental Setup
2.3. Data Analysis
2.4. Statistical Analysis
3. Results
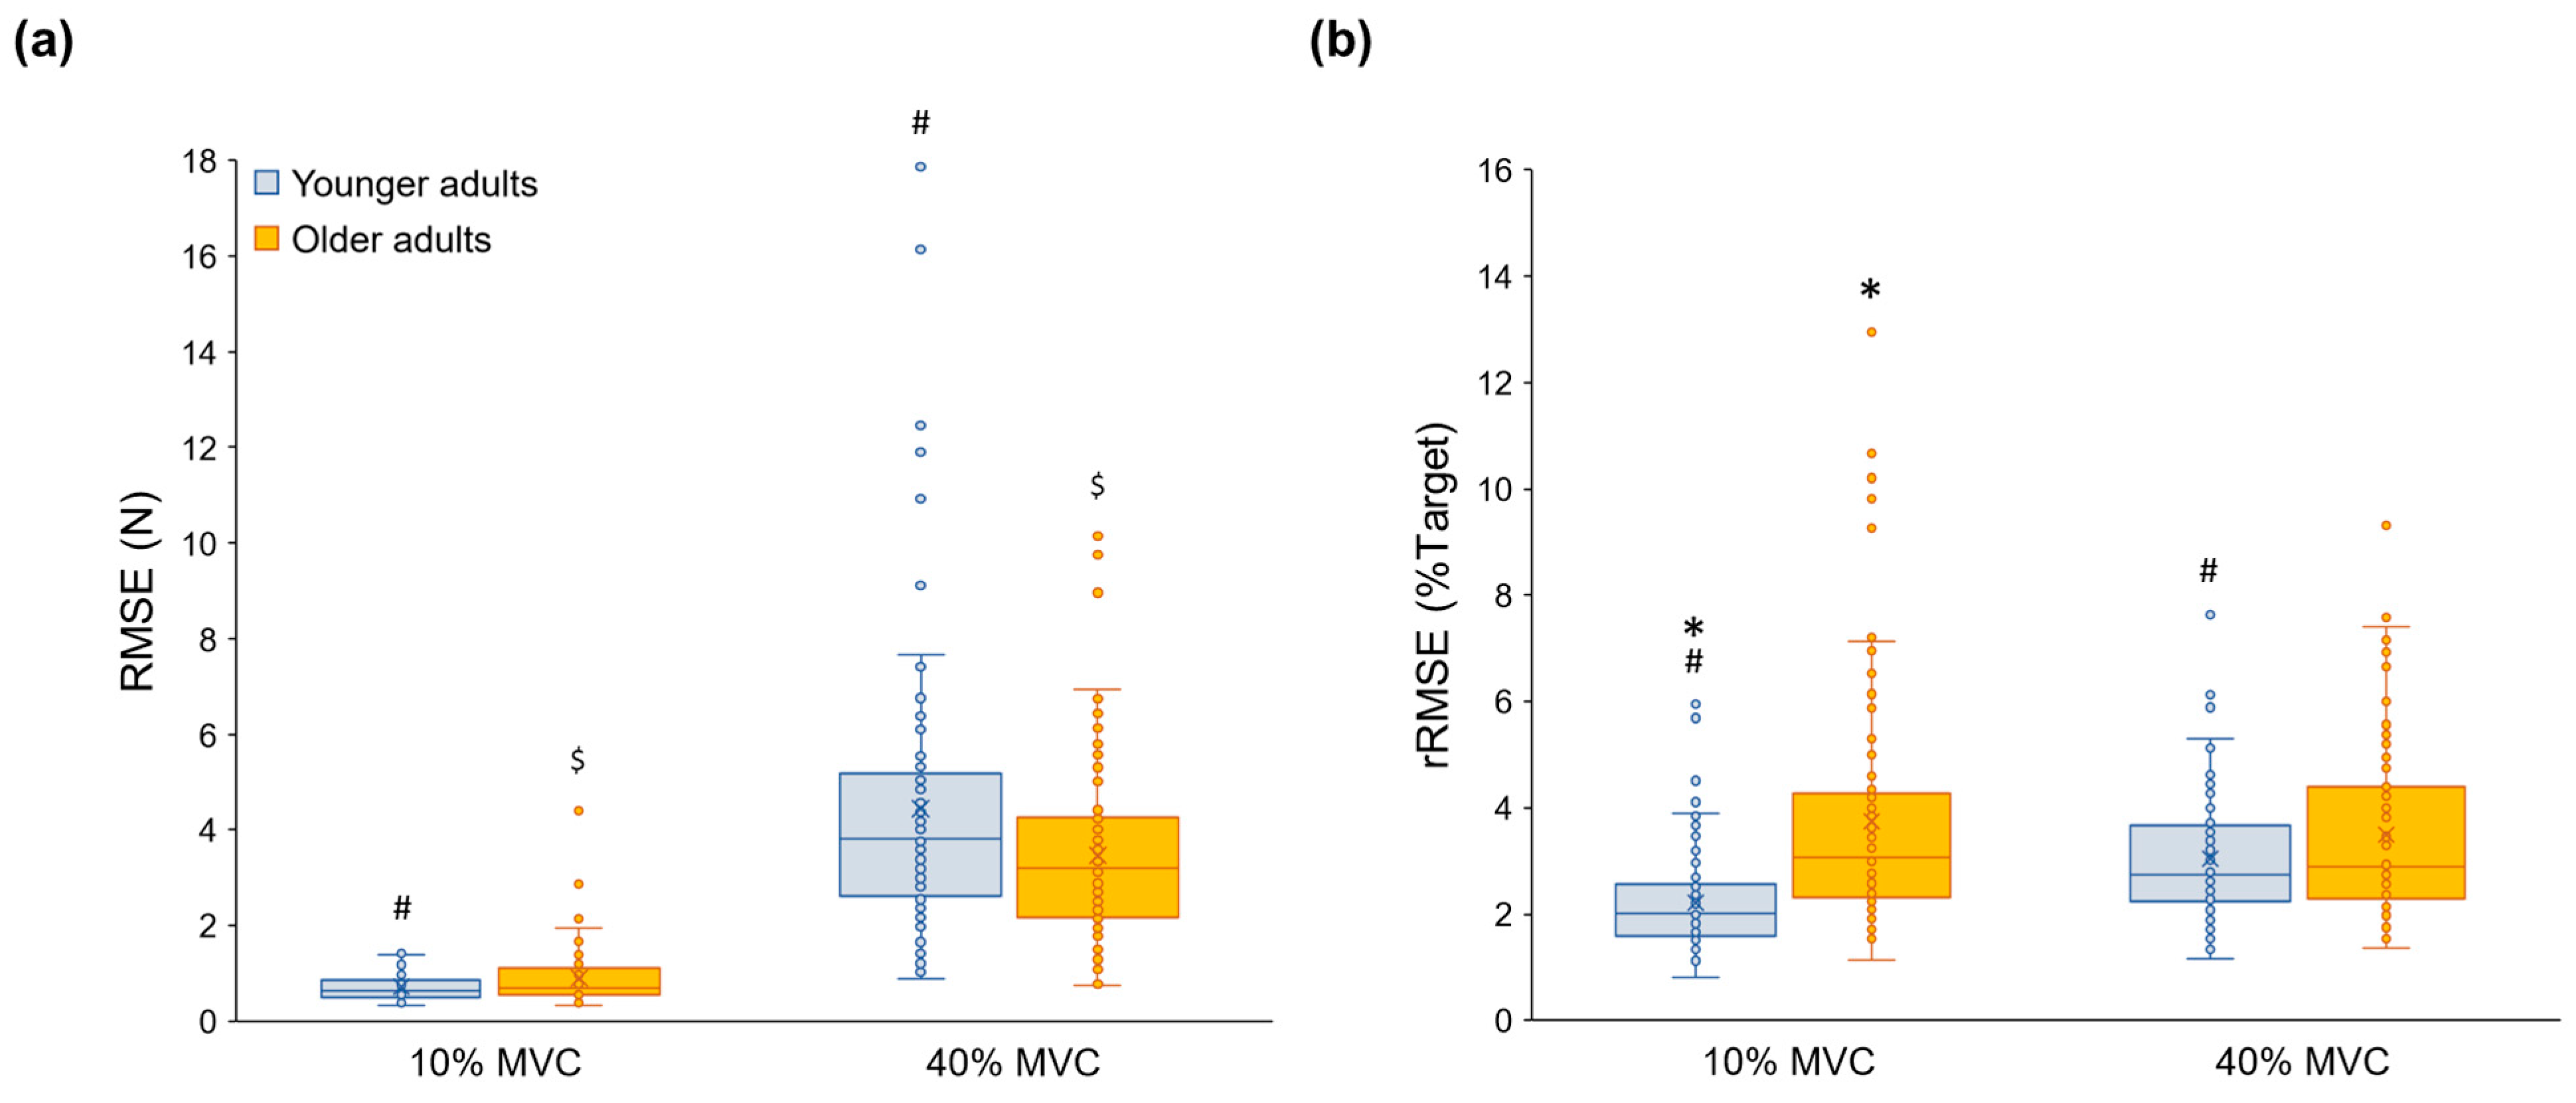
3.1. Force Accuracy
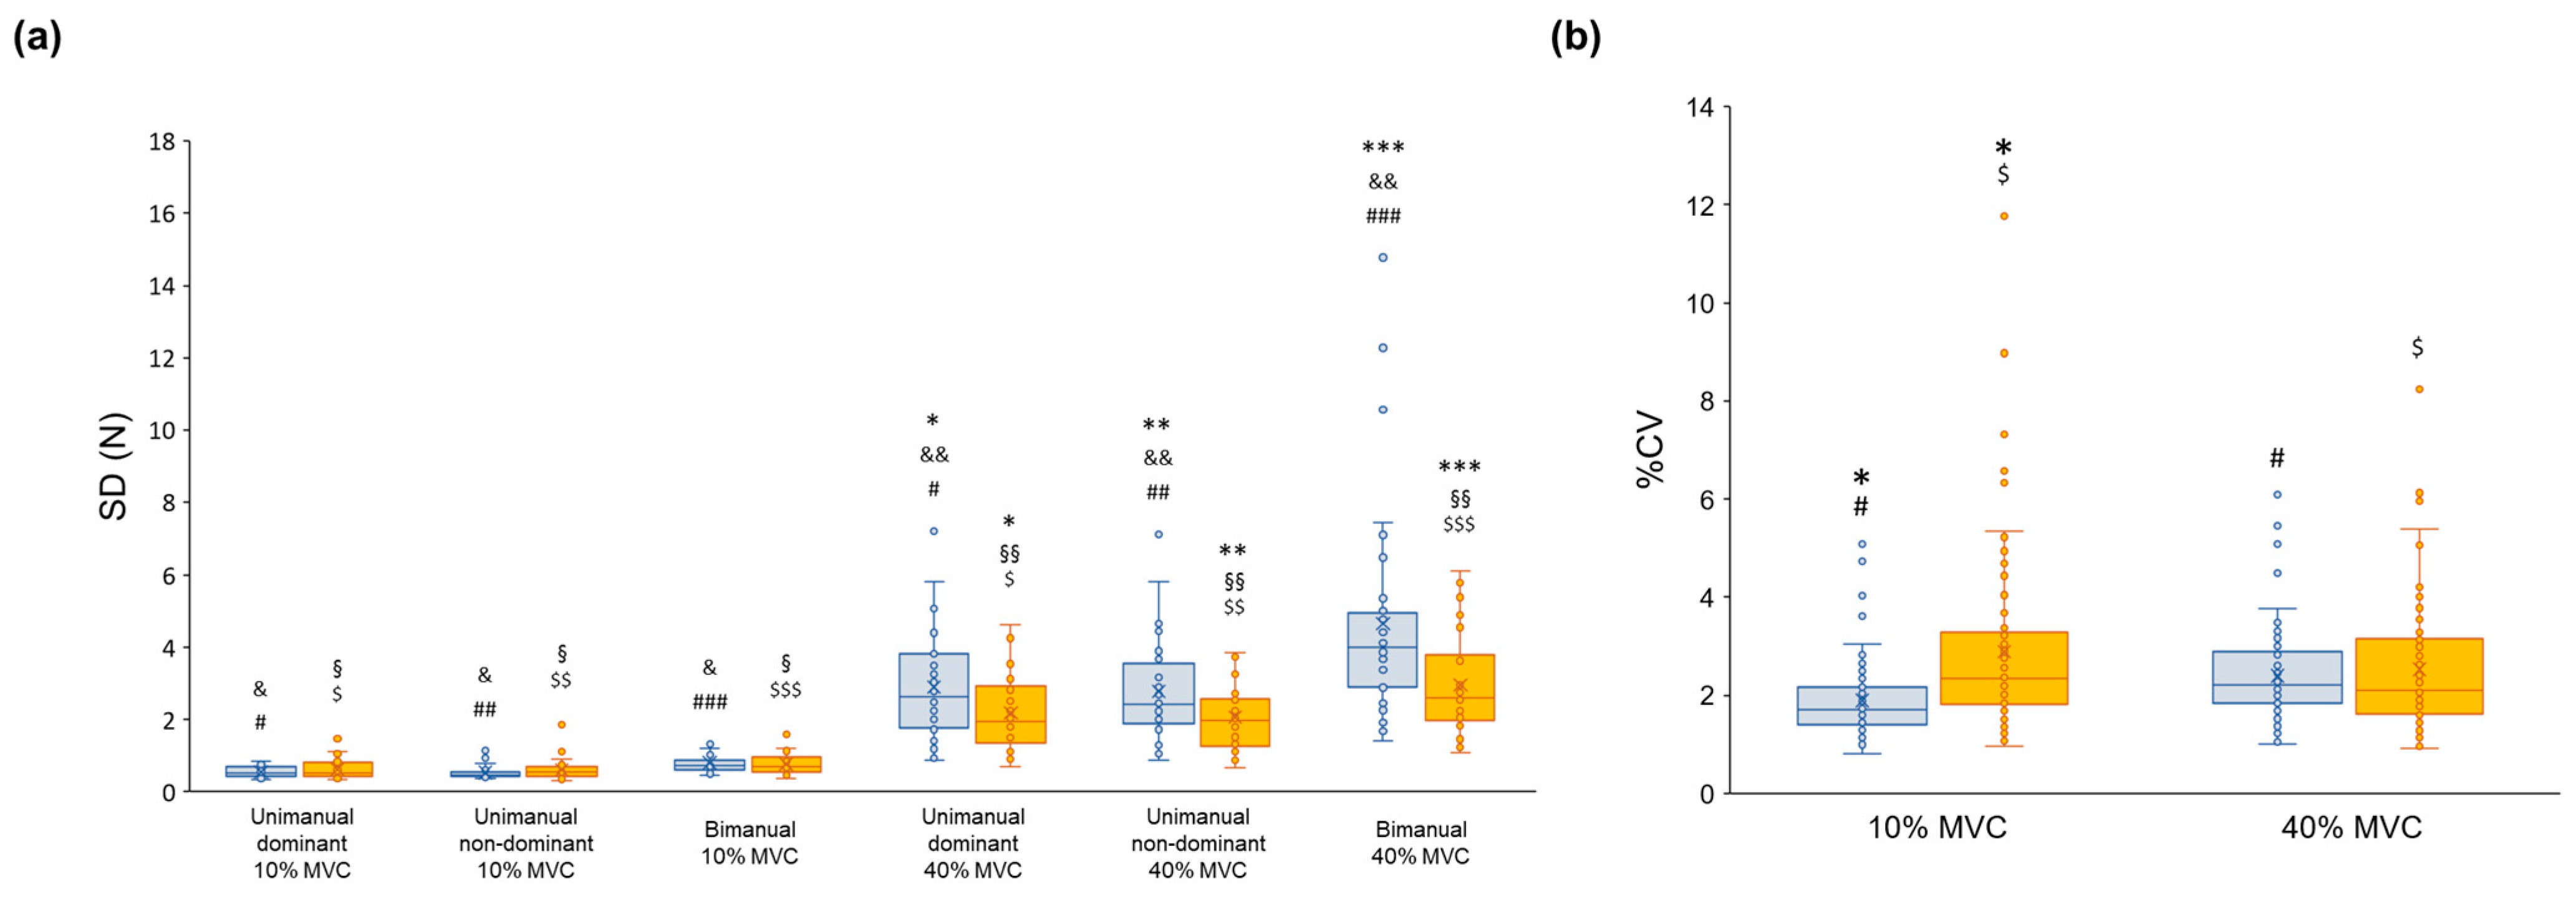
3.2. Force Variability
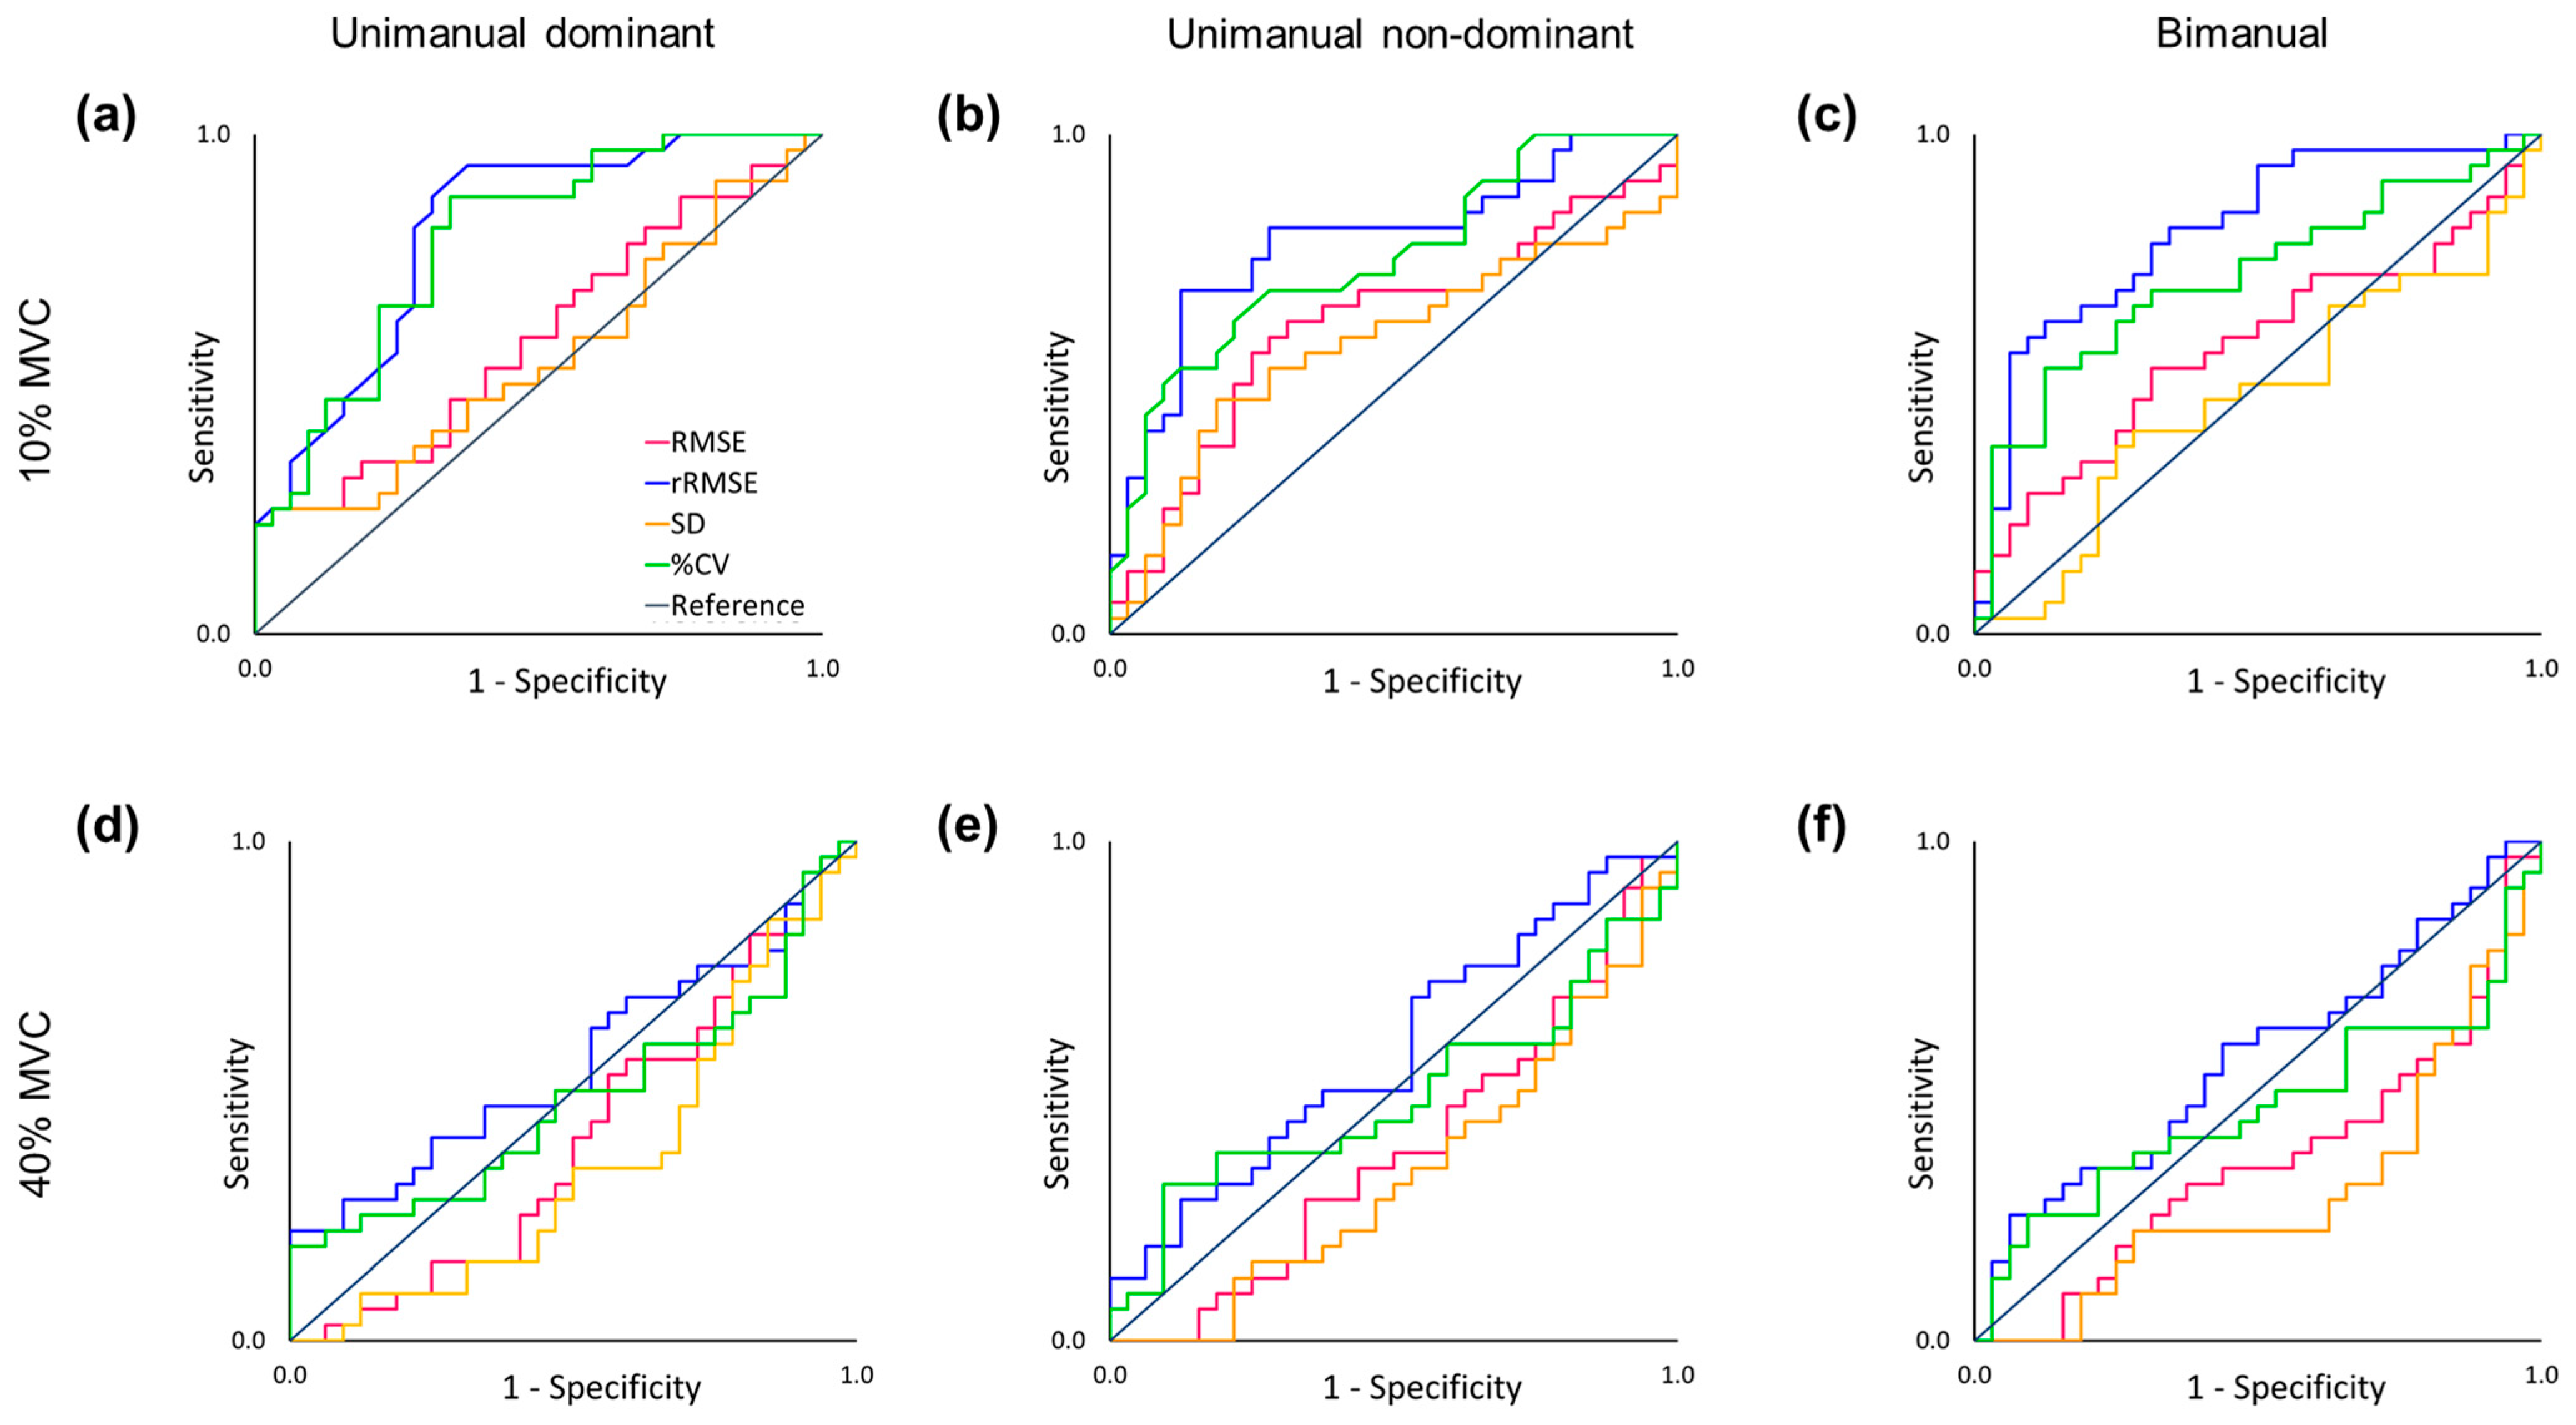
3.3. ROC Curve Findings
3.4. Correlation Finding: Between Body Composition and Force Control in Older Adults
4. Discussion
5. Conclusions
Supplementary Materials
Author Contributions
Funding
Institutional Review Board Statement
Informed Consent Statement
Data Availability Statement
Conflicts of Interest
References
- Booth, F.W.; Weeden, S.H.; Tseng, B.S. Effect of aging on human skeletal muscle and motor function. Med. Sci. Sports Exerc. 1994, 26, 556–560. [Google Scholar] [CrossRef]
- Hayase, D.; Mosenteen, D.; Thimmaiah, D.; Zemke, S.; Atler, K.; Fisher, A.G. Age-related changes in activities of daily living ability. Aust. Occup. Ther. J. 2004, 51, 192–198. [Google Scholar] [CrossRef]
- Gulde, P.; Schmidle, S.; Aumüller, A.; Hermsdörfer, J. The effects of speed of execution on upper-limb kinematics in activities of daily living with respect to age. Exp. Brain Res. 2019, 237, 1383–1395. [Google Scholar] [CrossRef] [PubMed]
- Hortobágyi, T.; Mizelle, C.; Beam, S.; DeVita, P. Old adults perform activities of daily living near their maximal capabilities. J. Gerontol. A Biol. Sci. Med. Sci. 2003, 58, M453–M460. [Google Scholar] [CrossRef] [PubMed]
- Carmeli, E.; Patish, H.; Coleman, R. The aging hand. J. Gerontol. A Biol. Sci. Med. Sci. 2003, 58, M146–M152. [Google Scholar] [CrossRef] [PubMed]
- Zasadzka, E.; Pieczyńska, A.; Trzmiel, T.; Kleka, P.; Pawlaczyk, M. Correlation between handgrip strength and depression in older adults—A systematic review and a meta-analysis. Int. J. Environ. Res. Public Health 2021, 18, 4823. [Google Scholar] [CrossRef] [PubMed]
- Duchowny, K.A.; Ackley, S.F.; Brenowitz, W.D.; Wang, J.; Zimmerman, S.C.; Caunca, M.R.; Glymour, M.M. Associations between handgrip strength and dementia risk, cognition, and neuroimaging outcomes in the UK Biobank cohort study. JAMA Netw. Open 2022, 5, e2218314. [Google Scholar] [CrossRef] [PubMed]
- Bohannon, R.W.; Bear-Lehman, J.; Desrosiers, J.; Massy-Westropp, N.; Mathiowetz, V. Average grip strength: A meta-analysis of data obtained with a Jamar dynamometer from individuals 75 years or more of age. J. Geriatr. Phys. Ther. 2007, 30, 28–30. [Google Scholar] [CrossRef] [PubMed]
- Pethick, J.; Clark, N.C.; Liew, B. Alterations in peripheral joint muscle force control in adults with musculoskeletal disease, injury, surgery, or arthroplasty: A systematic review and meta-analysis. J. Electromyogr. Kinesiol. 2022, 66, 102696. [Google Scholar] [CrossRef]
- Pethick, J.; Taylor, M.J.; Harridge, S.D. Aging and skeletal muscle force control: Current perspectives and future directions. Scand. J. Med. Sci. Sports 2022, 32, 1430–1443. [Google Scholar] [CrossRef]
- Fiogbé, E.; Carnavale, B.F.; de Medeiros Takahashi, A.C. Exercise training in older adults, what effects on muscle force control? A systematic review of randomized clinical trials. Arch. Gerontol. Geriatr. 2019, 83, 138–150. [Google Scholar] [CrossRef] [PubMed]
- Marshall, M.M.; Armstrong, T.J. Observational assessment of forceful exertion and the perceived force demands of daily activities. J. Occup. Rehabil. 2004, 14, 281–294. [Google Scholar] [CrossRef] [PubMed]
- Lee, H.; Park, Y.-M.; Kang, N. Unilateral hand force control impairments in older women. EXCLI J. 2022, 21, 1231–1244. [Google Scholar] [PubMed]
- Lin, B.-S.; Kuo, S.-F.; Lee, I.; Lu, L.-H.; Chen, P.-Y.; Wang, P.-C.; Lai, C.-H.; Wang, X.-M.; Lin, C.-H. The impact of aging and reaching movements on grip stability control during manual precision tasks. BMC Geriatr. 2021, 21, 703. [Google Scholar] [CrossRef] [PubMed]
- Lin, C.-H.; Sung, W.-H.; Chiang, S.-L.; Lee, S.-C.; Lu, L.-H.; Wang, P.-C.; Wang, X.-M. Influence of aging and visual feedback on the stability of hand grip control in elderly adults. Exp. Gerontol. 2019, 119, 74–81. [Google Scholar] [CrossRef] [PubMed]
- Enoka, R.M.; Christou, E.A.; Hunter, S.K.; Kornatz, K.W.; Semmler, J.G.; Taylor, A.M.; Tracy, B.L. Mechanisms that contribute to differences in motor performance between young and old adults. J. Electromyogr. Kinesiol. 2003, 13, 1–12. [Google Scholar] [CrossRef]
- Laidlaw, D.H.; Bilodeau, M.; Enoka, R.M. Steadiness is reduced and motor unit discharge is more variable in old adults. Muscle Nerve 2000, 23, 600–612. [Google Scholar] [CrossRef]
- Tracy, B.L.; Maluf, K.S.; Stephenson, J.L.; Hunter, S.K.; Enoka, R.M. Variability of motor unit discharge and force fluctuations across a range of muscle forces in older adults. Muscle Nerve 2005, 32, 533–540. [Google Scholar] [CrossRef] [PubMed]
- Maes, C.; Gooijers, J.; de Xivry, J.-J.O.; Swinnen, S.P.; Boisgontier, M.P. Two hands, one brain, and aging. Neurosci. Biobehav. Rev. 2017, 75, 234–256. [Google Scholar] [CrossRef]
- Solesio-Jofre, E.; Serbruyns, L.; Woolley, D.G.; Mantini, D.; Beets, I.A.; Swinnen, S.P. Aging effects on the resting state motor network and interlimb coordination. Hum. Brain Mapp. 2014, 35, 3945–3961. [Google Scholar] [CrossRef]
- Smits-Engelsman, B.C.; Van Galen, G.P.; Duysens, J. Force levels in uni-and bimanual isometric tasks affect variability measures differently throughout lifespan. Motor Control 2004, 8, 437–449. [Google Scholar] [CrossRef] [PubMed]
- Goble, D.J.; Coxon, J.P.; Van Impe, A.; De Vos, J.; Wenderoth, N.; Swinnen, S.P. The neural control of bimanual movements in the elderly: Brain regions exhibiting age-related increases in activity, frequency-induced neural modulation, and task-specific compensatory recruitment. Hum. Brain Mapp. 2010, 31, 1281–1295. [Google Scholar] [CrossRef] [PubMed]
- Lin, C.-H.; Chou, L.-W.; Wei, S.-H.; Lieu, F.-K.; Chiang, S.-L.; Sung, W.-H. Influence of aging on bimanual coordination control. Exp. Gerontol. 2014, 53, 40–47. [Google Scholar] [CrossRef] [PubMed]
- Lee, J.H.; Kang, N. Altered Bimanual Kinetic and Kinematic Motor Control Capabilities in Older Women. Int. J. Environ. Res. Public Health 2023, 20, 2153. [Google Scholar] [CrossRef] [PubMed]
- Jones, K.E.; Hamilton, A.F.d.C.; Wolpert, D.M. Sources of signal-dependent noise during isometric force production. J. Neurophysiol. 2002, 88, 1533–1544. [Google Scholar] [CrossRef] [PubMed]
- Novak, T.; Newell, K.M. Physiological tremor (8–12 Hz component) in isometric force control. Neurosci. Lett. 2017, 641, 87–93. [Google Scholar] [CrossRef] [PubMed]
- Schmidt, R.A.; Zelaznik, H.; Hawkins, B.; Frank, J.S.; Quinn, J.T., Jr. Motor-output variability: A theory for the accuracy of rapid motor acts. Psychol. Rev. 1979, 86, 415. [Google Scholar] [CrossRef]
- Hunter, S.K.; Pereira, H.M.; Keenan, K.G. The aging neuromuscular system and motor performance. J. Appl. Physiol. 2016, 121, 982–995. [Google Scholar] [CrossRef]
- Aagaard, P.; Suetta, C.; Caserotti, P.; Magnusson, S.P.; Kjær, M. Role of the nervous system in sarcopenia and muscle atrophy with aging: Strength training as a countermeasure. Scand. J. Med. Sci. Sports 2010, 20, 49–64. [Google Scholar] [CrossRef]
- Rice, C.L.; Cunningham, D.A.; Paterson, D.H.; Rechnitzer, P.A. Strength in an elderly population. Arch. Phys. Med. Rehabil. 1989, 70, 391–397. [Google Scholar]
- Tillman, M.; Ambike, S. Expectation of movement generates contrasting changes in multifinger synergies in young and older adults. Exp. Brain Res. 2018, 236, 2765–2780. [Google Scholar] [CrossRef] [PubMed]
- Galganski, M.E.; Fuglevand, A.J.; Enoka, R.M. Reduced control of motor output in a human hand muscle of elderly subjects during submaximal contractions. J. Neurophysiol. 1993, 69, 2108–2115. [Google Scholar] [CrossRef]
- Kang, Y.; NA, D.L.; Hahn, S. A validity study on the Korean Mini-Mental State Examination (K-MMSE) in dementia patients. J. Korean Neurol. Assoc. 1997, 15, 300–308. [Google Scholar]
- Tombaugh, T.N.; McIntyre, N.J. The mini-mental state examination: A comprehensive review. J. Am. Geriatr. Soc. 1992, 40, 922–935. [Google Scholar] [CrossRef]
- Lee, J.H.; Lee, H.; Kim, H.; Kim, R.K.; Lee, T.L.; Ko, D.K.; Lee, H.J.; Kang, N. Resistance band training with functional electrical stimulation improves force control capabilities in older adults: A preliminary study. EXCLI J. 2024, 23, 130. [Google Scholar] [PubMed]
- Oldfield, R.C. The assessment and analysis of handedness: The Edinburgh inventory. Neuropsychologia 1971, 9, 97–113. [Google Scholar] [CrossRef]
- Kang, N. Low-frequency oscillations and force control capabilities as a function of force level in older women. Appl. Sci. 2022, 12, 1812. [Google Scholar] [CrossRef]
- Kim, J.S.; Hwang, M.H.; Kang, N. Bilateral deficits during maximal grip force production in late postmenopausal women. Appl. Sci. 2021, 11, 8426. [Google Scholar] [CrossRef]
- Hu, X.; Loncharich, M.; Newell, K.M. Visual information interacts with neuromuscular factors in the coordination of bimanual isometric force. Exp. Brain Res. 2011, 209, 129–138. [Google Scholar] [CrossRef]
- Hanley, J.A.; McNeil, B.J. The meaning and use of the area under a receiver operating characteristic (ROC) curve. Radiology 1982, 143, 29–36. [Google Scholar] [CrossRef]
- Lasko, T.A.; Bhagwat, J.G.; Zou, K.H.; Ohno-Machado, L. The use of receiver operating characteristic curves in biomedical informatics. J. Biomed. Inform. 2005, 38, 404–415. [Google Scholar] [CrossRef] [PubMed]
- Schiffman, J.M.; Luchies, C.W.; Richards, L.G.; Zebas, C.J. The effects of age and feedback on isometric knee extensor force control abilities. Clin. Biomech. 2002, 17, 486–493. [Google Scholar] [CrossRef]
- Tracy, B.L. Force control is impaired in the ankle plantarflexors of elderly adults. Eur. J. Appl. Physiol. 2007, 101, 629–636. [Google Scholar] [CrossRef]
- Sosnoff, J.J.; Newell, K.M. Aging, visual intermittency, and variability in isometric force output. J. Gerontol. B Psychol. Sci. Soc. Sci. 2006, 61, P117–P124. [Google Scholar] [CrossRef] [PubMed]
- Tracy, B.L.; Hitchcock, L.N.; Welsh, S.J.; Paxton, R.J.; Feldman-Kothe, C.E. Visuomotor correction is a robust contributor to force variability during index finger abduction by older adults. Front. Aging Neurosci. 2015, 7, 229. [Google Scholar] [CrossRef] [PubMed]
- Oomen, N.M.; van Dieen, J.H. Effects of age on force steadiness: A literature review and meta-analysis. Ageing Res. Rev. 2017, 35, 312–321. [Google Scholar] [CrossRef] [PubMed]
- Johnson, A.N.; Shinohara, M. Corticomuscular coherence with and without additional task in the elderly. J. Appl. Physiol. 2012, 112, 970–981. [Google Scholar] [CrossRef]
- Baweja, H.S.; Patel, B.K.; Martinkewiz, J.D.; Vu, J.; Christou, E.A. Removal of visual feedback alters muscle activity and reduces force variability during constant isometric contractions. Exp. Brain Res. 2009, 197, 35–47. [Google Scholar] [CrossRef]
- Patten, C.; Kamen, G. Adaptations in motor unit discharge activity with force control training in young and older human adults. Eur. J. Appl. Physiol. 2000, 83, 128–143. [Google Scholar] [CrossRef]
- Cheng, F.W.; Gao, X.; Mitchell, D.C.; Wood, C.; Still, C.D.; Rolston, D.; Jensen, G.L. Body mass index and all-cause mortality among older adults. Obesity 2016, 24, 2232–2239. [Google Scholar] [CrossRef]
- Oreopoulos, A.; Kalantar-Zadeh, K.; Sharma, A.M.; Fonarow, G.C. The obesity paradox in the elderly: Potential mechanisms and clinical implications. Clin. Geriatr. Med. 2009, 25, 643–659. [Google Scholar] [CrossRef] [PubMed]
- Bales, C.W.; Buhr, G.T. Body mass trajectory, energy balance, and weight loss as determinants of health and mortality in older adults. Obes. Facts 2009, 2, 171–178. [Google Scholar] [CrossRef] [PubMed]
- Soraya, N.; Parwanto, E. The Controversial Relationship between Body Mass Index and Handgrip Strength in the Elderly: An Overview. Malays. J. Med. Sci. 2023, 30, 73. [Google Scholar] [CrossRef] [PubMed]
- Lenardt, M.H.; Grden, C.R.B.; Sousa, J.A.V.d.; Reche, P.M.; Betiolli, S.E.; Ribeiro, D.K.M.N. Factors associated with loss of handgrip strength in long-lived elderly. Rev. Esc. Enferm. USP 2014, 48, 1006–1012. [Google Scholar] [CrossRef] [PubMed]
- Sergi, G.; Perissinotto, E.; Toffanello, E.D.; Maggi, S.; Manzato, E.; Buja, A.; Coin, A.; Frigo, A.C.; Inelmen, E.M.; Enzi, G. Lower extremity motor performance and body mass index in elderly people: The Italian Longitudinal Study on Aging. J. Am. Geriatr. Soc. 2007, 55, 2023–2029. [Google Scholar] [CrossRef] [PubMed]
- Kıskaç, M.; Soysal, P.; Smith, L.; Capar, E.; Zorlu, M. What is the optimal body mass index range for older adults? Ann. Geriatr. Med. Res. 2022, 26, 49. [Google Scholar] [CrossRef]
- Kennedy, K.M.; Raz, N. Age, sex and regional brain volumes predict perceptual-motor skill acquisition. Cortex 2005, 41, 560–569. [Google Scholar] [CrossRef] [PubMed]
- Koppelmans, V.; Hirsiger, S.; Mérillat, S.; Jäncke, L.; Seidler, R.D. Cerebellar gray and white matter volume and their relation with age and manual motor performance in healthy older adults. Hum. Brain Mapp. 2015, 36, 2352–2363. [Google Scholar] [CrossRef] [PubMed]
- Fling, B.; Seidler, R. Fundamental differences in callosal structure, neurophysiologic function, and bimanual control in young and older adults. Cereb. Cortex 2012, 22, 2643–2652. [Google Scholar] [CrossRef]
- Ryberg, C.; Rostrup, E.; Paulson, O.; Barkhof, F.; Scheltens, P.; Van Straaten, E.; Van Der Flier, W.; Fazekas, F.; Schmidt, R.; Ferro, J. Corpus callosum atrophy as a predictor of age-related cognitive and motor impairment: A 3-year follow-up of the LADIS study cohort. J. Neurol. Sci. 2011, 307, 100–105. [Google Scholar] [CrossRef]
- Fling, B.W.; Walsh, C.M.; Bangert, A.S.; Reuter-Lorenz, P.A.; Welsh, R.C.; Seidler, R.D. Differential callosal contributions to bimanual control in young and older adults. J. Cogn. Neurosci. 2011, 23, 2171–2185. [Google Scholar] [CrossRef] [PubMed]
- Larivière, S.; Xifra-Porxas, A.; Kassinopoulos, M.; Niso, G.; Baillet, S.; Mitsis, G.D.; Boudrias, M.H. Functional and effective reorganization of the aging brain during unimanual and bimanual hand movements. Hum. Brain Mapp. 2019, 40, 3027–3040. [Google Scholar] [CrossRef] [PubMed]
- Heuninckx, S.; Wenderoth, N.; Swinnen, S.P. Systems neuroplasticity in the aging brain: Recruiting additional neural resources for successful motor performance in elderly persons. J. Neurosci. 2008, 28, 91–99. [Google Scholar] [CrossRef] [PubMed]
- Ward, N.; Frackowiak, R. Age-related changes in the neural correlates of motor performance. Brain 2003, 126, 873–888. [Google Scholar] [CrossRef] [PubMed]
- Mora, F.; Segovia, G.; Del Arco, A. Glutamate–dopamine–GABA interactions in the aging basal ganglia. Brain Res. Rev. 2008, 58, 340–353. [Google Scholar] [CrossRef]
- Seidler, R.D.; Bernard, J.A.; Burutolu, T.B.; Fling, B.W.; Gordon, M.T.; Gwin, J.T.; Kwak, Y.; Lipps, D.B. Motor control and aging: Links to age-related brain structural, functional, and biochemical effects. Neurosci. Biobehav. Rev. 2010, 34, 721–733. [Google Scholar] [CrossRef]
- Berger, A.; Steinberg, F.; Thomas, F.; Doppelmayr, M. Neural correlates of age-related changes in precise grip force regulation: A combined EEG-fNIRS study. Front. Aging Neurosci. 2020, 12, 594810. [Google Scholar] [CrossRef]
- Mattay, V.S.; Fera, F.; Tessitore, A.; Hariri, A.; Das, S.; Callicott, J.; Weinberger, D. Neurophysiological correlates of age-related changes in human motor function. Neurology 2002, 58, 630–635. [Google Scholar] [CrossRef]


| Characteristics | Older Group | Younger Group | p-Value | |
|---|---|---|---|---|
| Sample size | 32 | 32 | - | |
| Sex (female/male) | 26:6 | 26:6 | - | |
| Age (years) | 64.6 ± 3.4 | 23.3 ± 2.4 | p < 0.001 * | |
| Handedness | 34 right-handed | 34 right-handed | - | |
| K-MMSE | 28 ± 1.6 | 29.6 ± 0.8 | p < 0.001 * | |
| Weight (kg) | 60.2 ± 9.3 | 59.8 ± 10.5 | p = 0.871 | |
| Body muscle mass (kg) | 21.9 ± 4.1 | 24.4 ± 6.0 # | p = 0.056 | |
| Body fat mass (kg) | 19.8 ± 5.7 | 15.5 ± 3.6 # | p < 0.001 * | |
| BMI (kg/m2) | 24.0 ± 2.9 | 22.1 ± 3.0 # | p = 0.017 * | |
| Hand-grip MVC (kg) | Unimanual dominant | 21 ± 5.6 | 29.8 ± 12.7 | p < 0.001 * |
| Unimanual non-dominant | 19.3 ± 5.6 | 26.4 ± 11.3 | p = 0.002 * | |
| Bimanual | 38.3 ± 13.1 | 57.4 ± 27.5 | p < 0.001 * | |
| Task | Variable | AUC | SE | p-Value | Cut Point | Sensitivity | Specificity | Accuracy |
|---|---|---|---|---|---|---|---|---|
| Unimanual dominant hand MVC 10% | rRMSE | 0.813 | 0.054 | p < 0.001 * | 2.274 | 0.938 | 0.656 | 0.797 |
| %CV | 0.789 | 0.056 | p < 0.001 * | 2.017 | 0.875 | 0.656 | 0.766 | |
| Unimanual non-dominant hand MVC 10% | rRMSE | 0.785 | 0.059 | p < 0.001 * | 3.116 | 0.688 | 0.875 | 0.781 |
| %CV | 0.756 | 0.060 | p < 0.001 * | 2.425 | 0.688 | 0.750 | 0.719 | |
| Bimanual hands MVC 10% | rRMSE | 0.808 | 0.055 | p < 0.001 * | 2.248 | 0.625 | 0.875 | 0.750 |
| %CV | 0.713 | 0.066 | p = 0.003 * | 1.779 | 0.531 | 0.875 | 0.703 |
Disclaimer/Publisher’s Note: The statements, opinions and data contained in all publications are solely those of the individual author(s) and contributor(s) and not of MDPI and/or the editor(s). MDPI and/or the editor(s) disclaim responsibility for any injury to people or property resulting from any ideas, methods, instructions or products referred to in the content. |
© 2024 by the authors. Licensee MDPI, Basel, Switzerland. This article is an open access article distributed under the terms and conditions of the Creative Commons Attribution (CC BY) license (https://creativecommons.org/licenses/by/4.0/).
Share and Cite
Ko, D.-K.; Kang, N. Aging Impairs Unimanual and Bimanual Hand-Grip Force Control Capabilities. Appl. Sci. 2024, 14, 4408. https://doi.org/10.3390/app14114408
Ko D-K, Kang N. Aging Impairs Unimanual and Bimanual Hand-Grip Force Control Capabilities. Applied Sciences. 2024; 14(11):4408. https://doi.org/10.3390/app14114408
Chicago/Turabian StyleKo, Do-Kyung, and Nyeonju Kang. 2024. "Aging Impairs Unimanual and Bimanual Hand-Grip Force Control Capabilities" Applied Sciences 14, no. 11: 4408. https://doi.org/10.3390/app14114408
APA StyleKo, D.-K., & Kang, N. (2024). Aging Impairs Unimanual and Bimanual Hand-Grip Force Control Capabilities. Applied Sciences, 14(11), 4408. https://doi.org/10.3390/app14114408