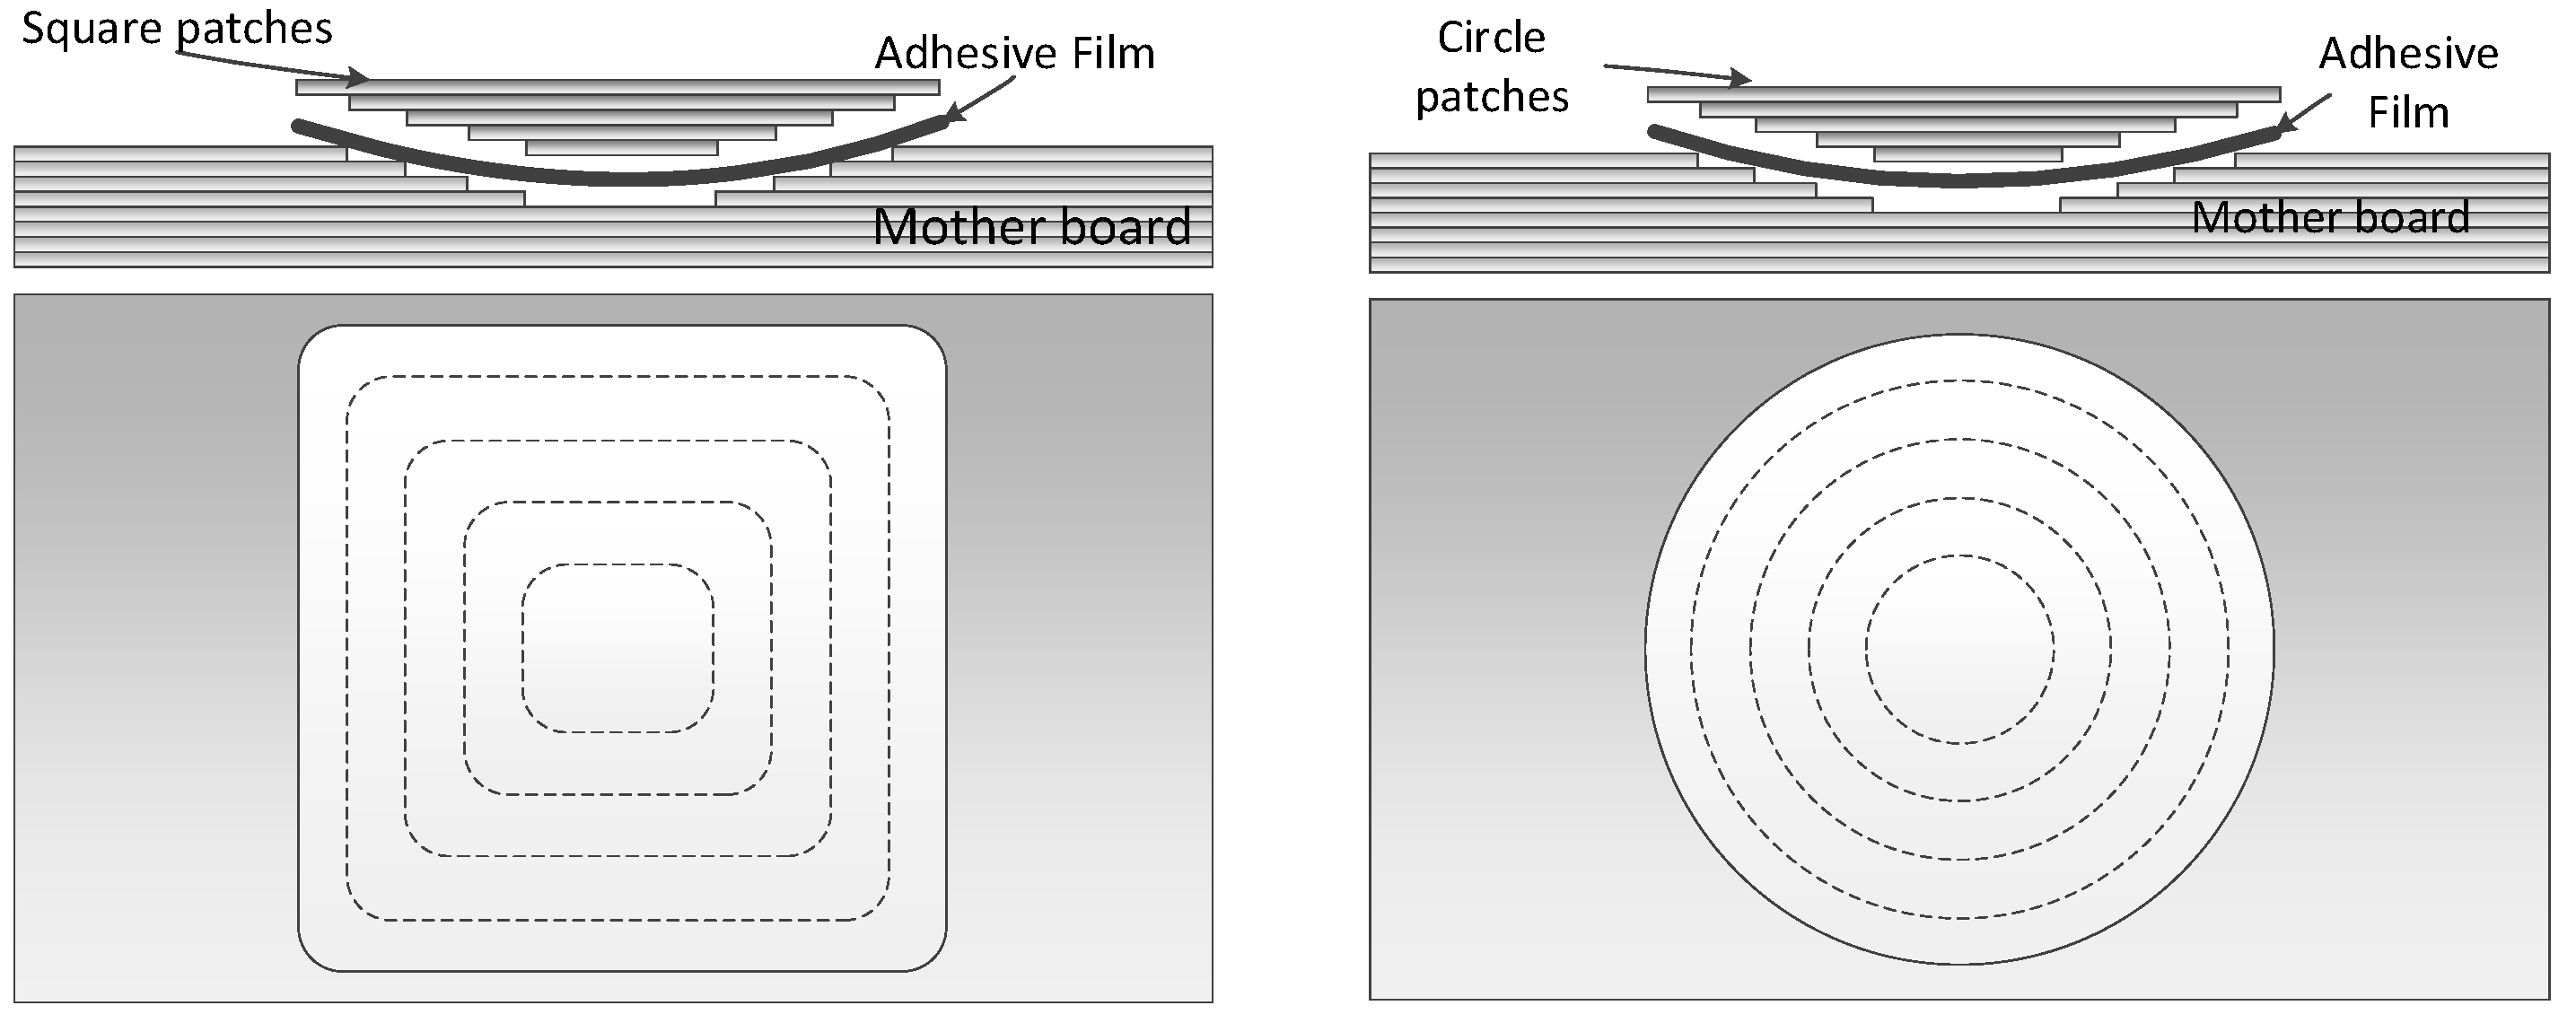
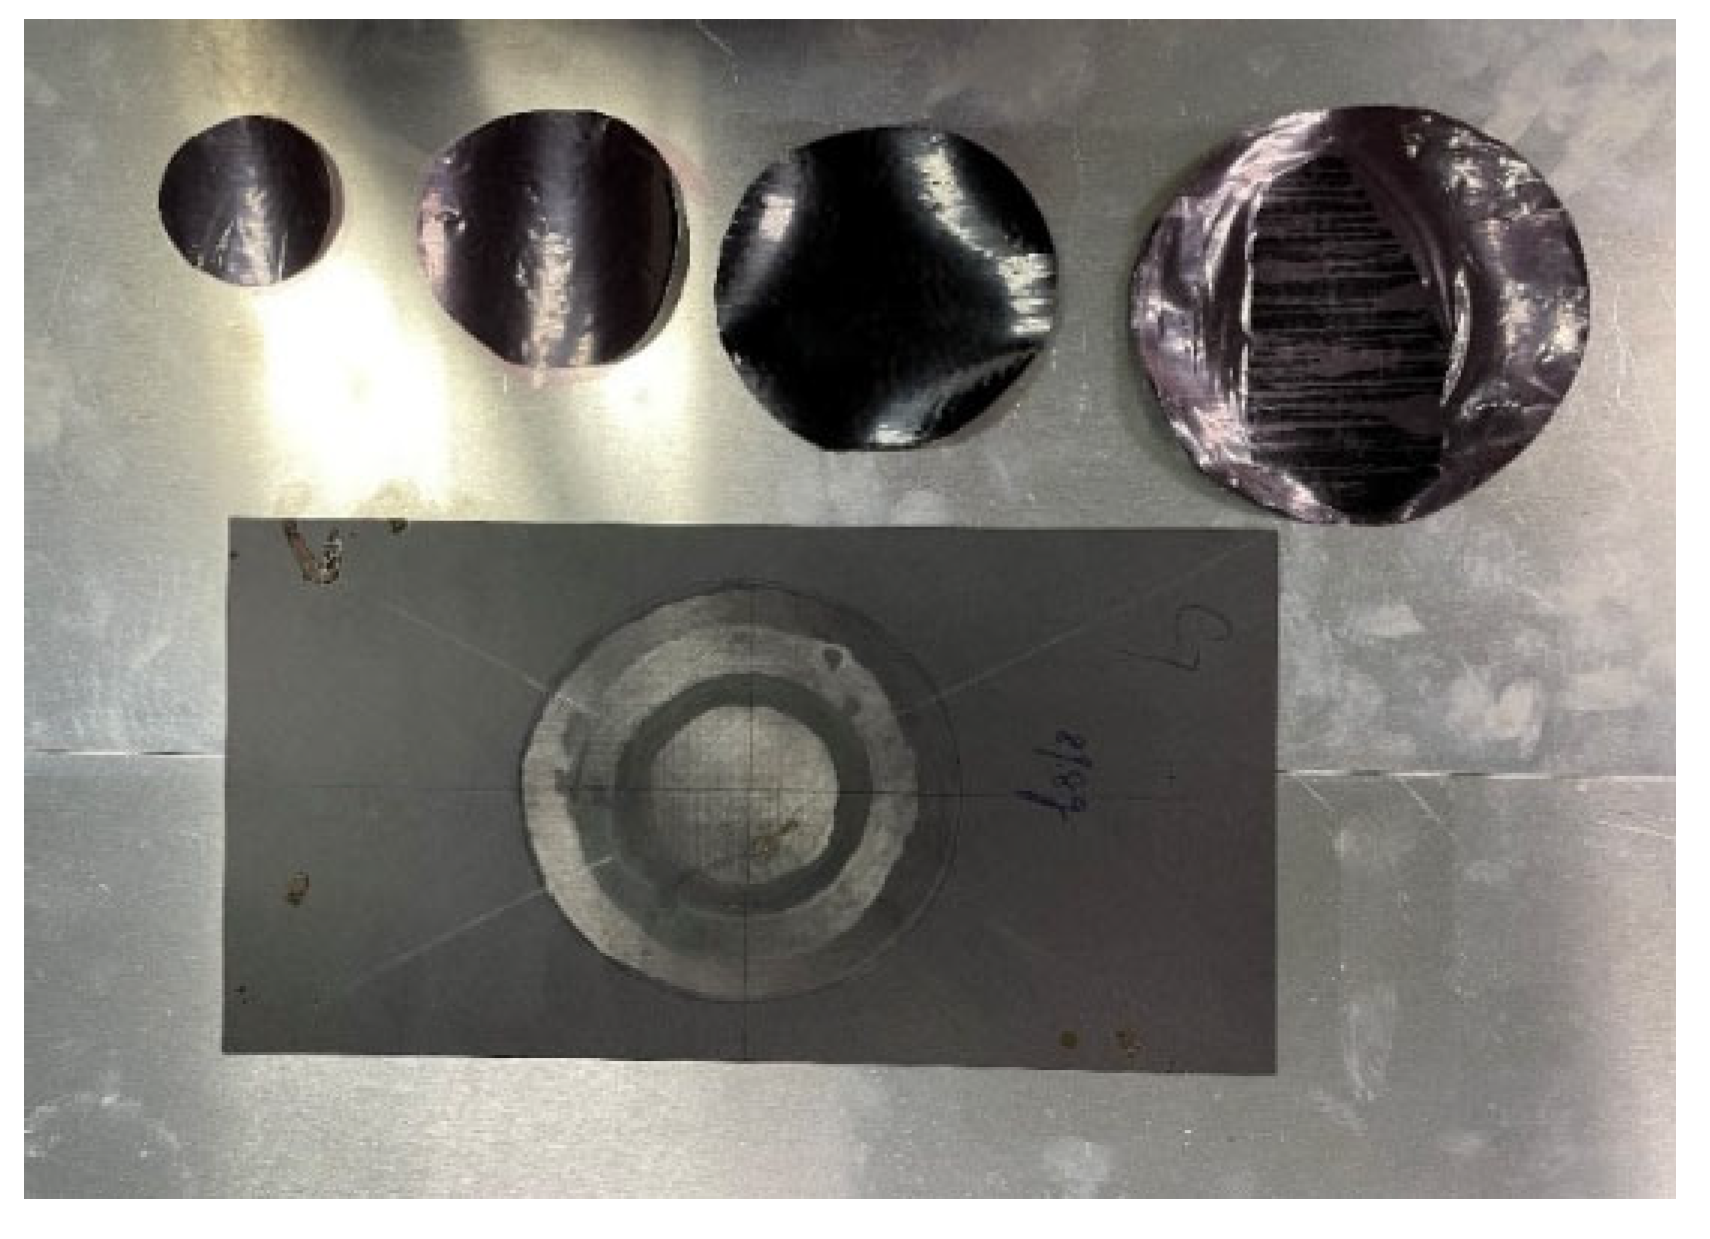
Article

Optimization of Composite Material Repair Patch Shape Based on Strength Analysis

1
School of Mechanics and Construction Engineering, Jinan University, Guangzhou 510632, China
2
Aircraft Maintenance Engineering College, Guangzhou Civil Aviation College, Guangzhou 510403, China
3
Key Laboratory of Disaster Forecast and Control in Engineering, Ministry of Education, Guangzhou 510632, China
4
Boea Wisdom Network Technology Co., Ltd., Hangzhou 310023, China
*
Author to whom correspondence should be addressed.
Appl. Sci. 2024, 14(11), 4397; https://doi.org/10.3390/app14114397
Submission received: 11 April 2024 / Revised: 14 May 2024 / Accepted: 19 May 2024 / Published: 22 May 2024

Abstract

:
With the increasing use of composite materials in aircraft structures and the extension of their service life, the selection of repair patch shapes for composite material damage repair has become a significant engineering concern. The ultimate strength of the repaired structure is among the main evaluation criteria for selecting optimal patch shapes. In this study, strength analysis is conducted along with the use of the Digital Image Correlation (DIC) method to assess the quality of the repaired components, making the evaluation method more rational. Early studies often focused on simplified models, which diverged significantly from the practicalities of maintenance engineering in civil aviation. Therefore, it is essential to research full-scale composite material repair patches, as this will provide a more reliable basis for the optimal selection of patch shapes in composite material maintenance engineering for civil aircraft.

1. Introduction

For the repair of aircraft composite structural components, the first step is to determine the location, type, and extent of the damage. Then, the repair procedure of retaining, repairing, or replacing the damaged part is followed according to the repair manual. Boeing and Airbus generally use inclined or stepped grinding repair methods for repairable damages on composite components. For example, the Boeing 787 aircraft’s structural repair manual [1] specifies that the allowable repairable damage on the fuselage skin should be within 8.0 in × 8.0 in. Typically circular or rounded rectangular patches are used for inclined or stepped grinding repair, as shown in Figure 1.
Jefferson et al. [2] have pointed out that the shape of the patch in repair will affect various physical properties of the repaired components. So, this study of selecting the shape of repair patches in maintenance can provide a more reliable basis for formulating composite component repair plans.

2. Research Status on Shape Selection and Strength Analysis of Repaired Composite Laminates

Researchers have conducted extensive studies on the grinding adhesive repair process and repair parameters of composite materials. Among them, much attention has been paid to the influence of factors such as patch size, patch thickness, adhesive layer thickness, grinding hole inclination angle, and curing process parameters on the strength of repaired composite materials. Some of the literature also involves evaluating the effects of different patch shapes on repaired components by analyzing failure strength, fatigue life, and other factors. In recent years, there have been studies on the shape of patches used in composite material repairs. For example, Li C et al. [3] evaluated the damage components of small openings repaired with patches of different shapes using a progressive damage model, concluding that square patches yielded better results than other shapes. M. Baghdadi [4], Rachid M [5], and others repaired aircraft aluminum alloy structural components with patches of different shapes, analyzing the pros and cons of various patch shapes based on considerations such as reducing stress concentration and maximum shear stress within the adhesive layer. Hyunhee Lee [6] and others repaired composite material cracks using patches of four different shapes and obtained the bond strength of patches of different shapes using four-point bending tests.
In the field of research on the failure strength of composite structural components: A. Alan Baker et al. [7] proposed the prospects and challenges of adhesive repair. K.B. Katnametal [8] studied the fatigue crack repair method of aircraft primary load-bearing structural components and analyzed the advantages of the repair method from three aspects: fatigue strength of patches, environmental usage, and intelligent monitoring. V. Rao, R. Singh [9], J. Xiong [10], and others introduced an experimental study on the residual strength and fatigue crack propagation life of glass epoxy composite patched repairs on edge-cracked aluminum specimens and judged the effectiveness of the repair through static strength and fatigue tests. N. Yathisha [11] studied the influence of drilling holes in glass fiber-reinforced composite materials, including the effect of adding square inserts below the outermost layer in the stacking sequence on the strength of laminates before and after post-curing. Sameer H [12] et al. conducted full-scale composite repair static tensile experiments to determine the strength of components after repair. Andrew J. G [13], Hamza B [14], Jae-Seung Yoo [15], C.K. Sahoo [16], and others experimentally verified and finite-element modeled the effects of layup angle, grinding angle, patch size, and additional ply on the adhesive strength, interlaminar shear force, stress concentration factor, and fatigue strength of composite repairs. Most of these experiments and modeling were conducted using simplified inclined grinding repair models. M. Kashfuddoja [17], F. Benyahia [18], et al., conducted full-scale simulation and modeling analysis on the influence of the size and shape of composite patch on the strength after composite repair. Kashfuddoja [17] used the 3D Hashin failure criterion to predict the strength of repaired composite structures, while F. Benyahia [18] proposed a damage zone model based on the equivalent von Mises strain criterion and used this model as a criterion for failure; they respectively proposed better repair patch shapes under their theoretical systems, but the results were not consistent. J. Jakobsen, B. Endelt [19], and others introduced a new bolt/pin connection method for composite repair and introduced a new patch reinforcement to achieve it. The advantages of this connection method were analyzed through static loading and fatigue experiments. K. Rashvand [20], L. Li [21], etc., studied the 3D printing repair of thermoplastic continuous fiber composite materials, demonstrating the potential of 3D printing technology in repairing CFRTP composite materials using strength analysis and highlighting the advantages of on-site printing over adhesive patch repair. M. Kushwaha et al. [22] developed a three-dimensional gradually attenuating energy model for patch repair of laminated plates, including considering the shear nonlinearity effect under tensile load. Based on the Hashin criterion, the damage mechanisms of undamaged, drilled, and patched repaired laminates were compared using the simulation results and experimental observations of the model they proposed. H. Liu, J. Liu, et al. [23] prepared single-sided CFRP patch repair plates with different patch-plug configurations and then used ultrasonic C-scanning and optical microscopy inspections on these impacted original and repaired plates to predict the impact behavior of the original CFRP plate and variously designed patch-repaired CFRP plates. Y. Zhao [24] studied the reliability analysis of composite laminate patch repair structures under unidirectional static loads through a probability model and indicated the importance of reliability analysis.

3. Ultimate Strength Theory of Composite Laminate

The ultimate failure strength can be divided into complete failure assumption and partial failure assumption, which reduce the stiffness of damaged components.
In the complete failure assumption, it is assumed that as long as single-layer failure occurs, regardless of the form of failure, all stiffness of that layer is considered to disappear, i.e., E1 = 0, E2 = 0, G12 = 0. Under this assumption, the thickness and position of the layer remain unchanged. The stiffness of the laminate is then recalculated, and the stress analysis proceeds to the next step.
In the partial failure assumption, when the matrix undergoes tensile or compressive failure, it is assumed that E2 = 0, G12 = 0, while E1 remains unchanged. When the fibers fracture, it is assumed that E1 = 0, E2 = 0, G12 = 0.
The steps for analyzing the ultimate failure strength of unidirectional laminated composite panels under uniaxial tension are as follows in Section 3.1, Section 3.2, Section 3.3, Section 3.4, Section 3.5, Section 3.6 and Section 3.7.

3.1. Determine the Initial Performance of the Laminated Plate

Firstly, calculate the flexural rigidity of the single-layer panel and obtain the rigidity coefficient Q i j based on the given material parameters.
Q 11 = E 1 1 ν 12 ν 21
Q 12 = ν 12 E 2 1 ν 12 ν 21 = ν 21 E 1 1 ν 12 ν 21
Q 22 = E 2 1 ν 12 ν 21
Q 66 = G 12
Based on the fiber direction of each layer, determine the stiffness coefficients in the overall coordinate system.

3.2. Compute the Tensile Stiffness Matrix of Composite Laminate

First, we have the following:
A i j = k = 1 N ( Q ¯ i j ) k ( z k z k 1 ) = k = 1 N ( Q ¯ i j ) k t k
Hence, the stiffness matrix A of the assembled laminate can be obtained. Then, according to (6), we have Formula (7).
ε 0 κ = a b b d N Μ
N x N y N x y = A 11 A 12 A 16 A 21 A 22 A 26 A 16 A 26 A 66 ε x 0 ε y 0 γ x y 0
Once the external force Nx = N1 is given, the strain of a composite laminate can be determined.

3.3. Calculate the Stress in Each Single Layer

In Formula (8), we have the following:
σ k = Q ¯ k A 11 A 12 A 16 T N 1
In which σ k is the Principal Directional Stress of the k-th layer.

3.4. Using Damage Criteria to Assess Whether Damage Has Occurred

Substitute the obtained principal stresses in the single-layer laminate failure criterion, such as the Tsai–Hill criterion, and calculate the value of Nx for each laminate. The laminate with the minimum value of Nx is considered to fail first.

3.5. Performance of Composite Laminate after the First Layer Is Damaged

For a layer where no damage has occurred, the stiffness remains unchanged. For a layer that has suffered damage in only one direction, the stiffness in the second direction remains unchanged. For example, if a material layer fractures along the fiber direction, while the perpendicular fiber direction still has continuous matrix material, then the stiffness in the perpendicular fiber direction is considered unchanged.
After obtaining the stiffness matrices for each layer and then assembling them, the overall stiffness matrix of the laminate is obtained. This is the stiffness matrix of the first-time degraded laminate.

3.6. Determine the Strength of Composite Laminates after Reducing the Stiffness

Determine whether the stress induced by the initial stiffness reduction during the first loading will cause the failure of the plate, and decide whether to continue increasing the load. If it is possible to continue increasing the load, then calculate the strain increment based on the load increment, and then obtain the strain increment of each single layer, further obtaining the stress increment of each single layer. Obtain the stress of each single-layer plate after stiffness reduction without failure.

3.7. Determine the Stress Increment When Each Remaining Layer Fails

According to the damage criteria, determine the stress increment of the plate near failure after the first stiffness reduction and calculate the remaining stress of each layer plate based on this. When another layer fails, the plate undergoes a second stiffness reduction, obtaining the stiffness after the second reduction and then determining the performance of the laminate based on loading.
By repeating this process, the final strain of the plate when all layers fail can be obtained, and the total load can be determined based on the total strain.

4. Strength Analysis of Healthy Composite Laminate Based on Tsai–Hill Criterion

Based on the analysis process of ultimate strength mentioned above, the Tsai–Hill criterion is employed to analyze the strength of a healthy laminated composite plate. The Tsai–Hill criterion is as follows, shown in Formula (9):
F I = σ 1 X + σ 2 Y + τ 12 S σ 1 σ 2 X 2 < 1
When F I = 1, it indicates that the material has experienced damage. When F I > 1, it means that the material has already been damaged. When F I < 1, it implies that the material has not yet been damaged. In the equation, X represents the ultimate tensile or compressive strength in the x-direction. When it is tensile strength, X is denoted as Xt. When it is compressive strength, X is denoted as Xc. The value of Y follows a similar pattern as X. Compared to the maximum stress criterion and maximum strain criterion, the Tsai–Hill criterion can consider the interaction between different parameters.
Table 1 gives the basic parameters of the composite laminated plates.
The mechanical performance parameters of the materials and the failure strength are shown in Table 2 and Table 3, respectively.
The symmetric layer stacking of composite laminates in the thickness direction provides a failure coefficient contour plot for only the first four layers under uniaxial static tensile loading through simulation as shown in Figure 2, Figure 3, Figure 4 and Figure 5.
According to the above degradation coefficient cloud diagram, it can be inferred that during the static tensile test, the 90° ply of the fourth layer fails first, followed by the two 45° plies of the first and third layers, and finally, the 0° ply of the second layer fails. The ultimate strength of the healthy composite laminate corresponds to a tensile force value of 94,413.6 N, and its force–displacement curve is shown in Figure 6.

5. Tensile Test of Composite Laminate Panels Repaired with Different Patch Shapes

5.1. Introduction to Tensile Testing

The experimental standard is shown in reference [25] The specimen parameters used in this study are shown in Table 1, Table 2 and Table 3. There are a total of twelve specimens in this experiment: six repaired with stepped circular patches and six repaired with stepped square patches with rounded corners.
The material of the patches for this experiment is the same as the substrate material, and the fiber direction of each repair ply is consistent with the fiber direction of the substrate layer that it is in. Assuming that there is damage to four layers on one side of the plate, then circular and square stepped holes are machined to remove the damage, and corresponding-shaped patches are used for wet layup repair. The adhesive used for repair is E51 epoxy resin, with the proportions shown in Table 4.
The two types of holes and patches used for repair are shown in Figure 7 and Figure 8. Figure 7 simulates the square stepped grinding method used for damage removal and square patches for repair, with the patch sizes from left to right being 5 × 5 in2, 4 × 4 in2, 3 × 3 in2, and 2 × 2 in2, all with a corner radius of 0.5 in; Figure 8 depicts the circular stepped opening method used for damage removal and circular patches for repair, with the patch diameters from left to right being 2 in, 3 in, 4 in, and 5 in.
This experiment mainly focuses on determining which repair shape is more reasonable when polishing square holes with rounded corners and circular holes with a diameter equal to the side length of the square hole. The dimensions of the abovementioned openings ensure that the dimensions of the minimum cross-section of the plate are equal in both parallel and perpendicular directions to the stretching direction. The unreasonable aspect is that when removing damaged material based on the shape of the square and its inscribed circle, more material is removed from the square than from the circular opening.
Uniaxial tensile testing on repaired boards was performed using the Universal Material Testing Machine combined with a DIC testing device. The specific test conditions are shown in Figure 9 and Figure 10.
According to GB/T 3354-2014 testing requirements, to simulate the process of static loading, the displacement rate for loading is set to 2 mm/min. The number of samples for the experiment should be no fewer than five. In this experiment, six circular repair test specimens were tested, labeled C1–C6, and six square repair test specimens with rounded corners were tested, labeled R1–R6.

5.2. Static Tensile Experiment of Circular Patch Repair Component

The stress–strain curve, elastic modulus, initial failure strength, and ultimate failure strength of a composite laminate were measured through tensile testing, as shown in Figure 11.
Table 4 provides the elastic modulus, initial failure strength, and ultimate failure strength values for specimens C1–C6, along with the mean values of these three parameters for comparison.
According to Figure 11, in the plate repaired with circular patches, C6, C3, and C1 exhibit higher values of ultimate failure strength and better toughness. Based on this single criterion, it is considered that the repair effects of these three are better.
According to the elastic modulus of the material, it can be observed that the higher the ultimate strength, the bigger the elastic modulus. It is believed that the C6 test specimen is relatively unique and its elastic modulus may be smaller due to insufficient clamping force applied by the fixture. According to the strength testing experiment, the ranking of repair quality is C6, C3, C1, C4, C5, and C2.
The coupon C1 in the y-direction (vertical direction in Figure 12 and Figure 13) strain maps of the side with a patch on the board before and after fracture were obtained using the DIC method (refer to Figure 12 and Figure 13). The direction of the fracture opening in the cross-section is approximately parallel to the line connecting the two maximum strain areas in the y-direction before fracture. The other five coupons are similar.
The DIC analysis method provides a comparison chart of the average displacements in the x (vertical stretching direction), y (parallel stretching direction), and z (perpendicular to the board) directions for the circular region, with C0 as the center (Figure 14).
In Equation (10), σ represents the stress value during the experimental process, F is the experimental tensile force, and S is the cross-sectional area of the specimens.
The x-axis “Dev1/ai0” represents the voltage values corresponding to the tensile stress, which is proportionate to the experimental force, as shown in Formula (10).
σ = F S = 6 × D e v 1 / a i 0
In Equation (10), “Dev1” translates to “the first board of the signal acquisition device,” and “ai0” refers to “the analog input signal acquired from channel 0”. As Dev1/ai0 increases, in the x-direction of specimen C1, the separation between the two average displacement lines gradually increases in Figure 15. As Figure 16 and Figure 17 show, the average displacement lines of the patch and the entire board in the y and z-directions do not separate significantly. This indicates that the average displacement of the patch in the x-direction is not consistent with that of the entire board. The possible reasons for this are (1) inadequate adhesion of the patch, and (2) the patch is oriented at a 45° angle to the surface, with external loads applied along the y-direction while the x-direction remains free, resulting in inconsistent deformation under the influence of shear stress and the Poisson effect.
Next, the average displacement cloud maps are shown in Figure 18, Figure 19 and Figure 20 for specimen C2. It can be observed that the average displacement of the patch in the x-direction aligns well with that of the entire board, while in the y-direction it is poor compared to other specimens. The average displacement in the z-direction indicates that the patched region is approximately 0.6 mm higher than the motherboard, possibly due to excess adhesive in the patch area, although the two curves run parallel without significant separation.
Due to the low tensile strength limit of the board at only 379 MPa, it is believed that the relatively poor alignment of the average displacement in the y-direction and the presence of excess adhesive have negatively impacted the strength of coupon C2.
The average displacement for C3 is provided, as shown in Figure 21, Figure 22 and Figure 23.
During the experiment, when Dev1/ai0 of C3 exceeded 64 (corresponding to a tension of 384 MPa), significant separation was observed between the average displacement plots. This indicates that the patch began to delaminate under this stress level. However, the tensile strength limit of sample C3 is 436 MPa, higher than that of C1 and C2 specimens. It is concluded that the patch bonding quality of C3 is superior to that of C1 and C2.
The average displacement for C4 is provided, as shown in Figure 24, Figure 25 and Figure 26. It is evident that there is a significant separation in the average displacement curve in the x-direction. In comparison, noticeable separation is also observed in the y-direction compared to the previous three experimental specimens. Similarly, in the z-direction, the average displacement shows that when Dev1/ai0 exceeds 60 (corresponding to tensile stress exceeding 360 MPa), the patch begins to exhibit noticeable displacement separation, which indicates that delamination has started and the adhesive bonding condition of C4 is inferior to the other three specimens.
The fFollowing are the average displacement curve of specimen C5, as shown in Figure 27, Figure 28 and Figure 29.
The two curves of average displacement in the x-direction for sample five show a gradual increase in separation starting from the beginning of the tensile test. In the y-direction and z-direction, the coordination of displacement noticeably deteriorates after the abscissa exceeds 62 (stress at 372 MPa). By comparison, it can be concluded that the repair quality of C5 is equivalent to that of C1 and superior to C4.
Below are the average displacement plots for sample C6, as shown in Figure 30, Figure 31 and Figure 32. For the C6 test specimen, the coordination of the repair patches in the x and y-directions with the overall average displacement of the plate is good, indicating the significant reinforcing effect of the repair patches. The displacement plot in the z-direction also indicates that the repair patches exhibit good conformity. Due to the high tensile strength, the patches demonstrate good conformity in displacement in all three directions. However, the thickness of the patches is noticeably greater than that of the original plate, likely due to excess adhesive on the surface.
For static tensile experiments conducted in the y-direction, the average displacement plots serve as a more sensitive evaluation of the adhesive effectiveness of the patches. In the plots, only the y-direction average displacement curves for C4, C2, and C5 show relatively obvious gaps, indicating poor reinforcement effects of the patches, which is also corroborated by the ultimate strength values in Table 5. In the x-direction average displacement plots, larger gaps are observed for C4, C5, and C1, serving as a secondary indicator of adhesive quality. Regarding the z-direction average displacement plots, it is evident that the surface treatment of the patches for C6 and C2 is inadequate, as they are not leveled with the motherboard surface. This deficiency can affect the aerodynamic smoothness of aircraft components, although its impact on repair strength is not significant. Hence, sufficient attention should be paid to post-treatment processes in engineering practice. In summary, the ultimate strength reflects the quality of patch repairs and their reinforcement effect on the base plate. However, the comparison of average displacement curves provides a more intuitive reflection of adhesive quality. Excluding post-treatment processes, based on tensile experiments and DIC results, the quality of repairs ranks from best to worst, as follows: C6, C3, C1, C2, C5, and C4.

5.3. Static Tensile Experiment of Rounded Square Patch Repair Component

The stress–strain curves for plates repaired with square patches are shown in Figure 33. It can be observed that the ultimate strength of R1 is the highest among the repaired specimens, while R4 exhibits the lowest ultimate strength. The average elastic modulus of circular patch repairs is greater than that of square patch repairs, but the elastic modulus of circular patch repairs shows greater dispersion. For the square patch repairs, a serrated pattern is observed after the tensile stress exceeds the ultimate strength. This is mainly due to the discontinuous load-bearing capacity caused by the square step on the base plate.
Table 6 provides the elastic modulus and the tensile ultimate strength values of plates repaired with square patches based on experiments. In terms of elastic modulus, they are arranged from highest to lowest, as follows: R6, R2, R4, R1, R3, and R5. Unlike plates repaired with circular patches, the dispersion of the two parameters for plates repaired with rounded square patches is not significant. The ultimate strength of each plate, from highest to lowest, is as follows: R3, R1, R6, R2, R5, and R4.
Based on the data processed through the DIC test, strain contour maps of the plates repaired with square patches are provided in the y-direction before and after the failure of specimen R1, as shown in Figure 34 and Figure 35, and the others are similar. It can be observed that the surface of the plate has a 45° ply orientation from the bottom left to the top right direction, and the strain extremes during the stretching process of the rectangular plate are located at the diagonals of the patches—this makes it easy for initial cracks to occur in this region.
The patch and the whole plate region are shown in Figure 36.
The comparison of the average displacement in three directions between the patch and the whole plate region of specimen R1 is listed in Figure 37, Figure 38 and Figure 39. It can be observed that before Dev1/ai0 reaches 52 (stress at 312 MPa), specimen R1 exhibits a good correlation in average displacements in the x, y, and z-directions. However, after the tensile stress exceeds 312 MPa, significant displacement deviations are observed in all three directions, indicating a separation between the patch and the base plate. Considering the tensile ultimate strength, the repair quality of specimen R1 is relatively reliable.
To assess the bonding quality of specimen R2, the average displacement in the x, y, and z-directions is provided. According to Figure 40, Figure 41 and Figure 42, as Dev1/ai0 reaches 30 (stress at 180 MPa), the average displacement in the x-direction between the patch and the base plate starts to deviate. However, before the tensile stress reaches 324 MPa (Dev1/ai0 54), the patch exhibits good correlation with the base plate in the y and z-directions, except for a slight elevation of around 0.2 mm compared to the original plate in the z-direction, which is attributed to the post-treatment of the repaired specimen. Finally, the ultimate tensile strength of the plate is determined to be 329 MPa. Preliminary assessment indicates that the bonding of the repair patch is firm and the reinforcement effect is reliable.
Furthermore, Figure 43, Figure 44 and Figure 45 provide the average displacement in the x, y, and z-directions for specimen R3. It can be observed that the openings in the x-direction for the two average displacement lines gradually increase after 180 MPa (Dev1/ai0 is 30), indicating the onset of separation between the patch and the base plate. In the y-direction, the two displacement lines coordinate well, and the two lines remain mostly parallel before material failure. According to the displacement graph in the z-direction, the patch of R3 is elevated by approximately 0.2 mm compared to the base plate. The ultimate tensile strength of R3 is determined to be 365 MPa, the highest among the six specimens. However, the repair quality of specimen R3 is similar to that of R2.
Due to external disturbances that affected the recording equipment during the experiment, DIC data for specimen R4 were lost. Therefore, the DIC test data for this group consists of five sets, still meeting the requirements of the experimental standards.
Figure 46, Figure 47 and Figure 48 show the comparative graphs of the average displacement in three directions for specimen R5. The DIC experimental data for R5 retained data after the occurrence of damage, displaying the displacement of the patch and the entire plate in three directions after damage failure. Before experiencing tensile failure, the displacements of the patch and the plate in the x and y-directions are coordinated well. However, in the z-direction, the patch is elevated by more than 0.6 mm compared to the base plate, indicating a significant excess of adhesive in the repair of this plate. The repair quality of this plate is better than R2 and R3 specimens.
Figure 49, Figure 50 and Figure 51 depict the comparative graphs of the average displacements in three directions for specimen R6.
It can be observed that after surpassing the ultimate strength, the displacement of the patch deviates significantly from that of the entire plate in all three directions. Before reaching the ultimate strength, the coordination of displacement between the patch and the entire plate is relatively good in all three directions. The adhesive quality of the patch for this specimen is similar to that of R3. The adhesive quality is slightly inferior to that of R1.
It can be concluded that although the square patch exhibits relatively poorer strength recovery, its repair method demonstrates higher reliability compared to the circular patch specimens. The repair quality is more consistent and significantly superior to that of the circular patch specimens.
The ranking of specimens based on the strength of the repaired specimens using square patches is as follows: R3, R1, R6, R2, R5, and R4.
The openings in the average displacement curves along the x-direction are all very small and thus not sortable.
By the magnitude of the opening in the average displacement curve along the y-direction, the quality of repair can be judged from best to worst, as follows: R1, R6, R5, R3, and R2.
By examining the displacement curves along the z-direction, it is primarily evident that specimen R6 exhibits a lack of adhesive, resulting in the patch being lower than the base plate, whereas patches in other specimens are generally elevated by around 0.2–0.7 mm compared to the base plate.

5.4. Comparison of Analysis Results for Different Patch Shapes

According to the results obtained from Abaqus, the tensile failure force of the healthy specimen is 94,414 N, corresponding to an ultimate strength of 486 MPa.
The average parameters obtained from the tensile experiments of circular and square patch repaired specimens are listed in Table 7. The average elastic modulus of the square patch repaired plates with rounded corners is smaller than that of the circular patch repaired plates. This is related to the lesser amount of base material removed by the circular patch and the quality of patch repair. Therefore, when considering permanent repairs for damage sizes ranging from 1 inch to 8 inches, the choice of patch shape should be studied simultaneously with the opening shape to reflect the engineering significance of this study.
For repairs under the same conditions, it is believed that the stability of the square patch repairs is higher than that of circular patch repairs, so this factor should be considered when choosing patch shapes.
Finally, the average tensile ultimate strength of the square patch repaired plates is 338.239 MPa, while that of the circular patch repaired plates is 404.311 MPa. These strength values reach 69.5% and 83% of the healthy specimen, respectively, demonstrating the advantages of the circular patch repair method.
The pattern of patch shape selection provided in this paper can be found in Figure 52.
Clearly, when selecting repair patches, it is necessary to consider the opening shape simultaneously. So, the shape of the damage needs to be considered as well to ensure minimal removal of the base material, thereby reducing the loss of strength and stiffness of the base plate.

6. Conclusions

This paper introduces the strength theory of composite laminated panels. Based on this, the ultimate strength and failure modes of healthy laminated panels that applied the Tsai–Hill strength criterion are presented.
Then, uniaxial tensile tests and the DIC method were conducted on laminated panels repaired using rounded square and circular patches. The experimental values were used to quantitatively evaluate the repair quality of the panels and the influence of different patch shapes on the post-repair strength of the panels.
Then, by comparing the average displacements of the two types of repaired specimens, it is indicated that the average repair quality of specimens with square patches is significantly better than that of specimens with circular patches. Although the quality stability of specimens with circular patches is poorer, the overall strength restoration with circular patches is better.
During the repair process, for the same damage under equivalent conditions, the type of structural component should be considered first, followed by determining the primary loads it transmits, and finally, in combination with the shape and location of the damage, minimizing material to be removed. The principle is to prioritize whether the repair primarily guarantees stability or needs to withstand larger and more complex loads, then decide the shape of the opening and patch to be used. If it is a non-primary load-bearing component with a relatively simple load, the repair quality stability being the main concern, it is recommended to use square openings and patches. If it is a primary load-bearing component with complex force transmission and higher load levels, it is recommended to use circular openings and patches, while strictly controlling the repair process.

Author Contributions

Conceptualization, R.X. and F.W.; methodology, R.X. and F.W.; software, R.X. and Y.Y.; validation, R.X. and Y.Y.; writing—original draft preparation, R.X.; writing—review and editing, R.X. and Y.Y.; visualization, R.X. and Y.Y.; supervision, F.W.; project administration, F.W.; funding acquisition, F.W. and G.L. All authors have read and agreed to the published version of the manuscript.

Funding

This research received no external funding.

Institutional Review Board Statement

Not applicable.

Informed Consent Statement

Not applicable.

Data Availability Statement

The raw data supporting the conclusions of this article will be made available by the authors on request.

Conflicts of Interest

Author Yang Yang was employed by the company Boea Wisdom (Hangzhou) Network Technology Co., Ltd. The remaining authors and Yang Yang declare that the research was conducted in the absence of any commercial or financial relationships that could be construed as a potential conflict of interest.

References

  1. Wang, C.H.; Duong, C.N. Bonded Joints and Repairs to Composite Airframe Structures; Academic Press: Cambridge, MA, USA, 2015. [Google Scholar]
  2. Jefferson, A.J.; Arumugam, V.; Dhakal, H.N. Repair of Polymer Composites: Methodology, Techniques, and Challenges; Woodhead Publishing: Cambridge, UK, 2018. [Google Scholar]
  3. Li, C.; Zhao, Q.; Yuan, J.; Hou, Y.; Tie, Y. Simulation and experiment on the effect of patch shape on adhesive repair of composite structures. J. Compos. Mater. 2019, 53, 4125–4135. [Google Scholar] [CrossRef]
  4. Baghdadi, M.; Serier, B.; Salem, M.; Zaoui, B.; Kaddouri, K. Modeling of acracked and repaired Al 2024T3 aircraft plate: Effect of the composite patch shape on therepair performance. Frat. Integrità Strutt. 2019, 50, 68–85. [Google Scholar] [CrossRef]
  5. Rachid, M.; Serier, B.; Bouiadjra, B. Numerical analysis of the patch shape effects on the performances of bonded composite repair in aircraft structures. Compos. Part B 2012, 43, 391–397. [Google Scholar] [CrossRef]
  6. Lee, H.; Seon, S.; Park, S.; Walallawita, R.; Lee, K. Effect of the geometric shapes of repair patches on bonding strength. J. Adhes. 2019, 95, 207–224. [Google Scholar] [CrossRef]
  7. Baker, A. Bonded composite repair of fatigue-cracked primary aircraft structure. Compos. Struct. 1999, 47, 431–443. [Google Scholar] [CrossRef]
  8. Katnametal, K.B. Bonded repair of composite aircraft structures: A review of scientific challenges and opportunities. Prog. Aerosp. Sci. 2013, 61, 26–42. [Google Scholar] [CrossRef]
  9. Rao, V.; Singh, R.; Malhotra, S. Residual strength and fatigue life assessment of composite patch repaired specimens. Compos. Part B Eng. 1999, 30, 621–627. [Google Scholar] [CrossRef]
  10. Xiong, J.; Shenoi, R. Integrated experimental screening of bonded composites patch repair schemes to notched aluminum-alloy panels based on static and fatigue strength concepts. Compos. Struct. 2008, 83, 266–272. [Google Scholar] [CrossRef]
  11. Yathisha, N.; Suresha, S. Influence of post curing methodology on strength of polymer matrix composites with a circular hole and square inbuilt patches. Mater. Today Proc. 2021, 44, 1296–1299. [Google Scholar] [CrossRef]
  12. Hamoush, S.; Shivakumar, K.; Darwish, F.; Sharpe, M.; Swindell, P. Defective Repairs of Laminated Solid Composites. J. Compos. Mater. 2005, 39, 2185–2196. [Google Scholar] [CrossRef]
  13. Gunnion, A.J.; Herszberg, I. Parametric study of scarf joints in composite structures. Compos. Struct. 2006, 75, 364–376. [Google Scholar] [CrossRef]
  14. Bendemra, H.; Compston, P.; Crothers, P.J. Optimisation study of tapered scarf and stepped-lap joints in composite repair patches. Compos. Struct. 2015, 130, 1–8. [Google Scholar] [CrossRef]
  15. Yoo, J.-S.; Truong, V.-H.; Park, M.-Y.; Choi, J.-H.; Kweon, J.-H. Parametric study on static and fatigue strength recovery of scarf-patch-repaired composite laminates. Compos. Struct. 2016, 140, 417–432. [Google Scholar] [CrossRef]
  16. Sahoo, C.K.; Bhatia, G.S.; Arockiarajan, A. Effect of patch-parent stacking sequence and patch stiffness on the tensile behaviour of the patch repaired carbon-glass hybrid composite. Thin-Walled Struct. 2022, 179, 109551. [Google Scholar] [CrossRef]
  17. Kashfuddoja, M.; Ramji, M. Design of optimum patch shape and size for bonded repair on damaged Carbon fibre reinforced polymer panels. Mater. Des. 2014, 54, 174–183. [Google Scholar] [CrossRef]
  18. Benyahia, F.; Albedah, A.; Bouiadjra, B.B. Analysis of the adhesive damage for different patch shapes in bonded composite repair of aircraft structures. Mater. Des. 2014, 54, 18–24. [Google Scholar] [CrossRef]
  19. Jakobsen, J.; Endelt, B.; Shakibapour, F. Bolted joint method for composite materials using a novel fiber/metal patch as hole reinforcement—Improving both static and fatigue properties. Compos. Part B Eng. 2024, 269, 111105. [Google Scholar] [CrossRef]
  20. Rashvand, K.; Eder, M.A.; Sarhadi, A. In-situ and adhesive repair of continuous fiber composites using 3D printing. Addit. Manuf. 2024, 80, 103975. [Google Scholar] [CrossRef]
  21. Li, L.; Liu, W.; Wang, Y.; Zhao, Z. Mechanical performance and damage monitoring of CFRP thermoplastic laminates with an open hole repaired by 3D printed patches. Compos. Struct. 2023, 303, 116308. [Google Scholar] [CrossRef]
  22. Kushwaha, M.; Bhatia, G.S.; Arockiarajan, A. Nonlinear progressive damage model for woven patch-repaired laminate composites. Compos. Struct. 2023, 320, 117154. [Google Scholar] [CrossRef]
  23. Liu, H.; Liu, J.; Hall, Z.E.; Brooks, R.A.; Crocker, J.W.; Joesbury, A.M.; Harper, L.T.; Blackman, B.R.; Kinloch, A.J.; Dear, J.P. Modelling the effects of patch-plug configuration on the impact performance of patch-repaired composite laminates. Compos. Sci. Technol. 2023, 233, 109917. [Google Scholar] [CrossRef]
  24. Zhao, Y.; Hu, K.; Fu, B.; Wang, Z.; Wang, Y.; Yao, X. Reliability analysis of composite laminate patch repaired structures based on response surface proxy model. Compos. Commun. 2023, 42, 101689. [Google Scholar] [CrossRef]
  25. GB/T 3354-2014; Test Method for Tensile Properties of Orientation Fiber Reinforced Polymer Matrix Composite Materials. Chinese Standard: Beijing, China, 2014.
Figure 1. Different shapes of composite material repair patches.
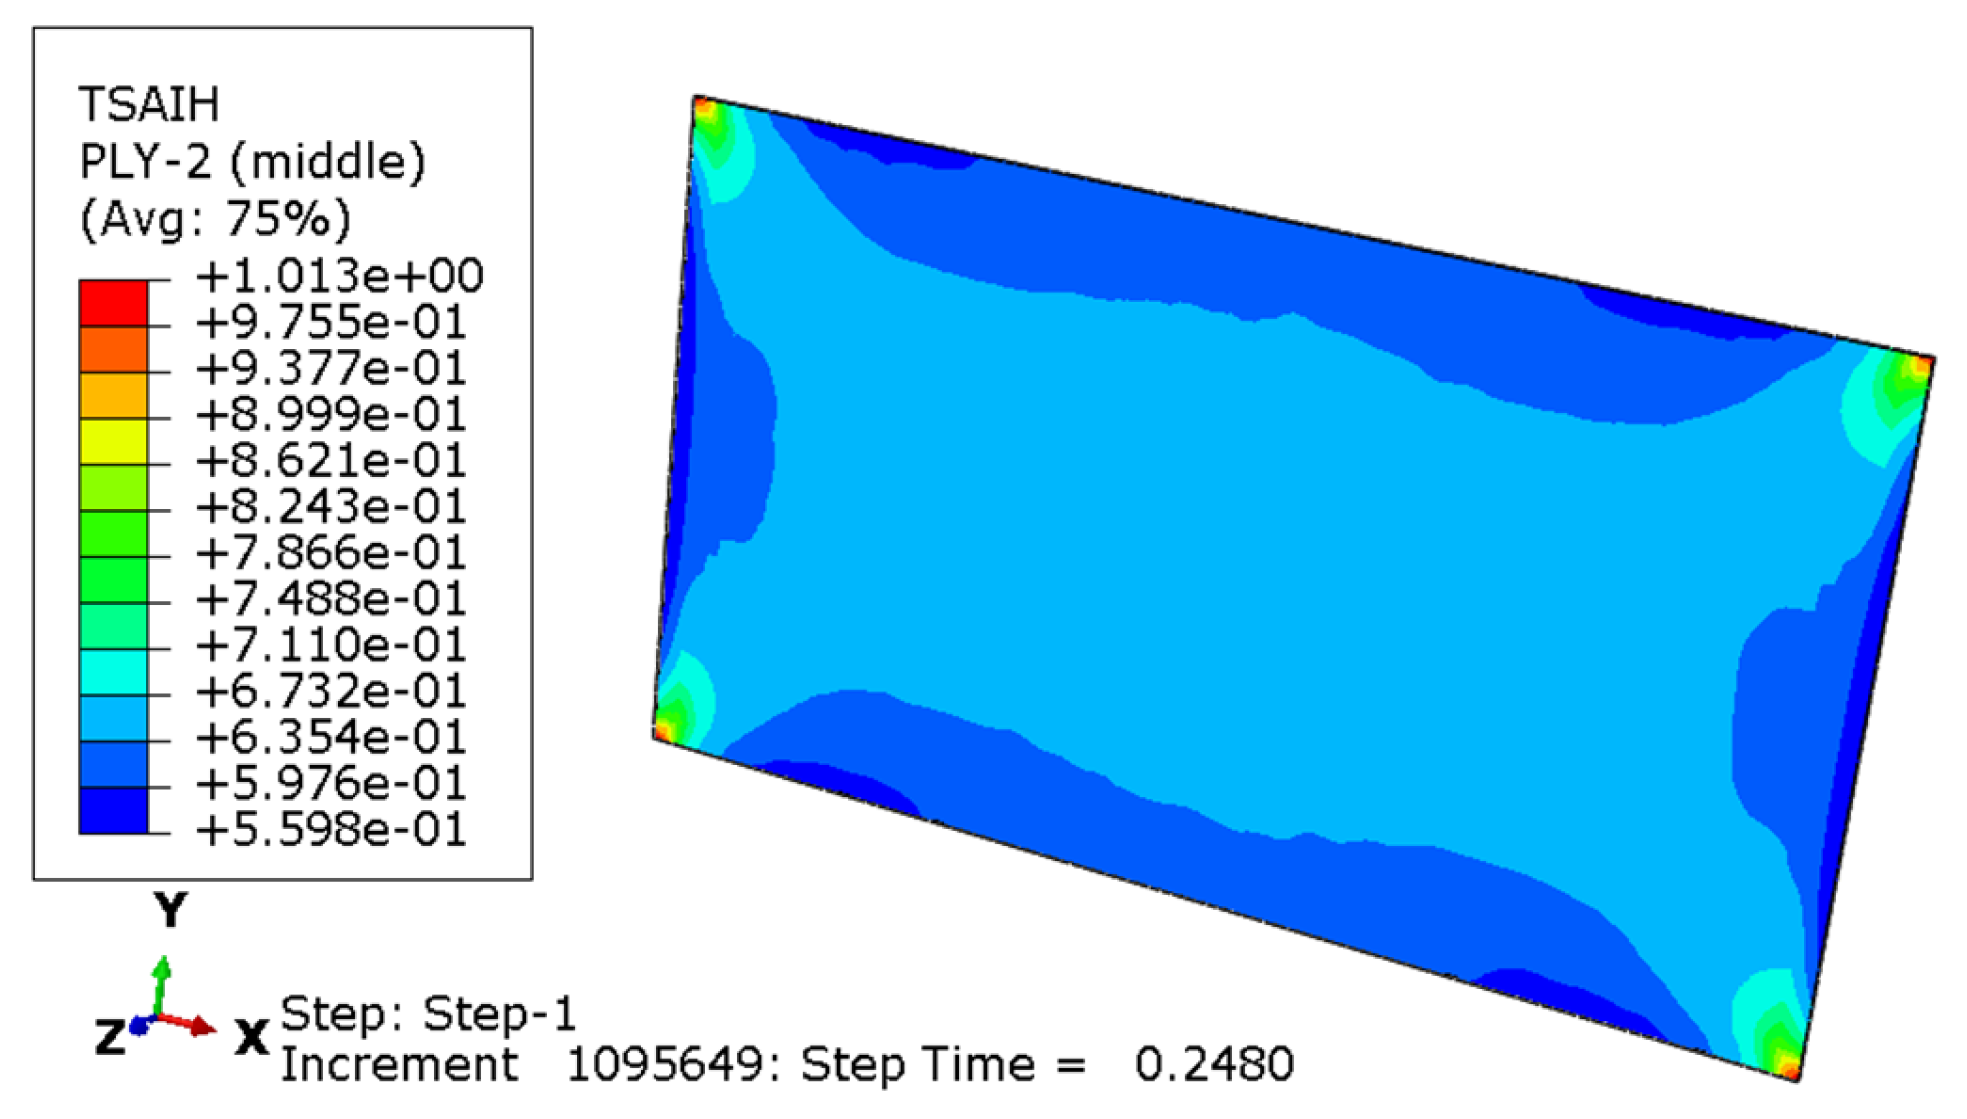
Applsci 14 04397 g001
Figure 2. The first layer’s failure coefficient cloud map.
Applsci 14 04397 g002
Figure 3. The second layer’s failure coefficient cloud map.
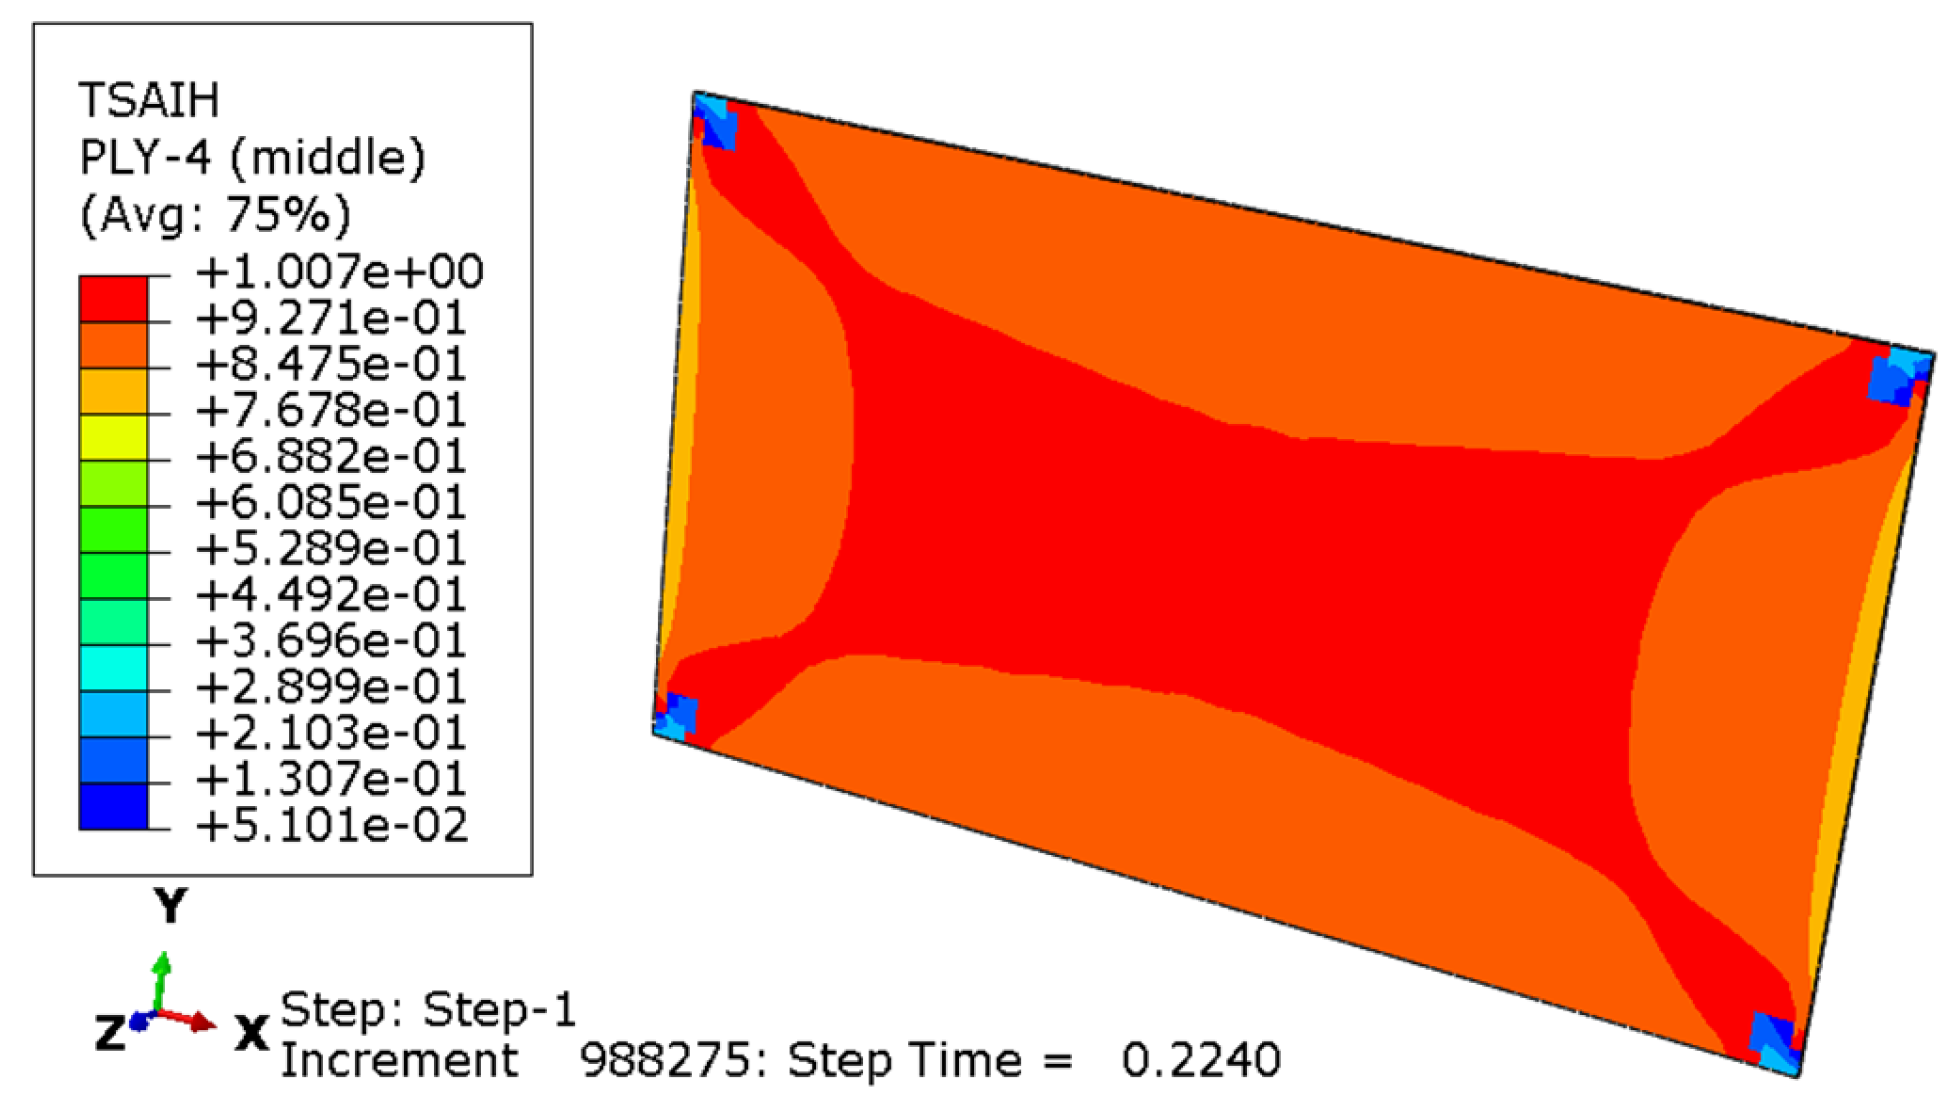
Applsci 14 04397 g003
Figure 4. The third layer’s failure coefficient cloud map.
Applsci 14 04397 g004
Figure 5. The fourth layer’s failure coefficient cloud map.
Applsci 14 04397 g005
Figure 6. The force–displacement curve of healthy composite laminates.
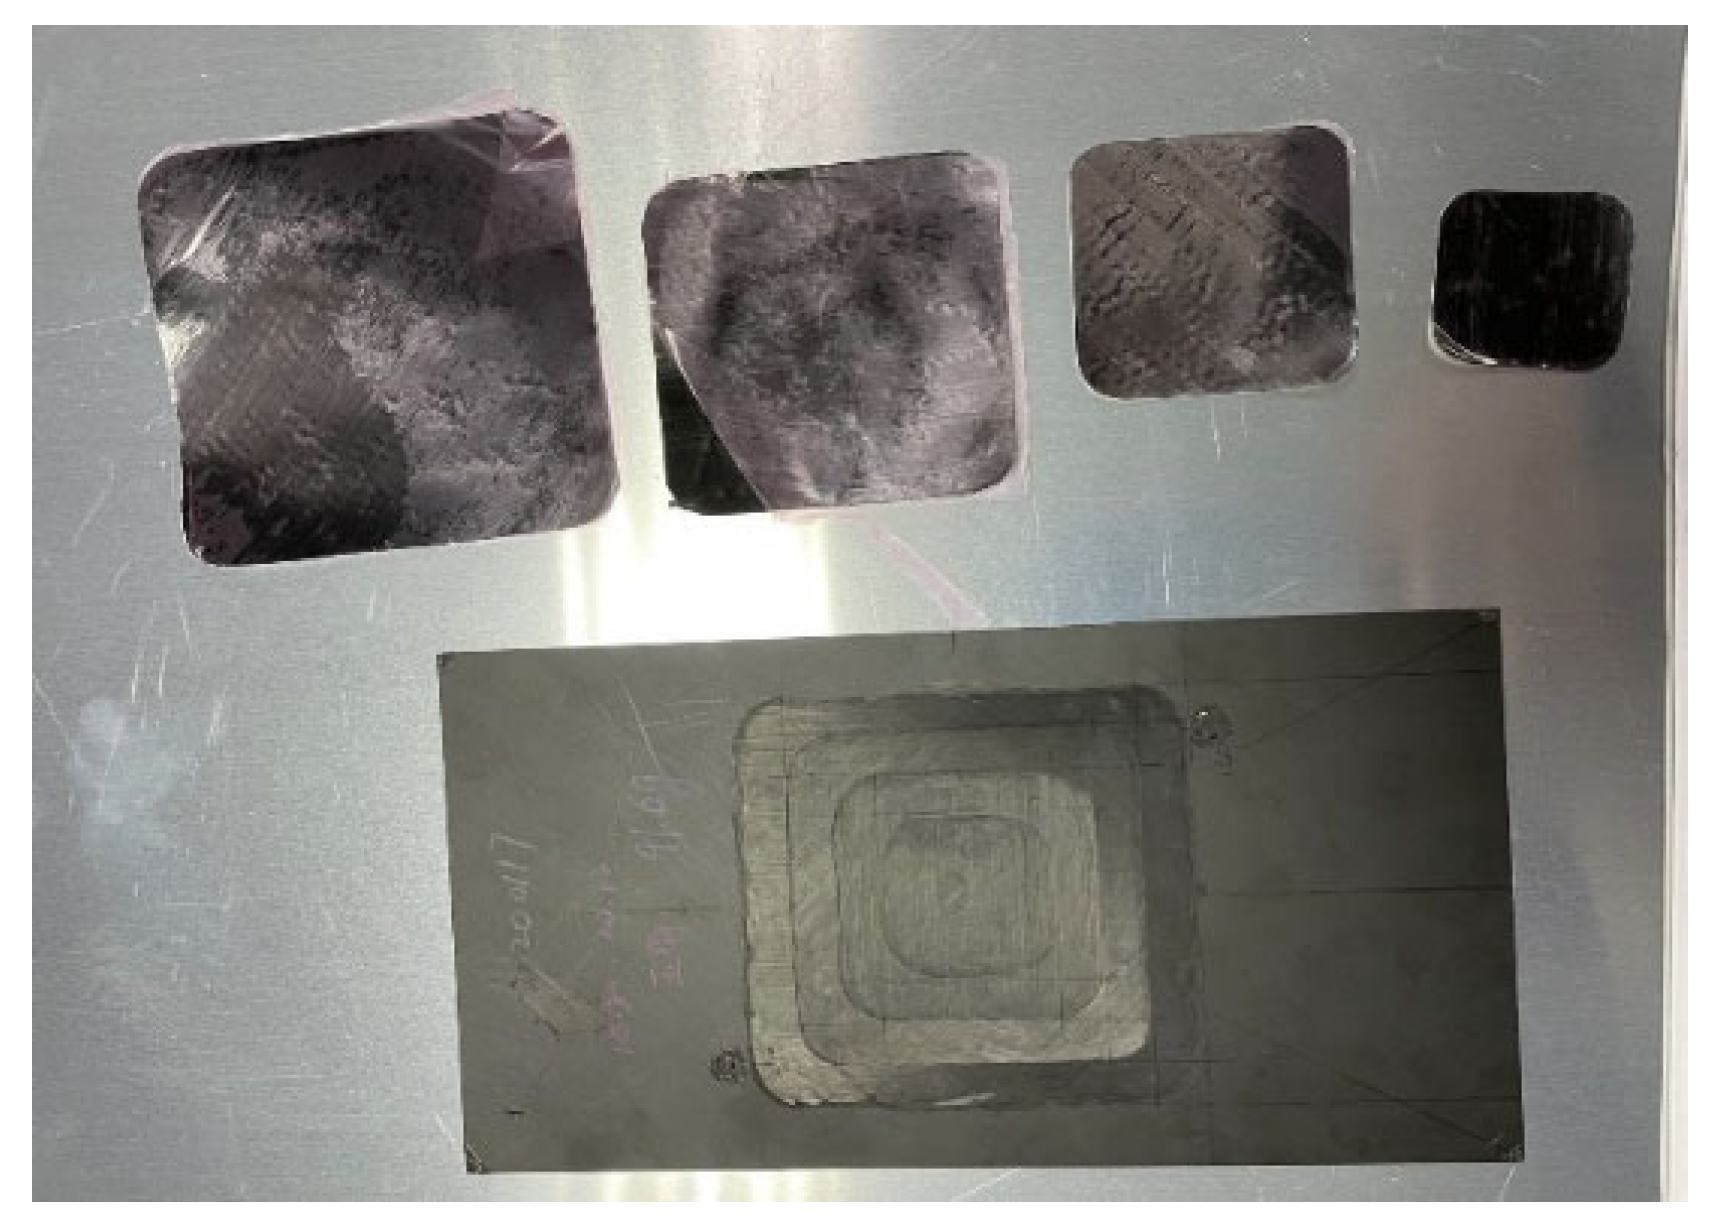
Applsci 14 04397 g006
Figure 7. Rectangular perforated panel and its patch.
Applsci 14 04397 g007
Figure 8. Circle perforated panel and its patch.
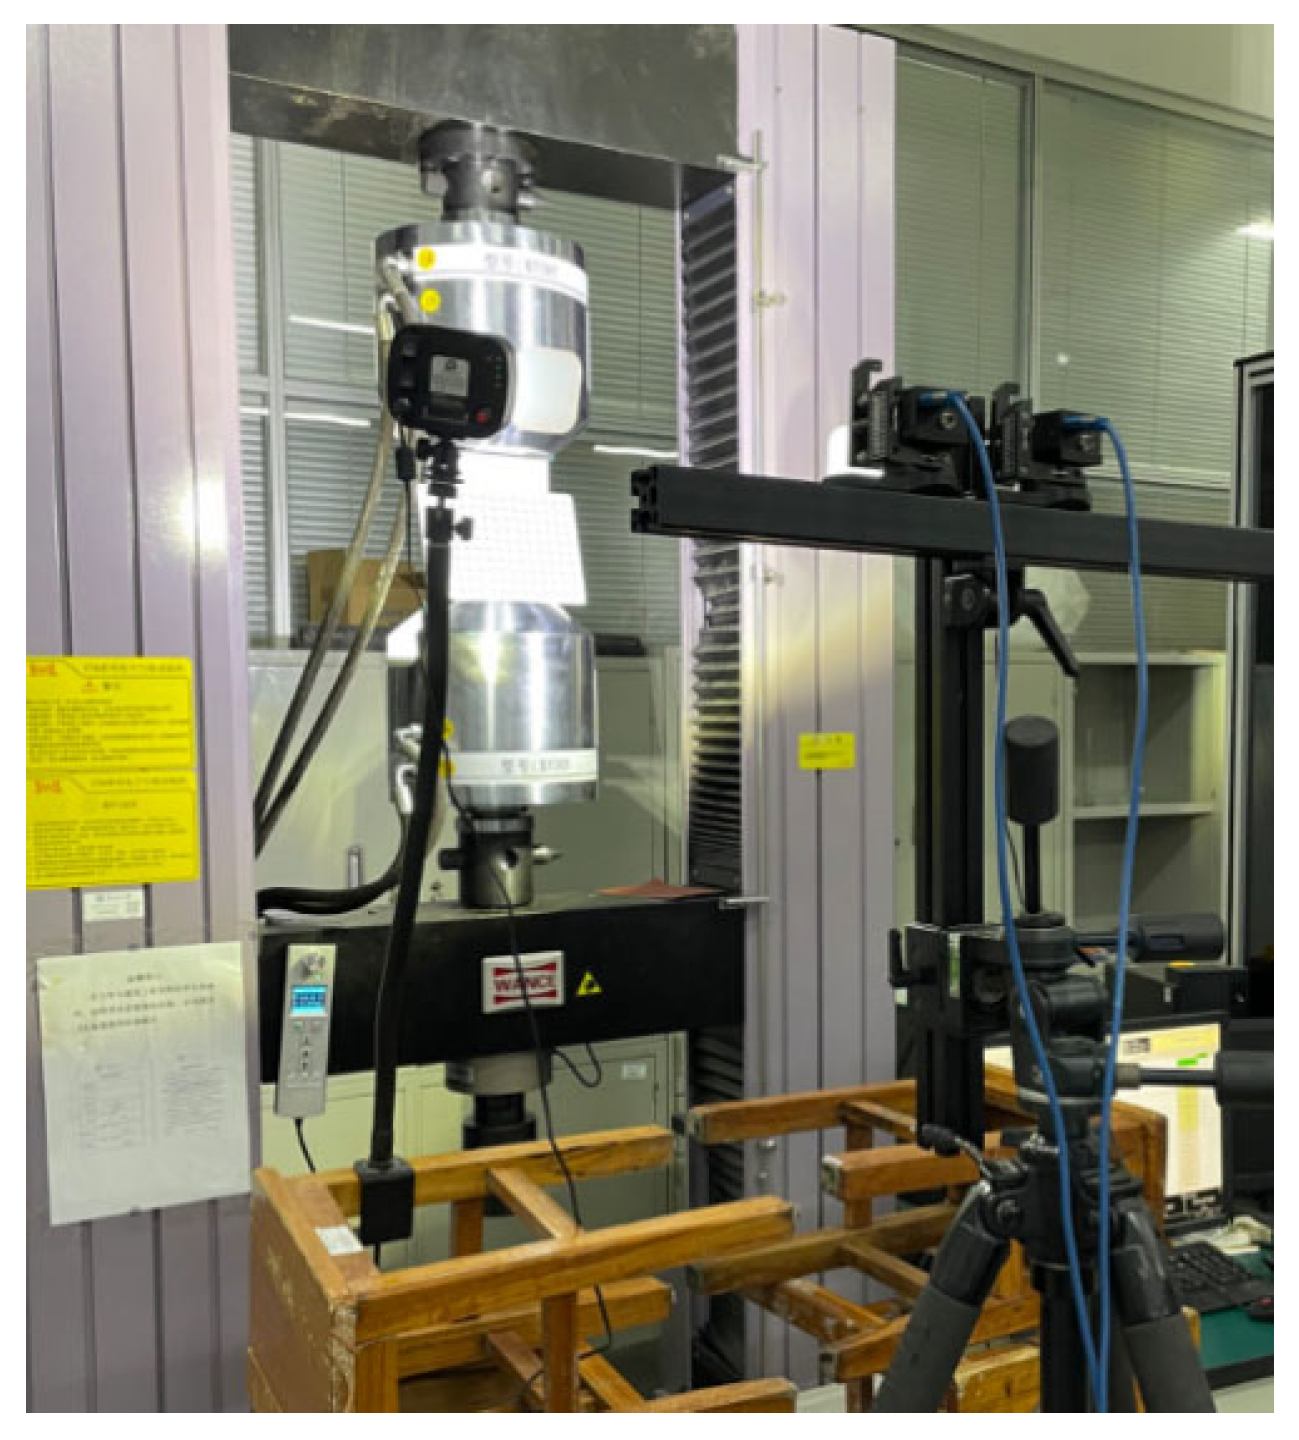
Applsci 14 04397 g008
Figure 9. Experimental equipment condition.
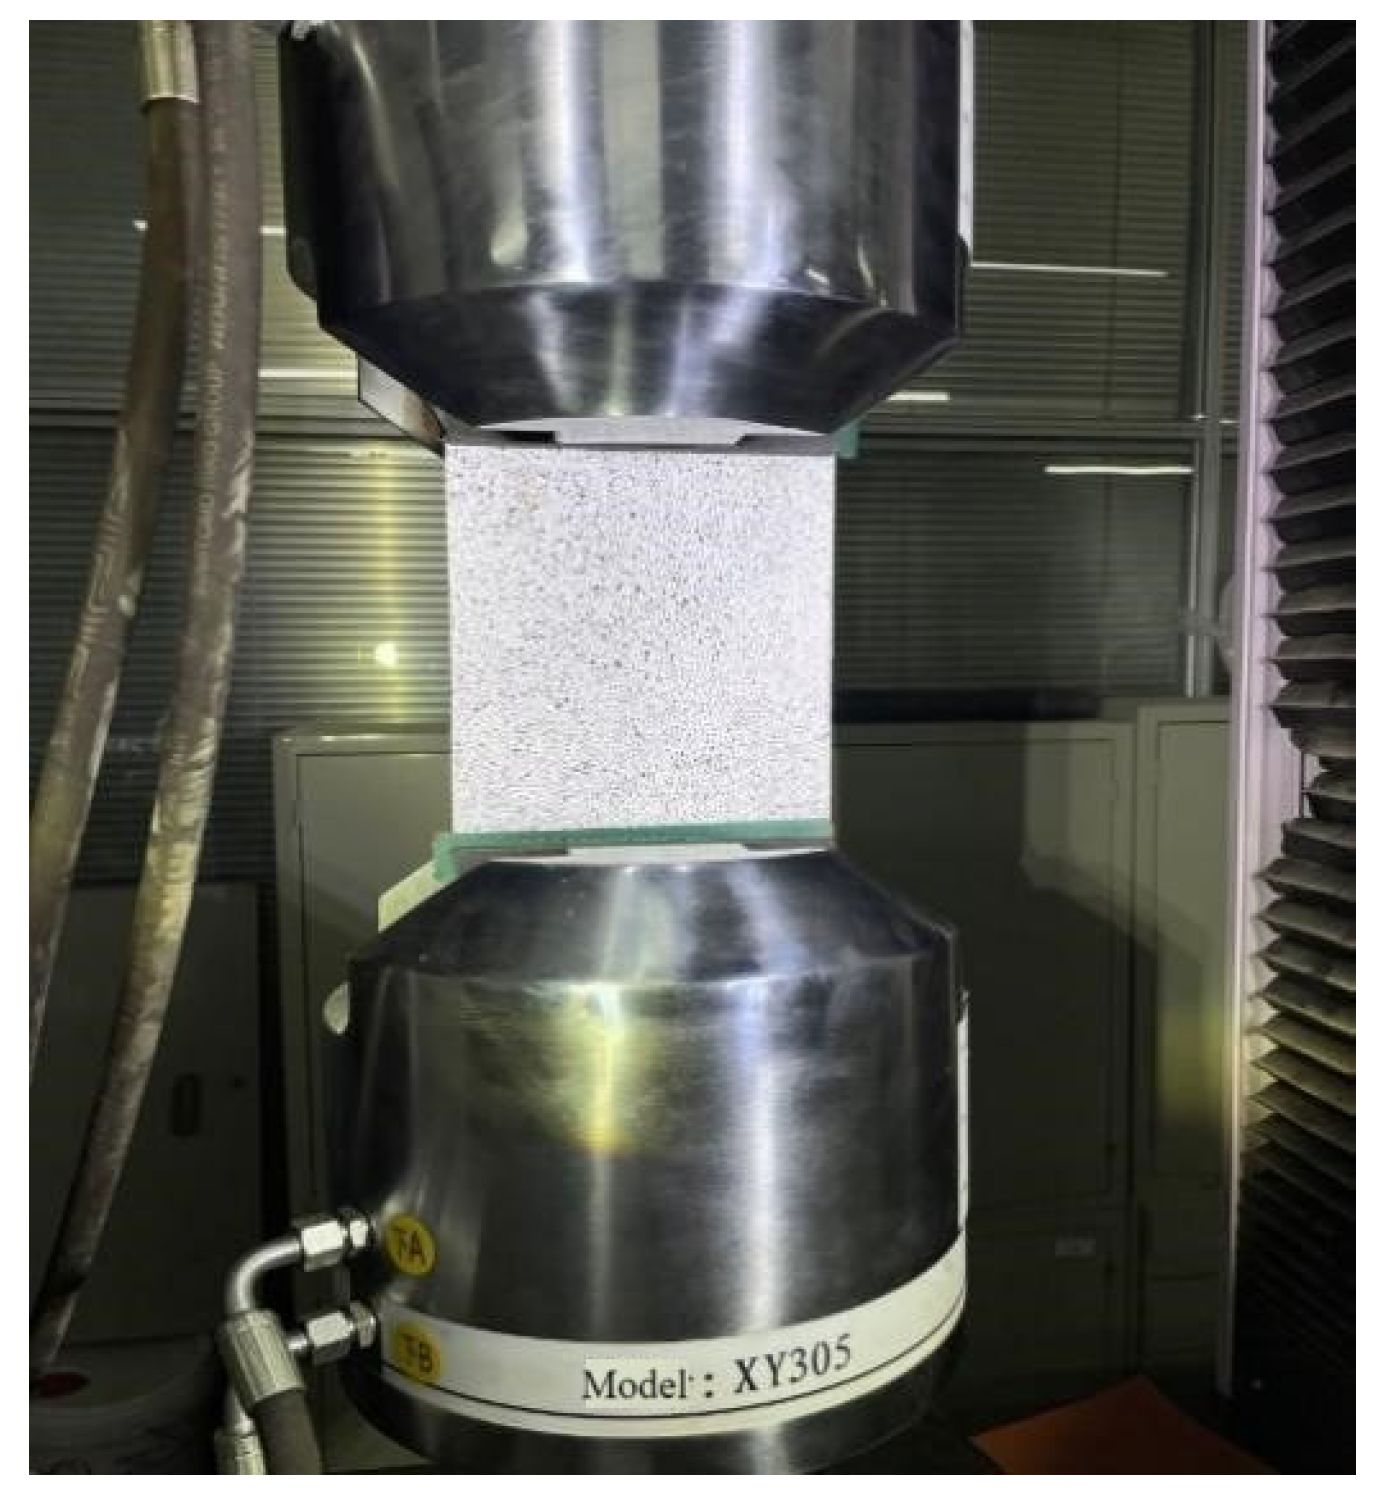
Applsci 14 04397 g009
Figure 10. Experimental specimen loading condition.
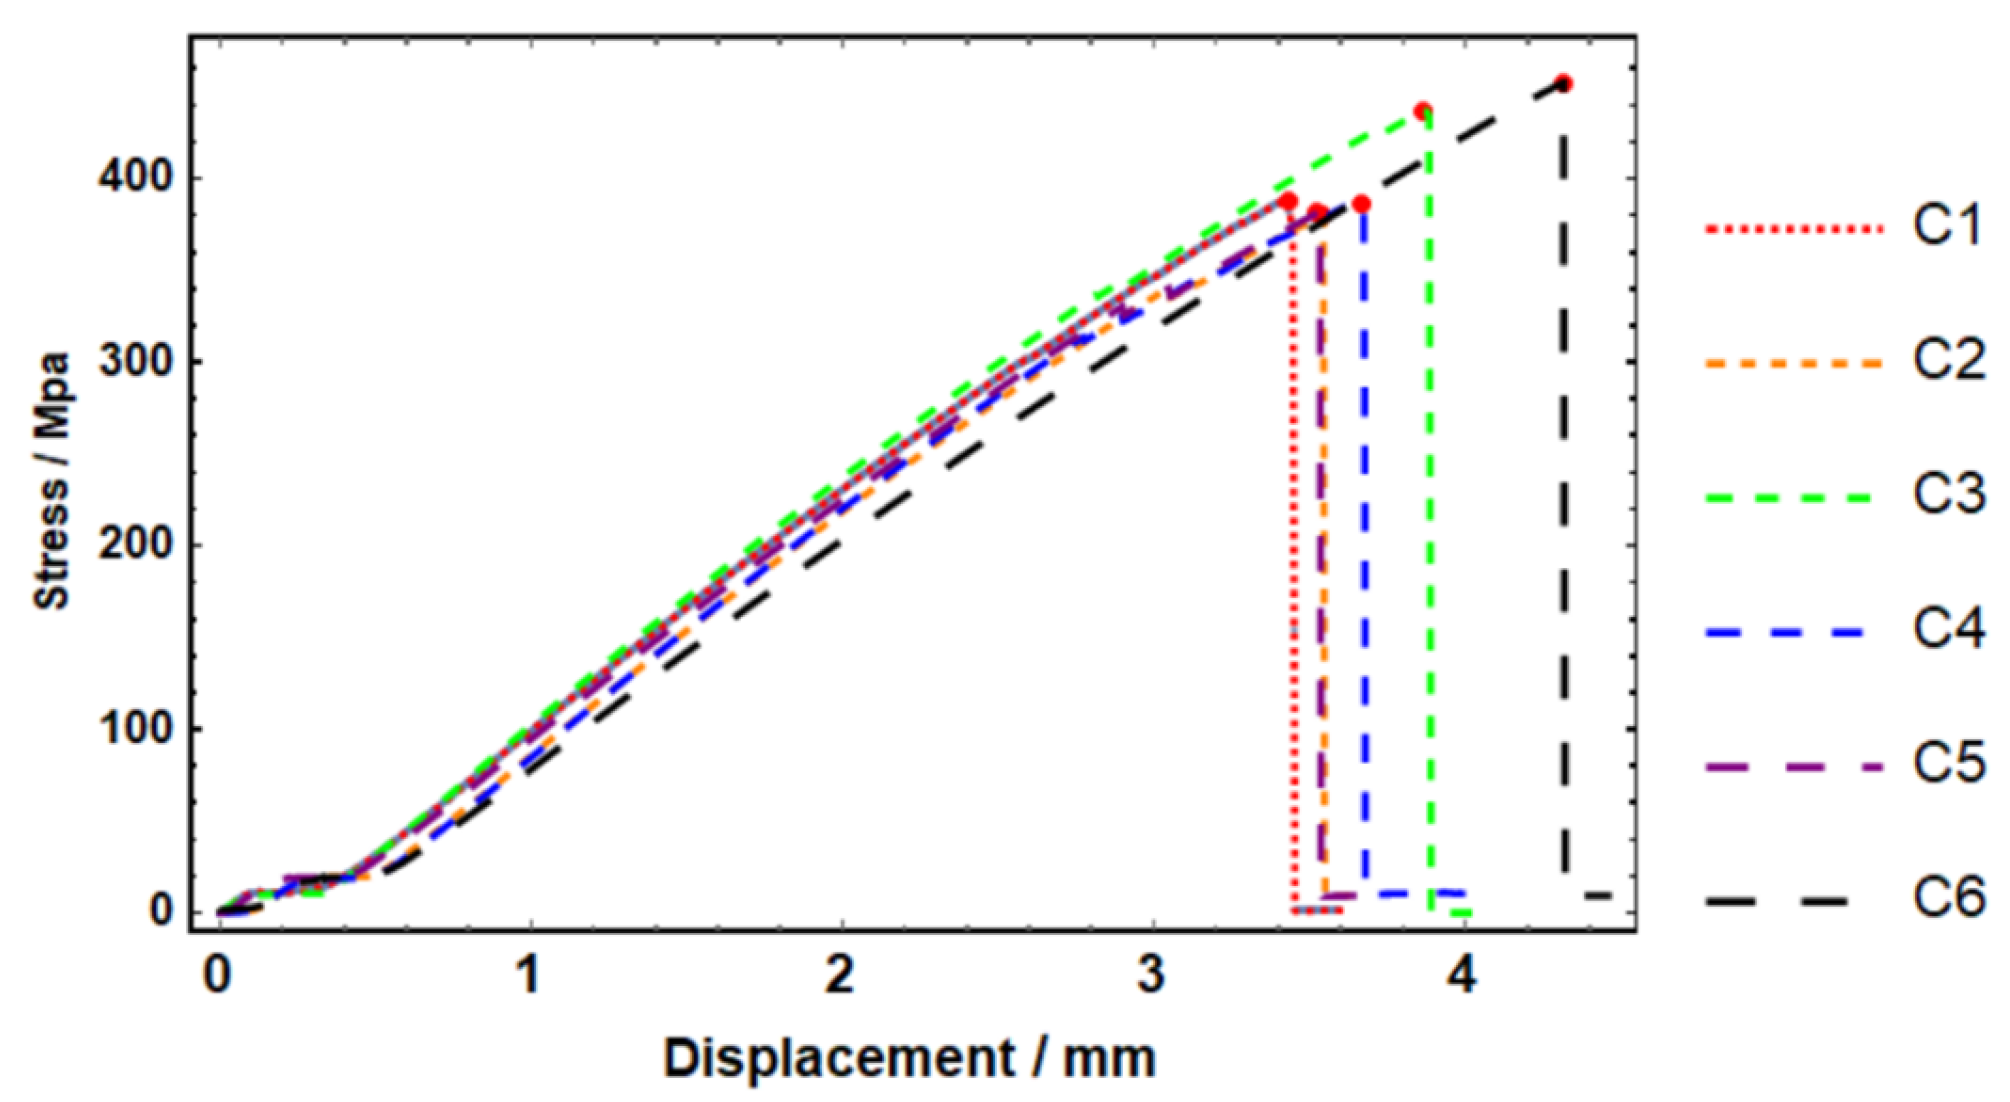
Applsci 14 04397 g010
Figure 11. Stress–displacement curve of circular patch specimens.
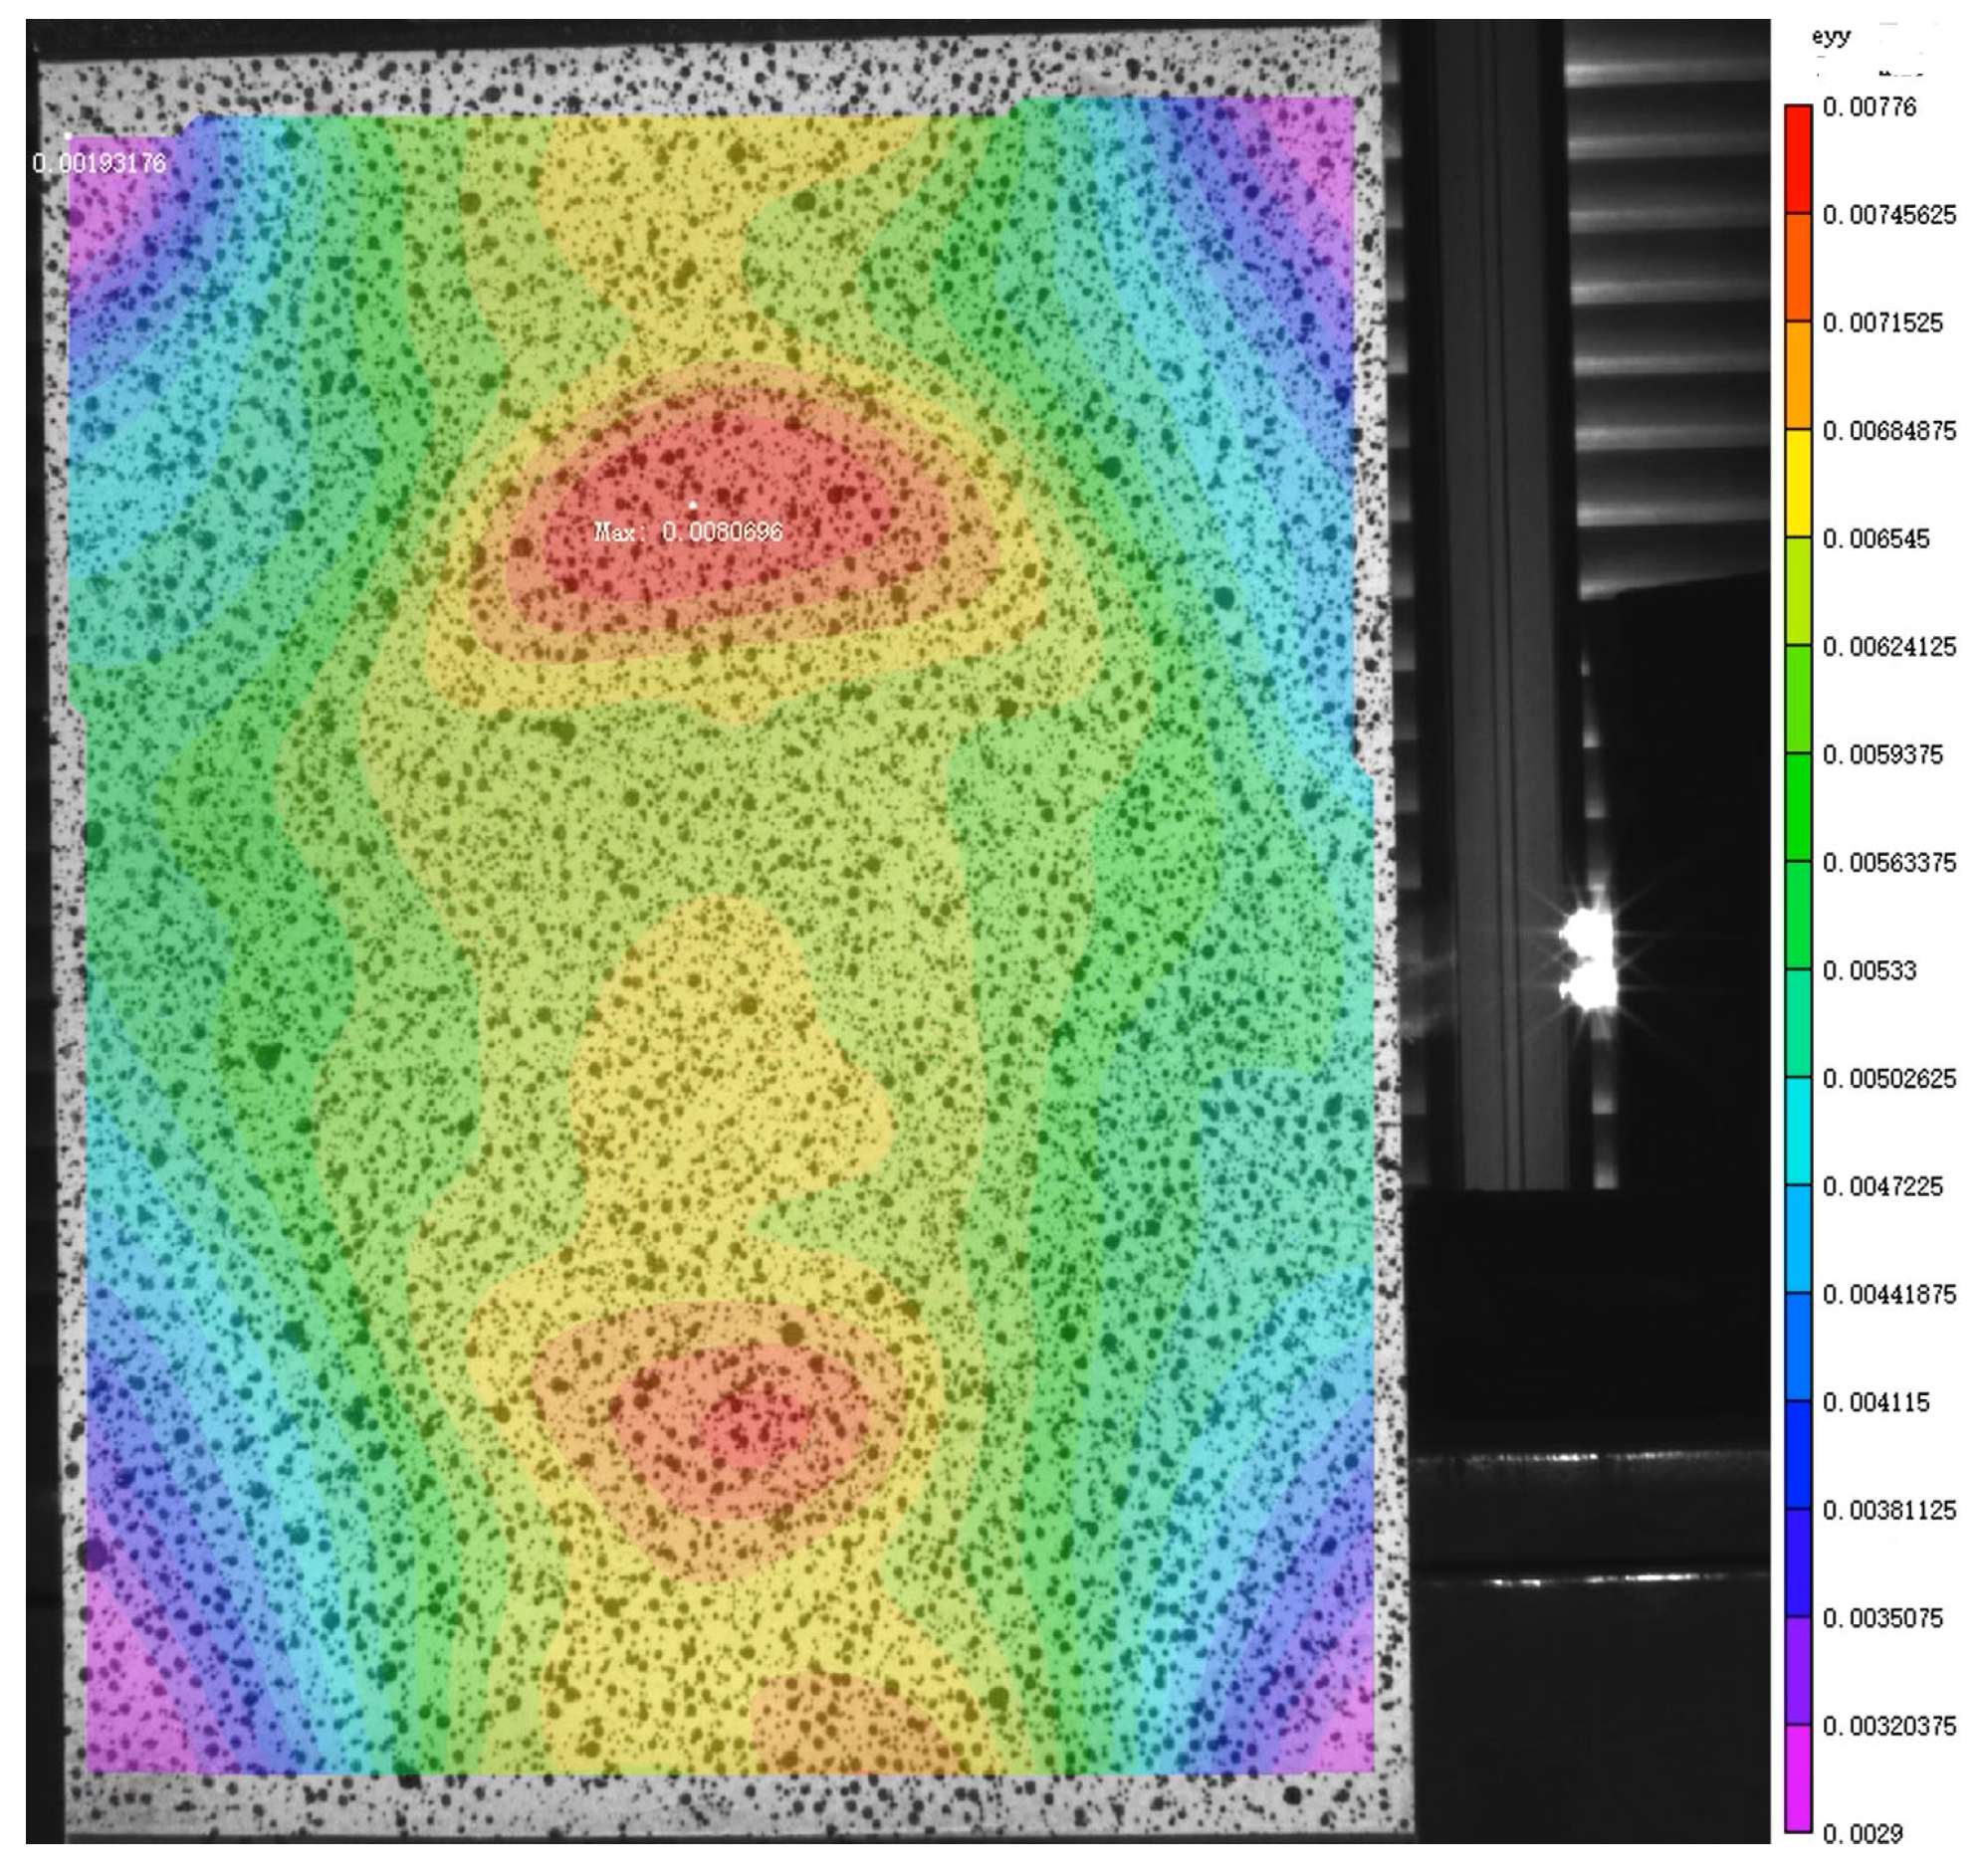
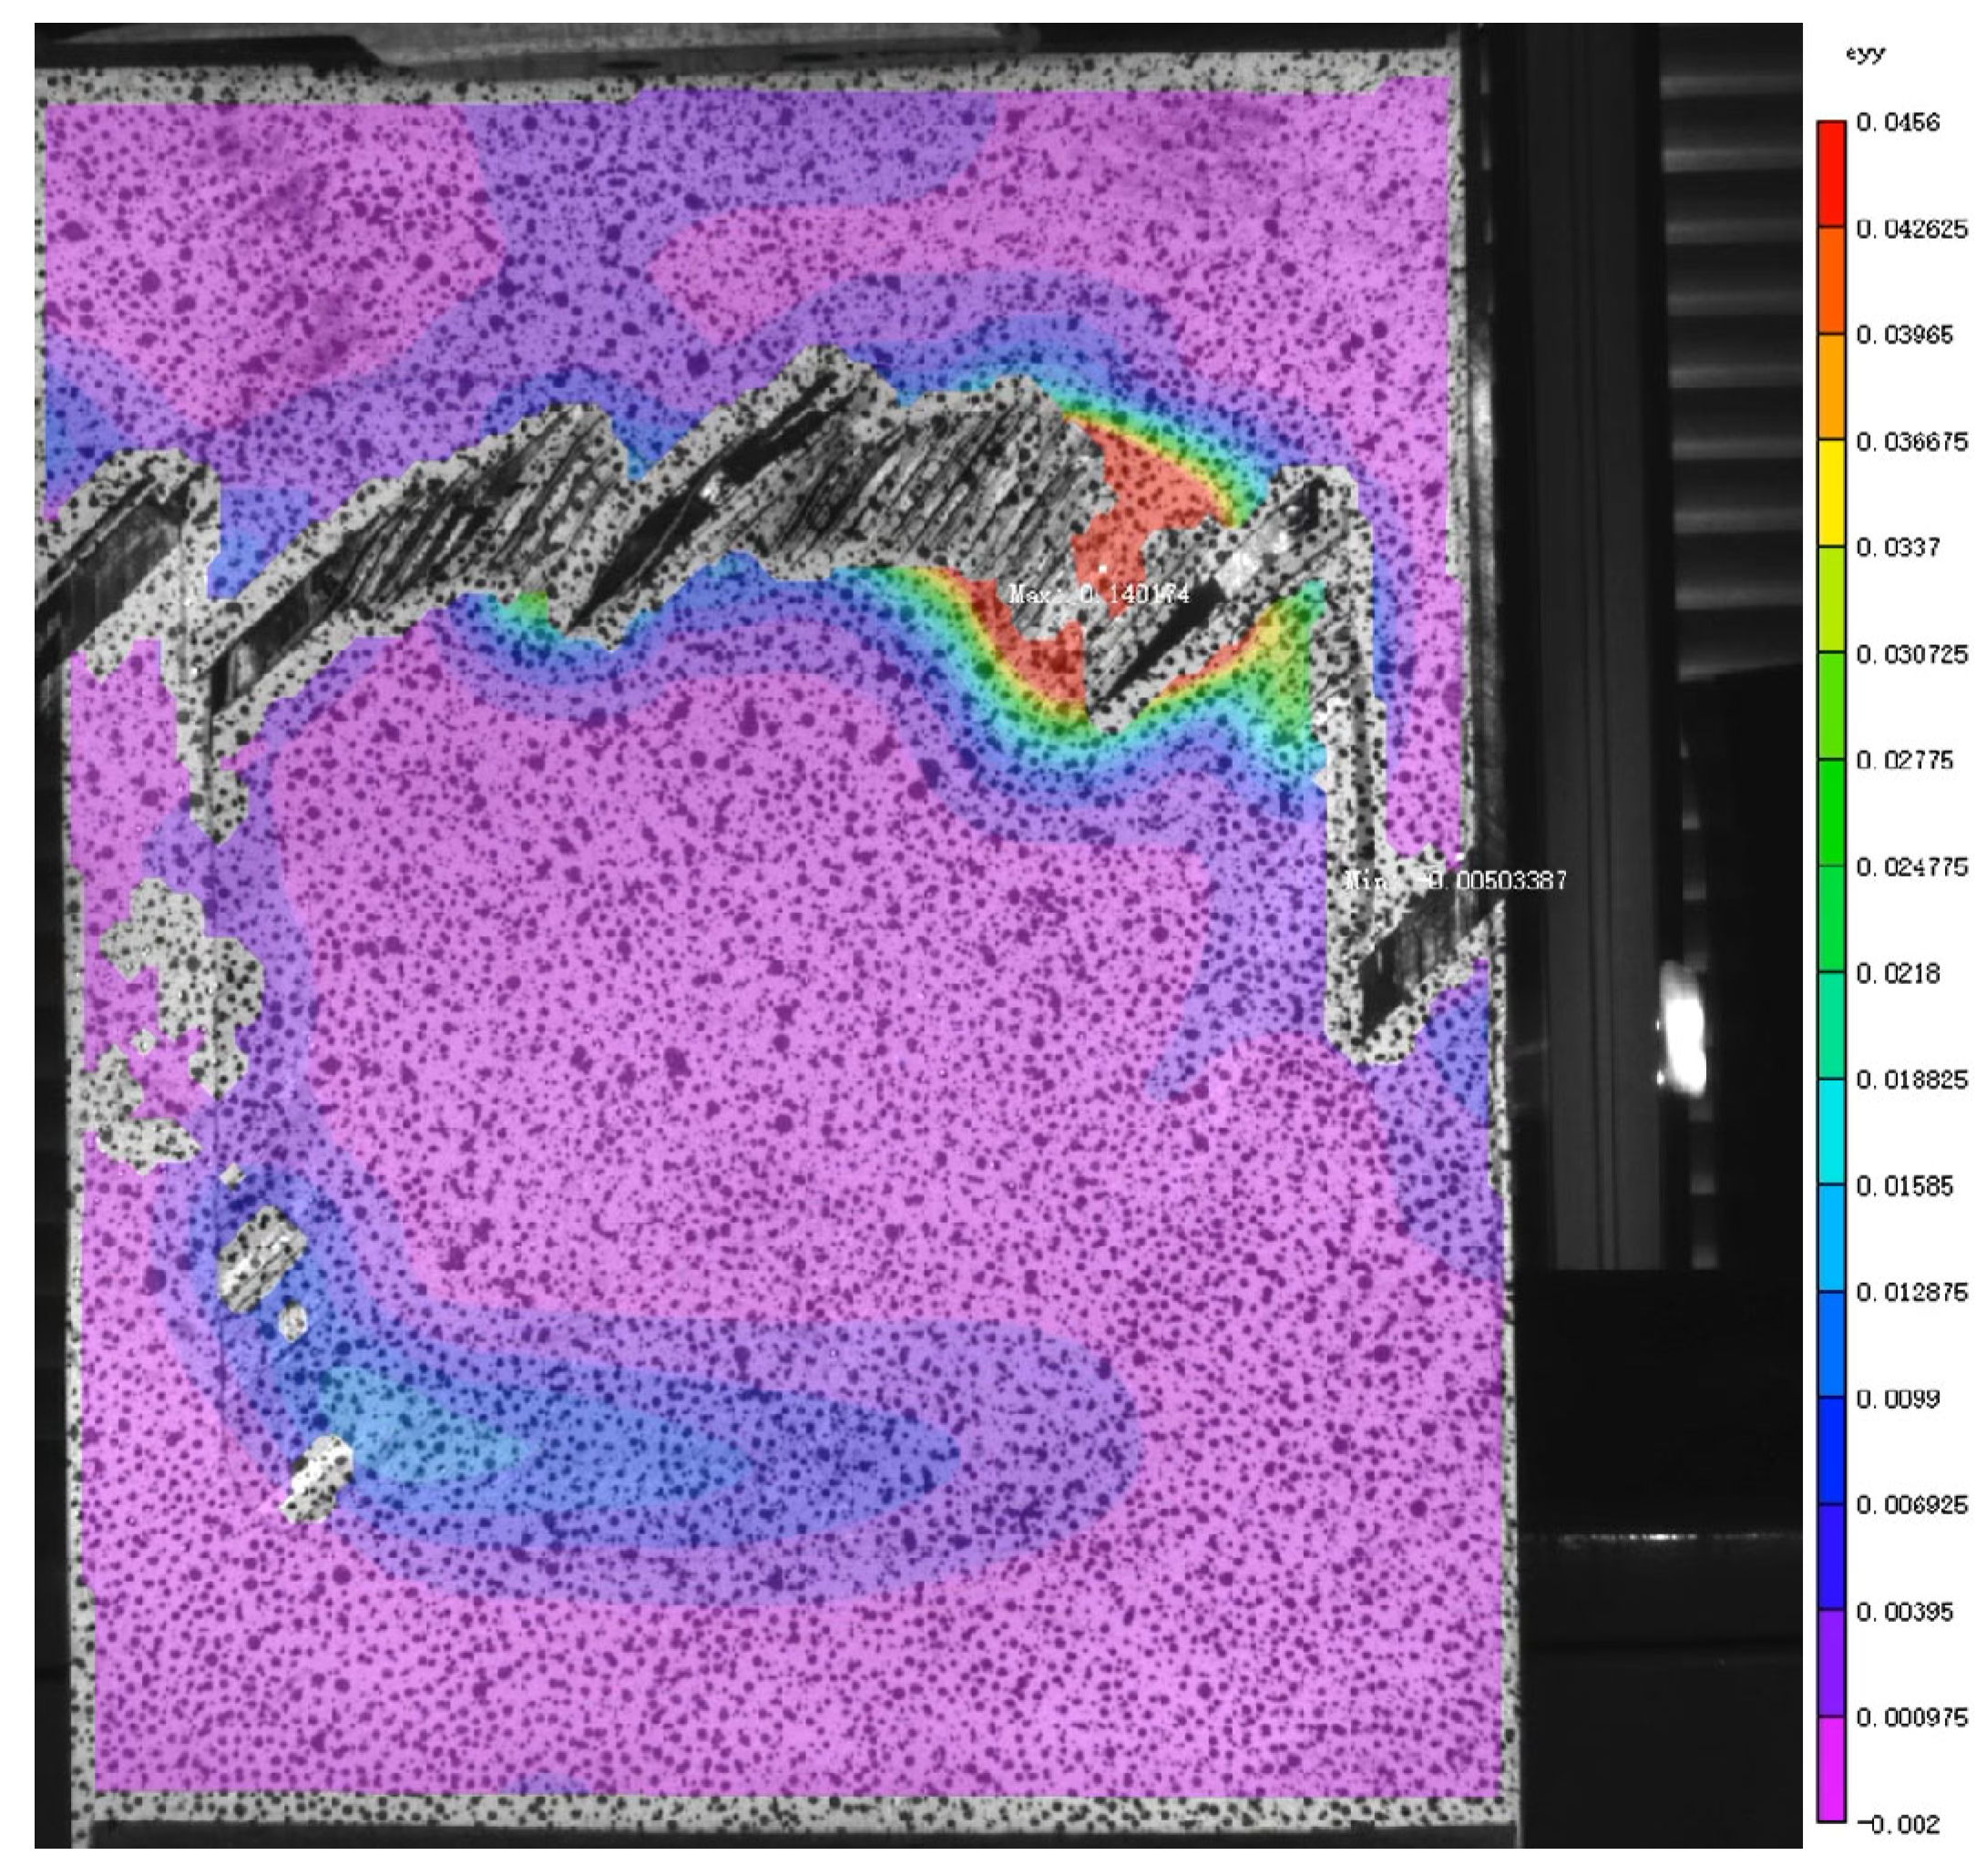
Applsci 14 04397 g011
Figure 12. Y−direction strain before fracture of the specimen with a circular patch.
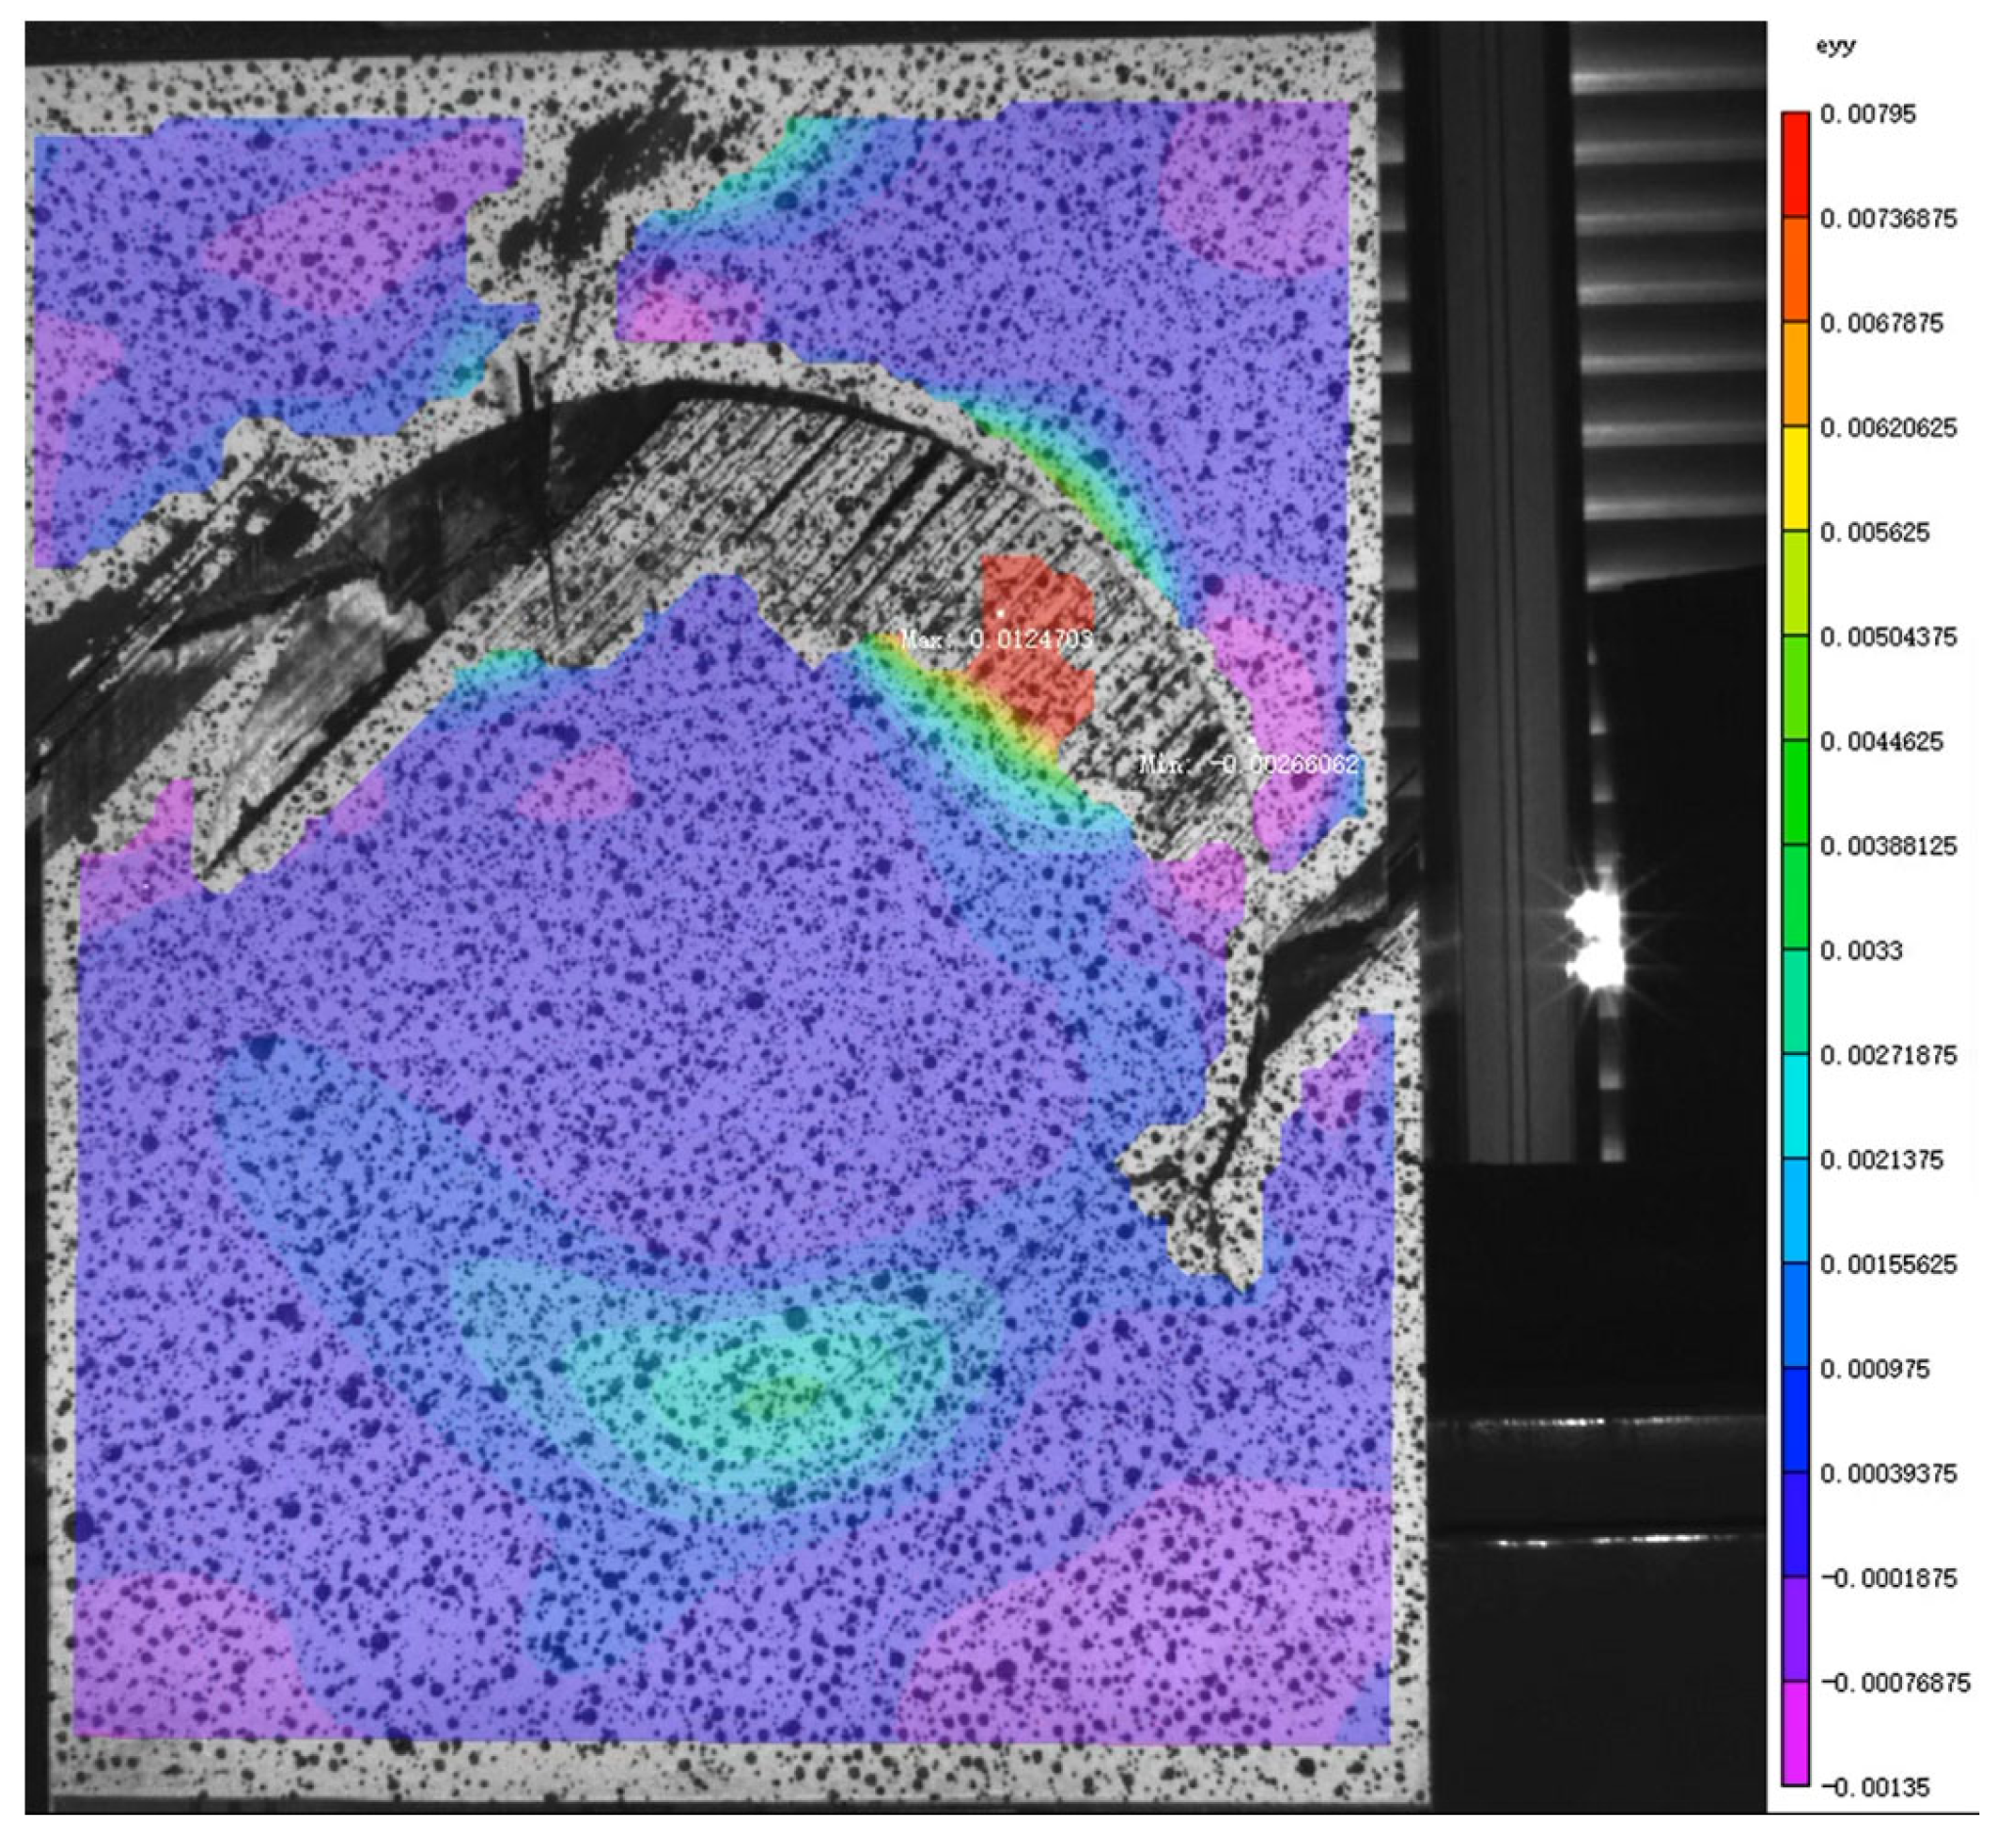
Applsci 14 04397 g012
Figure 13. Y−direction strain after fracturing of specimen with a circular patch.
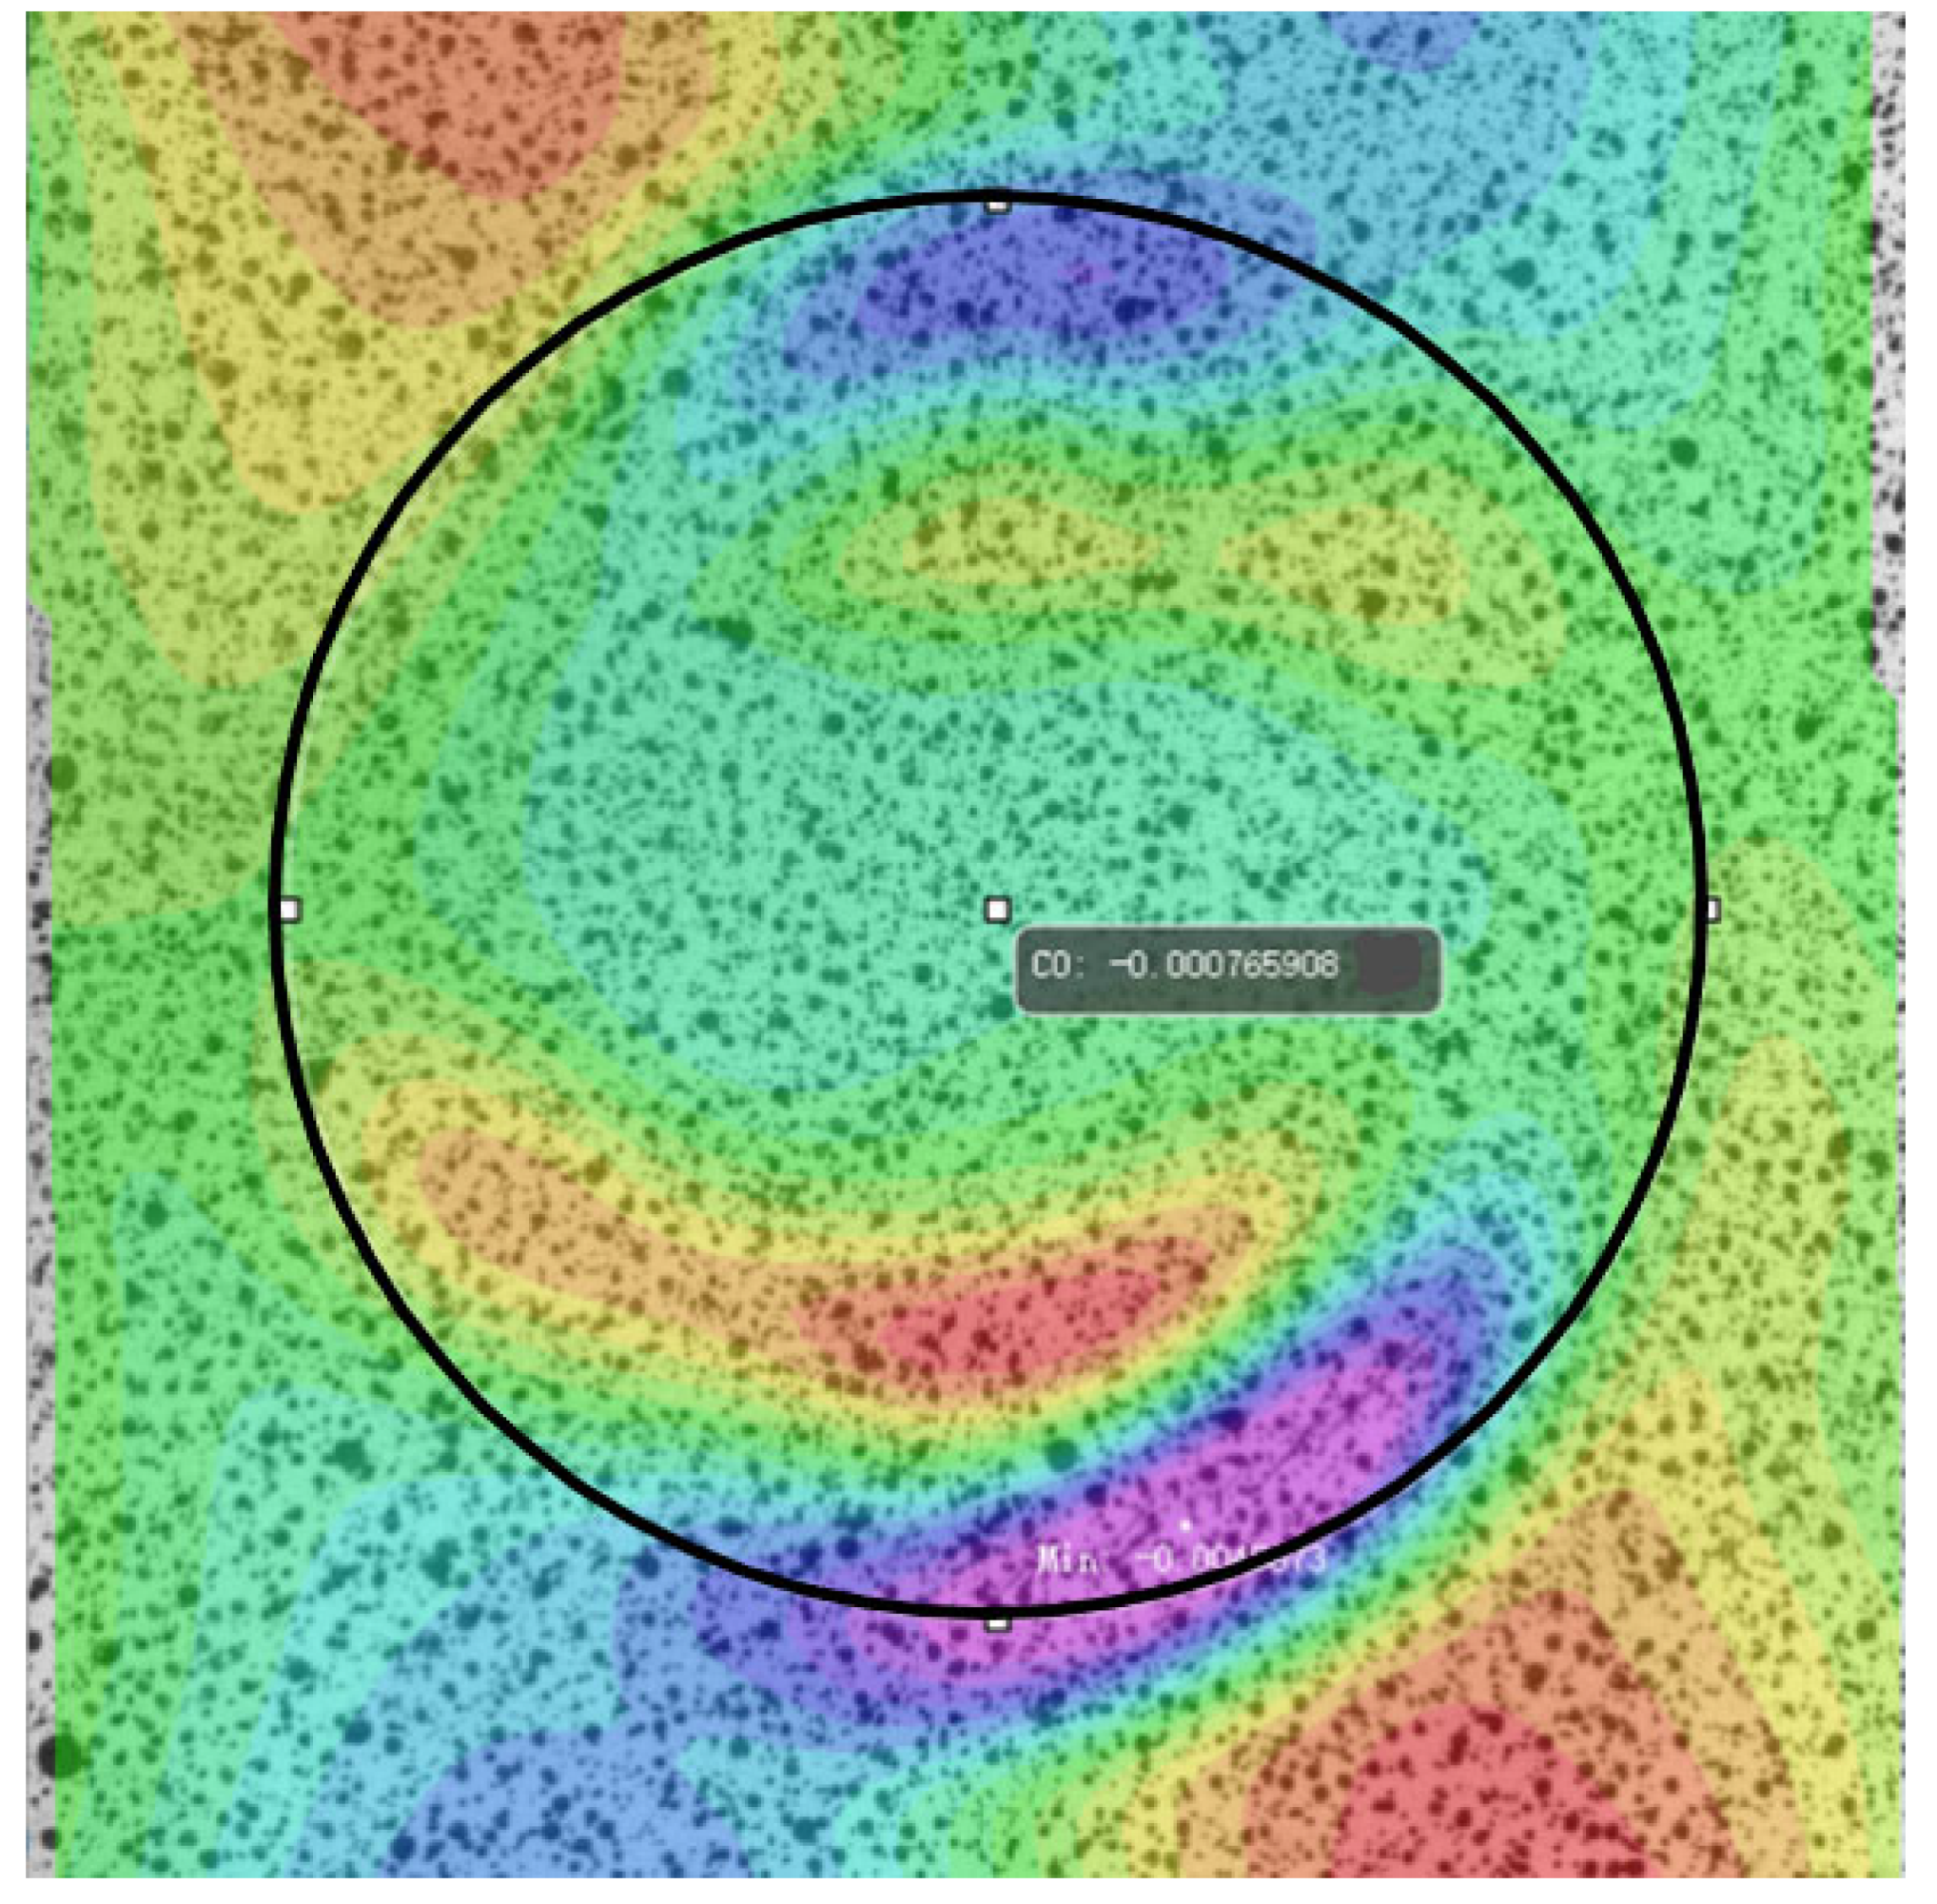
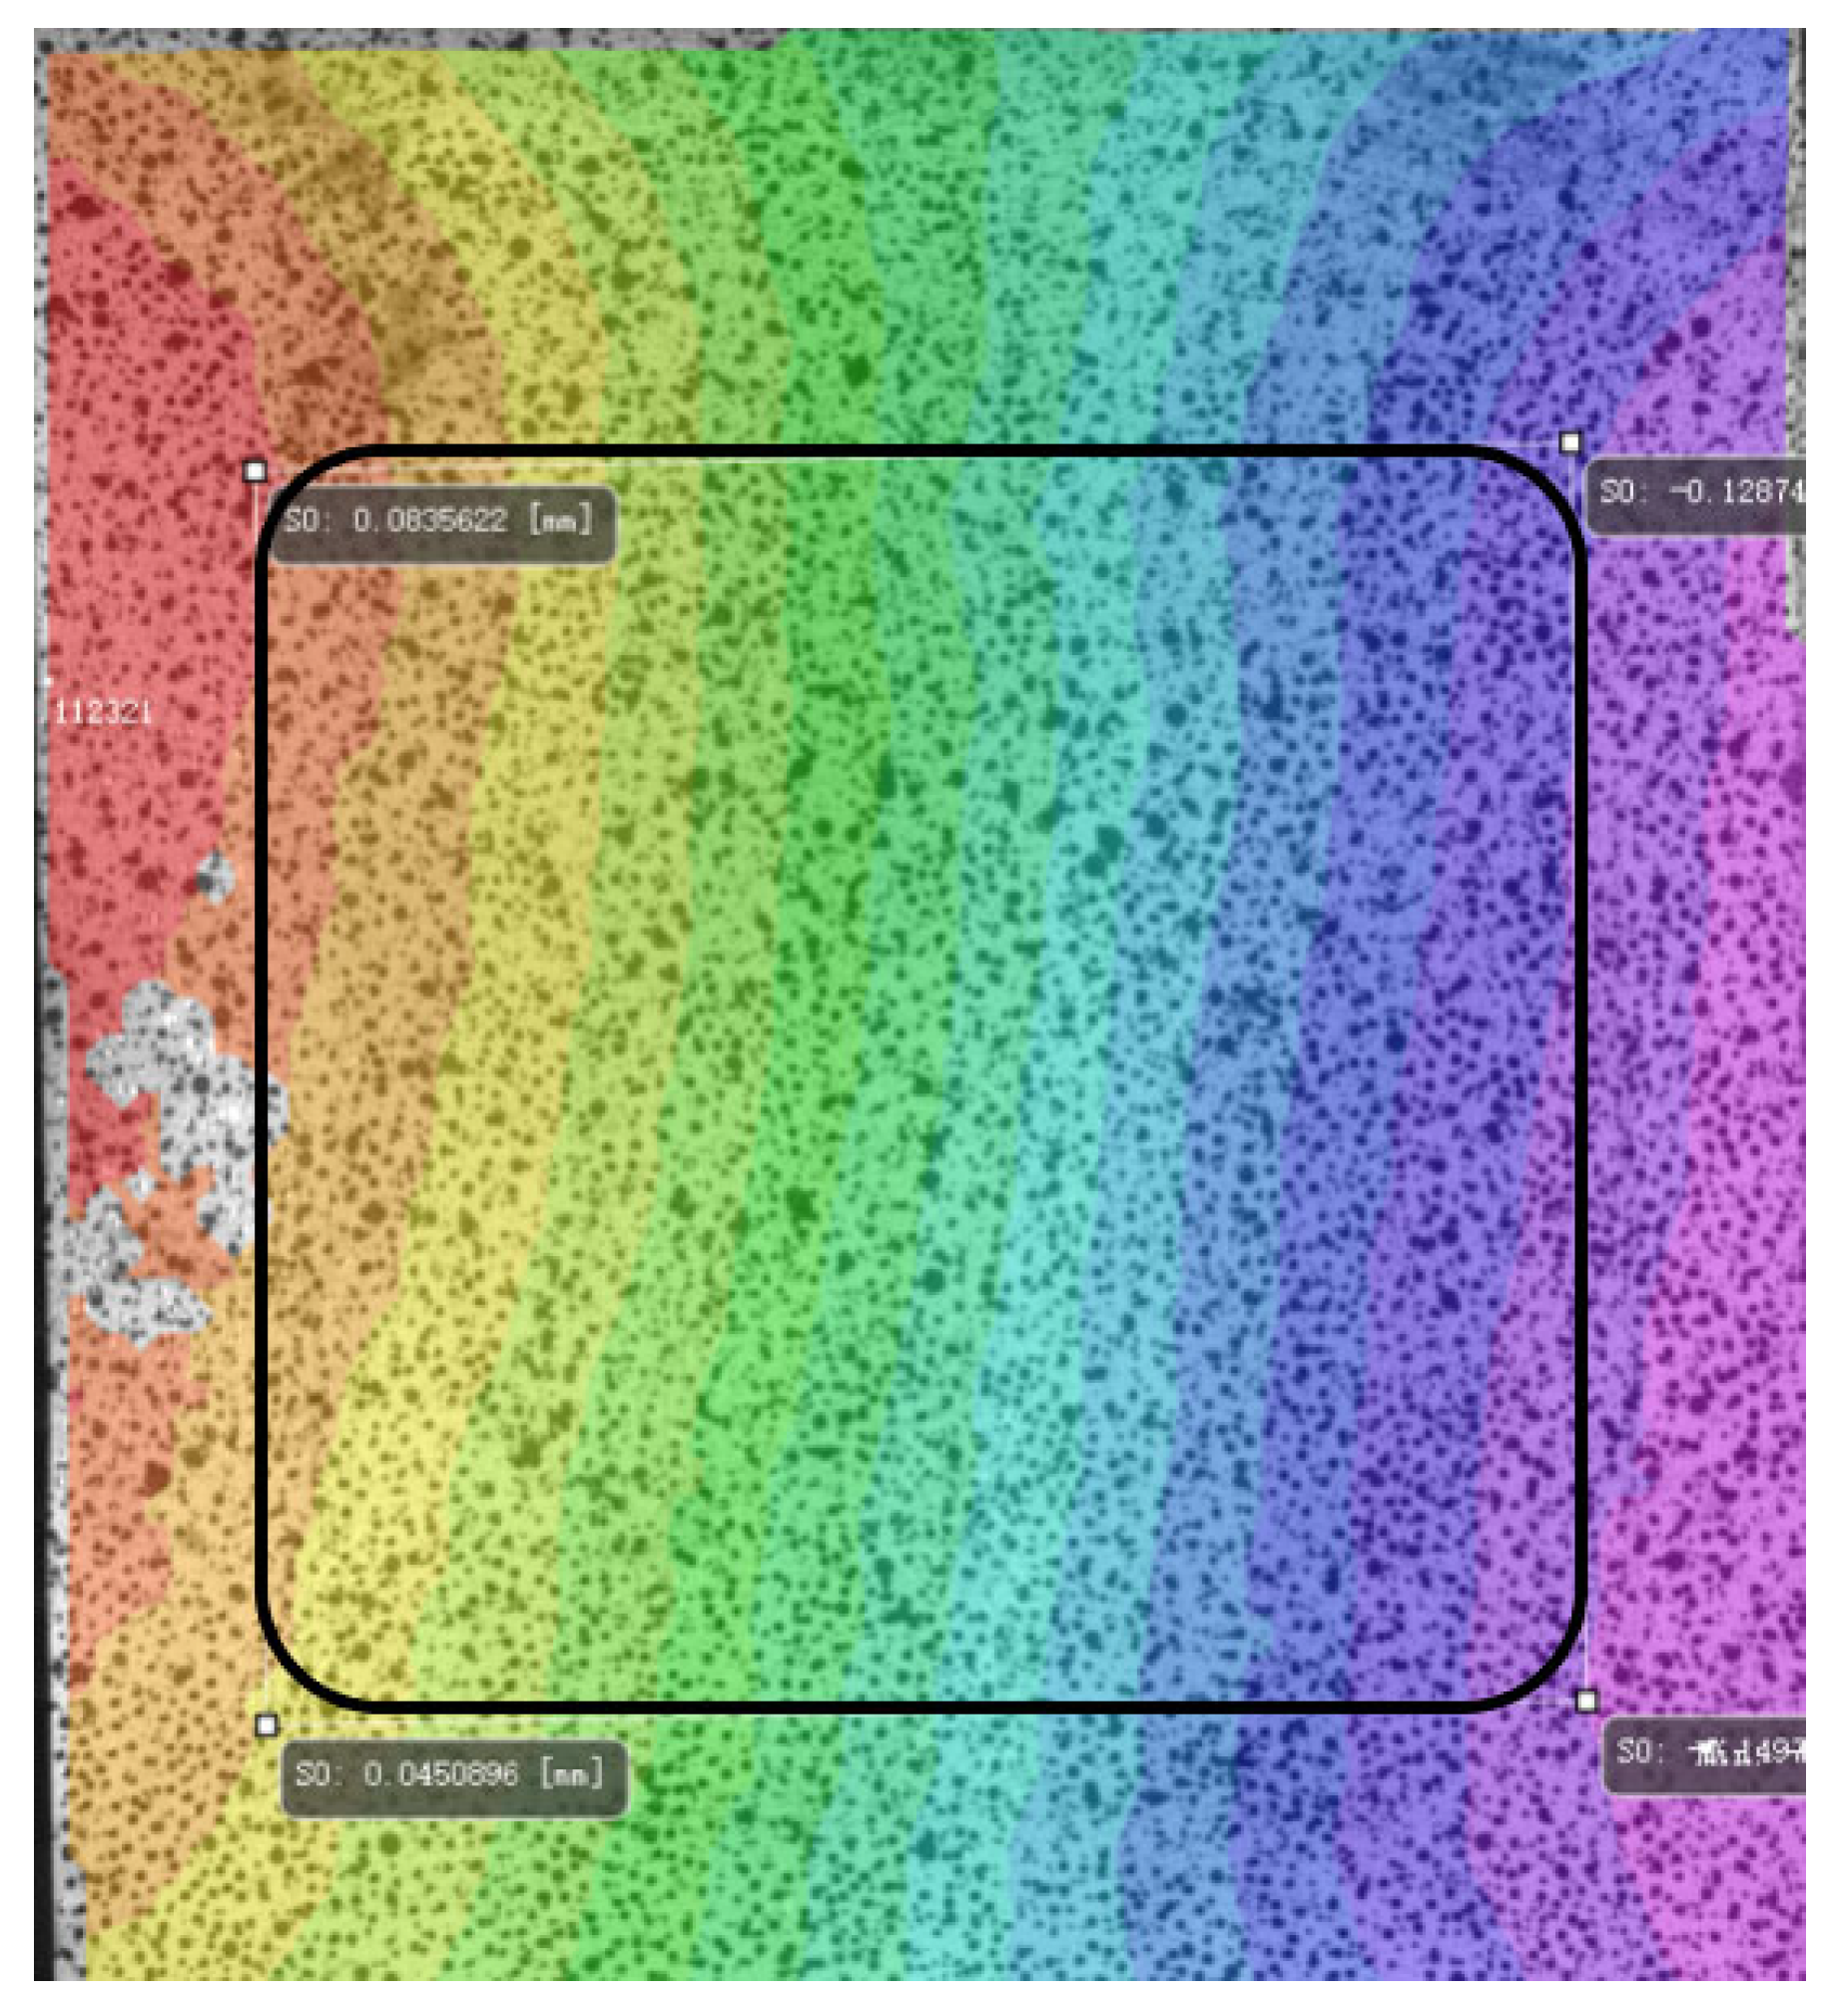
Applsci 14 04397 g013
Figure 14. The patch area (Black circle) of the circular repaired plate for DIC test.
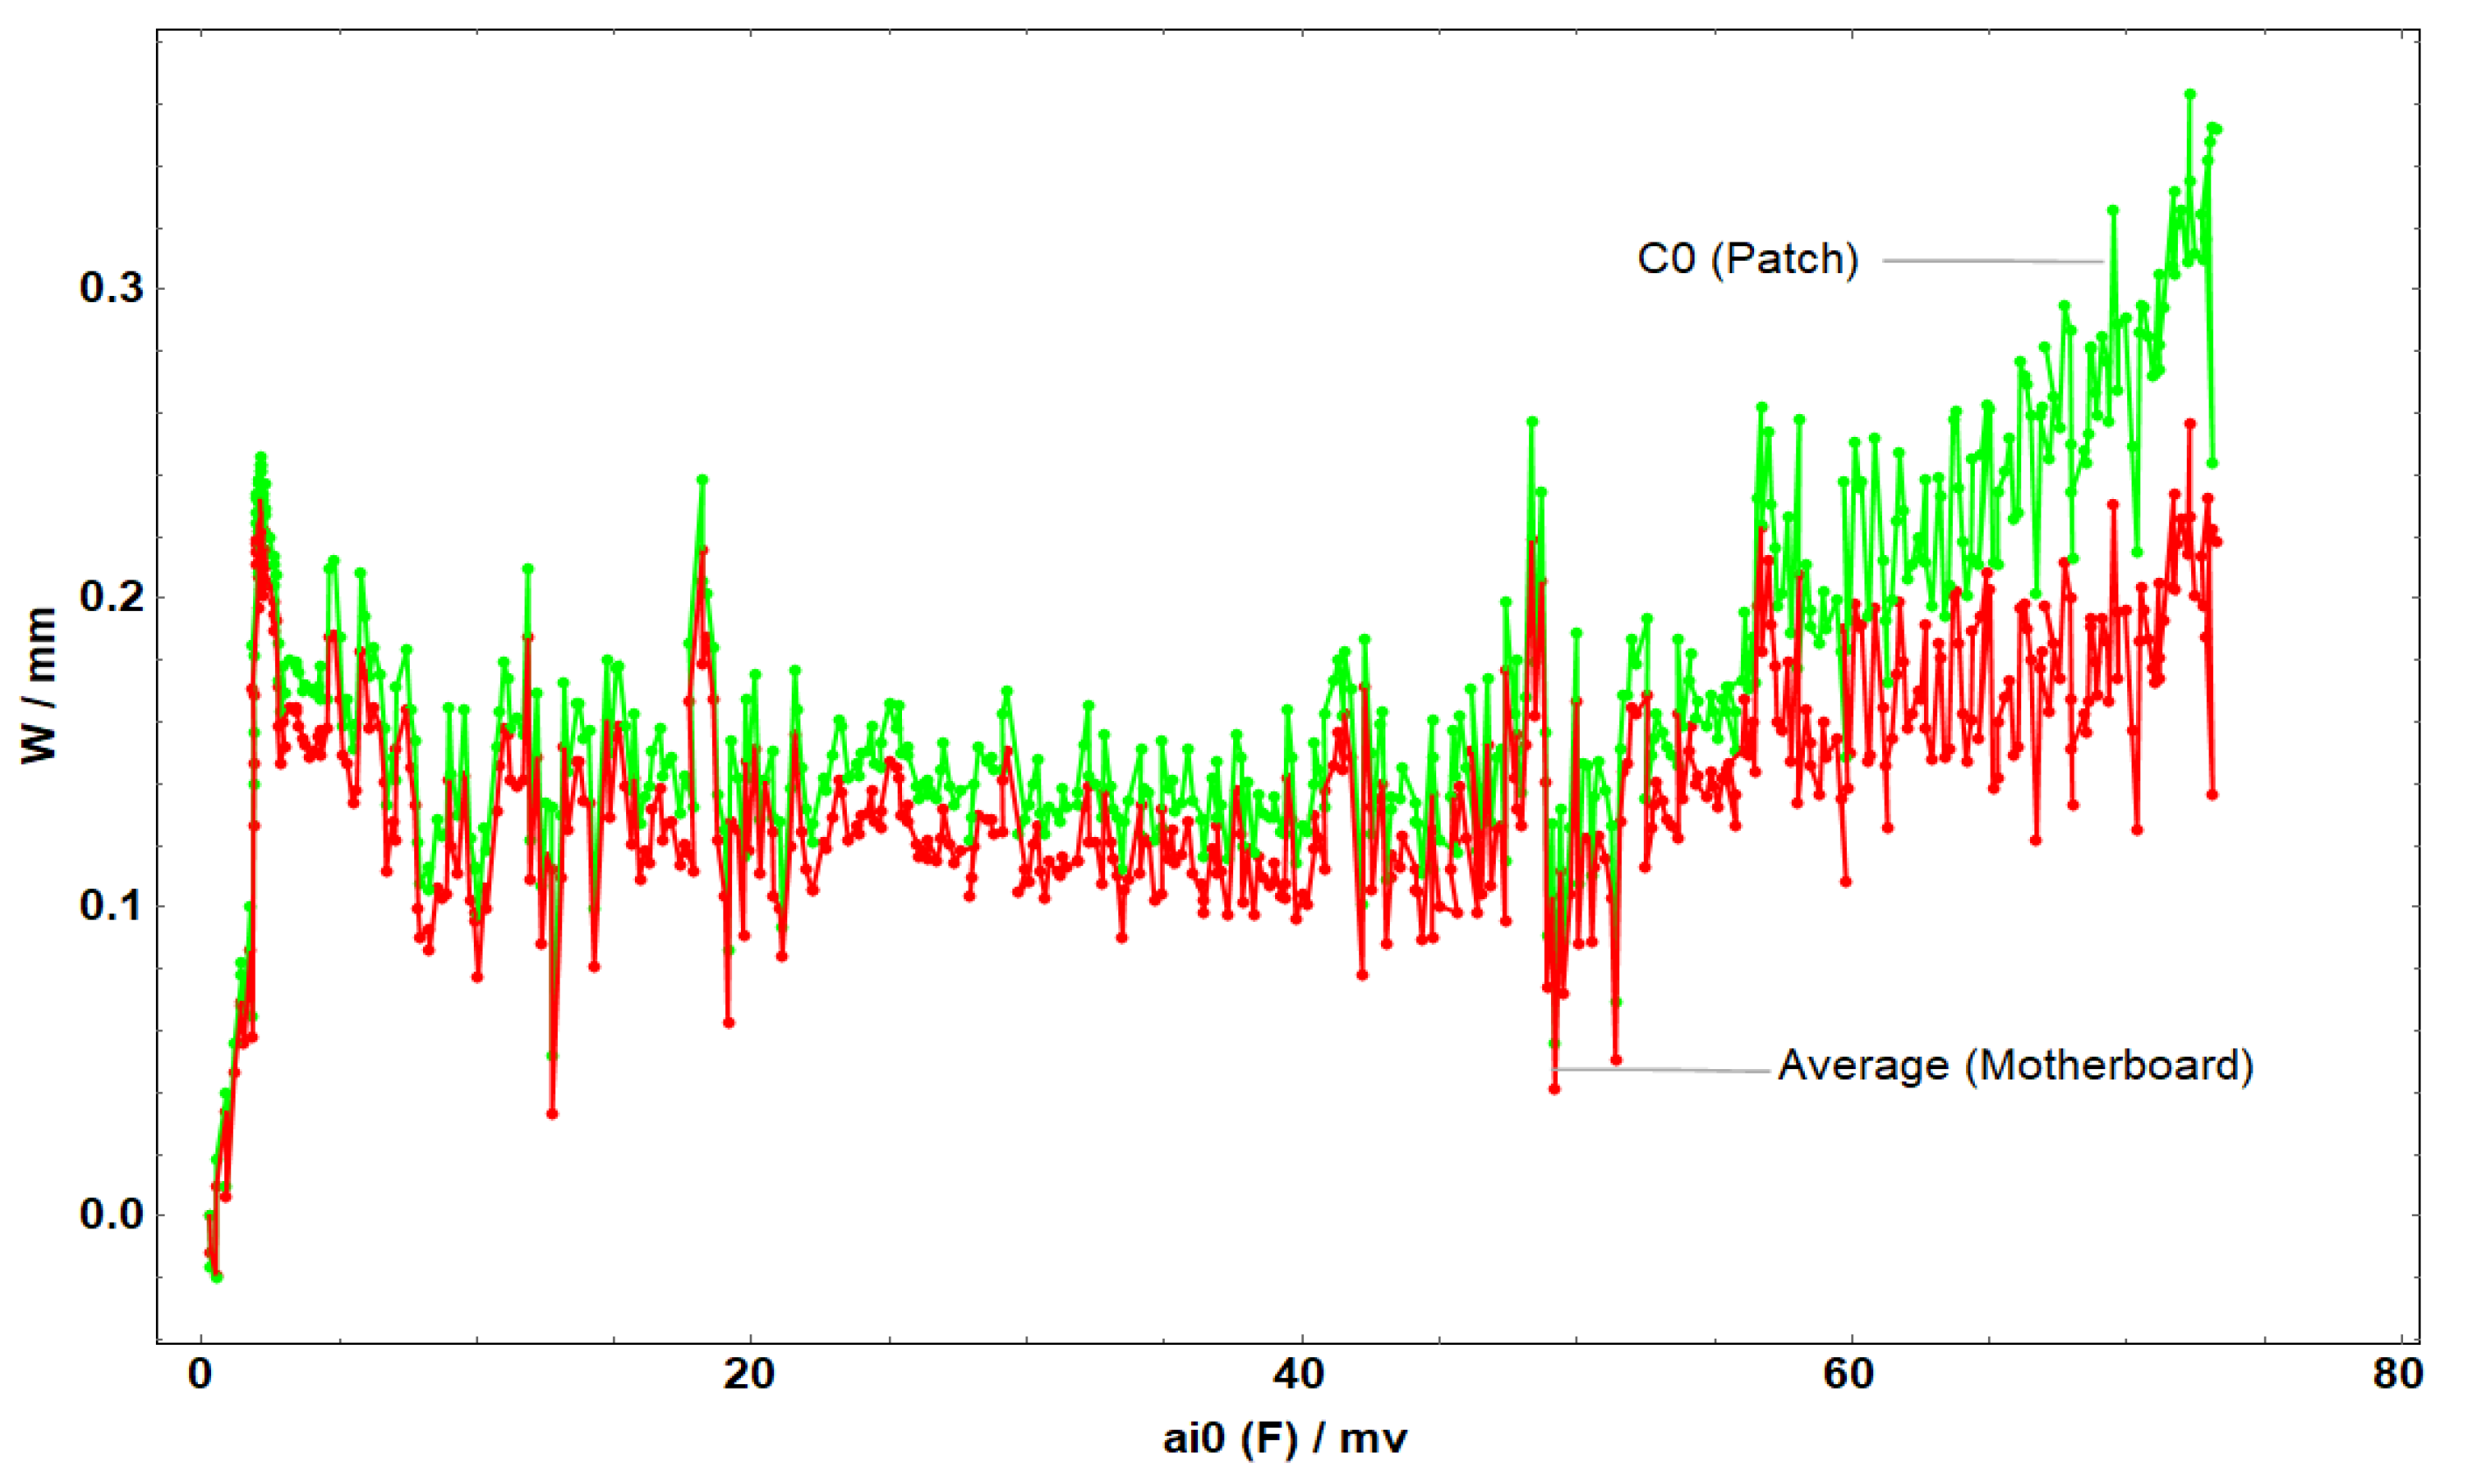
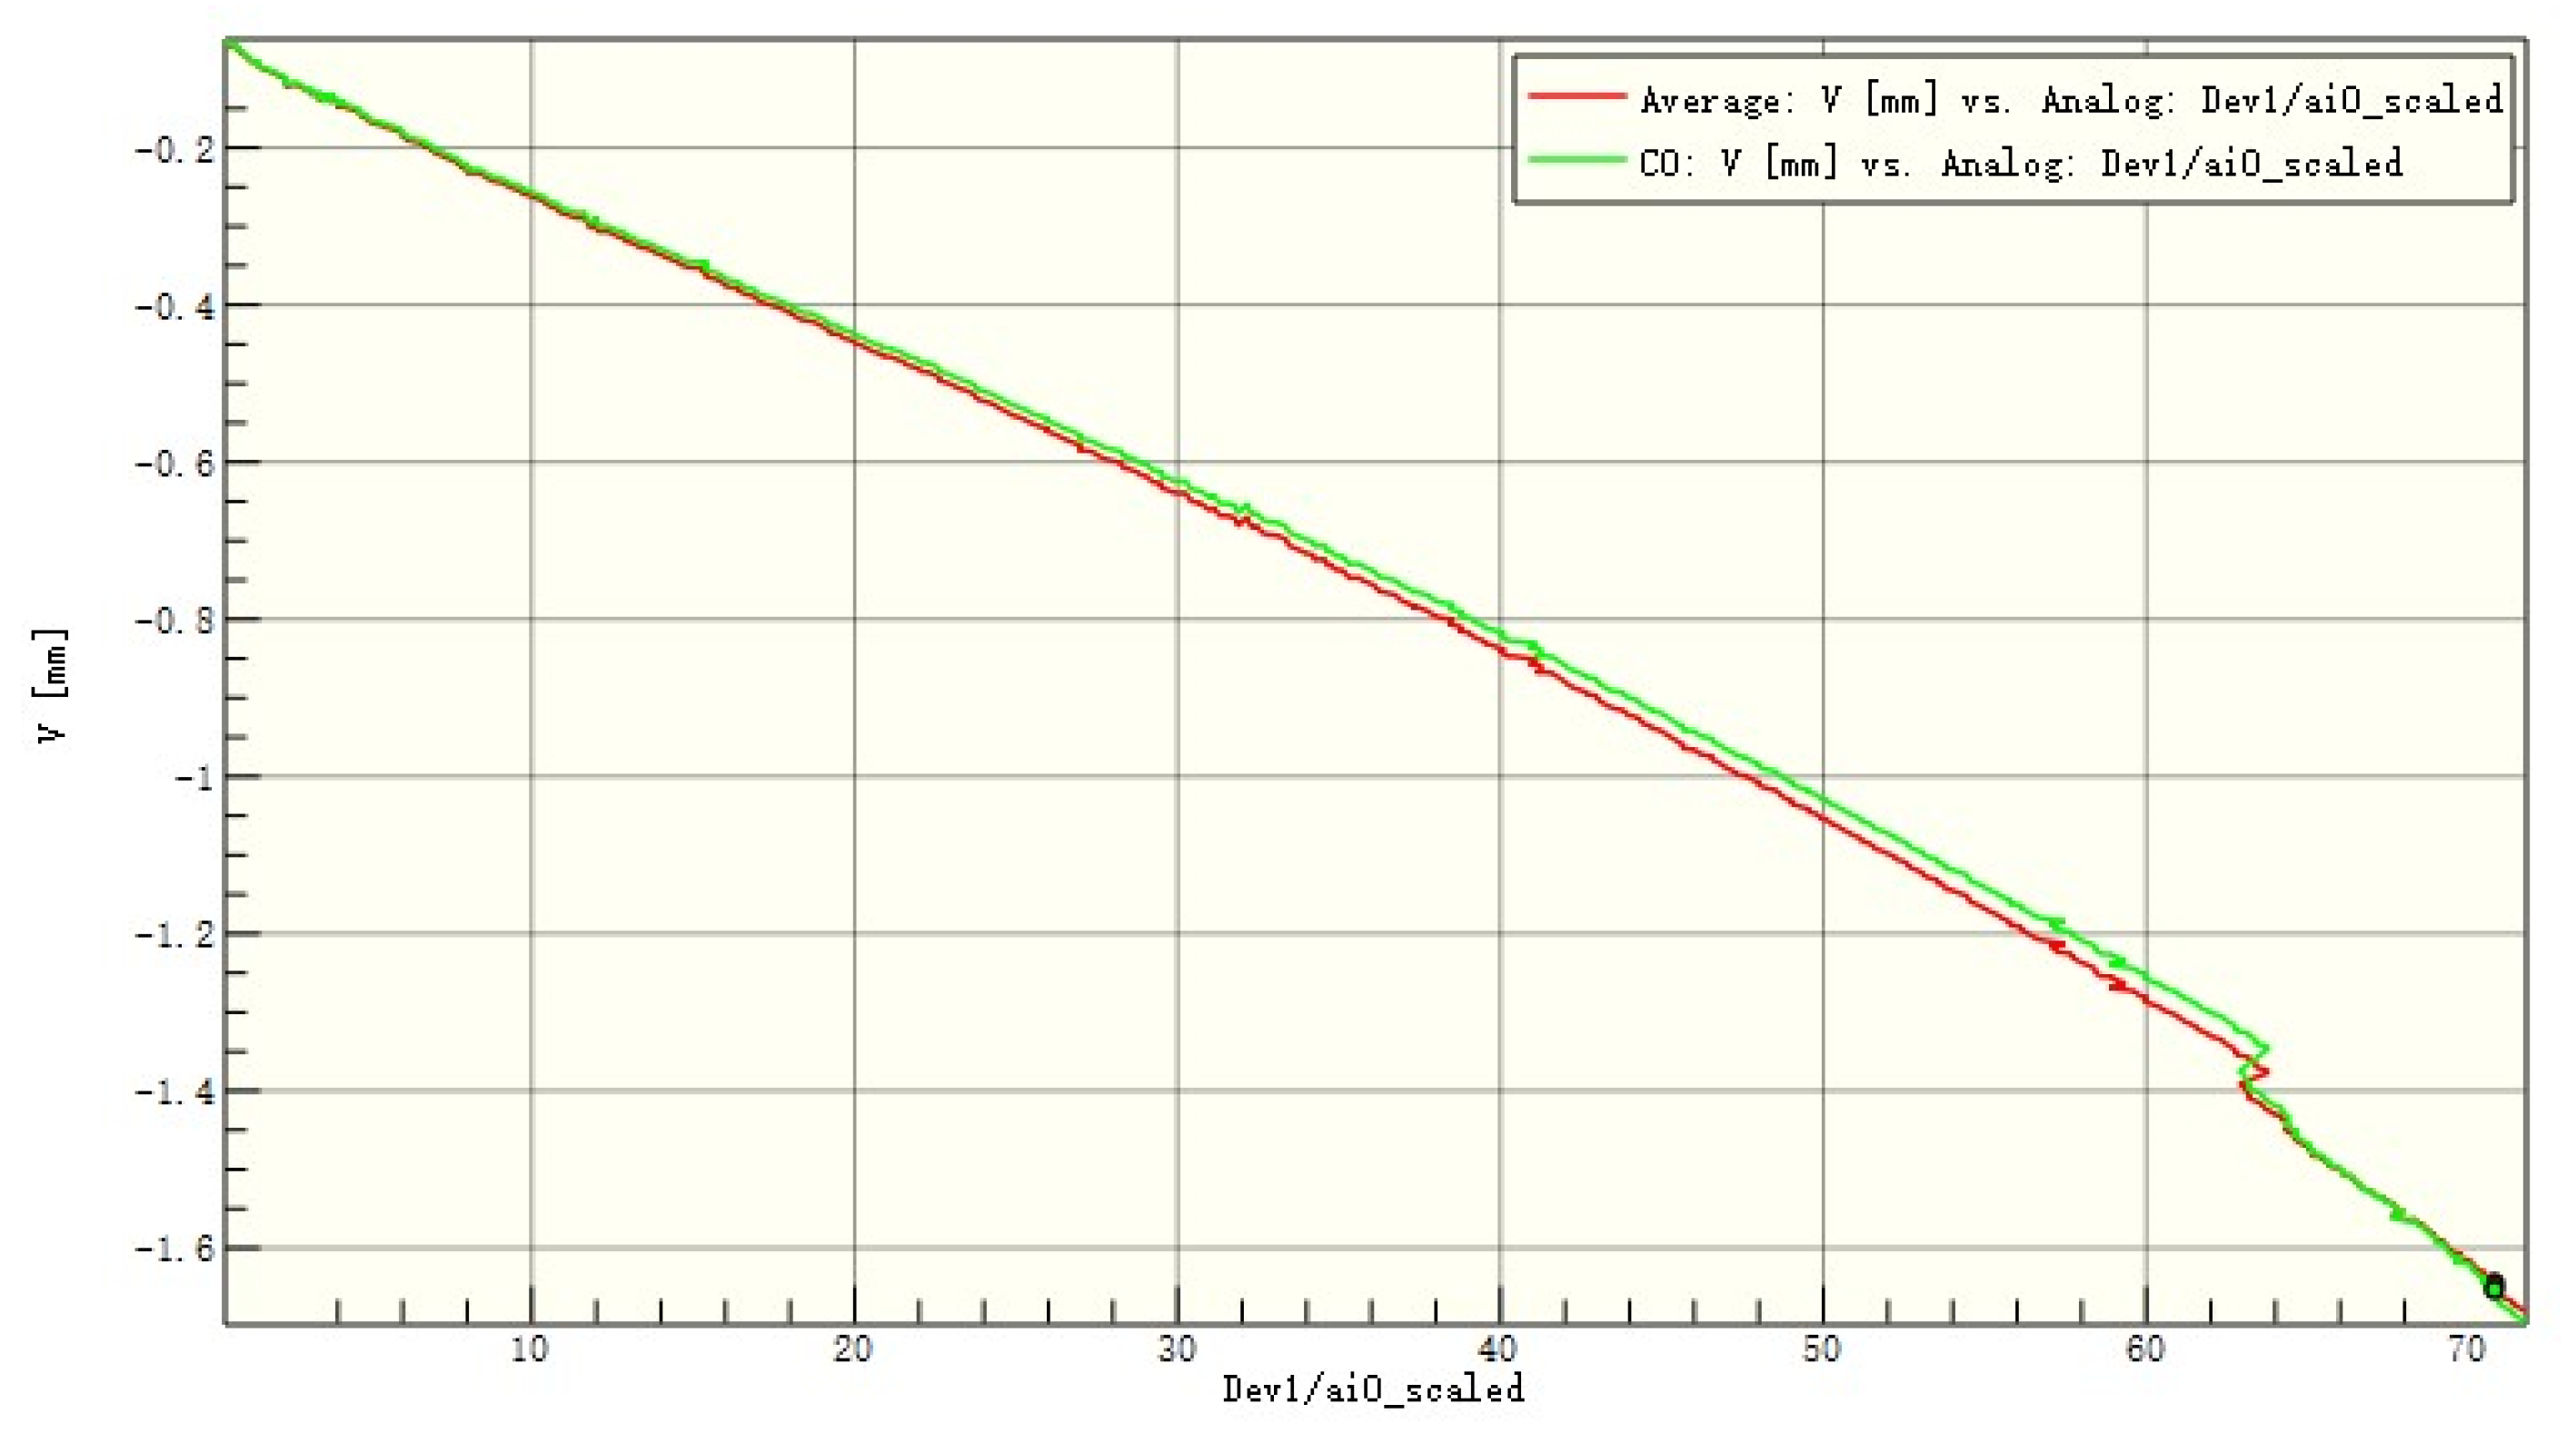
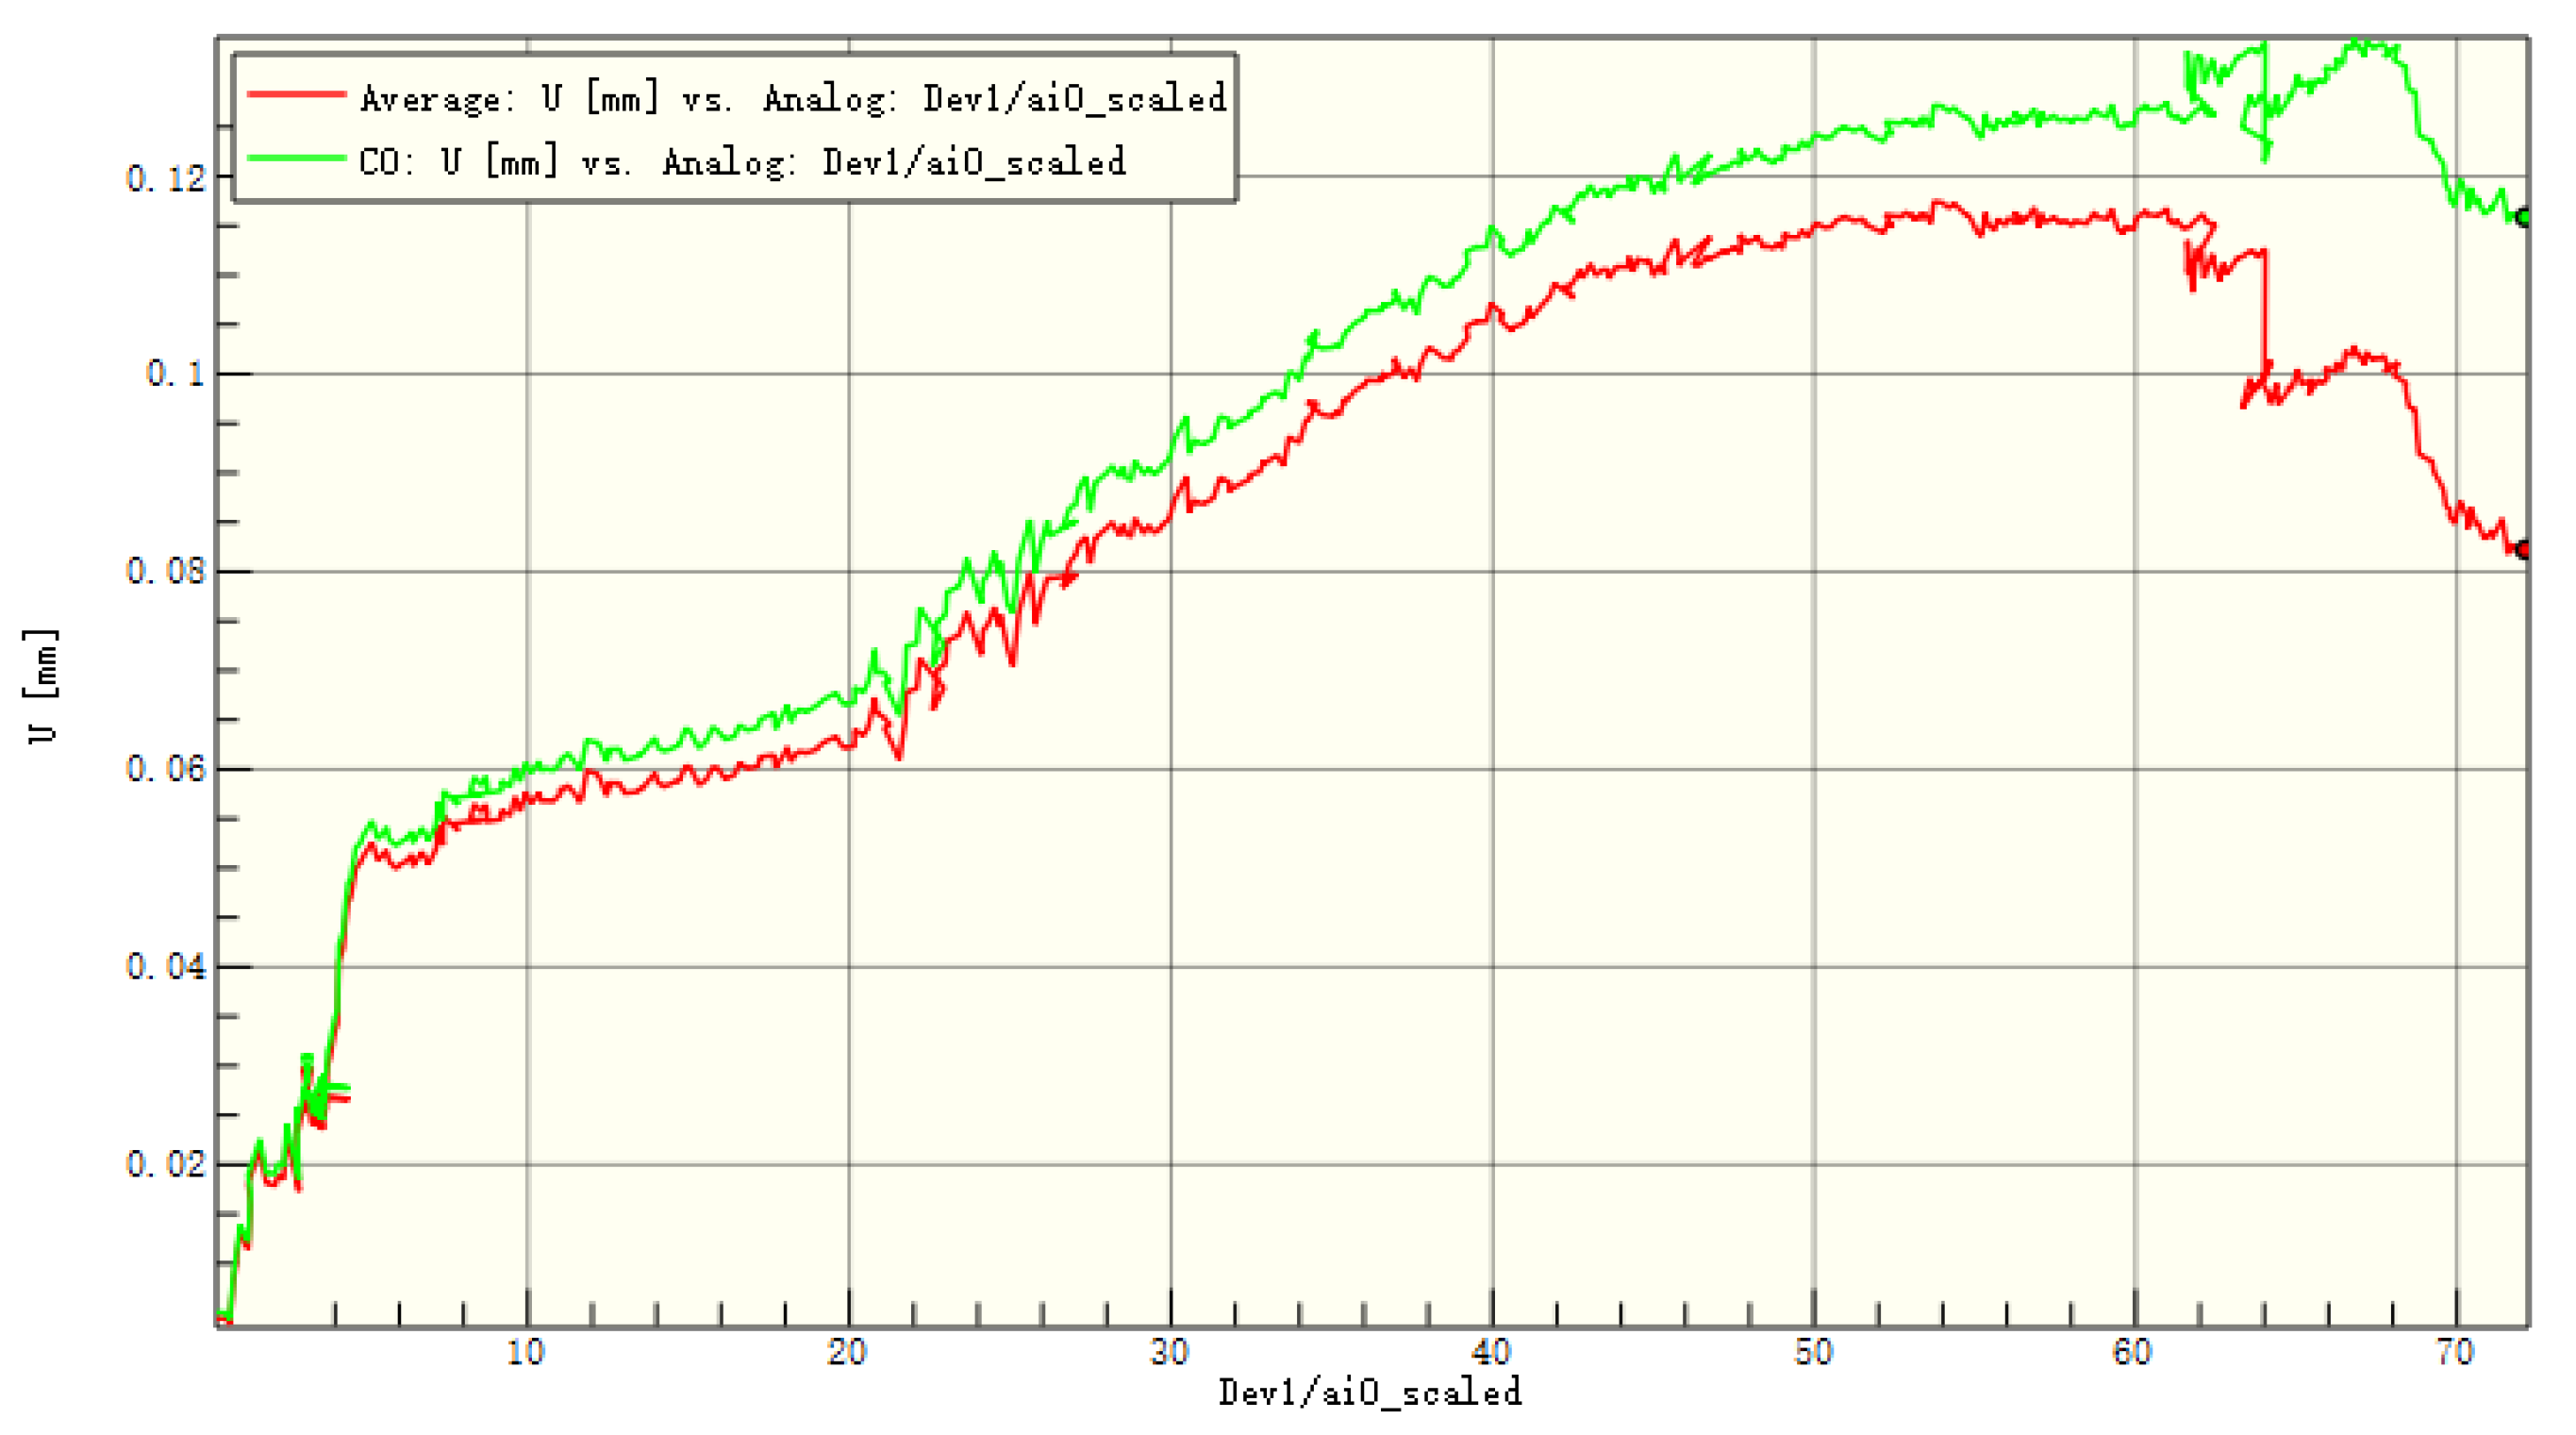
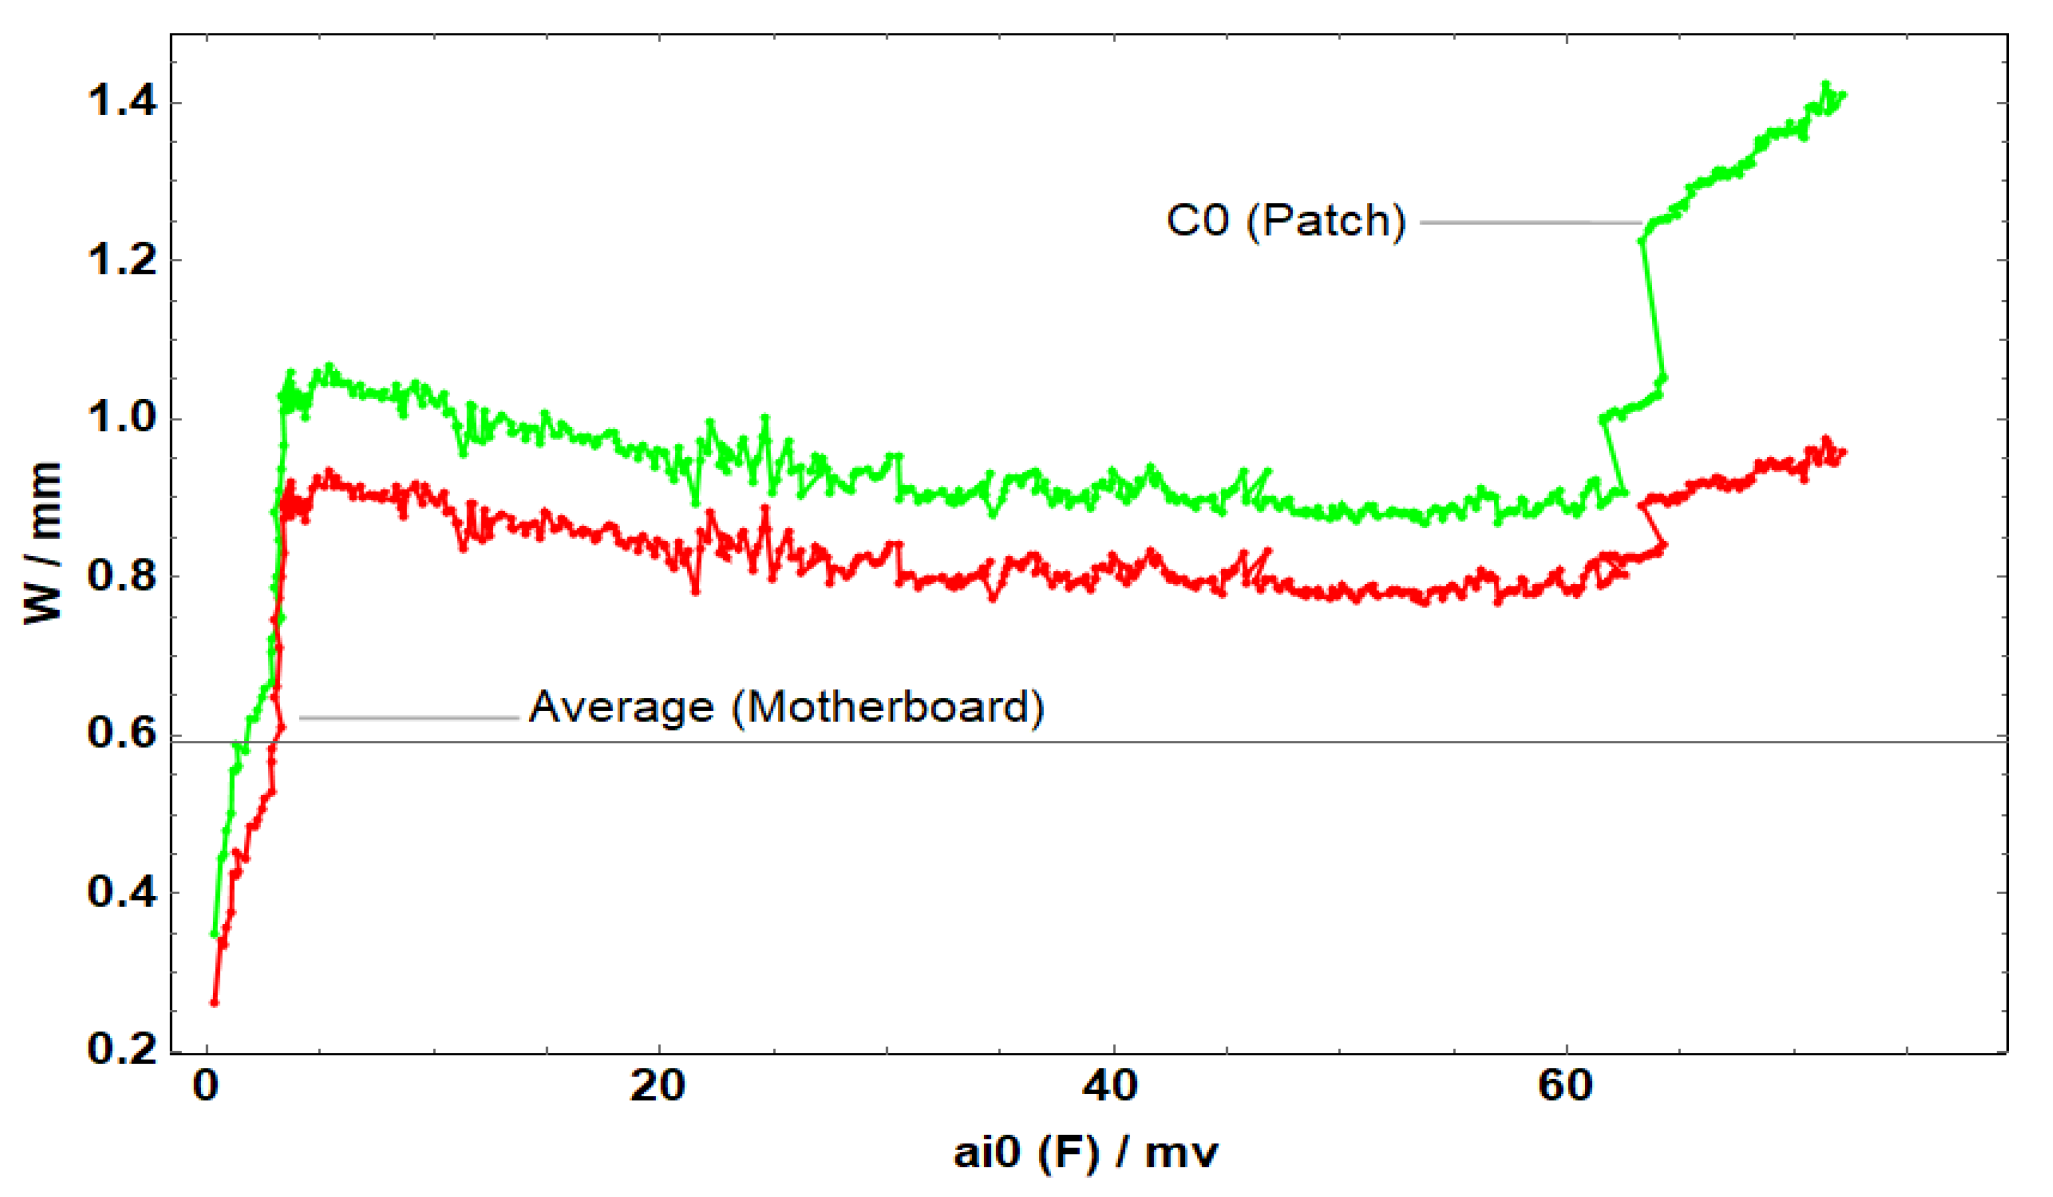
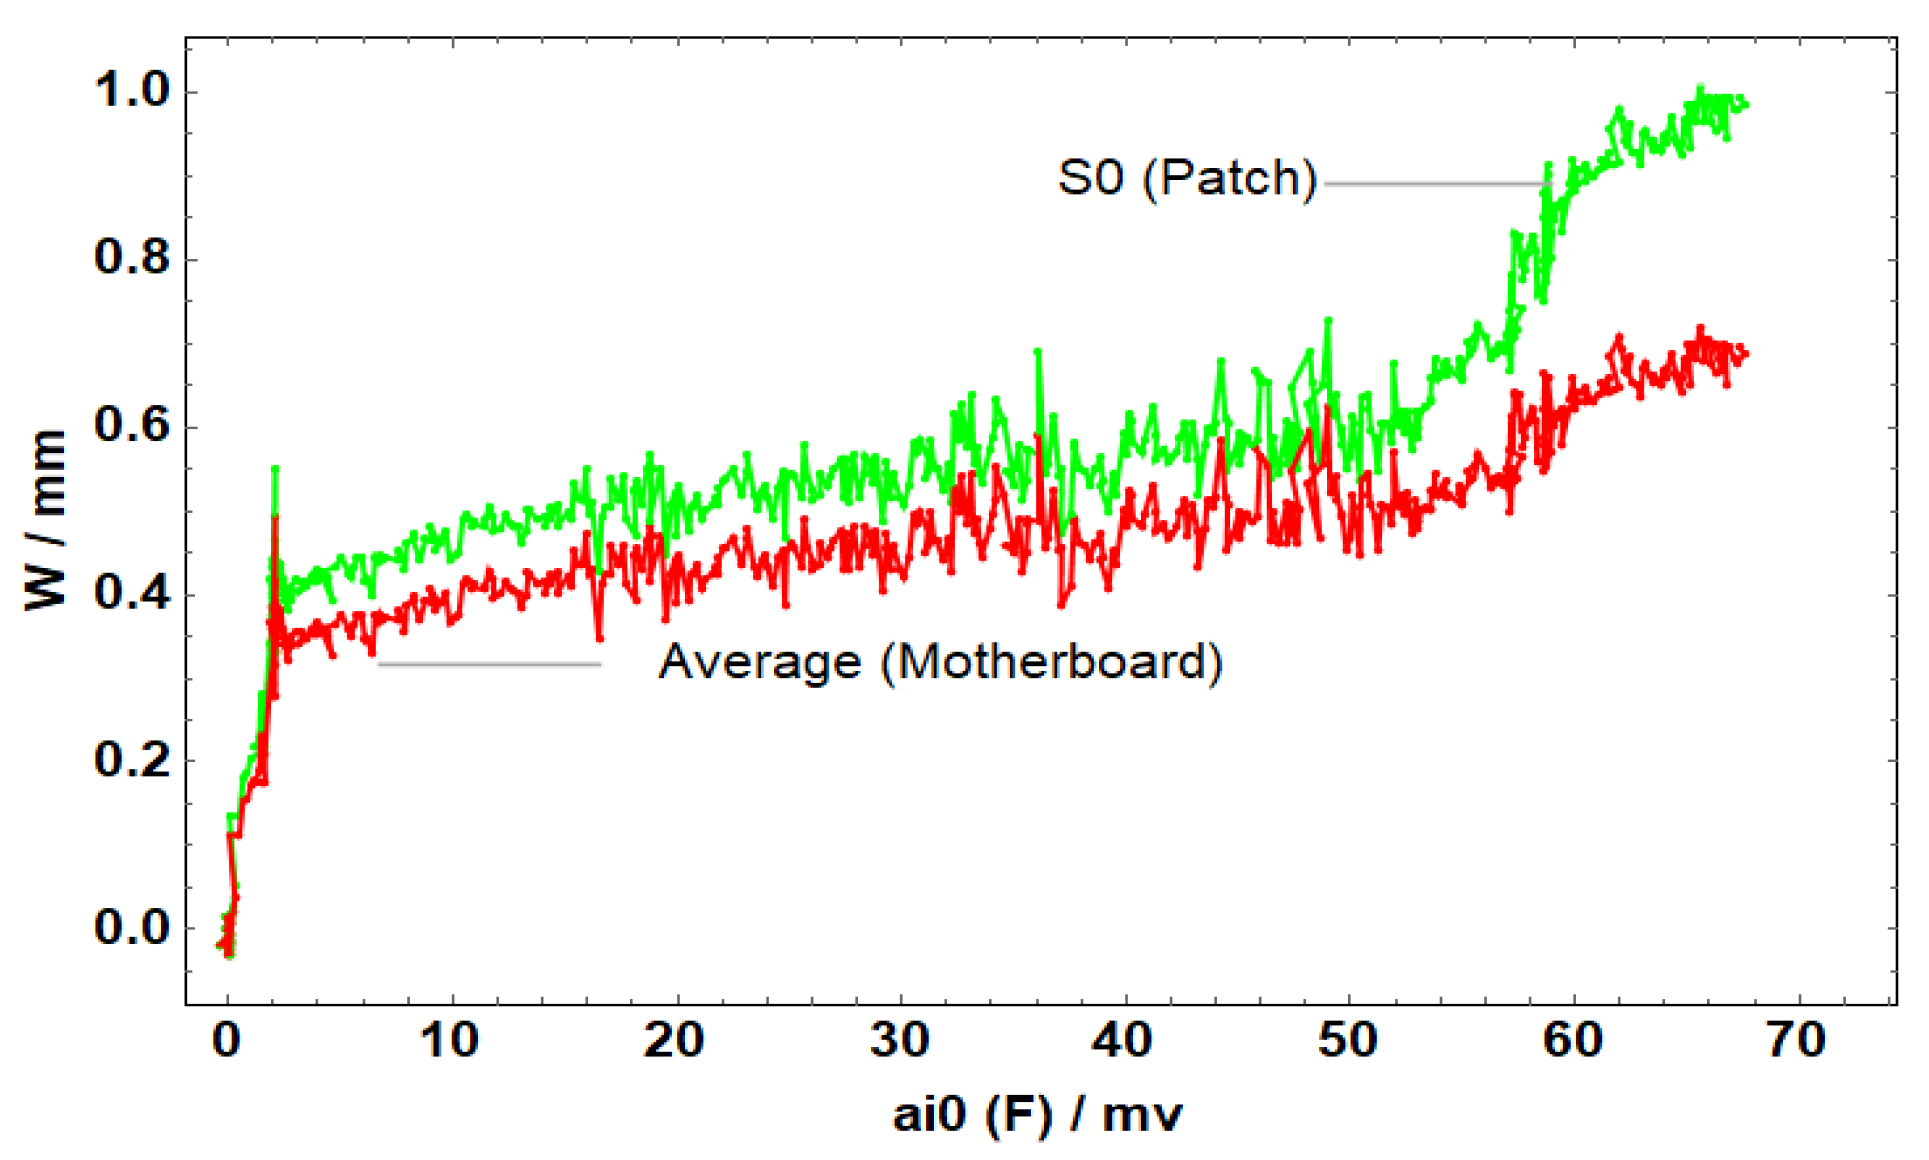
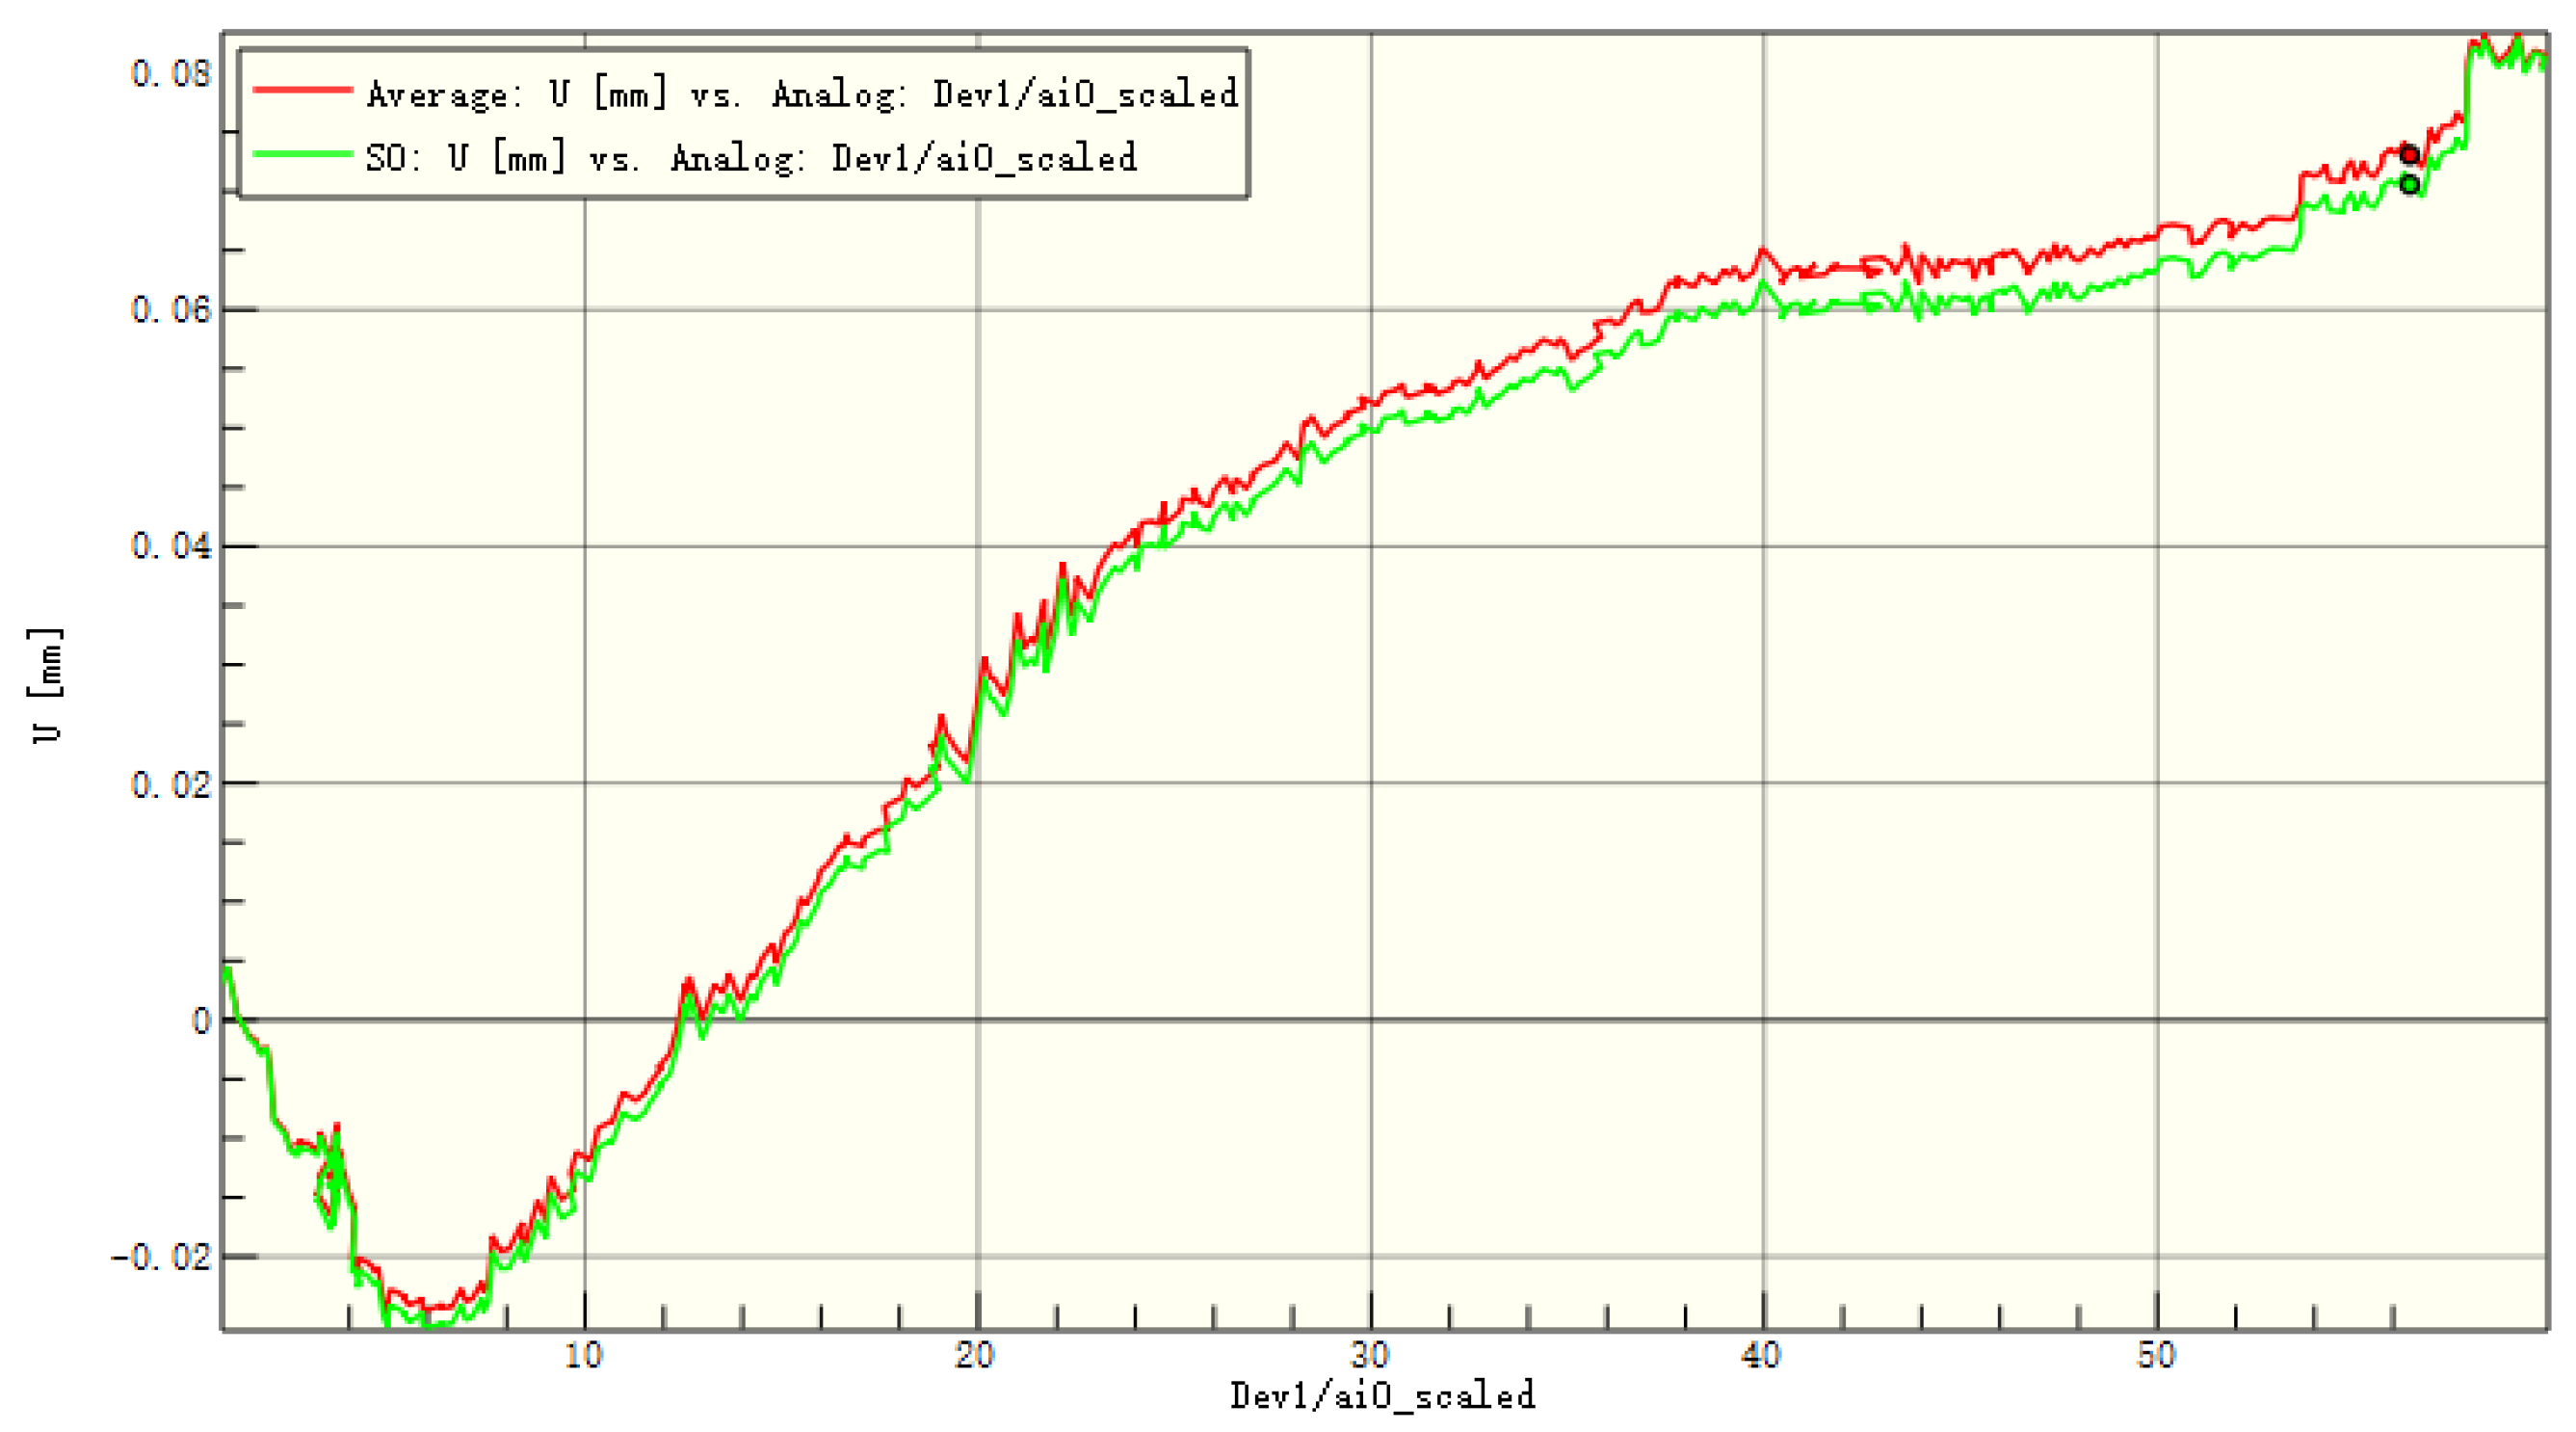
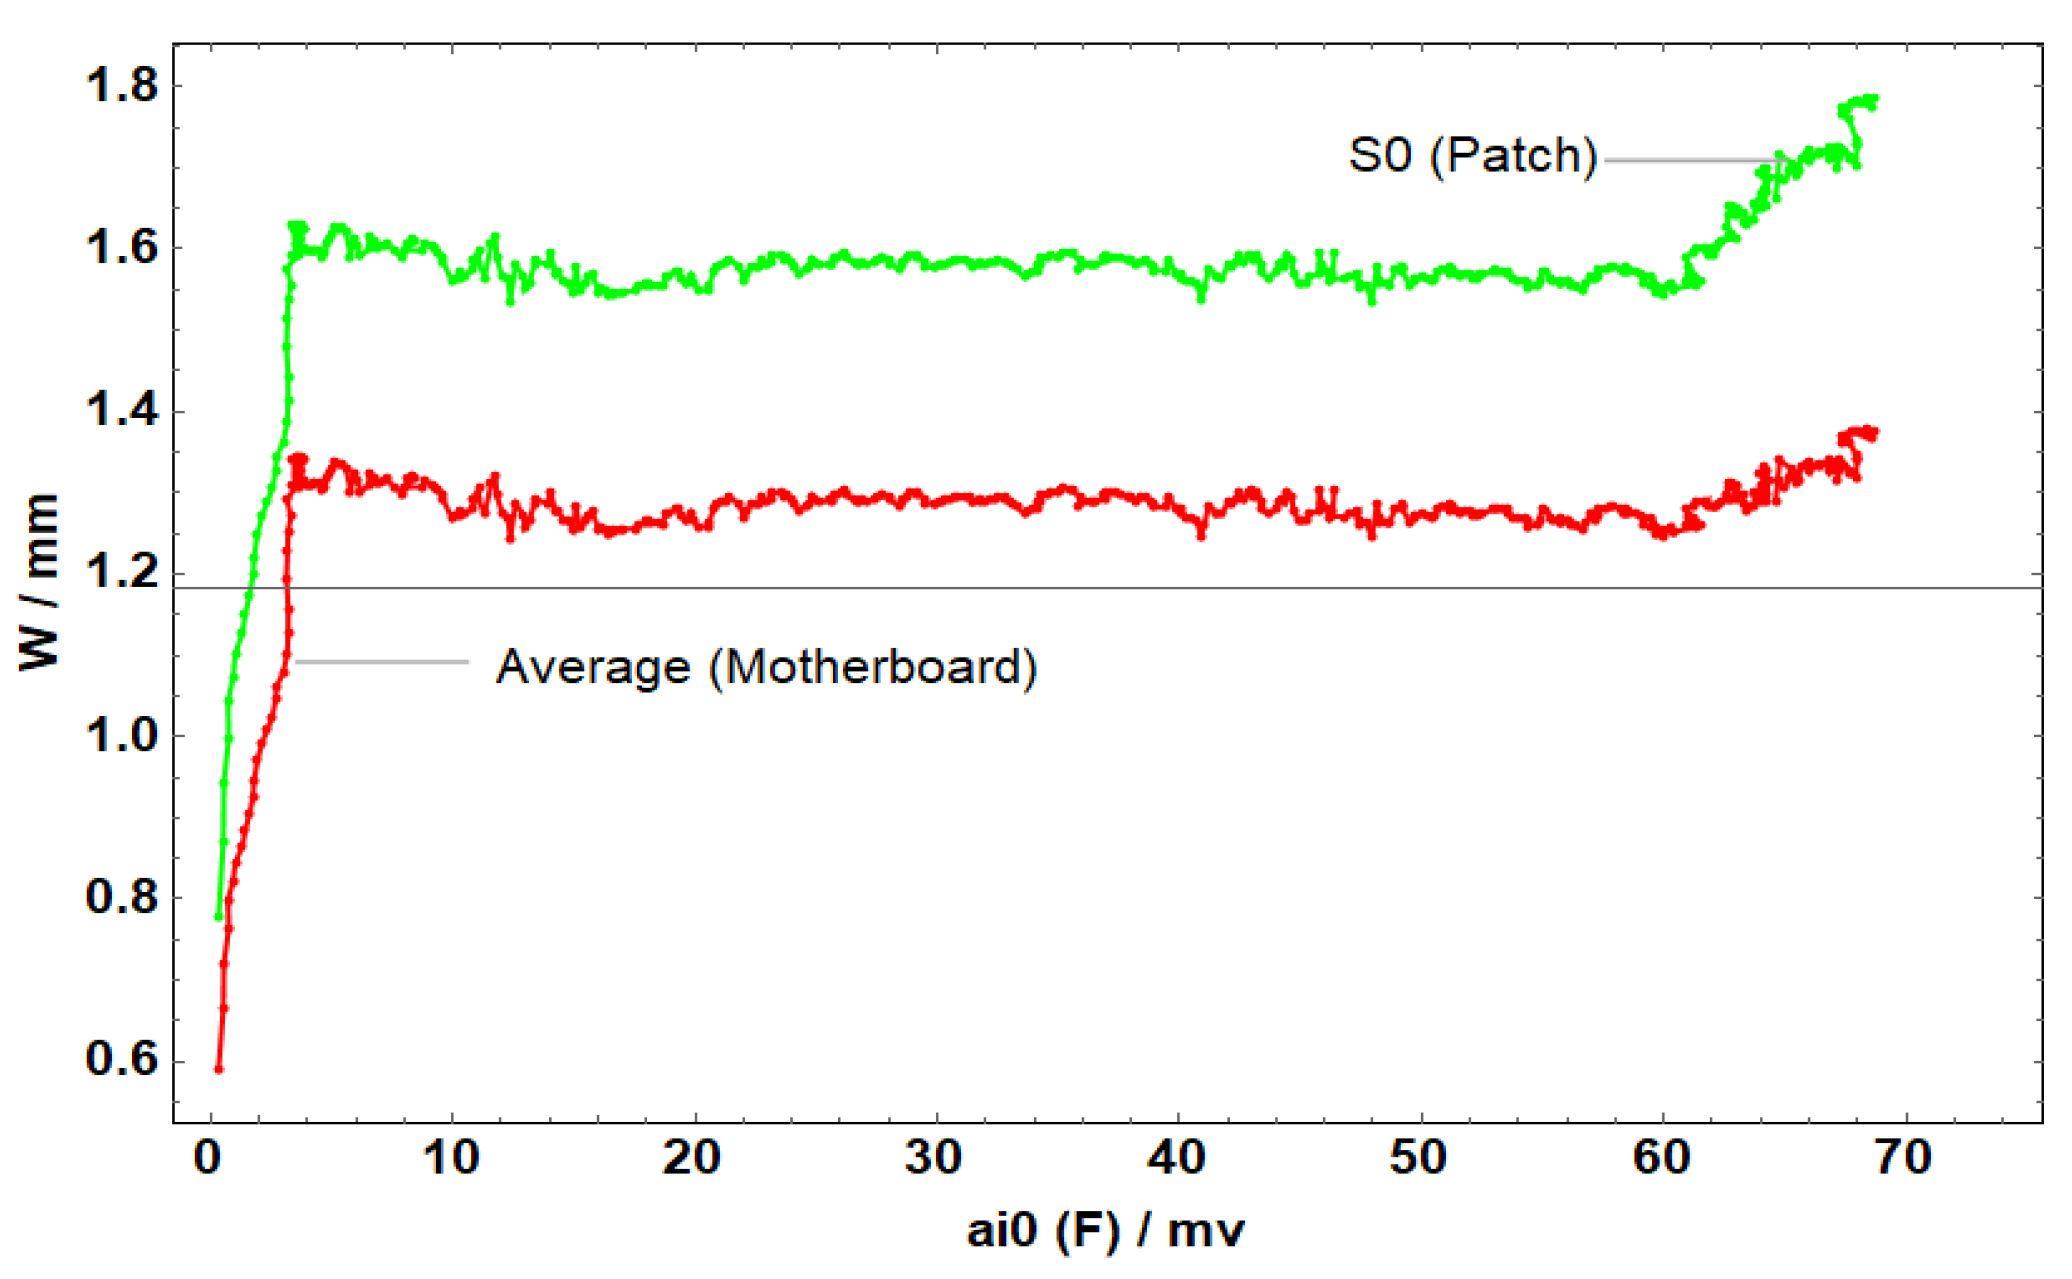
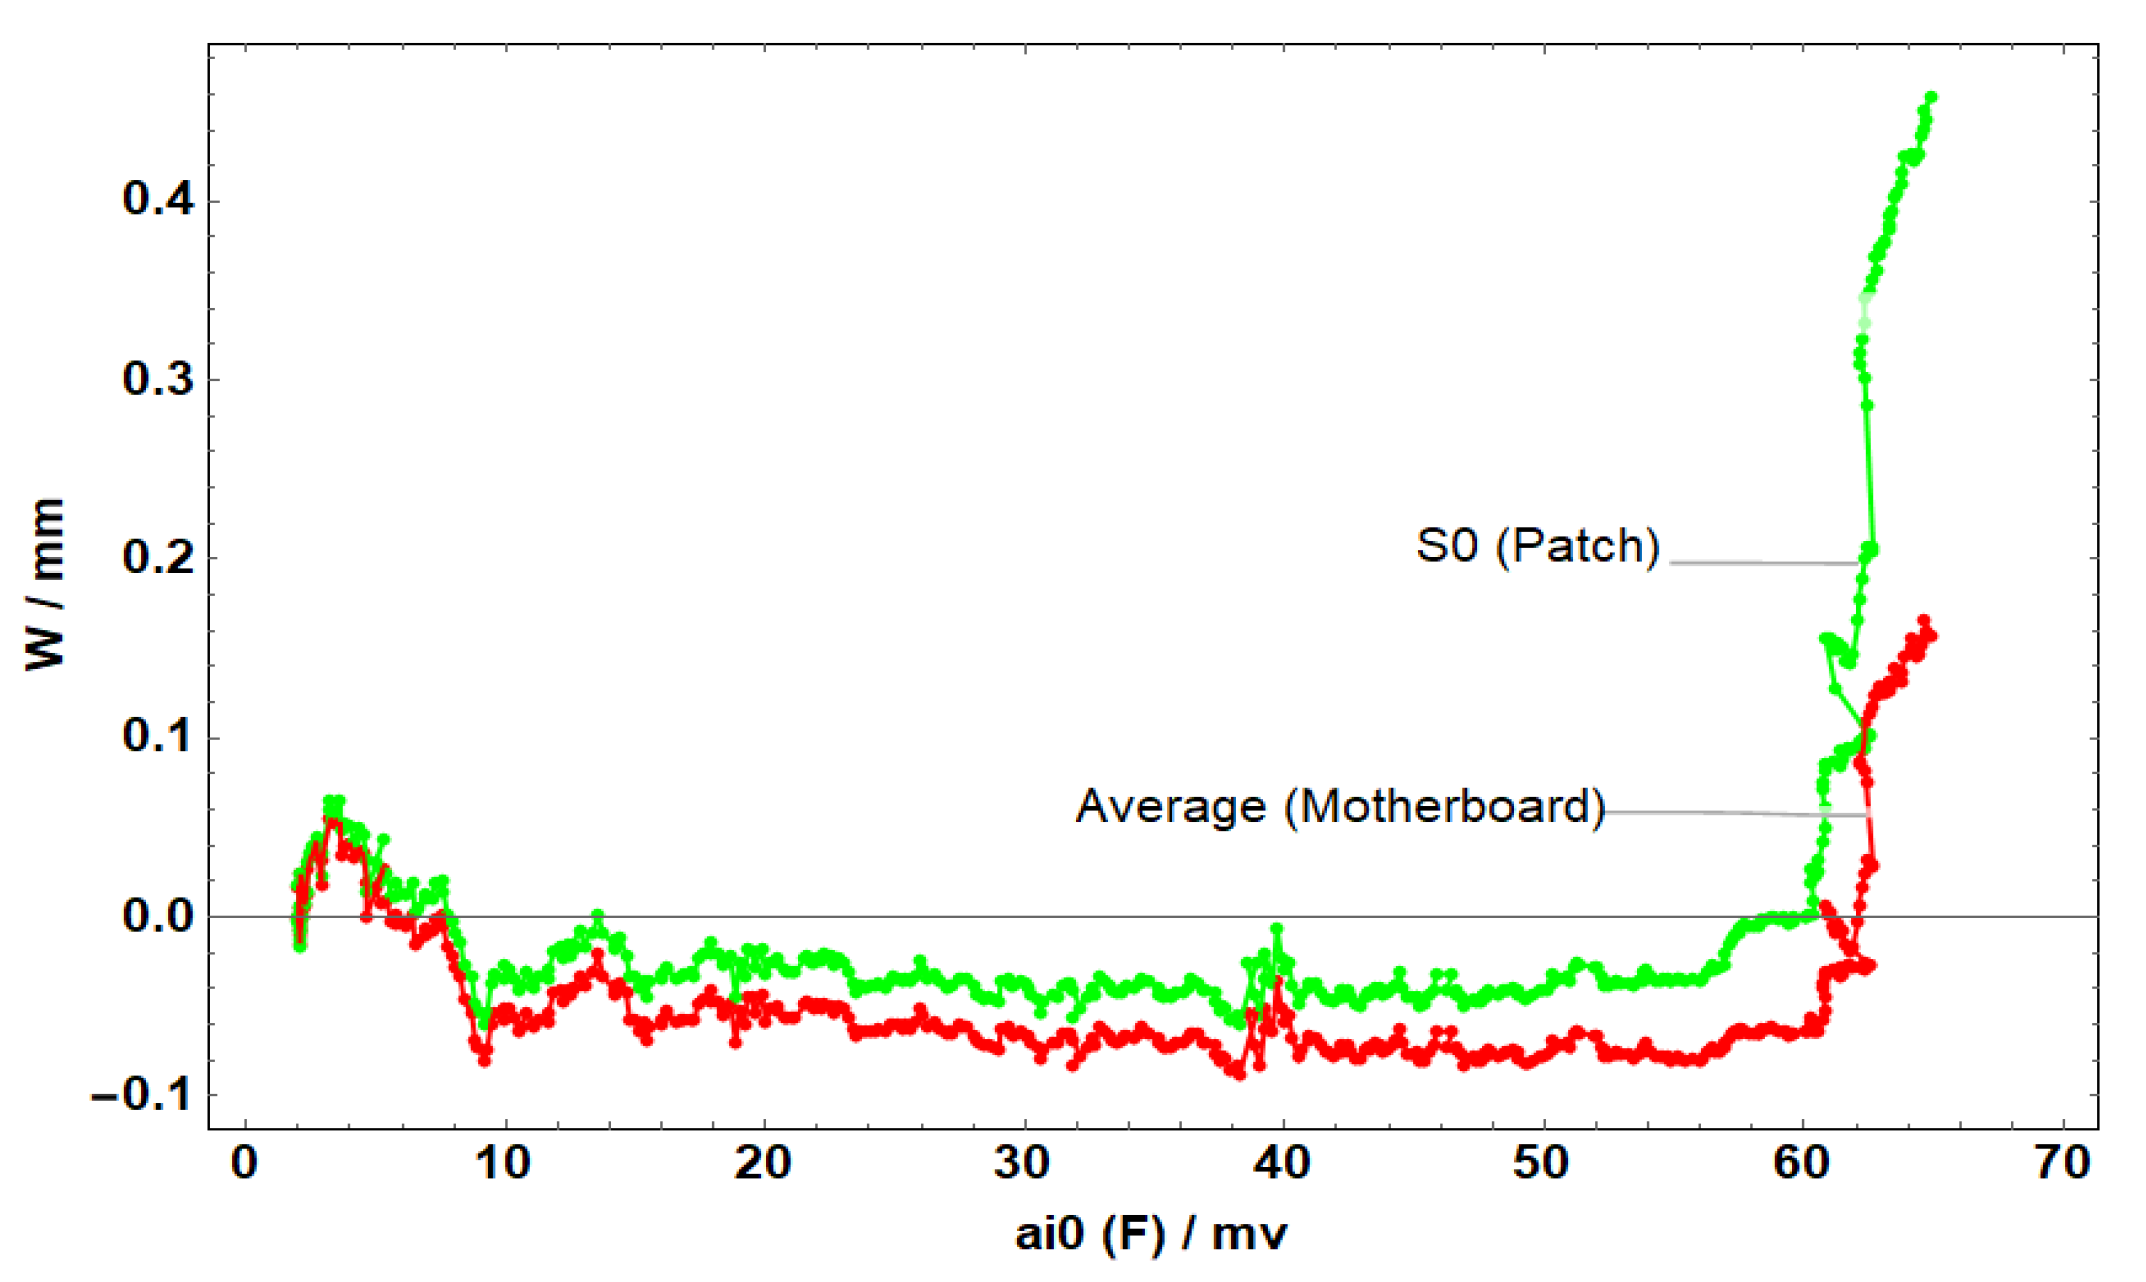
Applsci 14 04397 g014
Figure 15. Average displacement of the entire board and the patch in the x-direction of C1.
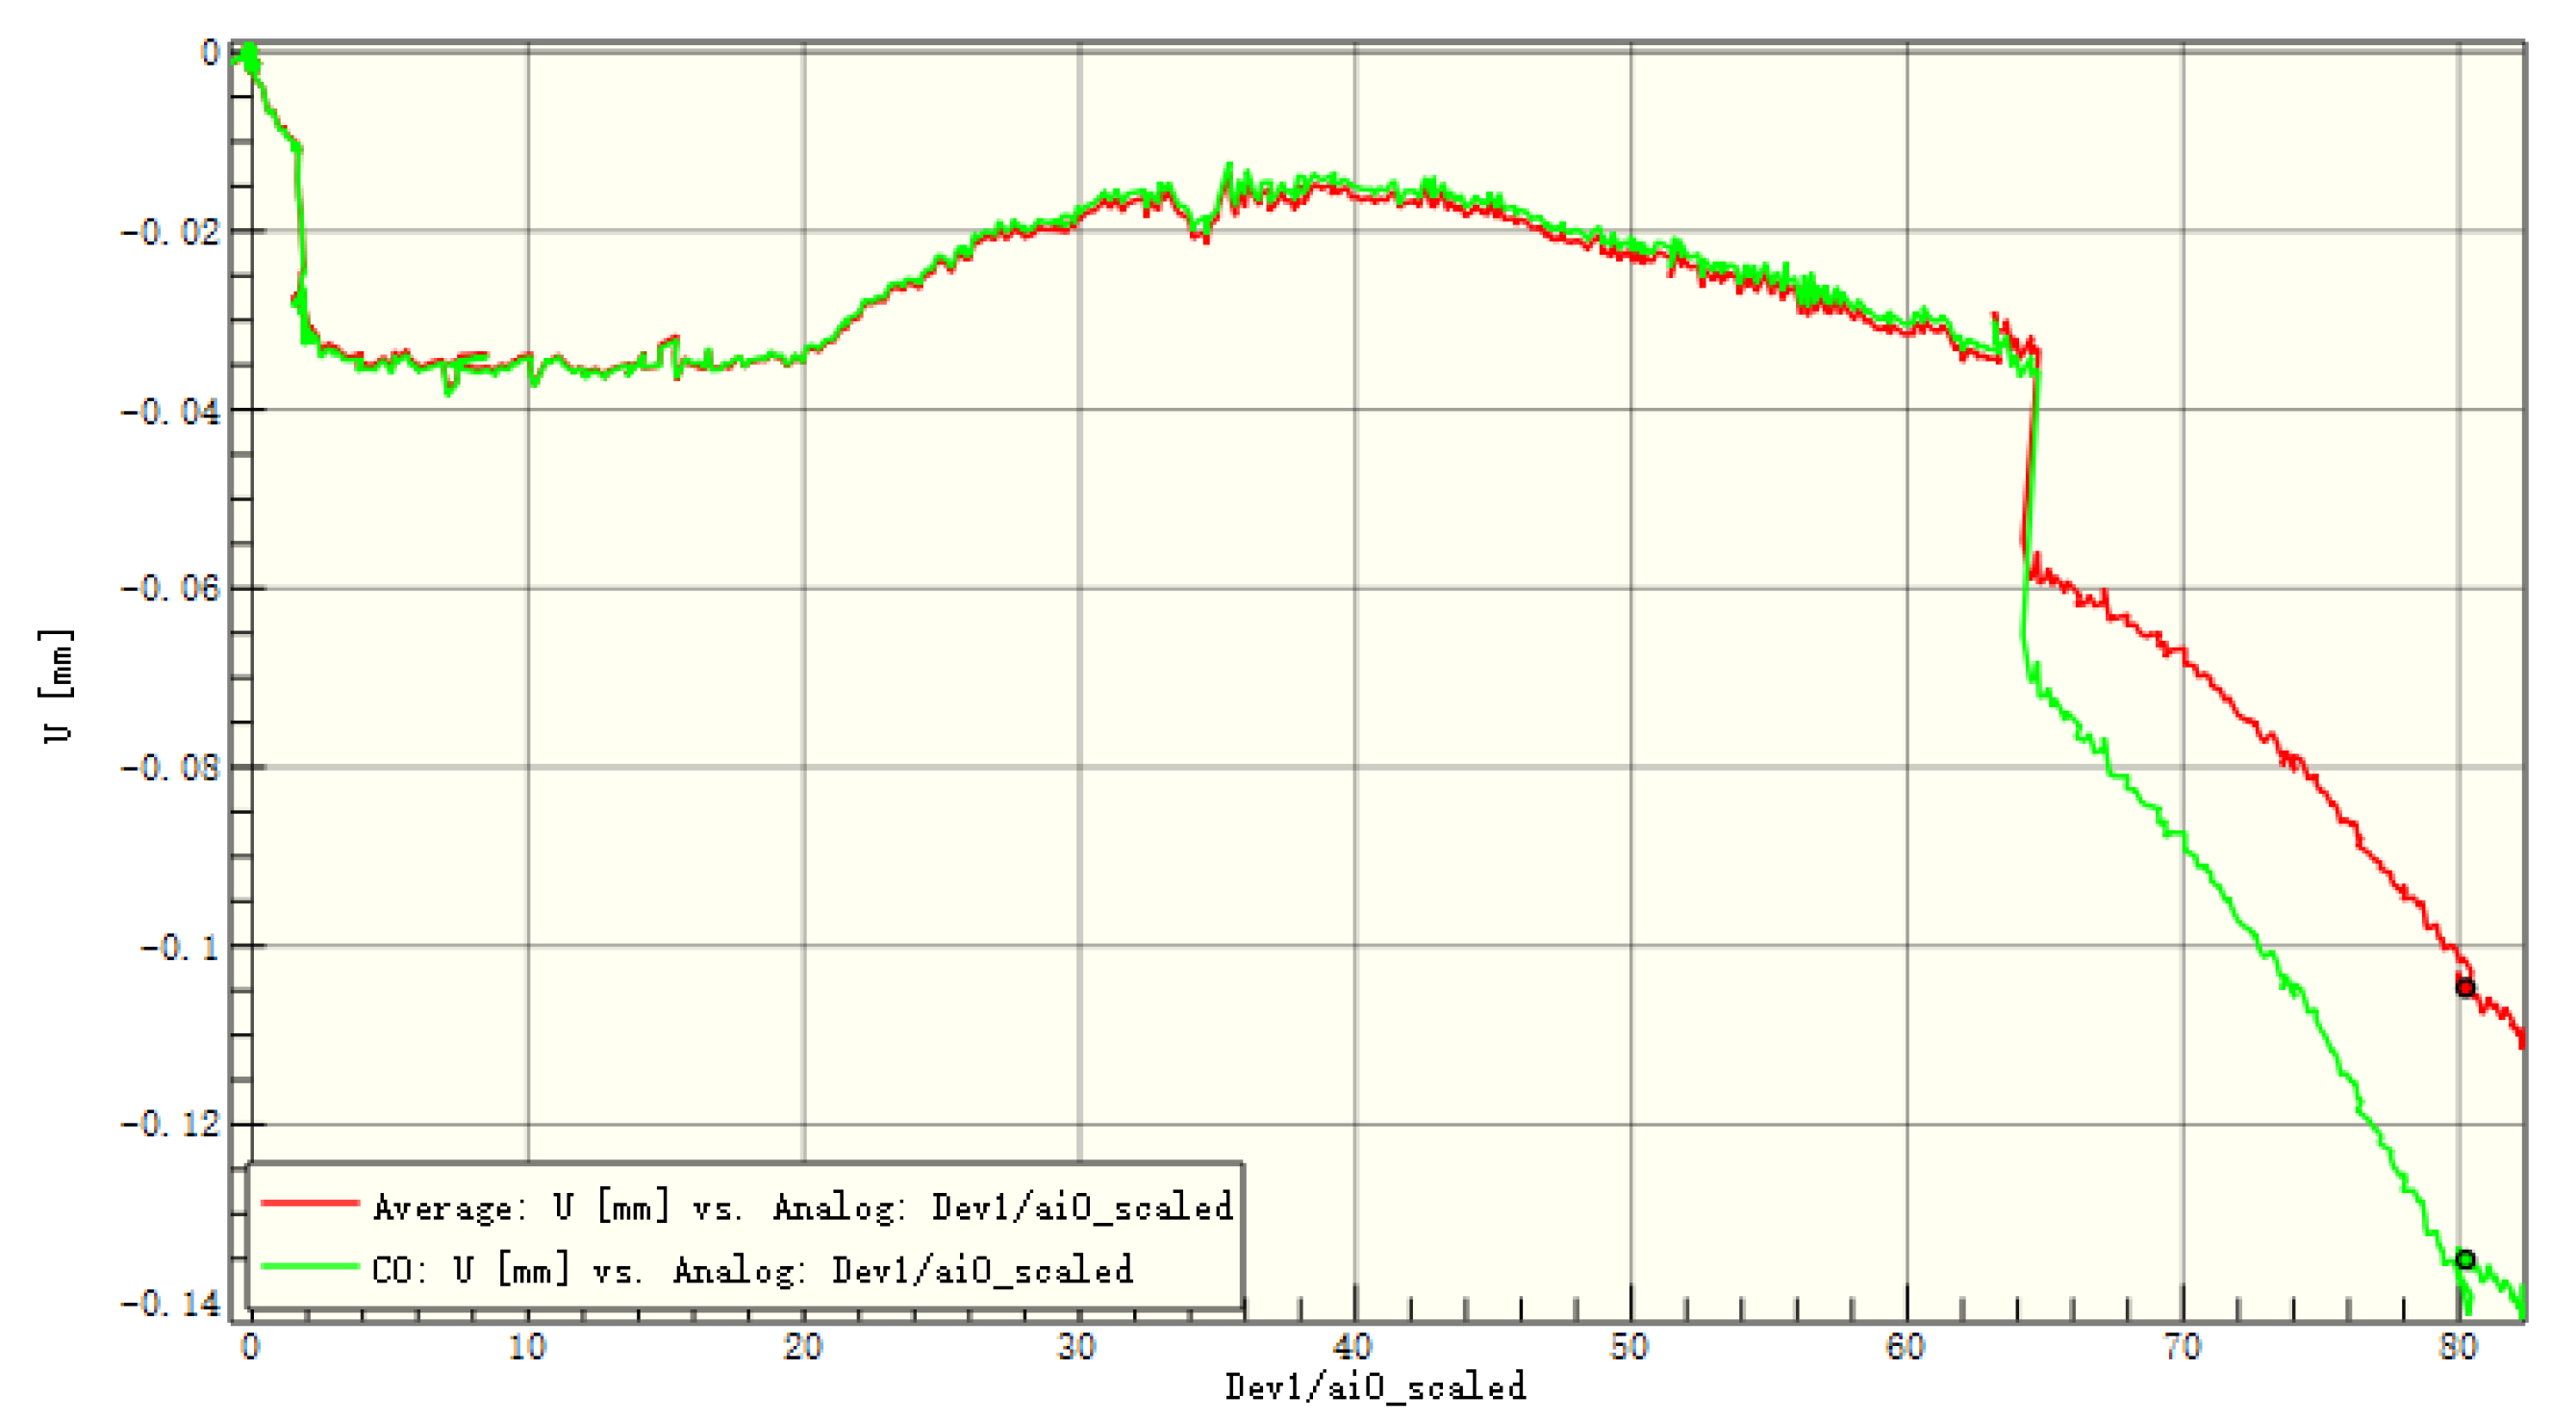
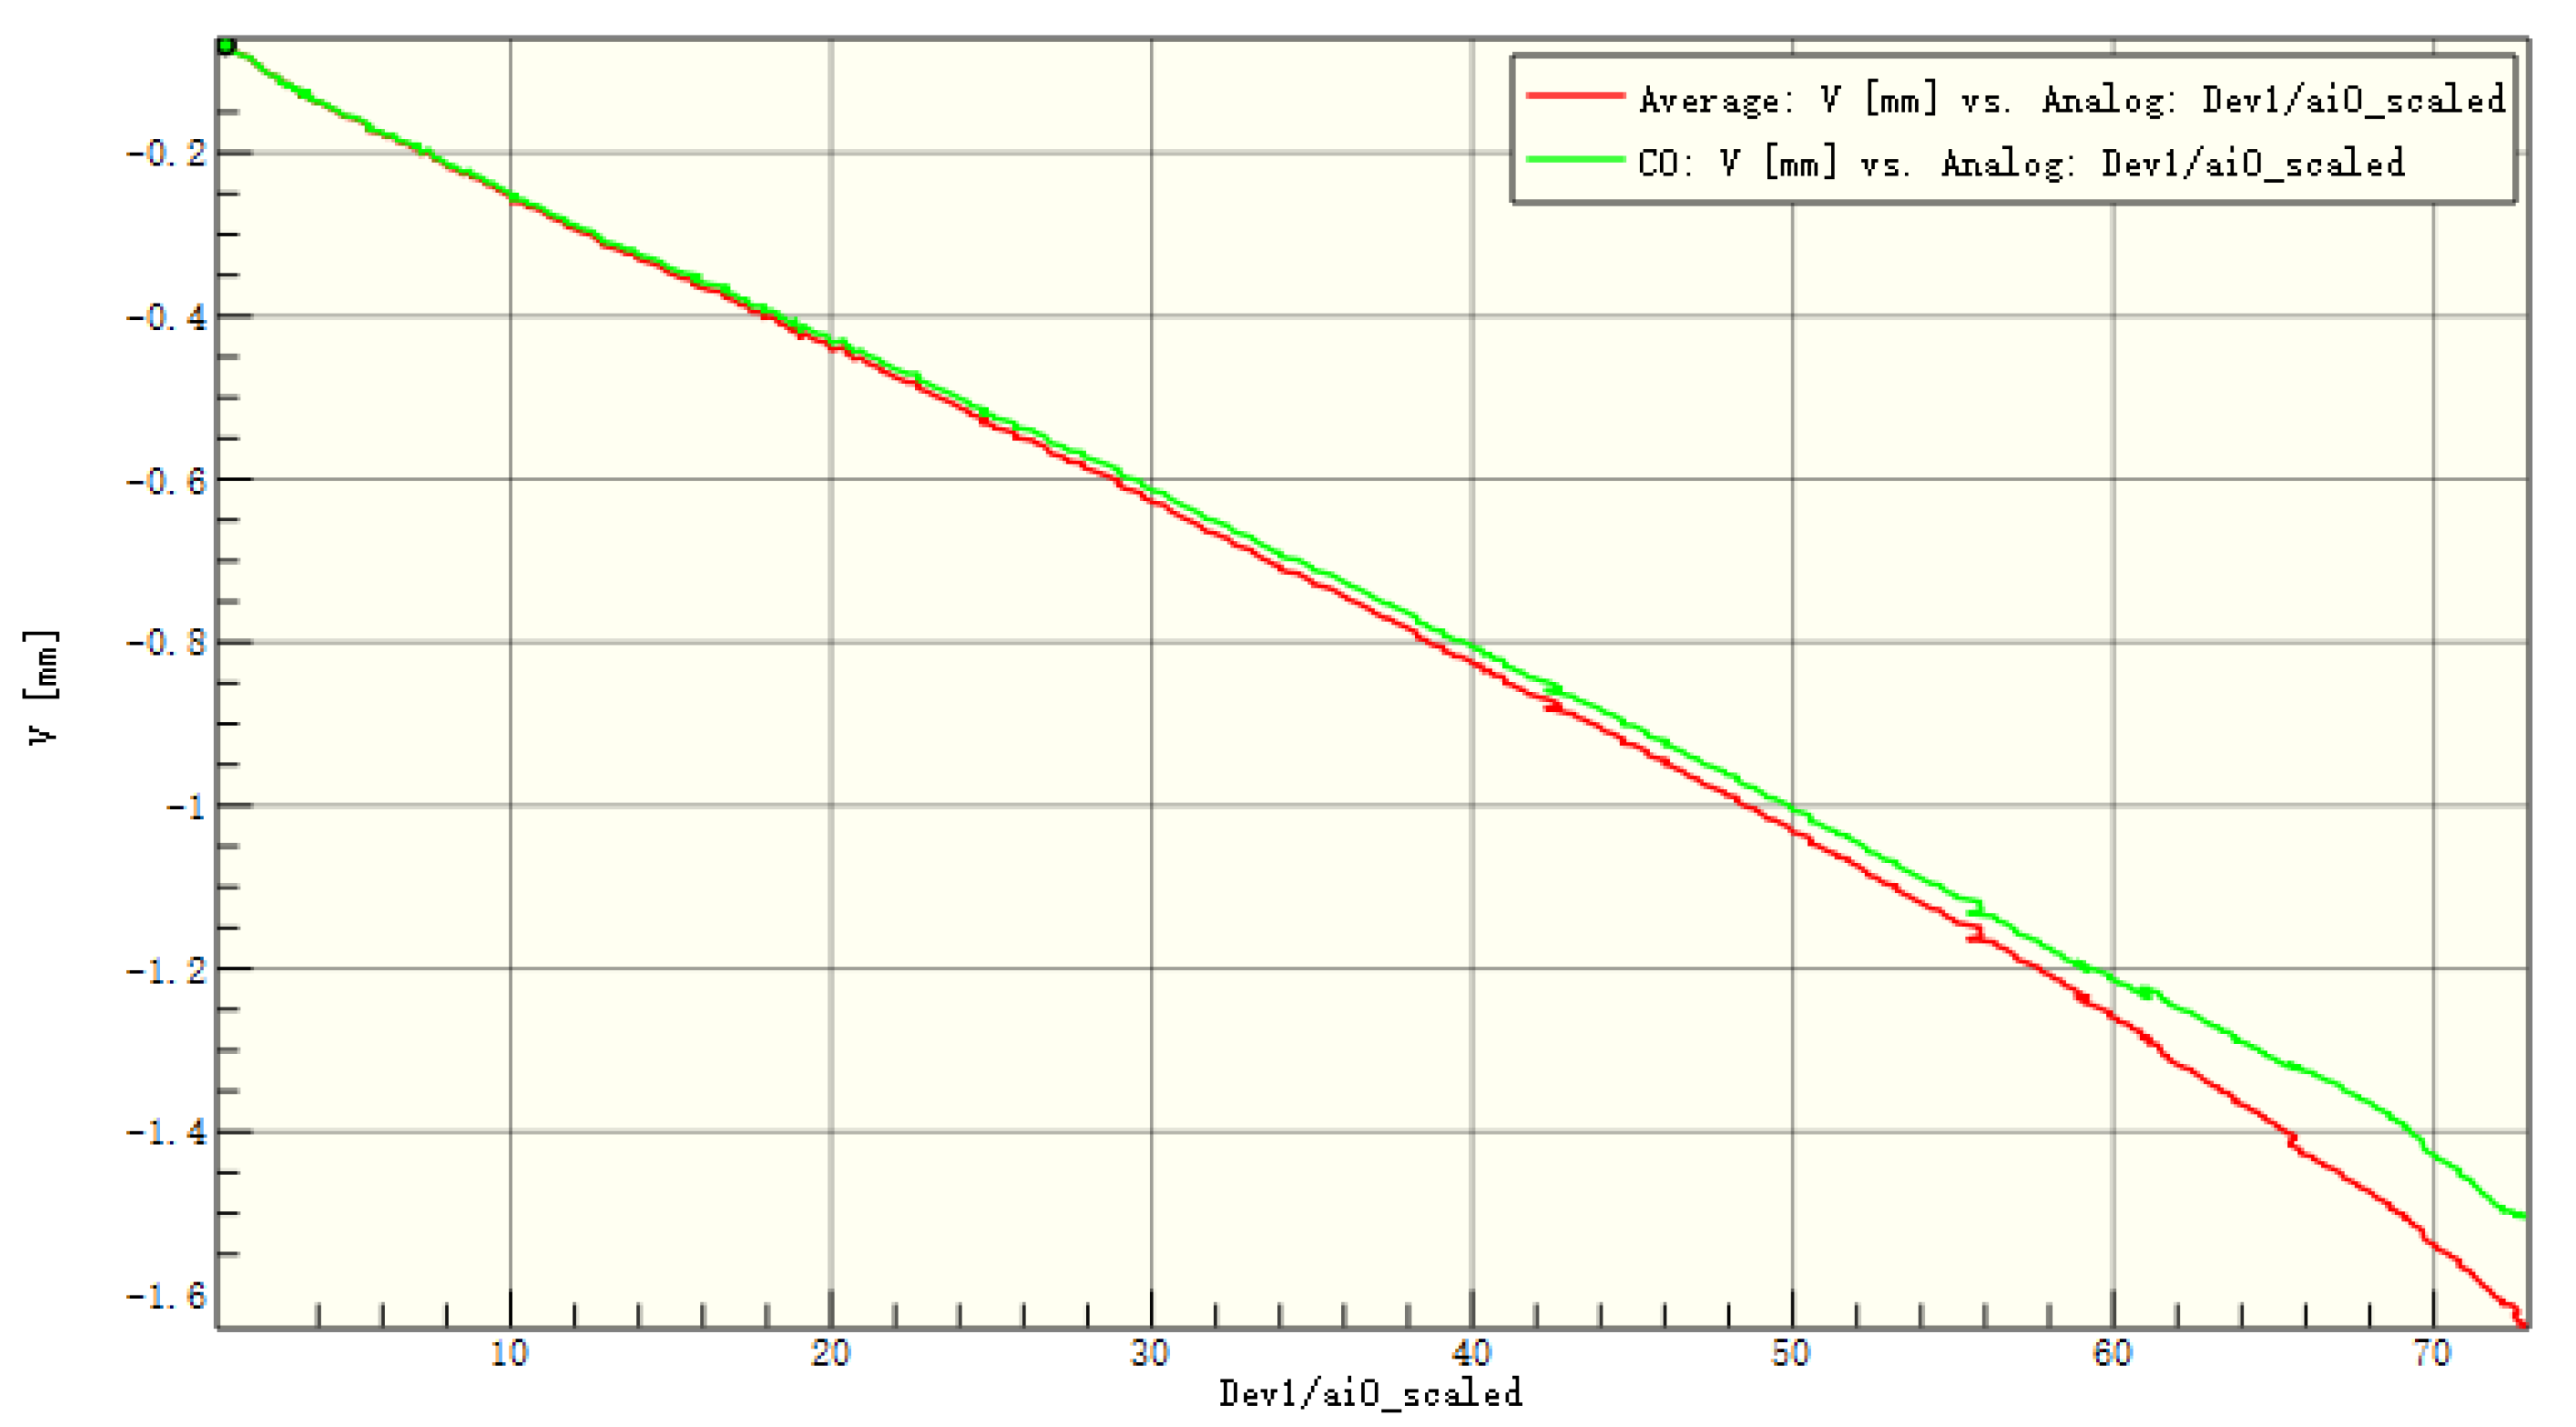
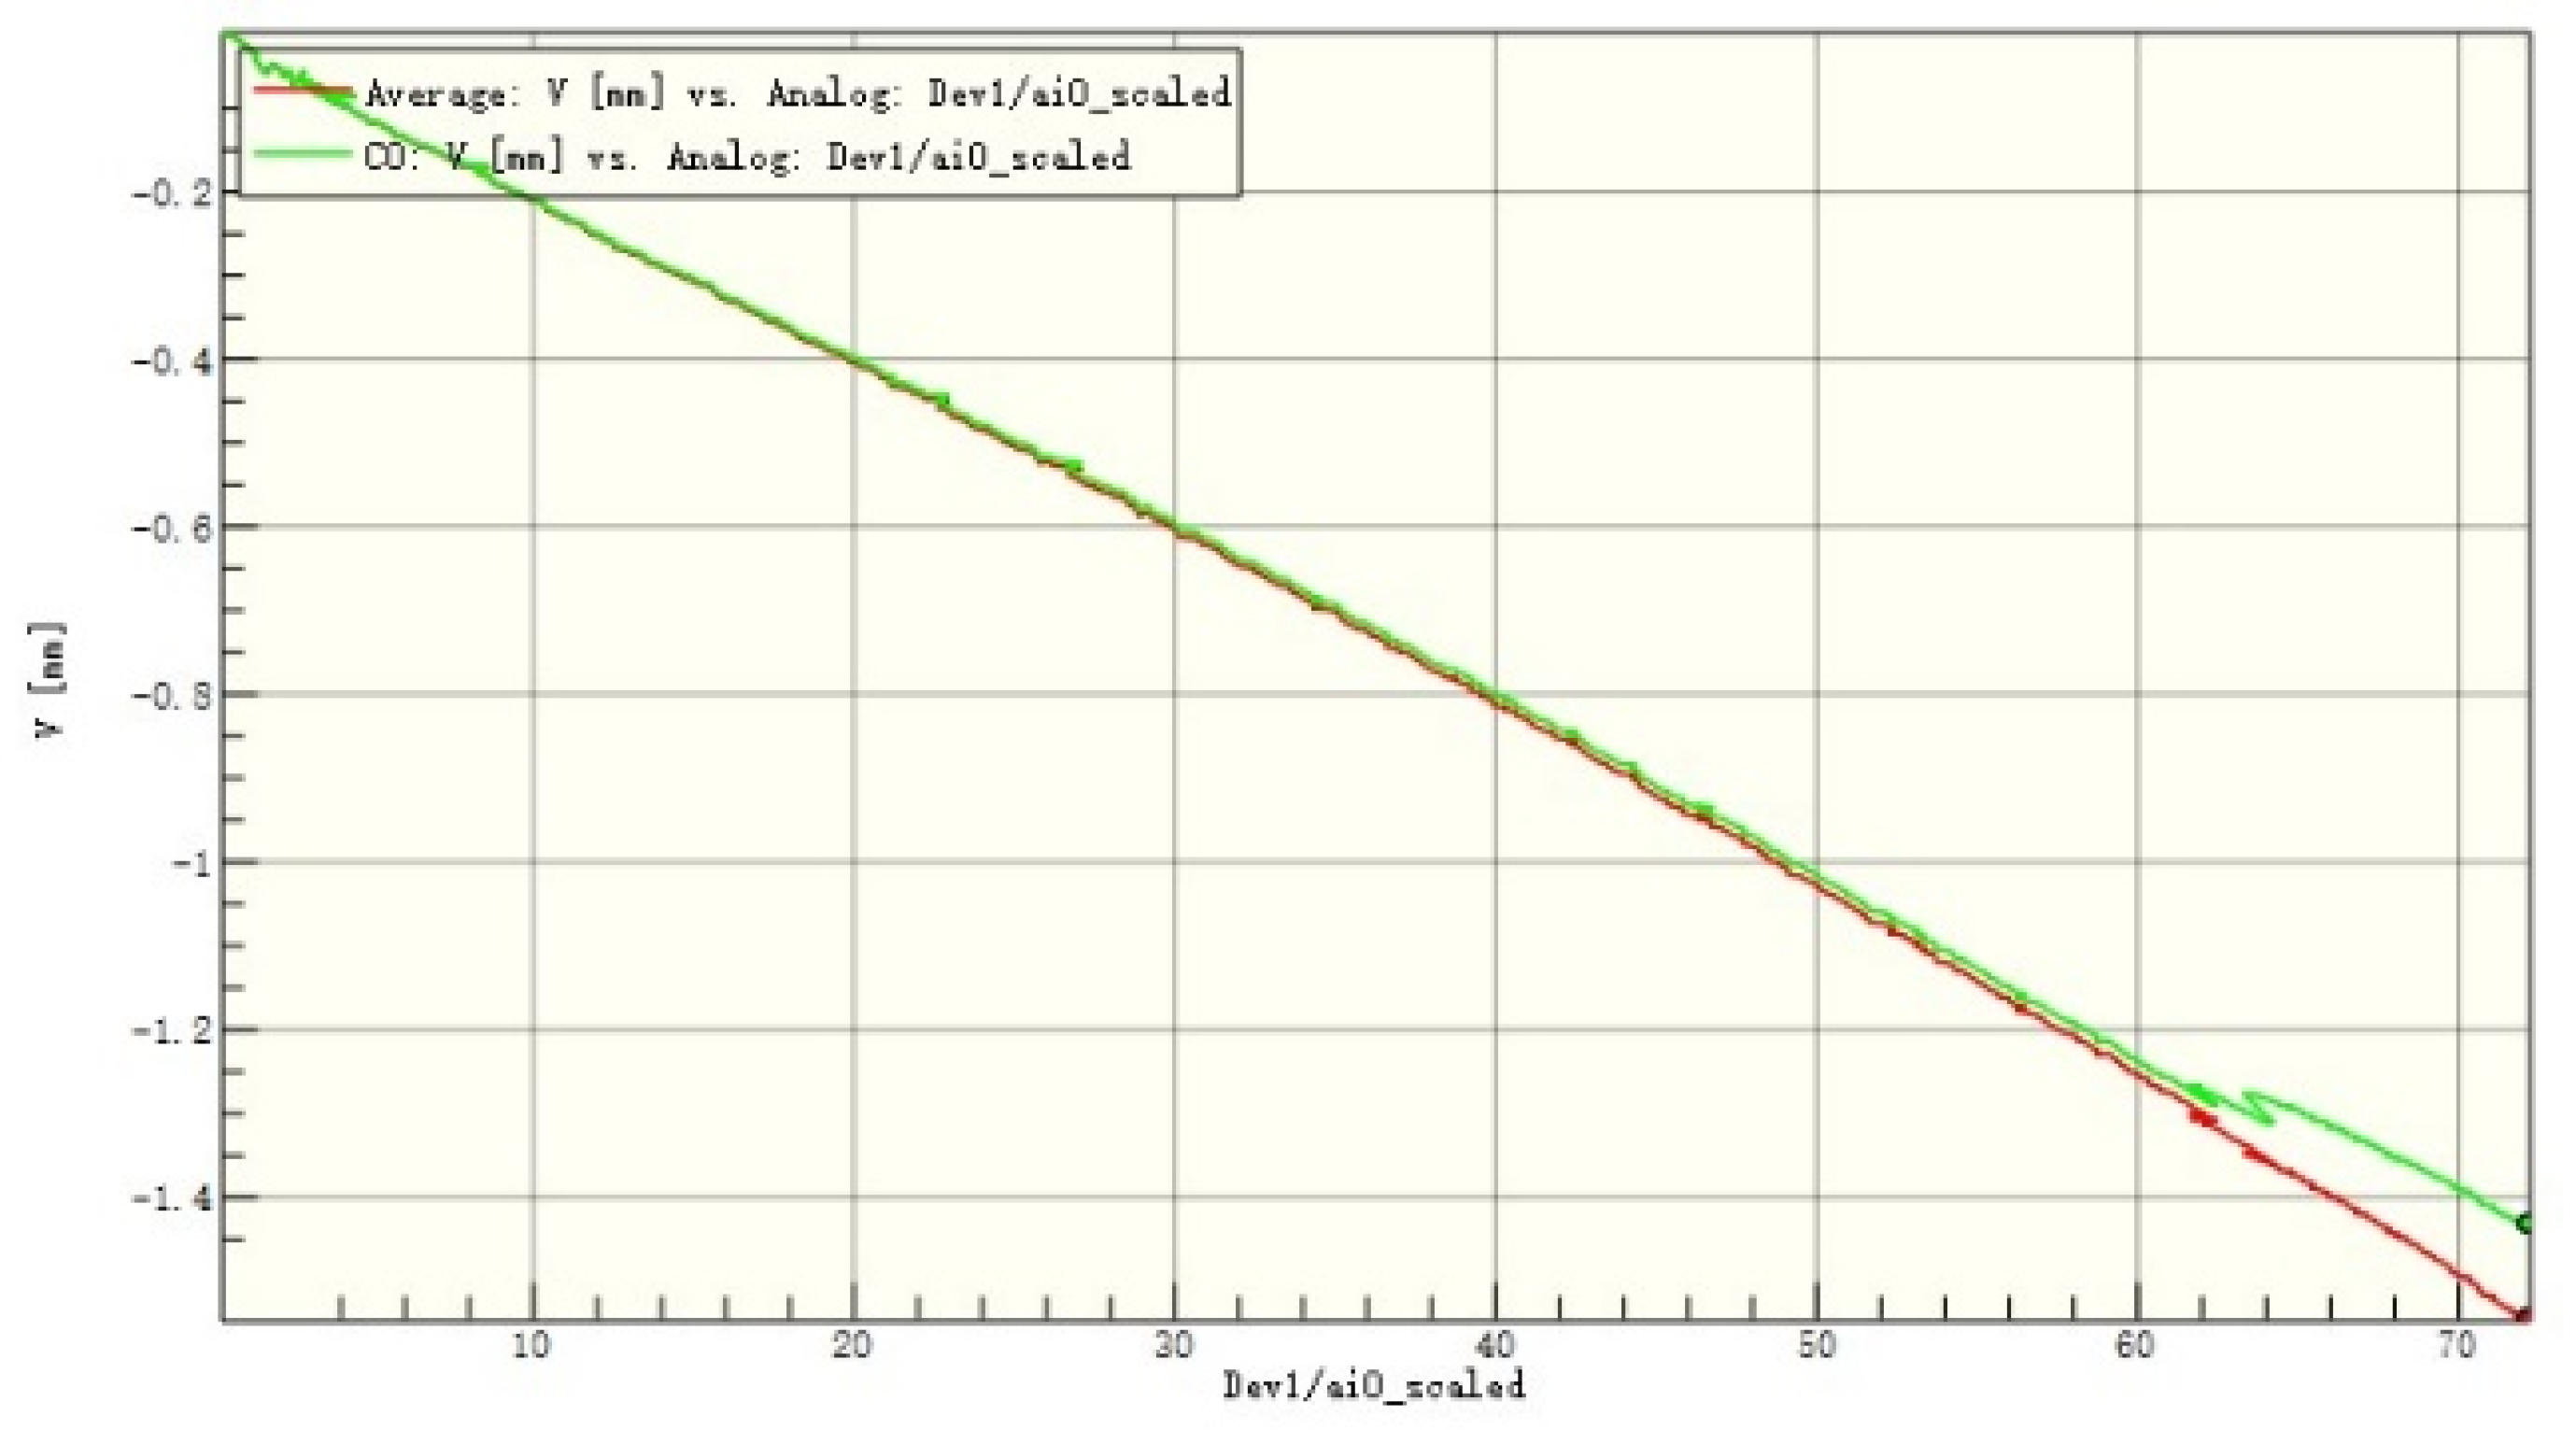
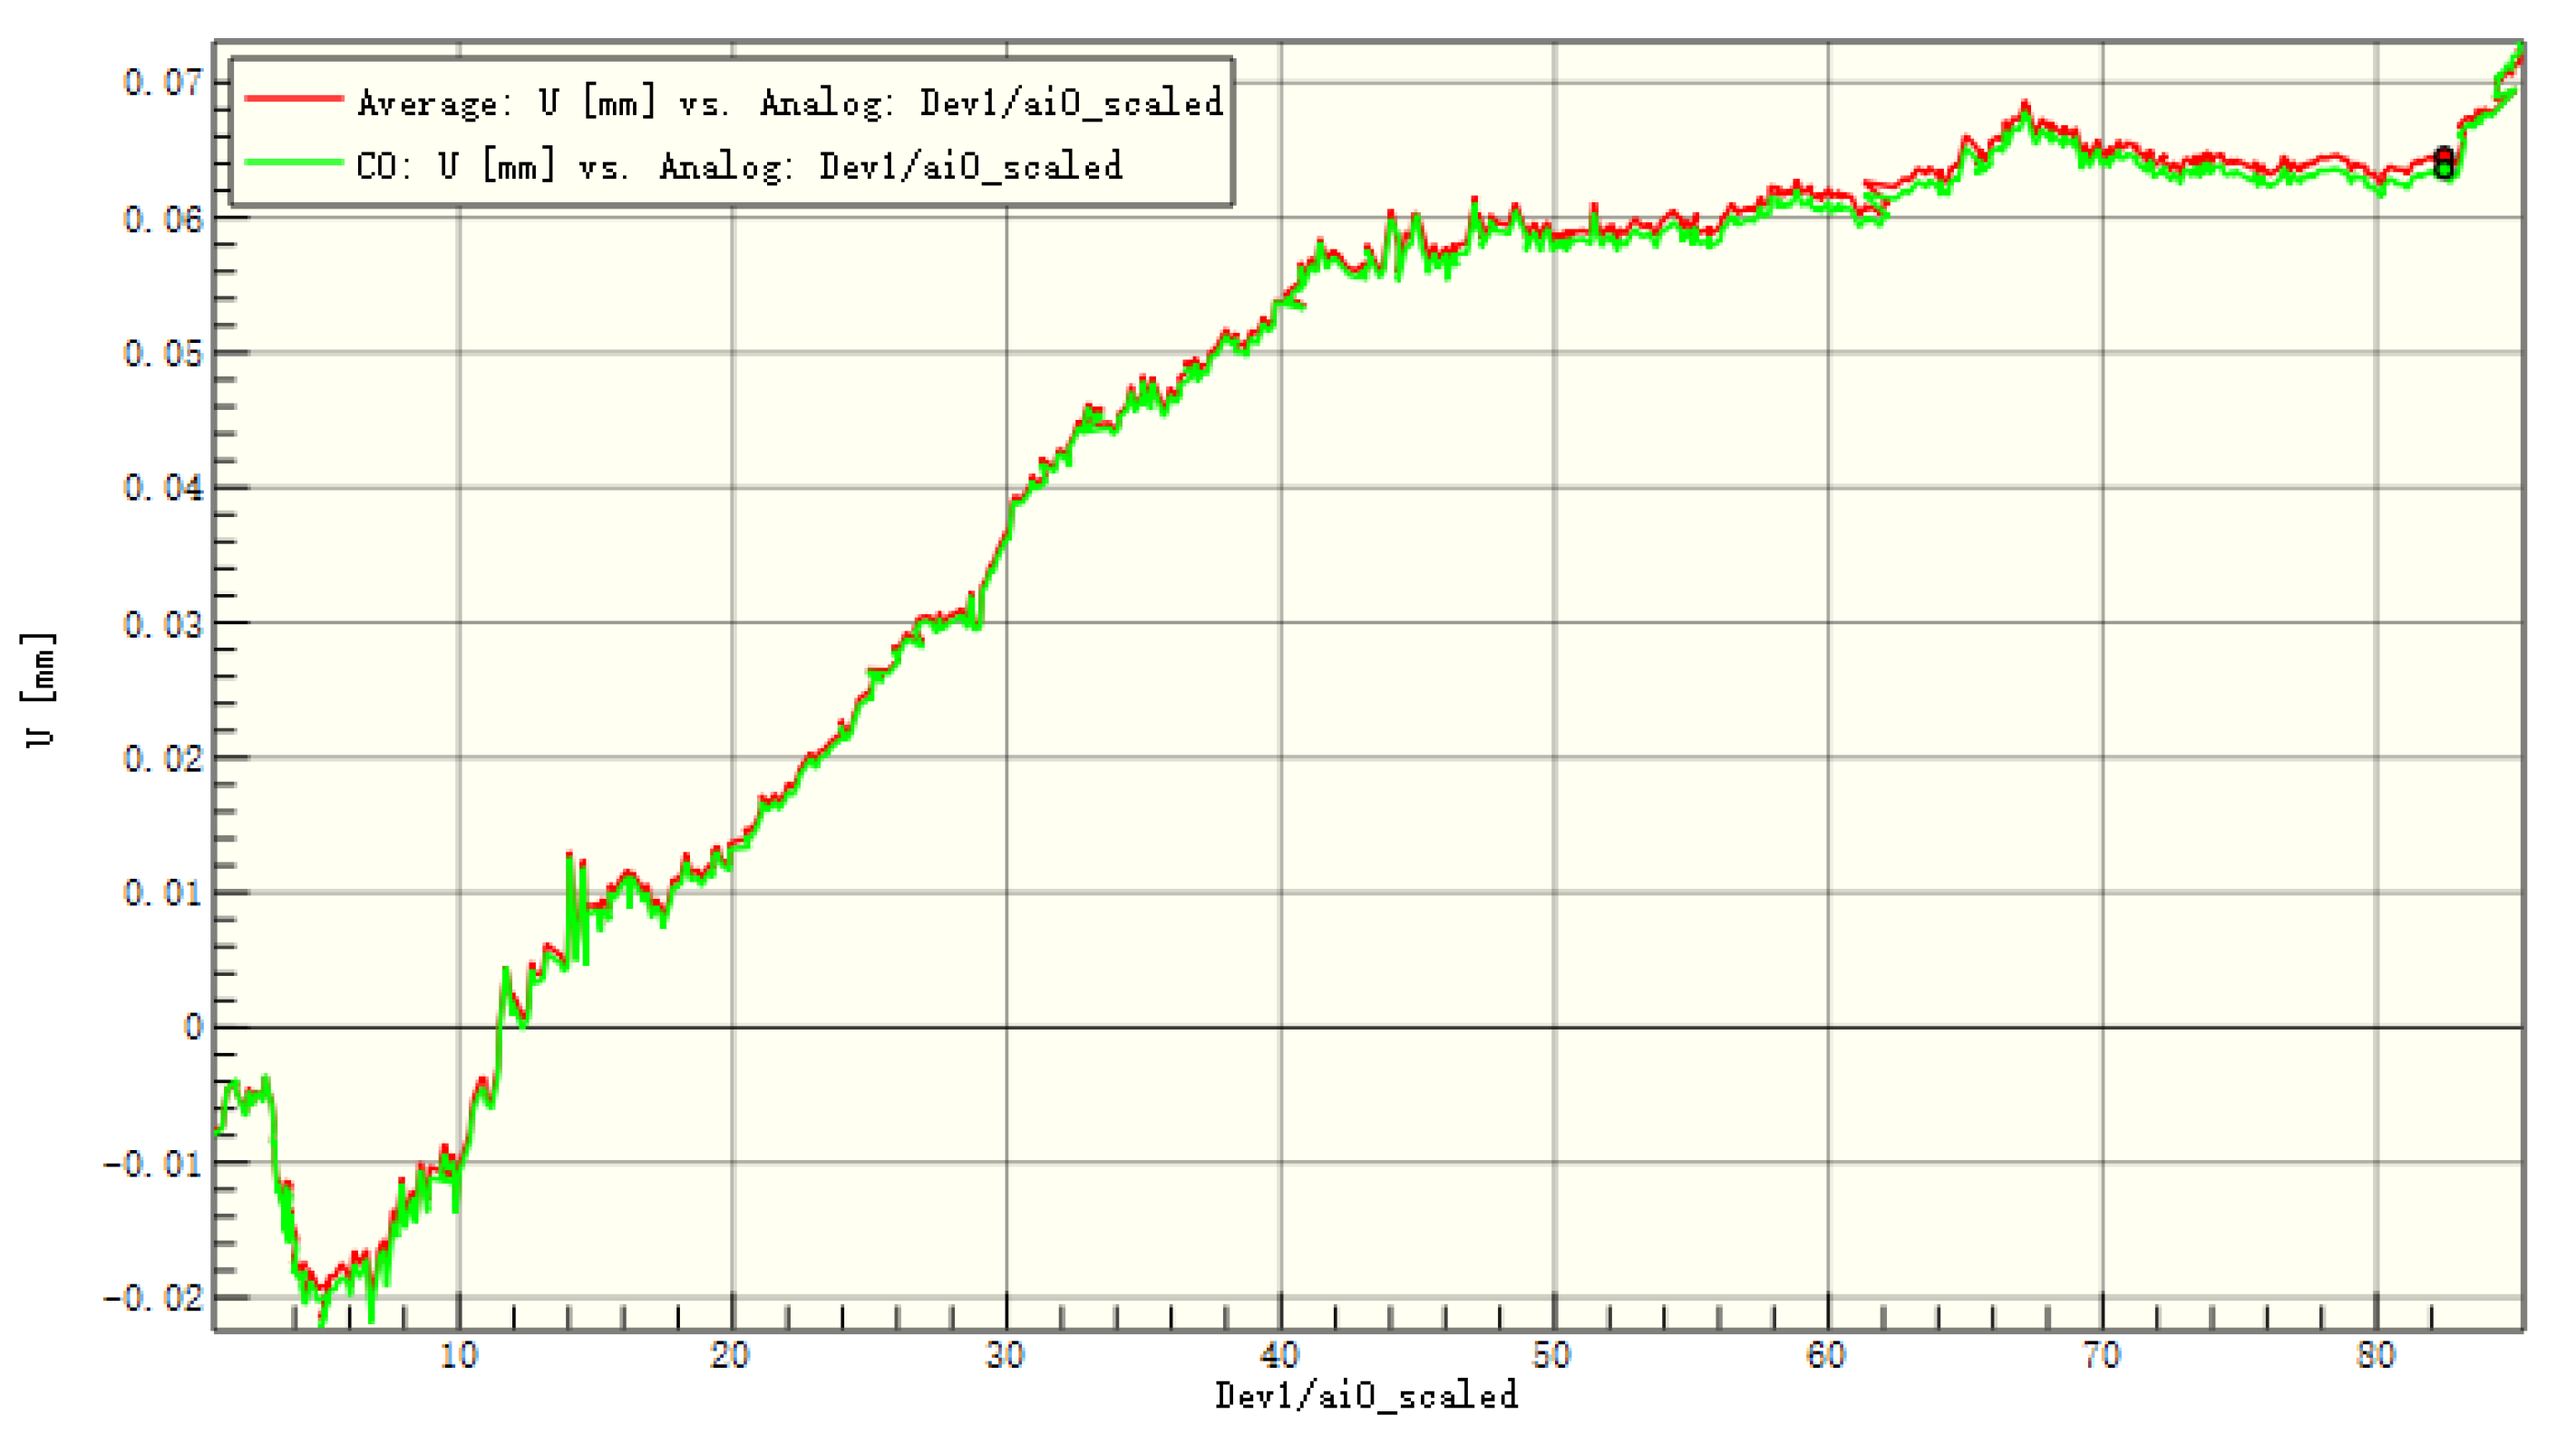
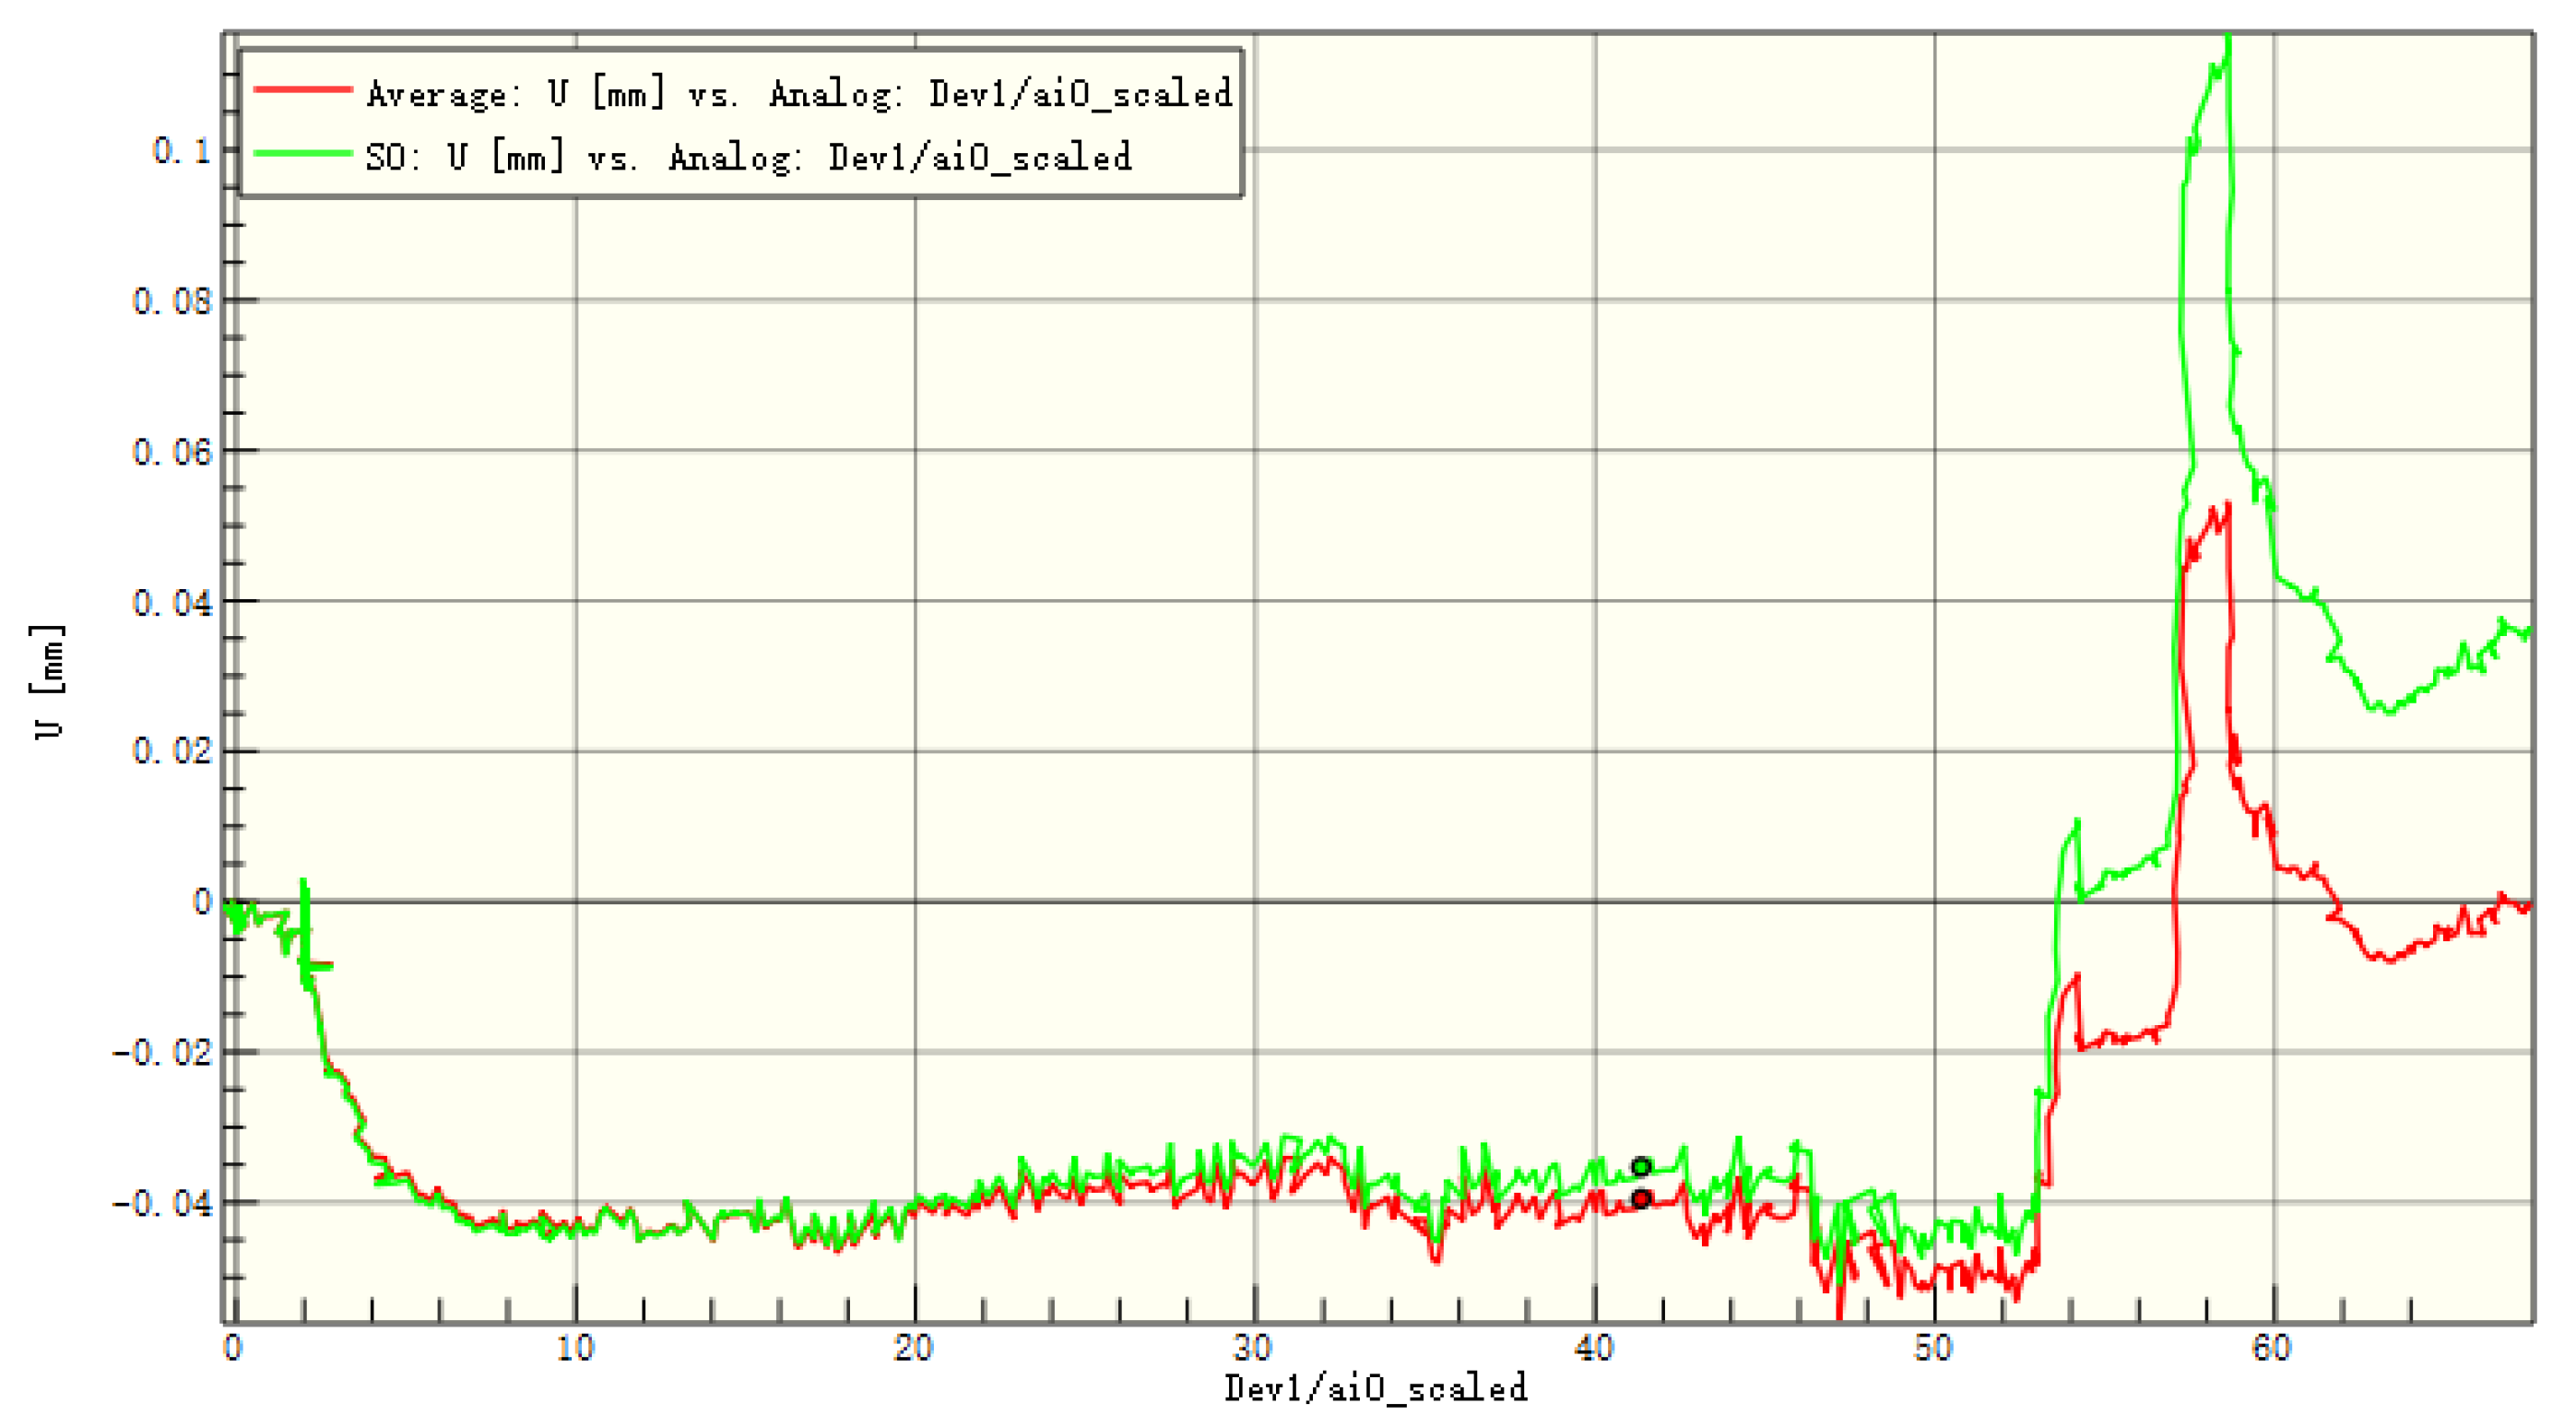
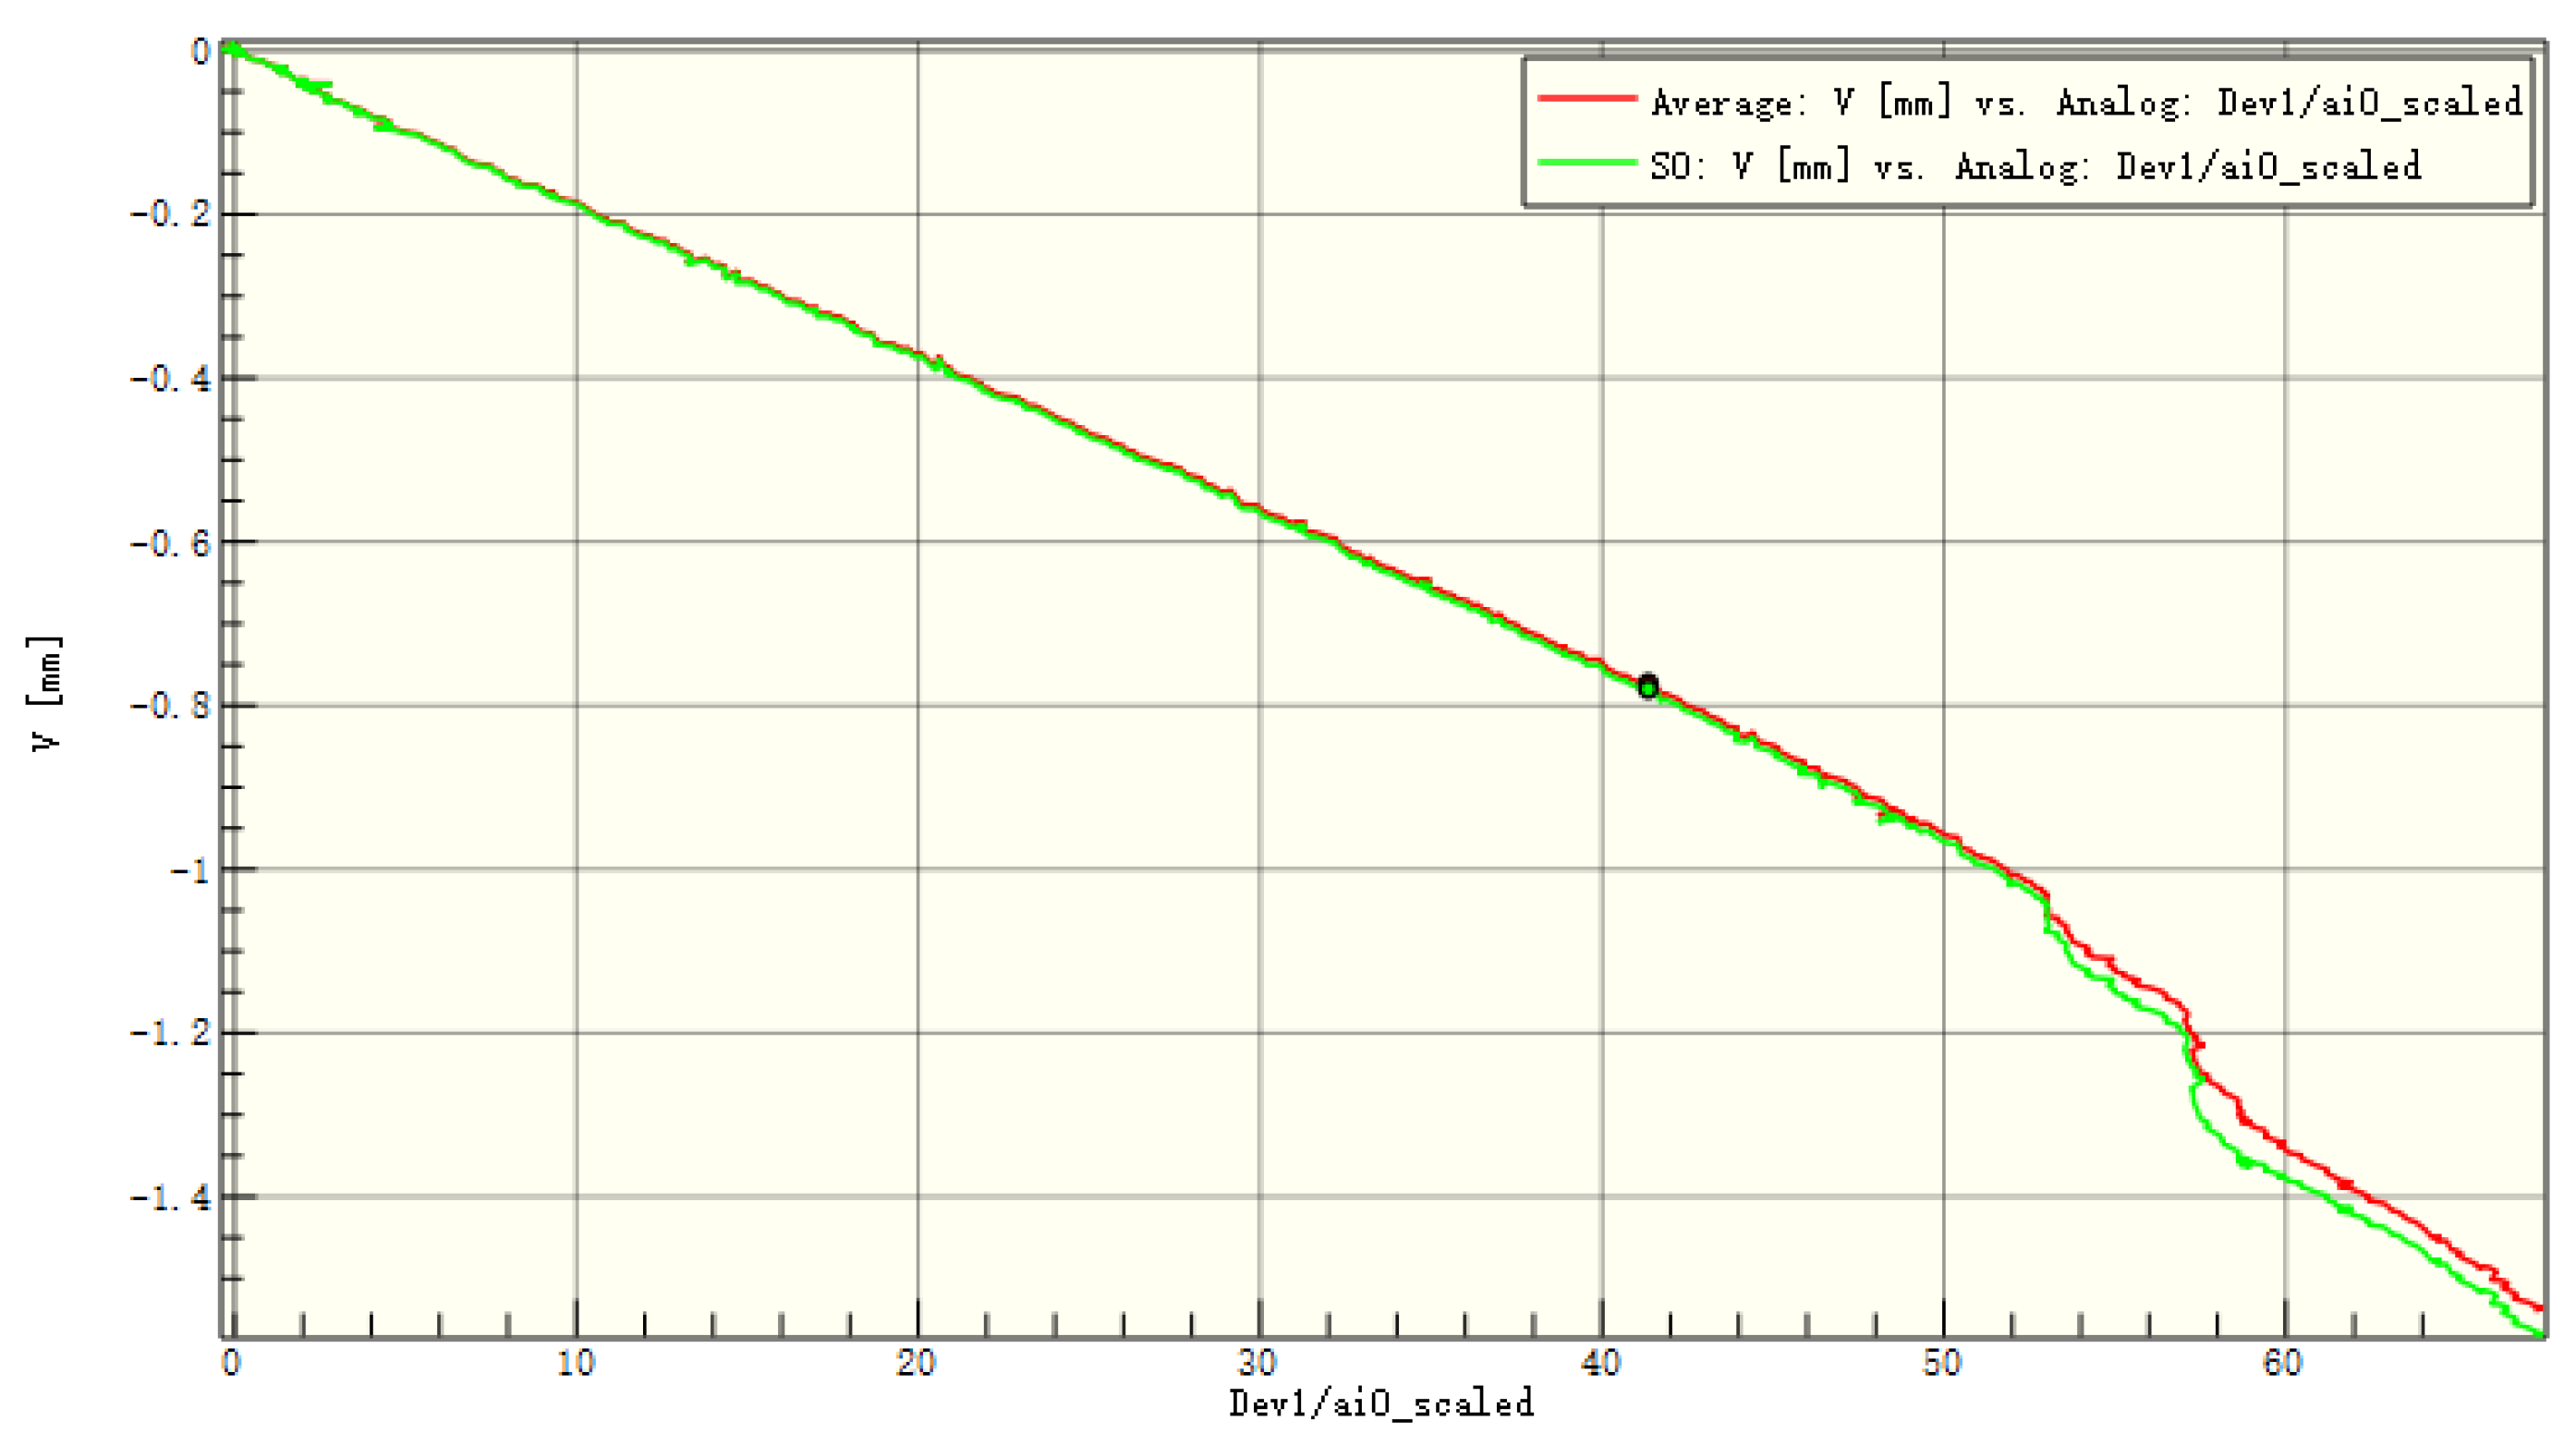
Applsci 14 04397 g015
Figure 16. Average displacement of the entire board and the patch in the y-direction of C1.
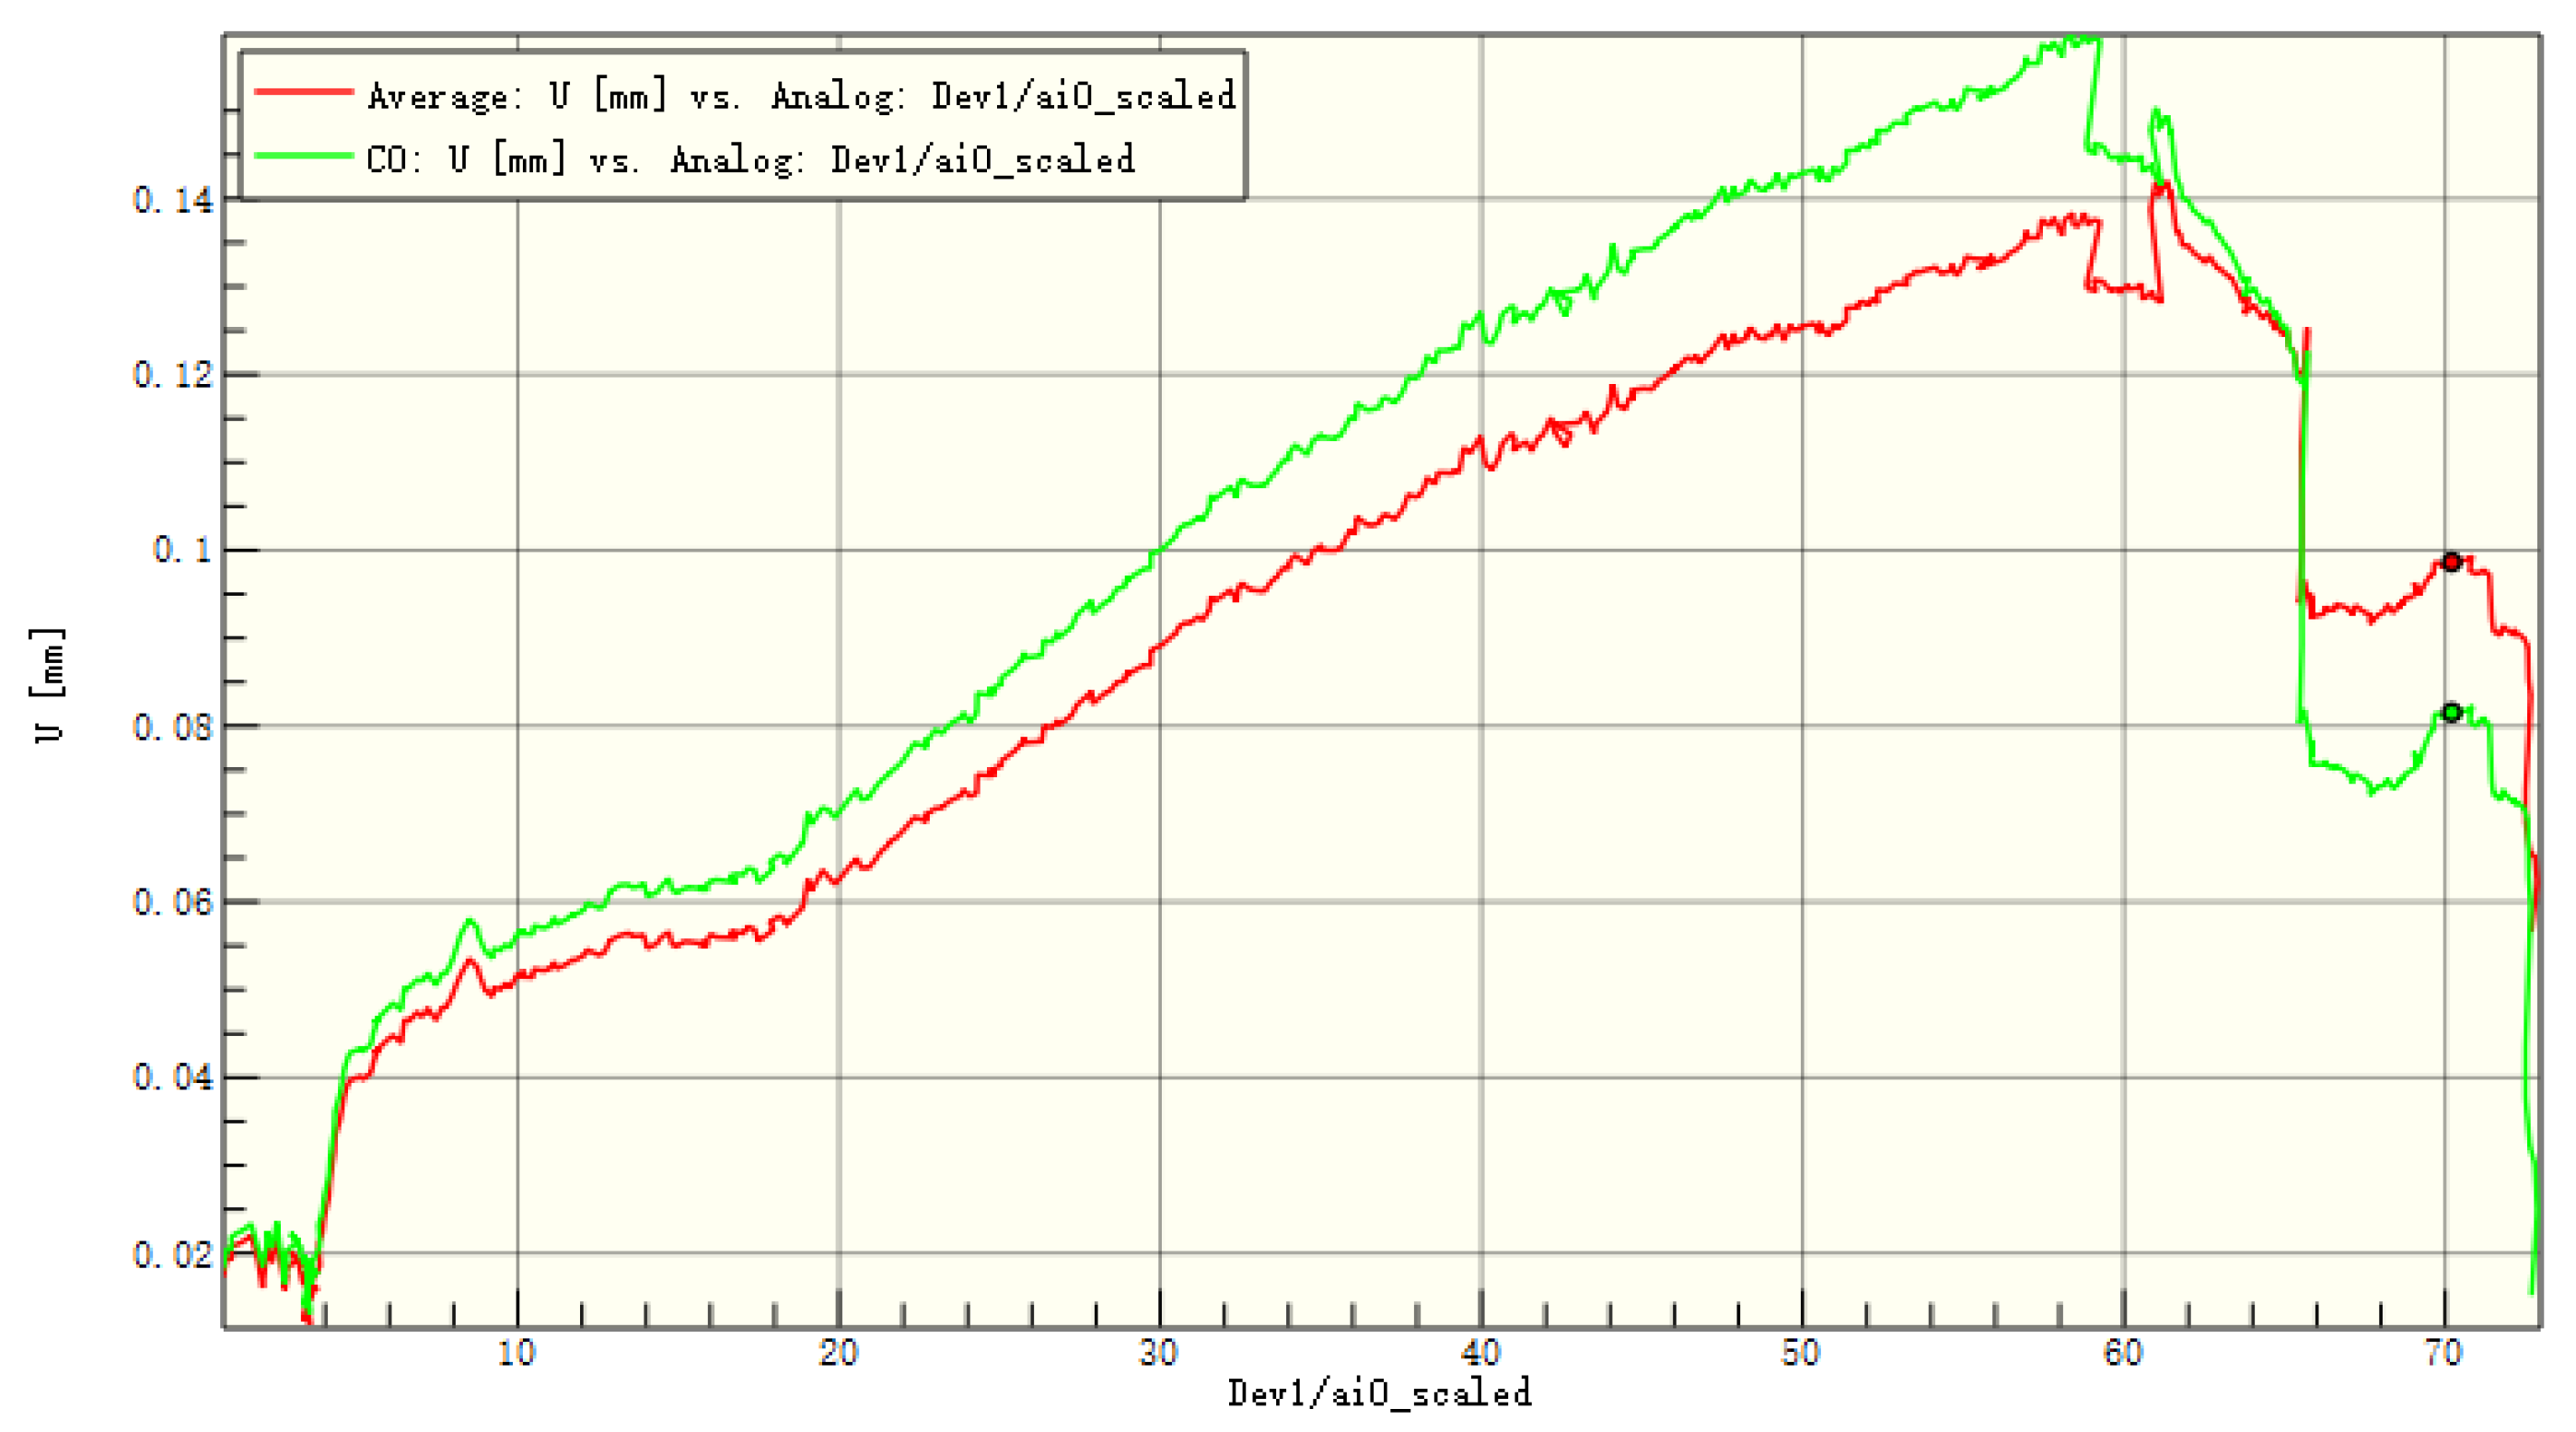
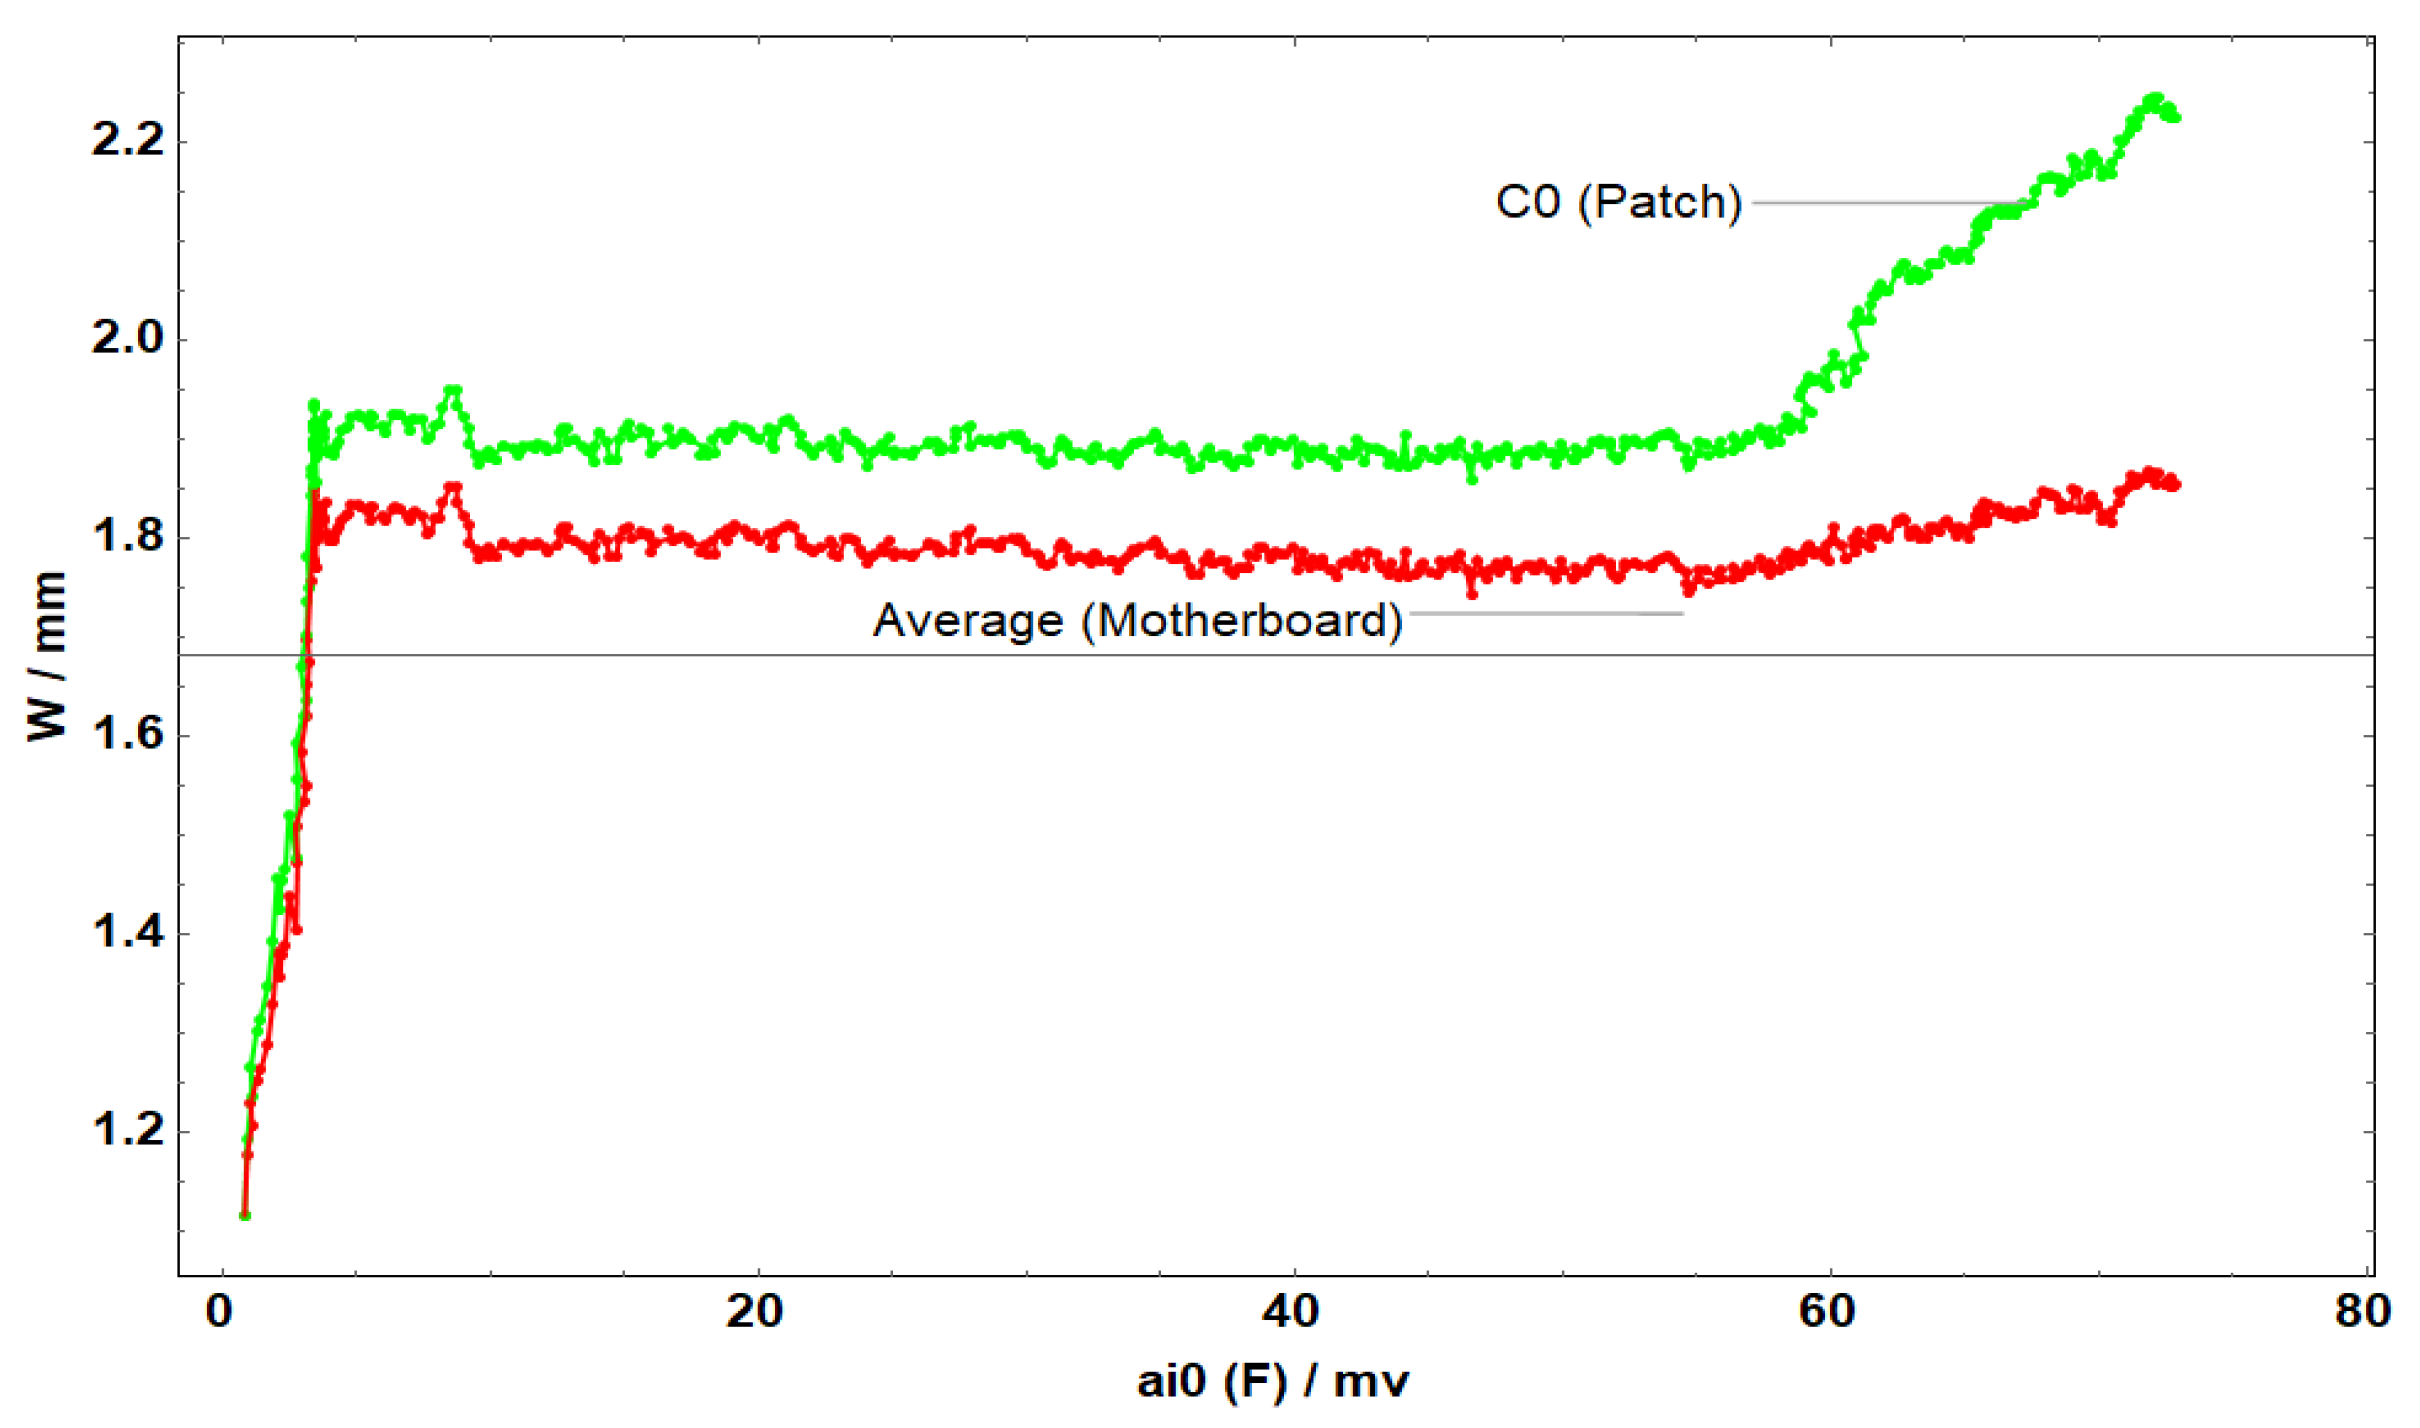
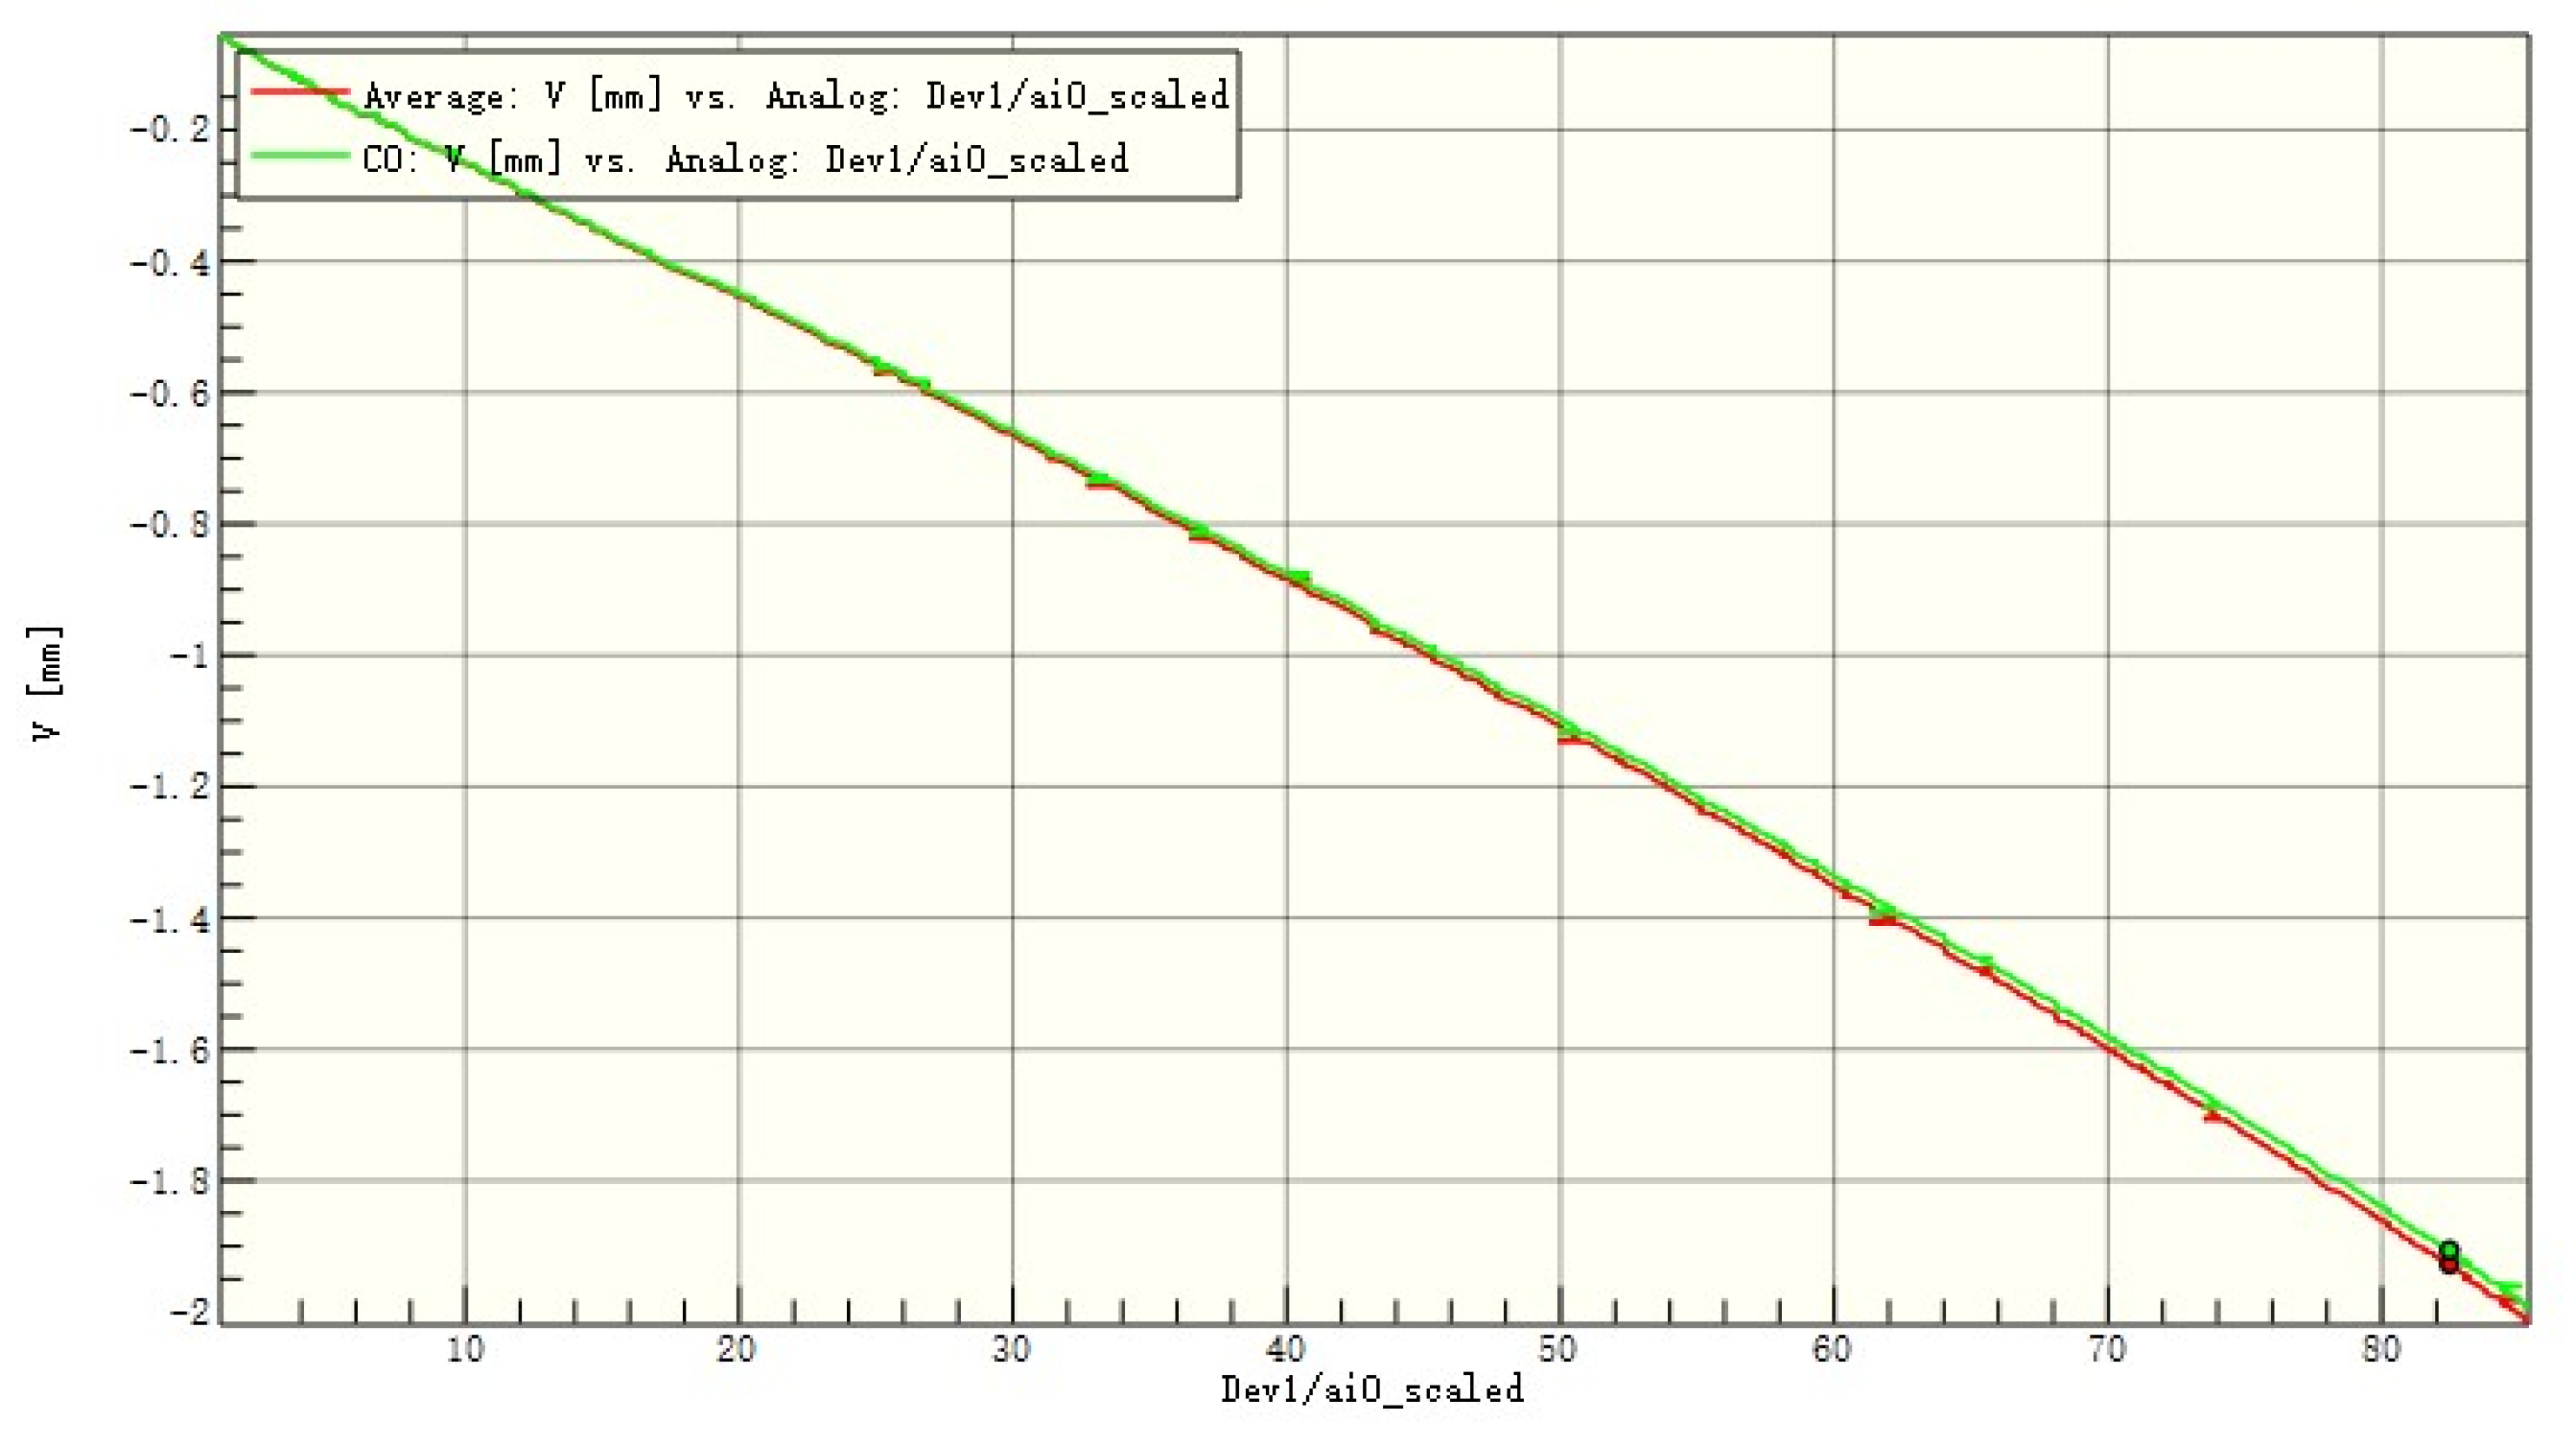
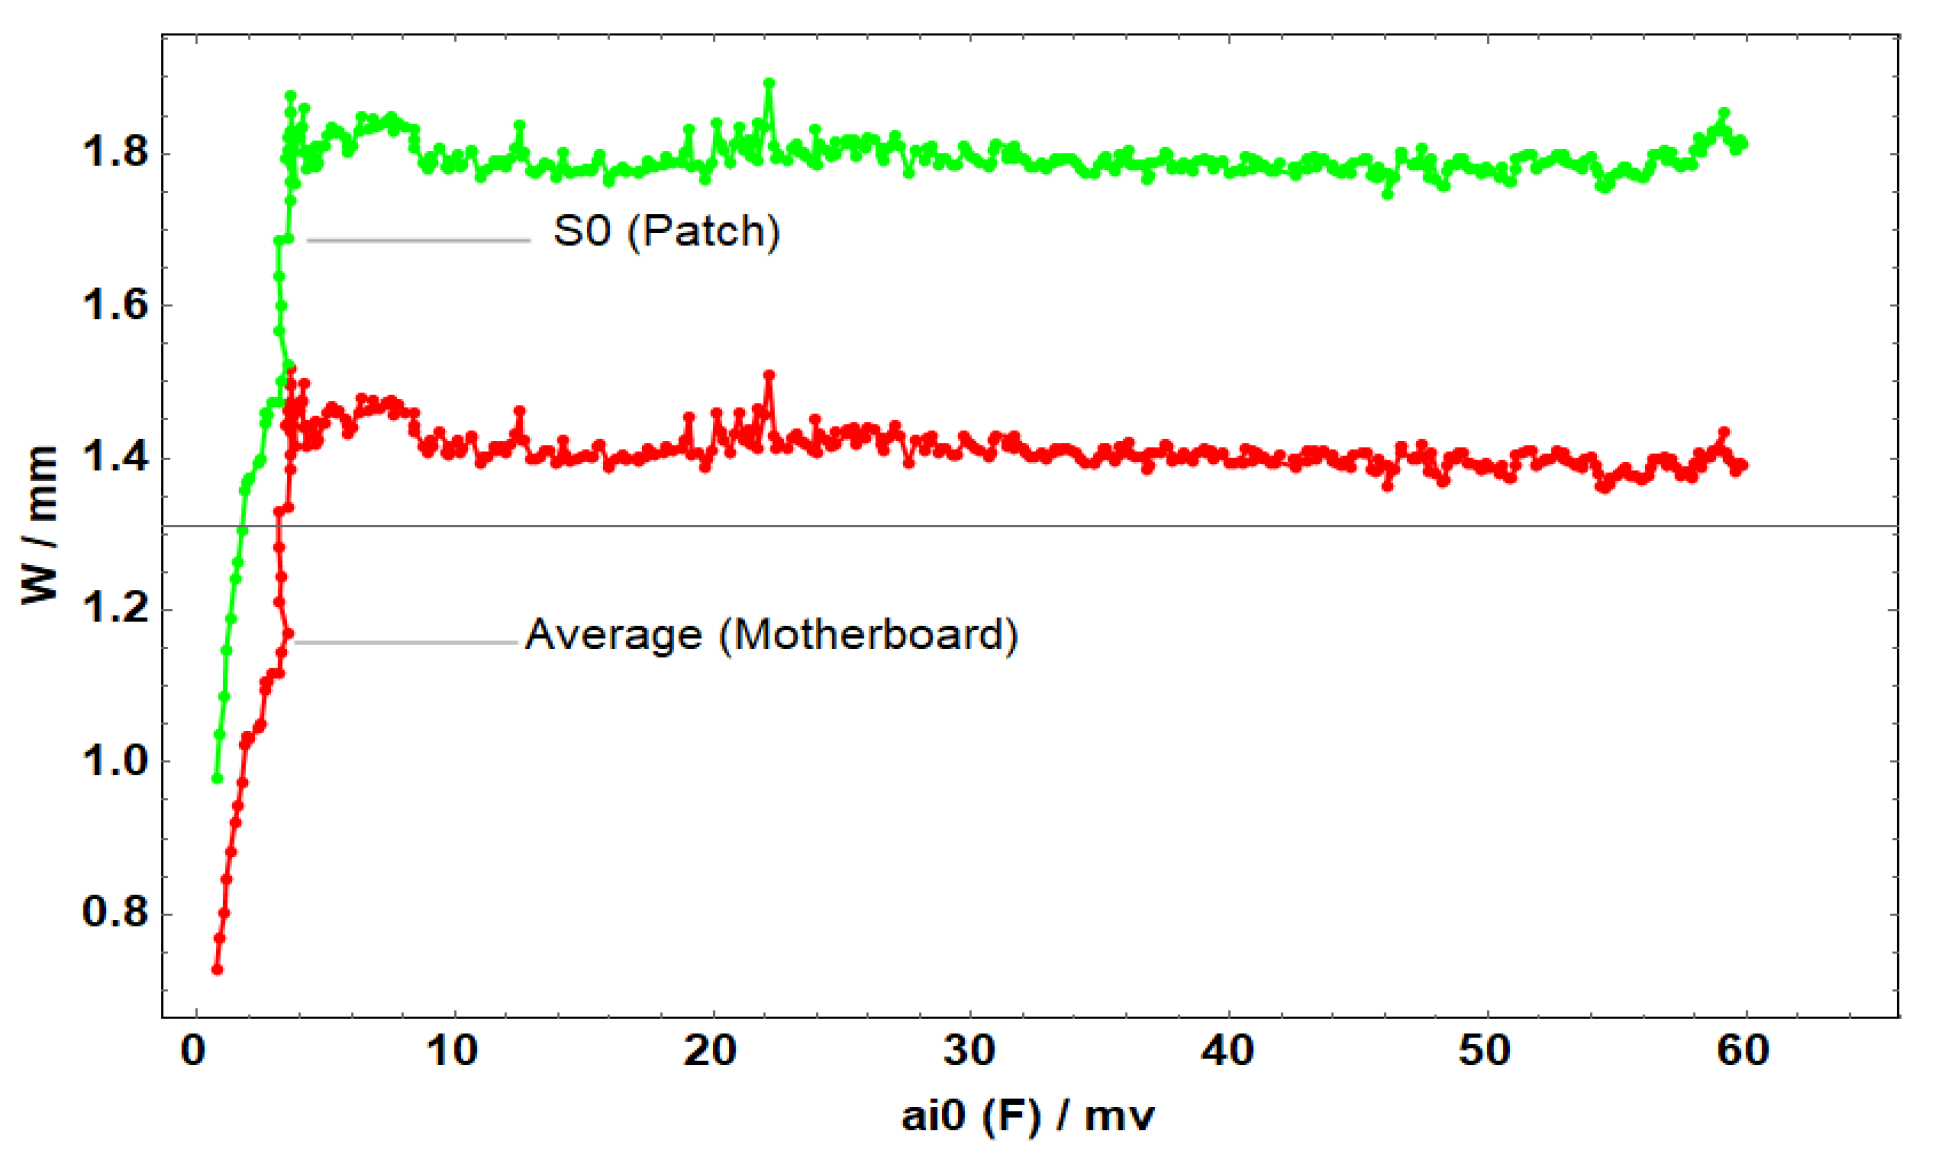
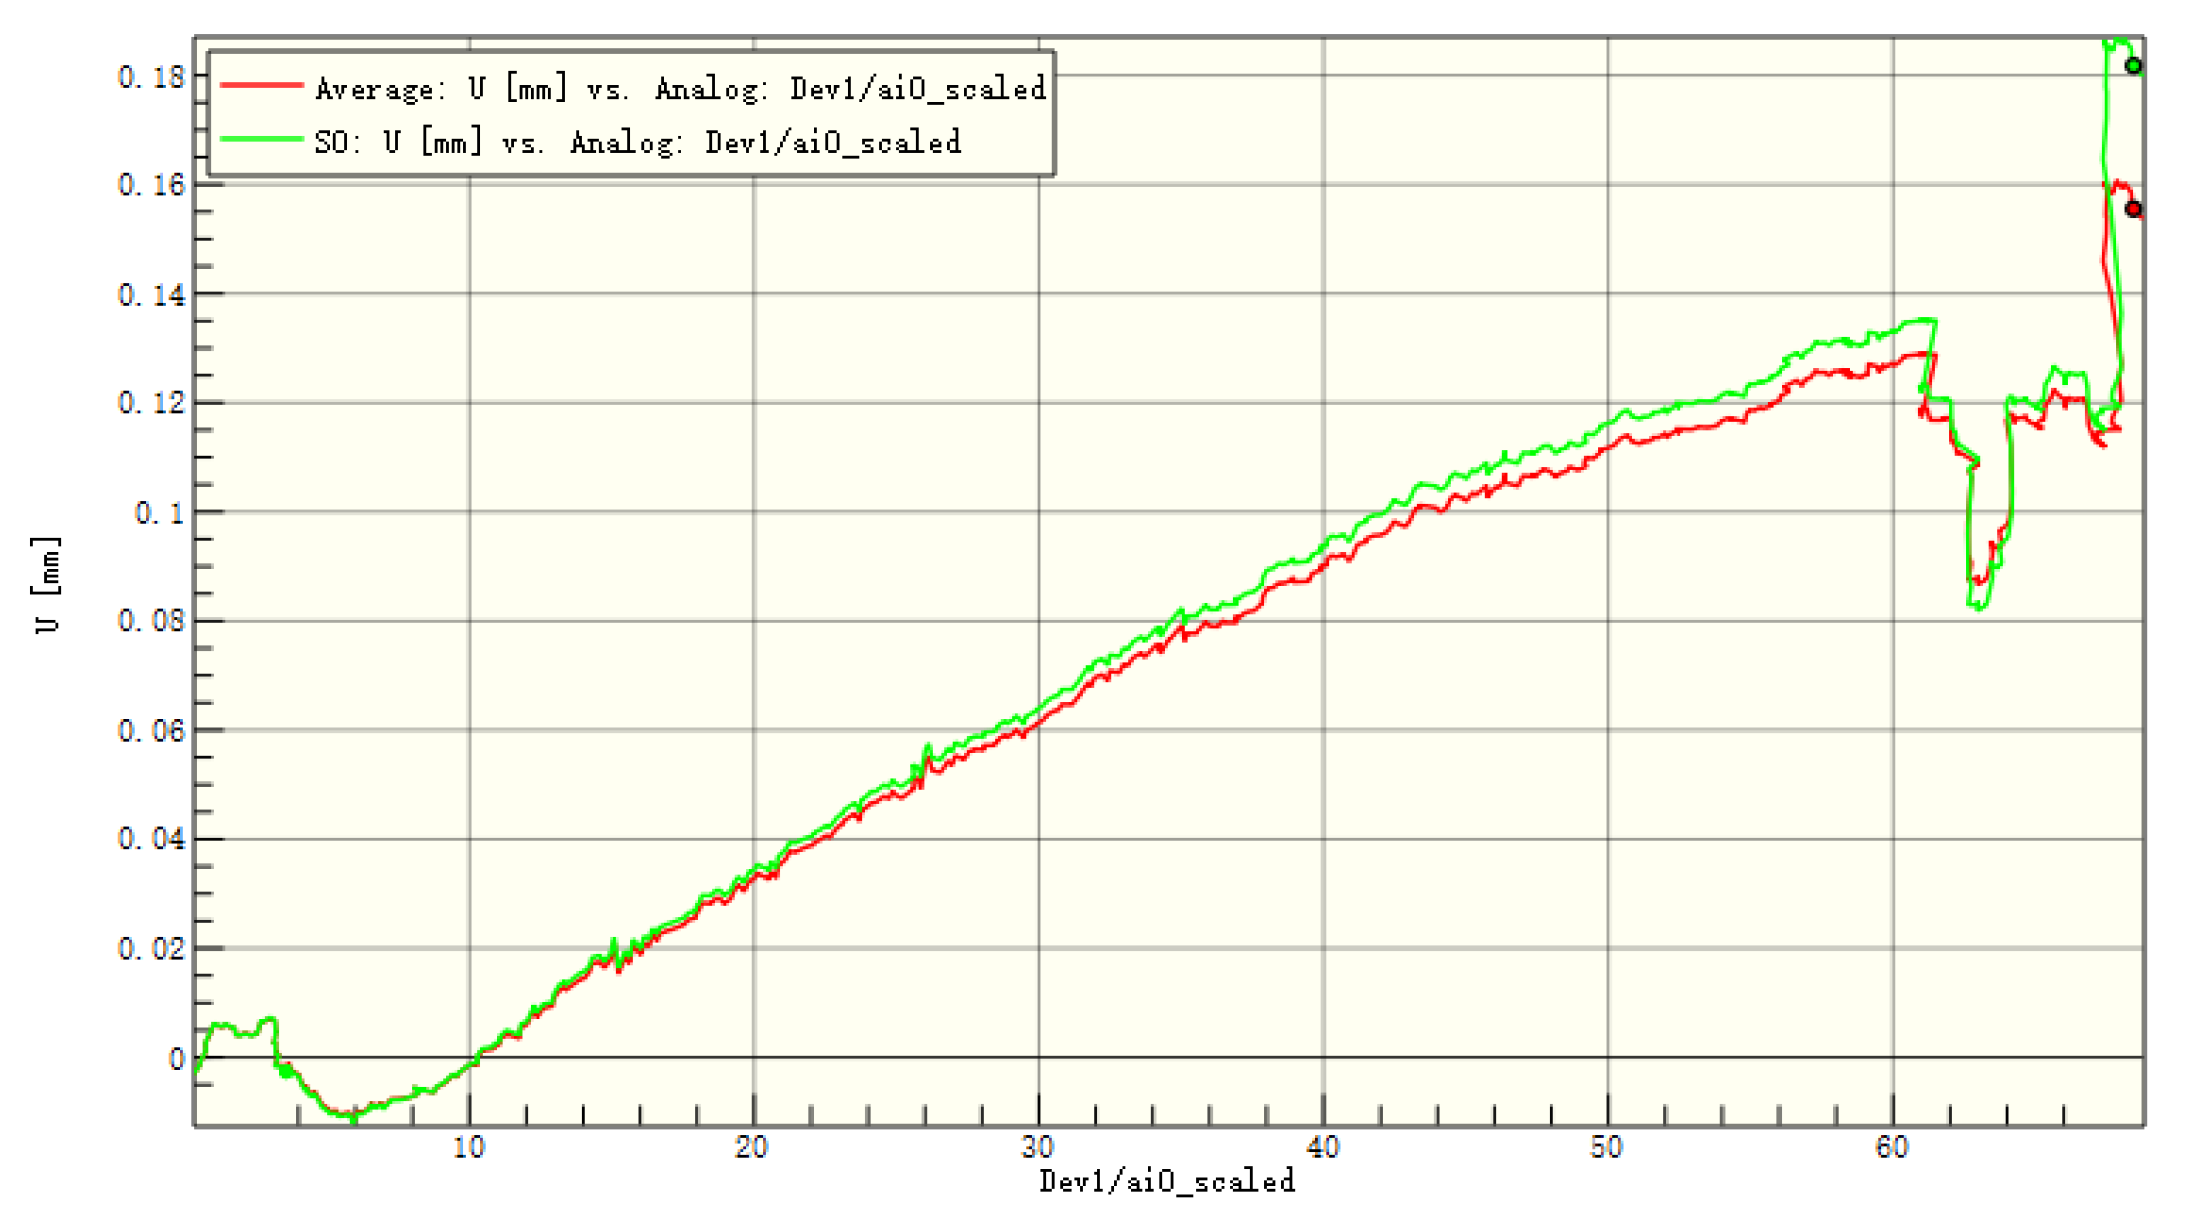
Applsci 14 04397 g016
Figure 17. Average displacement of the entire board and the patch in the z-direction of C1.
Applsci 14 04397 g017
Figure 18. Average displacement of the entire board and the patch in the x-direction of C2.
Applsci 14 04397 g018
Figure 19. Average displacement of the entire board and the patch in the y-direction of C2.
Applsci 14 04397 g019
Figure 20. Average displacement of the entire board and the patch in the z-direction of C2.
Applsci 14 04397 g020
Figure 21. Average displacement of the entire board and the patch in the x-direction of C3.
Applsci 14 04397 g021
Figure 22. Average displacement of the entire board and the patch in the y-direction of C3.
Applsci 14 04397 g022
Figure 23. Average displacement of the entire board and the patch in the z-direction of C3.
Applsci 14 04397 g023
Figure 24. Average displacement of the entire board and the patch in the x-direction of C4.
Applsci 14 04397 g024
Figure 25. Average displacement of the entire board and the patch in the y-direction of C4.
Applsci 14 04397 g025
Figure 26. Average displacement of the entire board and the patch in the z-direction of C4.
Applsci 14 04397 g026
Figure 27. Average displacement of the entire board and the patch in the x-direction of C5.
Applsci 14 04397 g027
Figure 28. Average displacement of the entire board and the patch in the y-direction of C5.
Applsci 14 04397 g028
Figure 29. Average displacement of the entire board and the patch in the z-direction of C5.
Applsci 14 04397 g029
Figure 30. Average displacement of the entire board and the patch in the x-direction of C6.
Applsci 14 04397 g030
Figure 31. Average displacement of the entire board and the patch in the y-direction of C6.
Applsci 14 04397 g031
Figure 32. Average displacement of the entire board and the patch in the z-direction of C6.
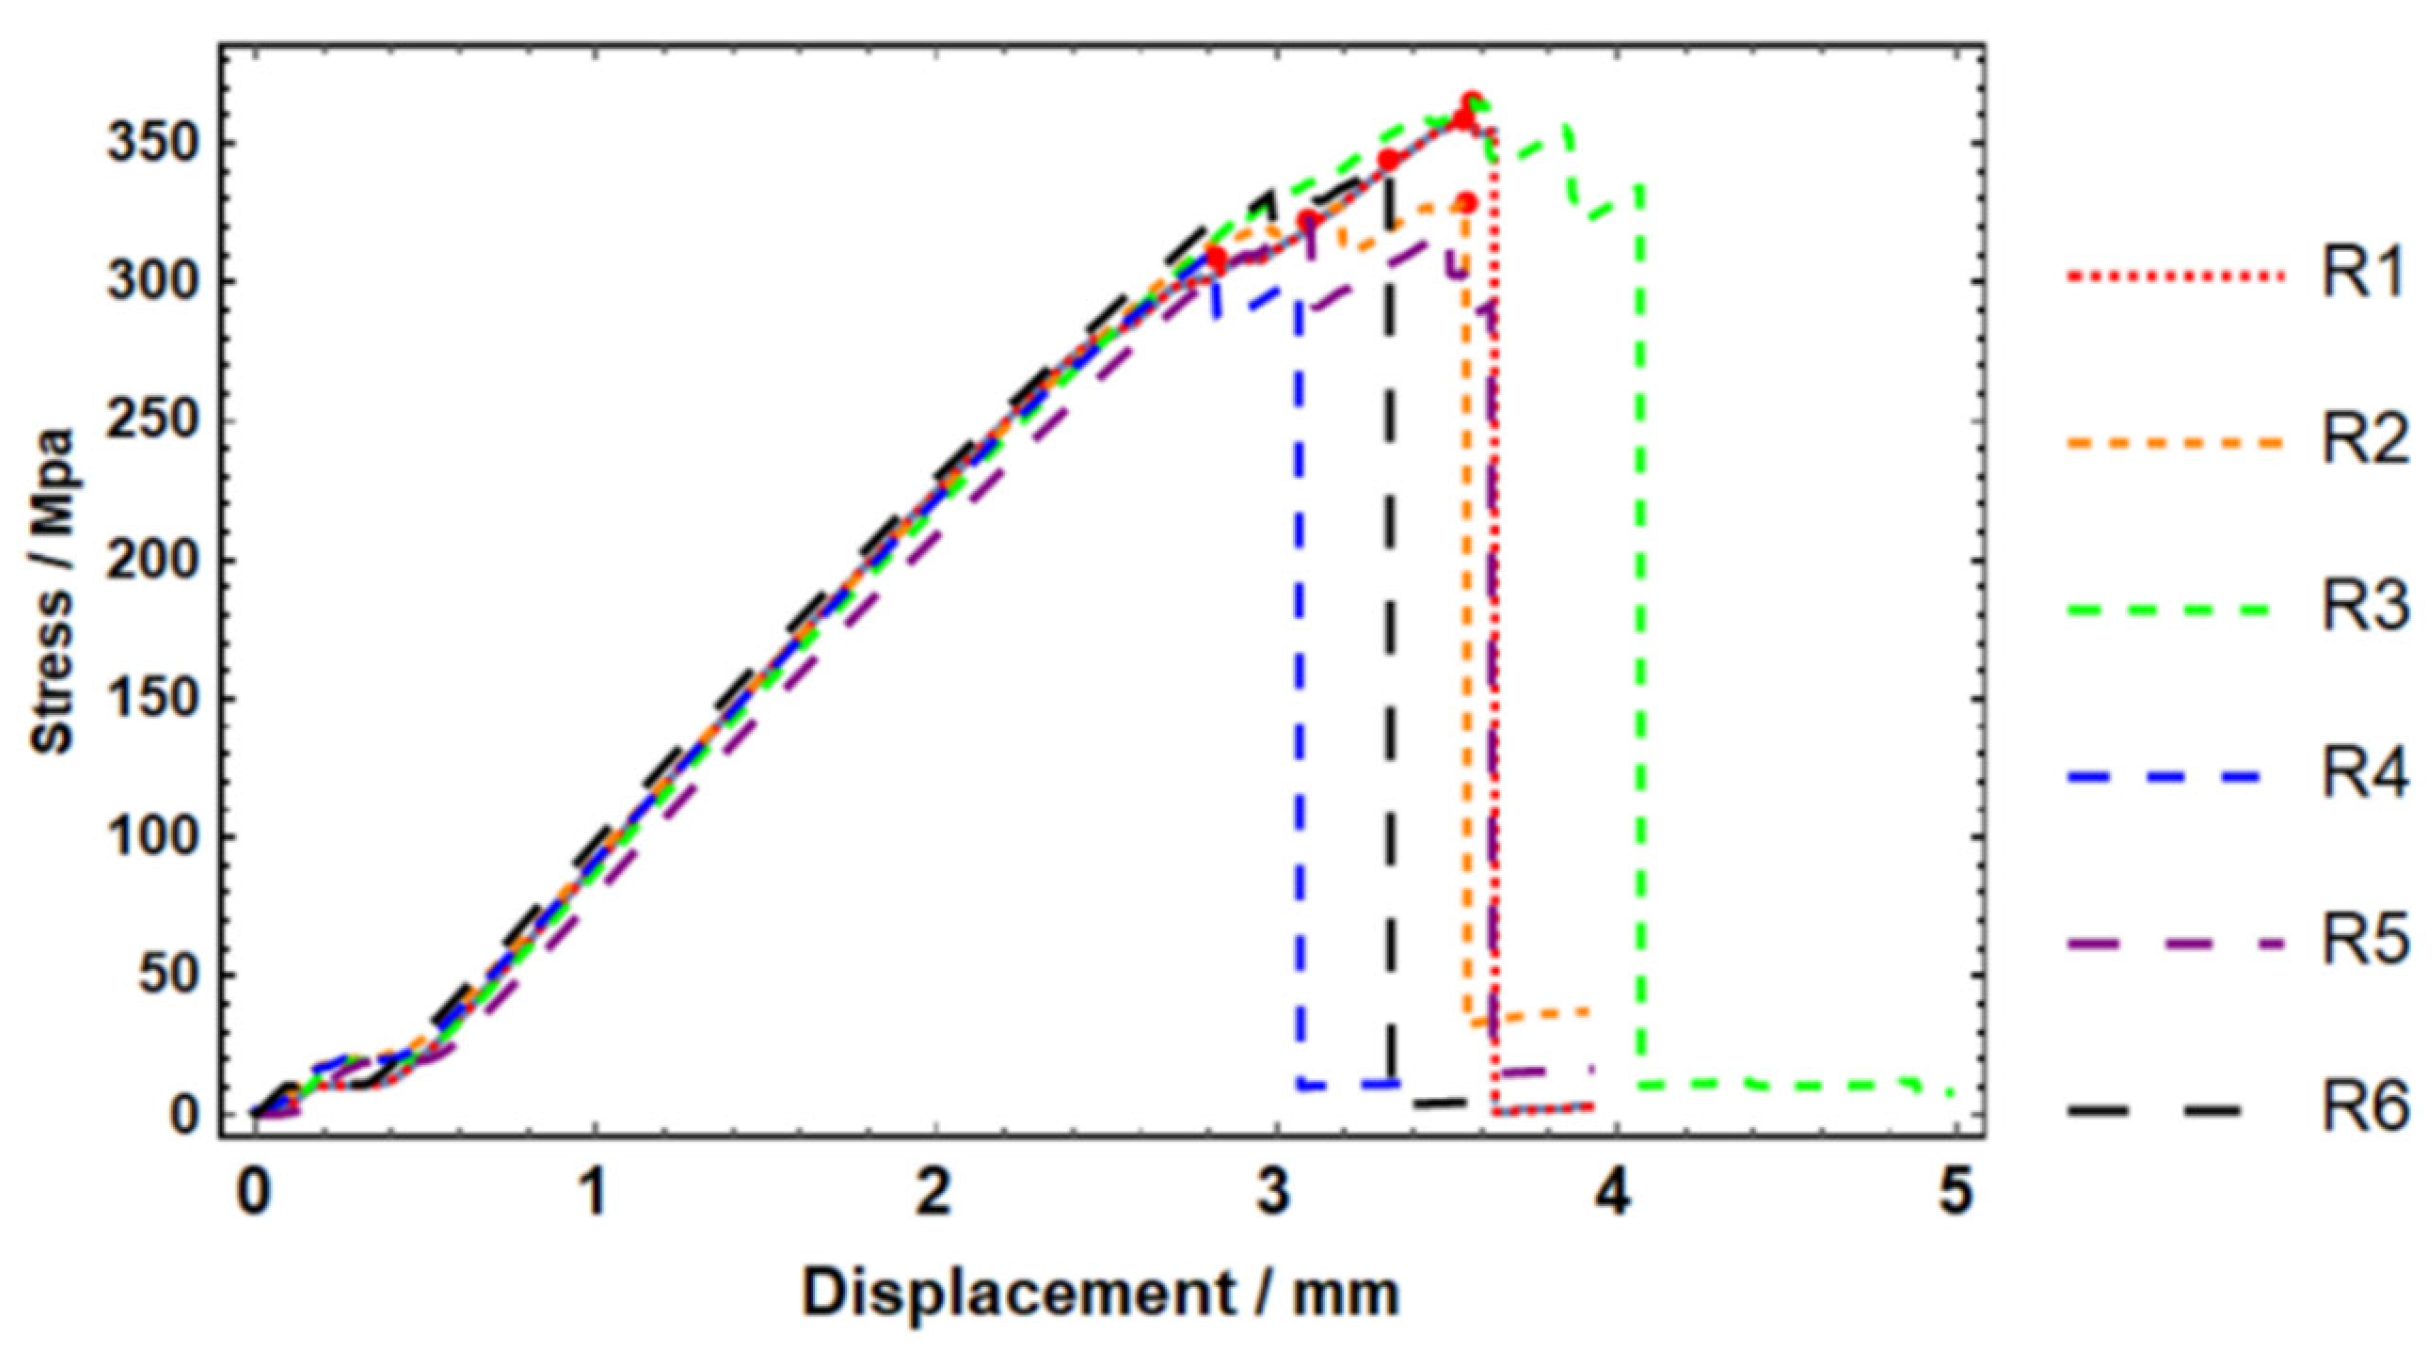
Applsci 14 04397 g032
Figure 33. Stress–displacement curve of rounded square patch specimens.
Applsci 14 04397 g033
Figure 34. Y-direction strain before fracture of the specimen with a square patch.
Applsci 14 04397 g034
Figure 35. Y-direction strain after fracturing of specimen with a square patch.
Applsci 14 04397 g035
Figure 36. The patch area (Black Rectangle) of the rectangle repaired plate for DIC test.
Applsci 14 04397 g036
Figure 37. Average displacement of the entire board and the patch in the x-direction of sample R1.
Applsci 14 04397 g037
Figure 38. Average displacement of the entire board and the patch in the y-direction of sample R1.
Applsci 14 04397 g038
Figure 39. Average displacement of the entire board and the patch in the z-direction of sample R1.
Applsci 14 04397 g039
Figure 40. Average displacement of the entire board and the patch in the x-direction of sample R2.
Applsci 14 04397 g040
Figure 41. Average displacement of the entire board and the patch in the y-direction of sample R2.
Applsci 14 04397 g041
Figure 42. Average displacement of the entire board and the patch in the z-direction of sample R2.
Applsci 14 04397 g042
Figure 43. Average displacement of the entire board and the patch in the x-direction of sample R3.
Applsci 14 04397 g043
Figure 44. Average displacement of the entire board and the patch in the y-direction of sample R3.
Applsci 14 04397 g044
Figure 45. Average displacement of the entire board and the patch in the z-direction of sample R3.
Applsci 14 04397 g045
Figure 46. Average displacement of the entire board and the patch in the x-direction of sample R5.
Applsci 14 04397 g046
Figure 47. Average displacement of the entire board and the patch in the y-direction of sample R5.
Applsci 14 04397 g047
Figure 48. Average displacement of the entire board and the patch in the z-direction of sample R5.
Applsci 14 04397 g048
Figure 49. Average displacement of the entire board and the patch in the x-direction of sample R6.
Applsci 14 04397 g049
Figure 50. Average displacement of the entire board and the patch in the y-direction of sample R6.
Applsci 14 04397 g050
Figure 51. Average displacement of the entire board and the patch in the z-direction of sample R6.
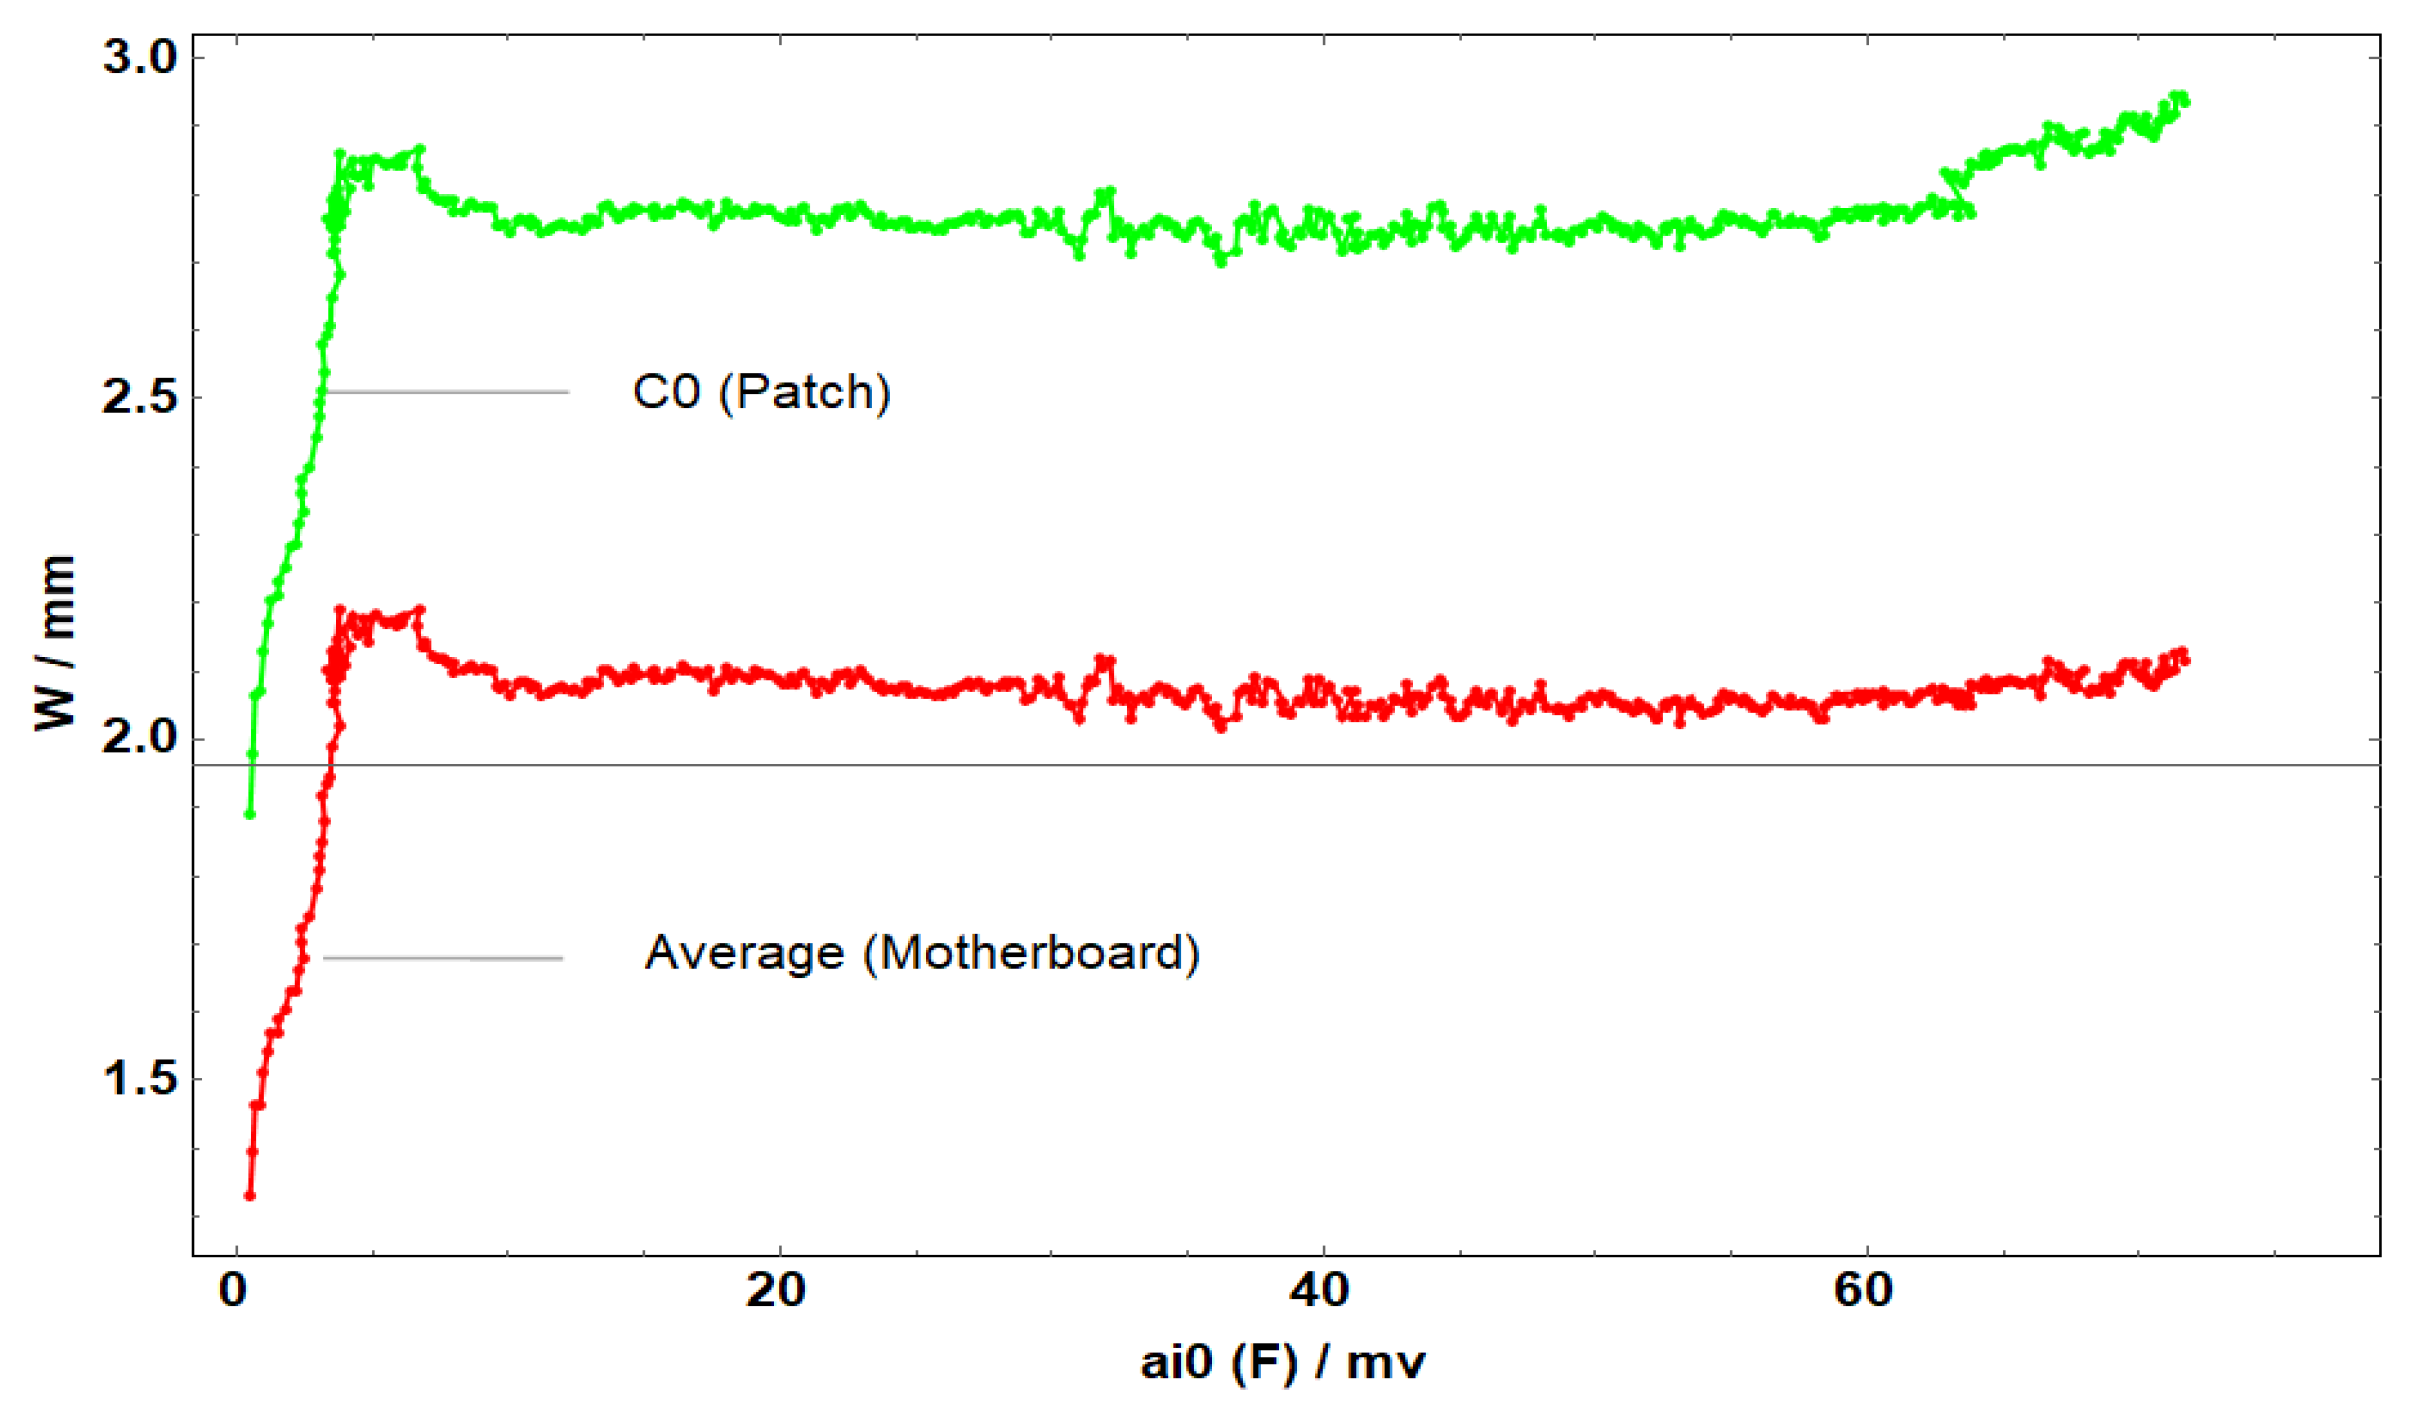
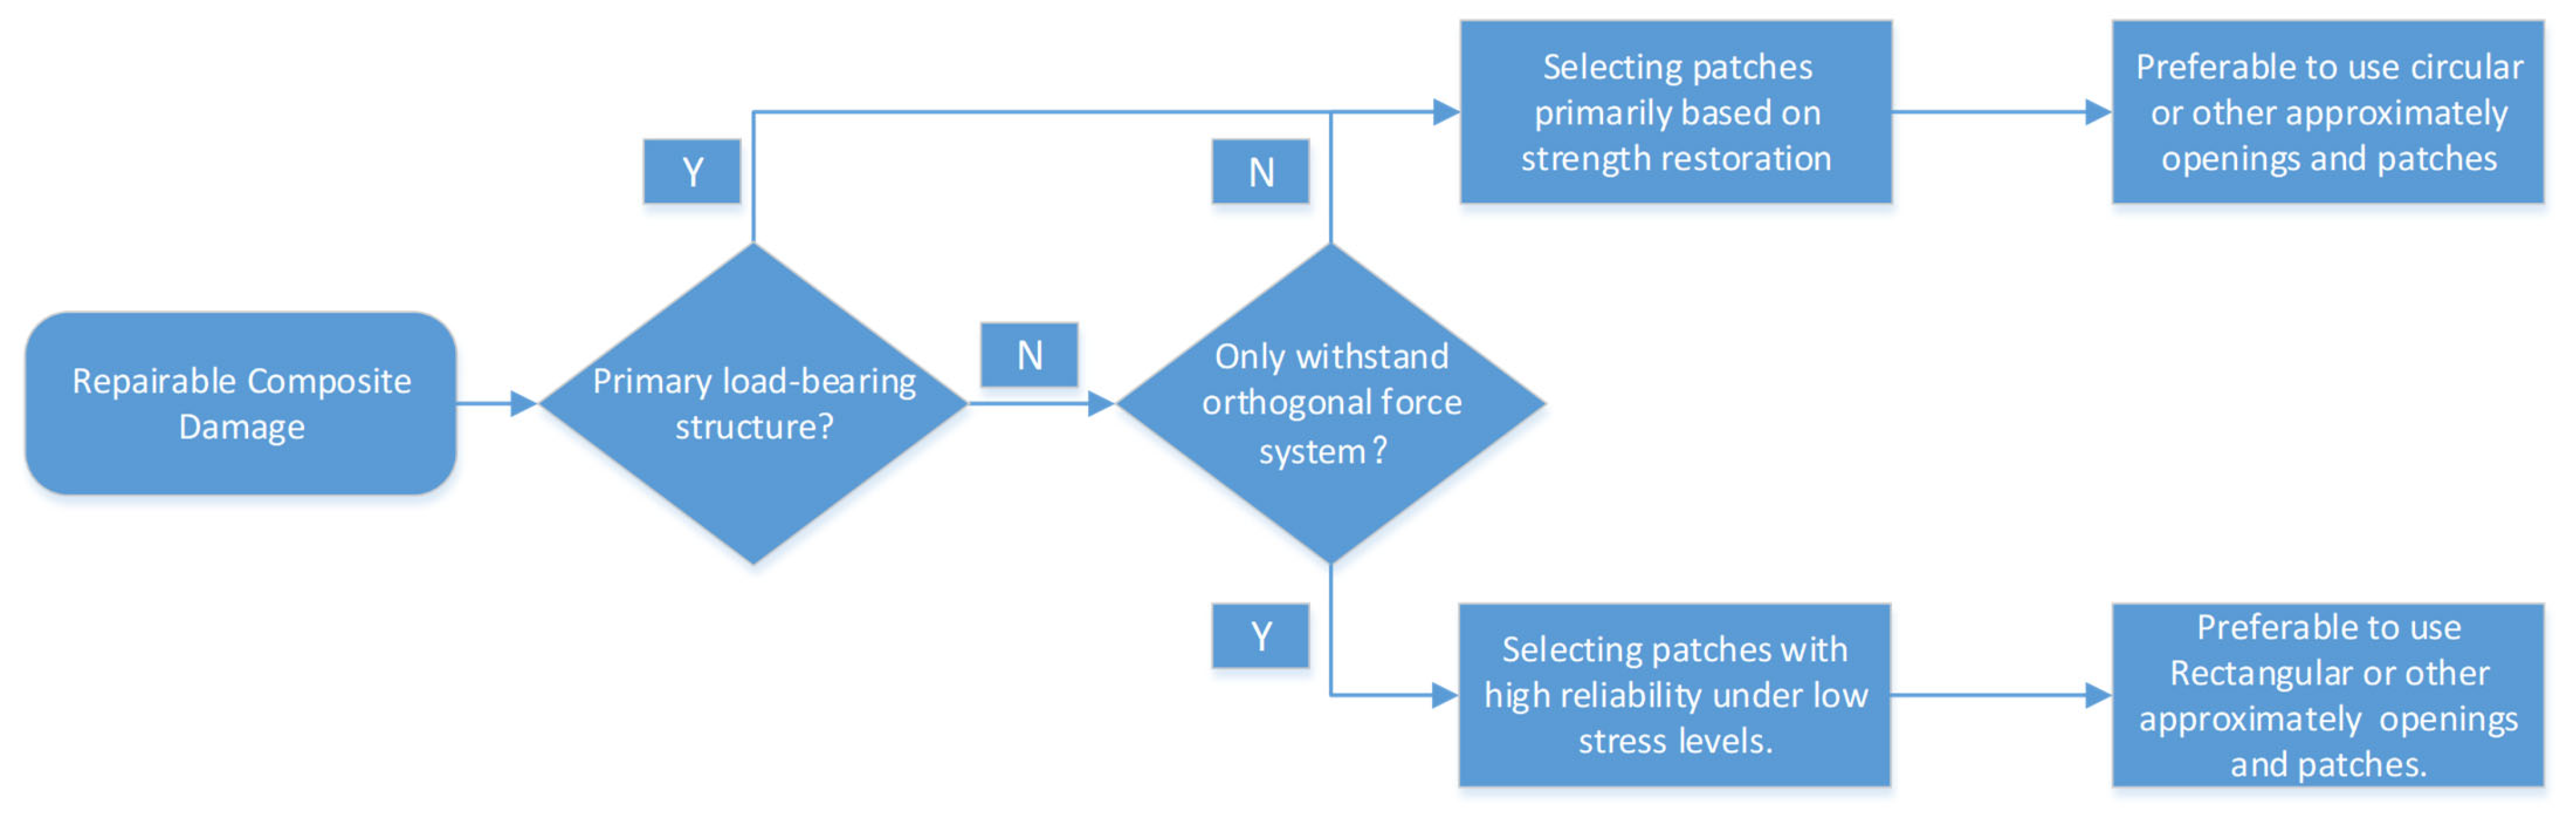
Applsci 14 04397 g051
Figure 52. The method for optimizing the selection of patch shape for composite material repairs is based on strength analysis.
Applsci 14 04397 g052
Table 1. Basic parameters of composite laminated plate.
NamePly DirectionSizeSingle-Layer ThicknessDensity
T300 Laminate[45°/0°/−45°/90°]s300 × 162 × 1.2 mm30.15 mm1.80 g/cm3
Table 2. Mechanical properties of composite single-layer plate.
E1/MPaE2 = E3/MPaG12 = G13/MPaG23/MPa μ 12 = μ 13
135,0008800550033080.33
Table 3. Failure strength of laminated composite plates.
Ft1/MPaFc1/MPaFt2/MPaFc2/MPa τ  max/MPa
1548122655.523289.9
Table 4. E51 epoxy resin mixing ratio.
NameEpoxyCuring Agent
Percent/%8020
Table 5. Material parameters of circular patches obtained from tensile test/MPa.
ParametersElastic ModulusUltimate Failure Strength
Specimens
C113,260388.653
C211,922379.611
C314,095436.874
C411,244386.238
C511,500381.897
C610,185452.596
Average12,034404.311
Table 6. Material parameters of square patches obtained from tensile test/MPa.
ParametersElastic ModulusUltimate Failure Strength
Specimens
R111,677358.716
R211,973329.284
R311,377365.397
R411,692309.524
R510,517322.321
R613,438344.195
Average11,779338.239
Table 7. Material parameters of circular patches obtained from tensile test/MPa.
ParametersElastic ModulusUltimate Failure Strength
Specimens
Circular Patch Specimens12,034404.311
Square Patch Specimens11,779338.239
Disclaimer/Publisher’s Note: The statements, opinions and data contained in all publications are solely those of the individual author(s) and contributor(s) and not of MDPI and/or the editor(s). MDPI and/or the editor(s) disclaim responsibility for any injury to people or property resulting from any ideas, methods, instructions or products referred to in the content.

