1. Introduction
1.1. Background
The last few decades show clearer than ever the impact of technology development and industrialization on the environment, leading to significant climate change that impacts industries such as agriculture, insurance, or the food industry. These effects have urged the majority of governments and international organizations to take action and implement direct measures that aim to mitigate the impact on the environment and quality of life. Sustainability, carbon neutral processes, and alternative energy sources are key references when discussing steps to be taken in any industry in order to align with the main scope of fixing the causes of environmental destruction and degradation.
In the transportation industry, the main applicable cause is carbon pollution, mainly coming from burning fossil fuels for the benefit of powering plants, mines, and adjacent manufacturing processes, as well as using non-renewable sources (e.g., coal, natural gas, and crude oil) to run the internal combustion engines in vehicles and aircraft [
1].
As a direction of regulation and development in the industry, utilizing sustainable energy sources and processes leads to the electrification of powertrains, along with the development of new carbon neutral combustible fuels [
2]. As electrical energy can be obtained from renewable sources, such as solar, wind, or water, and existing battery technologies and electric motor components enable easier implementation in commercial and passenger vehicles, an increasing number of solutions is coming to the market [
3]. The electric vehicle market grows rapidly year by year, supported by new legislation that leads manufacturers away from internal combustion engines that run on conventional fuels [
4]. Studies show that battery electric vehicles (BEVs) have a lower impact on greenhouse gas emissions (GHG) compared to internal combustion engine vehicles (ICEVs) while performing a well-to-wheel analysis. Depending on the source of electrical energy in each country, as analyzed by M. De Santis et. al. in 2022 [
5]. In rural areas, where there are low-voltage electrical energy distribution systems, the application of renewable energy sources offsets the GHG emissions of electric vehicles in comparison to vehicles with conventional powertrains. In these cases, the pollutant emissions of EVs would otherwise exceed those of ICEVs [
6].
Leading the global trends of electrification and optimization of the transportation area, European authorities represent one of the main forces that implement strict regulations in a timely manner, exploring all viable solutions and addressing all points in which the impact on the environment is felt by humanity. In regard to transportation solutions for cargo and passengers, the electrification approach seems to be one of the preferred alternatives to internal combustion [
7]. In mass passenger transport, the last two decades have brought a variety of vehicles, such as buses, shuttles, and cabs, consisting of battery electric vehicles (BEVs) and fuel cell electric vehicles (FCEVs) [
8].
For some applications that are not yet compatible with fully electric or fuel cell technologies, due to their drawbacks (e.g., accessibility, effective range, or cost), the approach is to look into hybridization of the powertrains and slowly move away from the dependency on conventional fuels [
9,
10]. Significant research and innovation efforts are made in fuel cell technology, addressing energy management strategies (EMS), such as the recent work of C. Jia et al., which utilizes deep reinforcement learning (DRL) to propose a health-conscious approach [
11]. By tackling fuel cell-specific drawbacks and challenges, C. Jia et al. propose a prediction model for the degradation of proton exchange membrane fuel cells (PEMFCs), fusing bi-directional long short-term memory (BiLSTM) networks, and multi-head self-attention (MHSA) mechanisms [
12].
Electrification of a powertrain does not represent a complete solution against pollution, as any type of energy consumption needs to be reduced [
13]. Optimization of every process is crucial to the overall environmental impact of an industry and its systems, so now more than ever, information technology is used in every industry to rethink the common way of approaching tasks and delivering what is expected. Looking into the public transport sector as a reference, advanced fleet management systems are evolving, using optimization algorithms and artificial intelligence to obtain the most energy-efficient and cost-effective solutions [
14].
Smart systems that use state-of-the-art technologies require smart components to match their functions. In the context of transportation, these components are people- or cargo-carrying vehicles. As a basic requirement for these vehicles to function together, it is a fact that they need to be interconnected. This concept brings to light the idea of connected vehicles [
15].
Focusing on a safer travel environment, optimized systems, and advanced road networks, the implementation of autonomous vehicles (AVs) becomes more of a must than a good-to-have feature, as human error is taken out of the equation, as well as eliminating dangerous and repetitive jobs that affect human health in the long term. Autonomous driving technology has advanced exponentially lately, as major manufacturers have joined the trend and already offer publicly various levels of autonomous vehicles for commercial and personal use. Growing into a mainstream technology is an especially crucial step for future proofing a concept and expanding its applications in various domains of activity [
16].
1.2. Literature Review
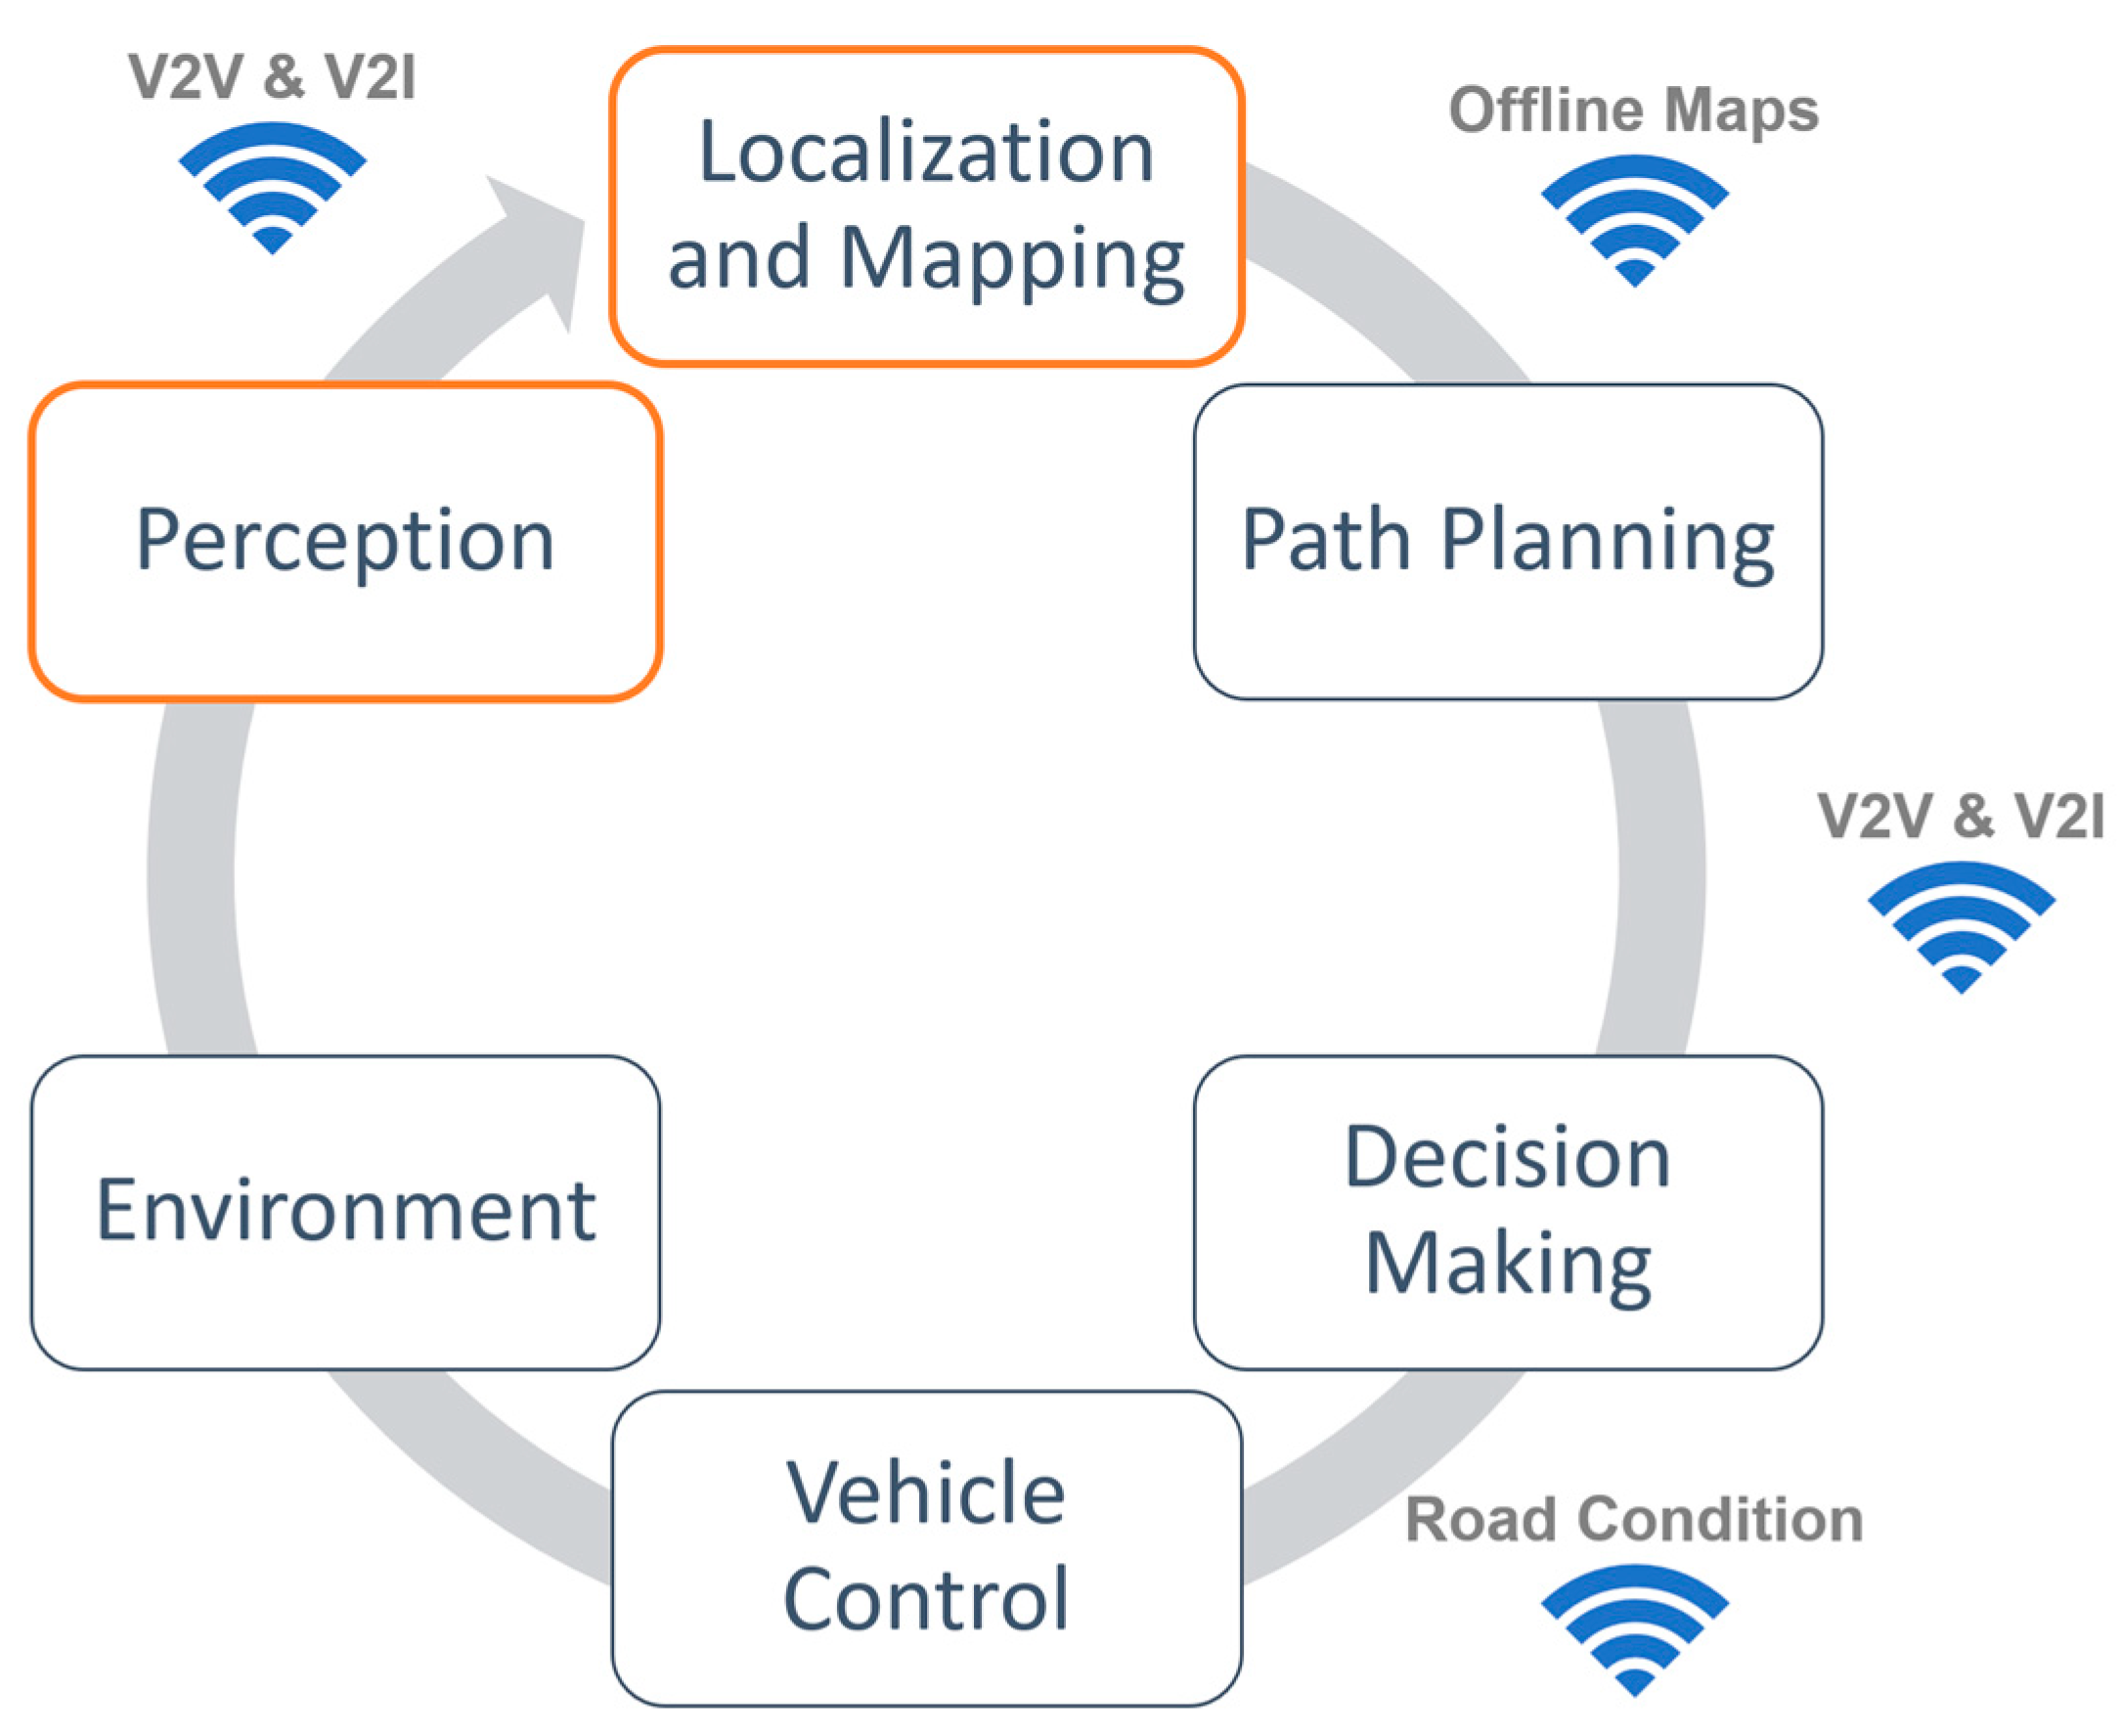
In the direction of autonomous driving, the connection between vehicles has been proven to be of significant importance, allowing faster improvements and refinements, such as road mapping, traffic management, and reducing the number of accidents due to human errors. Localization and mapping of road networks are continuously evolving, starting with indoor mapping, which is usually applicable to mobile robot scenarios. The current progress brings us to advanced, dynamic mapping of roads, which is performed during standard vehicle utilization. In this case, two methods are applied to obtain a more efficient way of locating the vehicle in a certain environment and map specific characteristics of that environment in order to construct a complex model through which an AV is navigating. The first method implies using a detailed, already created map and do all the necessary computations for localization during autonomous driving. The second approach is more similar to humans’ way of driving a vehicle by selectively mapping spots or areas, as described by J. Van Brummelen [
17]. This is shown in
Figure 1.
Applications of AVs are increasingly common in the passenger transport area, as autonomous buses, shuttles, or even taxis can be observed inside airports or other controlled environments, but also on the public roads, where public transport is revolutionized by self-driving solutions that ensure a safer, non-stop alternative to personal transport.
Surprisingly, investments and interest in such advanced technologies are not shown only by private companies, which use autonomous options to carry their employees inside technology or industrial parks or to and from work. Various state-owned companies and municipalities have been pioneering these solutions to some extent by implementing special routes of transportation in controlled environments, such as closed communities, and even on open roads, connecting main access hubs into the cities (e.g., airports, train stations, bus terminals) with points of interest (e.g., city centers, public venues). Some of the most common applications aim to connect the venues or access points that operate around the clock and provide constant transit for people.
Notable applications are found worldwide, showing various important manufacturers linking with private or public entities in multiple projects, such as:
MAN and Mobileye (an Intel-owned company)—development of autonomous buses in the context of the MINGA research project in Munich [
18];
ZF—investments and partnerships aimed at pushing autonomous shuttles into the market [
19];
Navya and Yutong—access to subsidies used mainly for projects linked to the government’s “France Relance” program, as well as receiving a Red Dot Award in 2021 [
20];
Volvo and Keolis—bringing the concept of a 7900 electric city bus to reality after publicly presenting the first self-driving bus in 2019, along with Nanyang Technological University (NTU) [
21];
Scania and Nobina—first implementation of autonomous buses on the streets of Stockholm, starting with two units, each having a driver onboard, responsible for monitoring the driving activity [
22];
Scania and Haylion Technologies—jointly working on a sustainable transport system solution in the Chinese public transport area [
23];
ADL and Stagecoach—implementation of autonomous diesel buses on Scotland’s roads, financed by the UK government [
24];
Iveco and EasyMile—development of autonomous systems that can be added to buses so the vehicles can maneuver themselves inside depots, performing parking tasks to maximize available space, refuel, wash, and enter or exit the depot without human involvement [
25].
Most of the above-mentioned applications, as well as other similar ones, are intended to work as a fleet of vehicles, communicating with one another and ensuring the completion of tasks such as running a scheduled people transport service or even on-demand transfers. As these solutions are developed from the ground up with the purpose of working in a fleet, some key characteristics are implemented in the preliminary stages of production, such as the fact that future changes to tasks or upgrades to the software or hardware are easily scalable.
Taking advantage of these quickly evolving units, the basic way a fleet is conceived and can complete simple or complex tasks can be upgraded. By optimizing the operating mode of a fleet, some basic definitions of a people carrier come into focus, and a few minor changes in the way we look at a vehicle can impact the final outcome of the optimization process.
Tracing back the previously mentioned trends, starting with self-driving vehicles and reaching interconnected vehicles, the concept of connected autonomous vehicles (CAVs) is further expanded to Modular Autonomous Vehicles (MAVs). This type of machine is referring to relatively small units (i.e., not as large as a full-size bus) with a small capacity of up to twenty passengers that connect physically to one another by hitch mechanisms or other viable solutions, allowing them to attach or detach themselves and form a train of vehicles. This system allows every unit to act independently, lead a road train ensemble, or function as a wagon and be led by others.
Benefiting from this function, it is possible to dynamically change the capacity of an ensemble having the task to ensure transportation on a predefined route, based on current demand or even on predicted requests, by looking at gathered data over time, traffic situations, and current events, such as public gatherings (e.g., concerts, festivals, sports events, etc.) or expected incoming people flow (e.g., arrival flights, arrival train or bus rides, etc.) [
26].
1.3. Objective and Contributions
This paper showcases the first steps of the authors’ research work on CAVs and MAVs in the context of the hOListic Green Airport (OLGA) research project. The aim of implementing CAVs and MAVs into the existing public transport infrastructure adds to the main focus of improving energy efficiency in and around the airport’s activities and reducing pollutant emissions per capita, to and from the airport.
Compared to existing literature and available urban mobility solutions, a Mobility-as-a-Service (MaaS) solution for the International Airport is proposed—correlating air transport with landside transport for a last-mile travel solution during nighttime. In this time frame, the traffic is considerably lower, and travel requests are neither constant nor exceedingly high. By analyzing the energy efficiency differences between MAVs and BEBs, the current study lays the foundation of the MaaS proposal, which is part of an intermodality concept in urban transportation of passengers and goods, combining multiple transport modes from urban area entry points (i.e., airports, train stations, factories, warehouses, etc.) to last-mile solutions.
This initial solution is conceived around the particular case of Cluj-Napoca, Romania (a city located in valleys and on hills with approximately 300,000 inhabitants in the urban area, over 400,000 people living in the metropolitan area, and an international airport inside the urban area). In future advancements, the proposed solution will be developed to fit the needs of similar locations, with airports located inside or in the close vicinity of the urban area, where public transport routes are linking interest points of the urban area (e.g., city center, commercial centers, residential areas, etc.).
As a primary point of evaluation, the simulations presented in this paper aim to identify the benefits of a MAV setup on energy consumption, when compared to the existing urban mobility solution containing battery electric buses. As the MAV solution is not yet implemented on-site, the weight distribution is studied in order to determine the most efficient configuration of MAV for this particular case.
2. Materials and Methods
2.1. Concept Definition and Simulation
The objective of this analysis is to evaluate the energy efficiency patterns of a Modular Autonomous Vehicle alternative for urban mobility in an existing transport network. The primary analyzed metrics refers to the evolution of energy consumption over separate transport routes and their respective impacts on the overall efficiency of a fleet. The main results presented in this paper will highlight the benefits to energy efficiency of a modular vehicle concept while acting as a foundation for future studies regarding the overall operational costs and environmental impact of such fleets in urban areas.
To identify the advantages of using Modular Autonomous Vehicles in a public transport scenario, the IPG CarMaker simulation software, developed by IPG Automotive GmbH, is used to simulate energy consumption on public routes for an autonomous bus and a modular alternative based on shuttles similar to the EasyMile EZ10 product.
The CarMaker software provides support for developing and testing automobiles and light-duty vehicles, offering solutions that also fit AVs. It is an open platform that allows integration into other software solutions, such as the MATLAB R2023b environment, a graphical-based programming environment developed by MathWorks. Due to the possibility of integrating simulated models and scenarios into advanced tools such as MATLAB, the IPG CarMaker 12.0.1 choice is easily motivated for this initial analysis on the integration of MAVs into the public transport network. Further development on the following models and scenarios allows for a deeper understanding of the impact of MAVs on specific routes and can help identify the necessity or viability of such applications for each urban network in particular.
With the scope of identifying the energy consumption benefits of using MAVs in a fleet, the first step implies the modeling of a full-size electric bus and a road train formed by multiple modules (individual autonomous vehicles that are interconnected). For this, a battery electric bus is modeled in another IPG solution, TruckMaker, using technical data from Solaris Bus & Coach sp. z o.o. company, Bolechowo-Osiedle, Poland. The model Urbino 12 Electric is the current battery electric bus model used by the Cluj-Napoca Municipality for public transportation. The technical specifications of this bus are presented in
Table 1.
To come across the software limitations and reduced possibility of configuration in CarMaker, the starting step of modeling implies the definition of a single module, referencing data gathered from current BEVs available in Cluj-Napoca and electric autonomous shuttle solutions existing on the market, such as EasyMile EZ10 [
27]. It is considered that a driverless shuttle such as the one marketed by EasyMile, which is also already in public and private use in multiple locations and scenarios, is the most similar vehicle on the market to a module that can be used in a road train [
28].
Table 1.
Technical characteristics of the Solaris Urbino 12 Electric [
29,
30].
Table 1.
Technical characteristics of the Solaris Urbino 12 Electric [
29,
30].
| Specification Type | Value |
|---|
| Length | 12,000 mm |
| Width | 2550 mm |
| Height | 3300 mm |
| Weight | 13,790 kg |
| Maximum authorized weight | 18,000 kg |
| Frontal area | 1.97 m2 |
| Number of seats | 26 |
| Passenger capacity | 60 |
| Drive axle | 2 × ZF AVE 130 |
| Maximum motor power | 2 × 160 kW |
| Maximum torque | 1450 Nm |
| Battery type | Li-Ion |
| Battery power | 350 kW |
| Battery capacity | 210 kWh |
| Battery voltage | 687 V |
| Suspension type | ZF independent suspension |
| Suspension system | ECAS air suspension with leveling and kneeling functions |
Table 2 shows the configuration defined in CarMaker for one module, considering a maximum load of 900 kg, translating to a maximum capacity of twelve passengers.
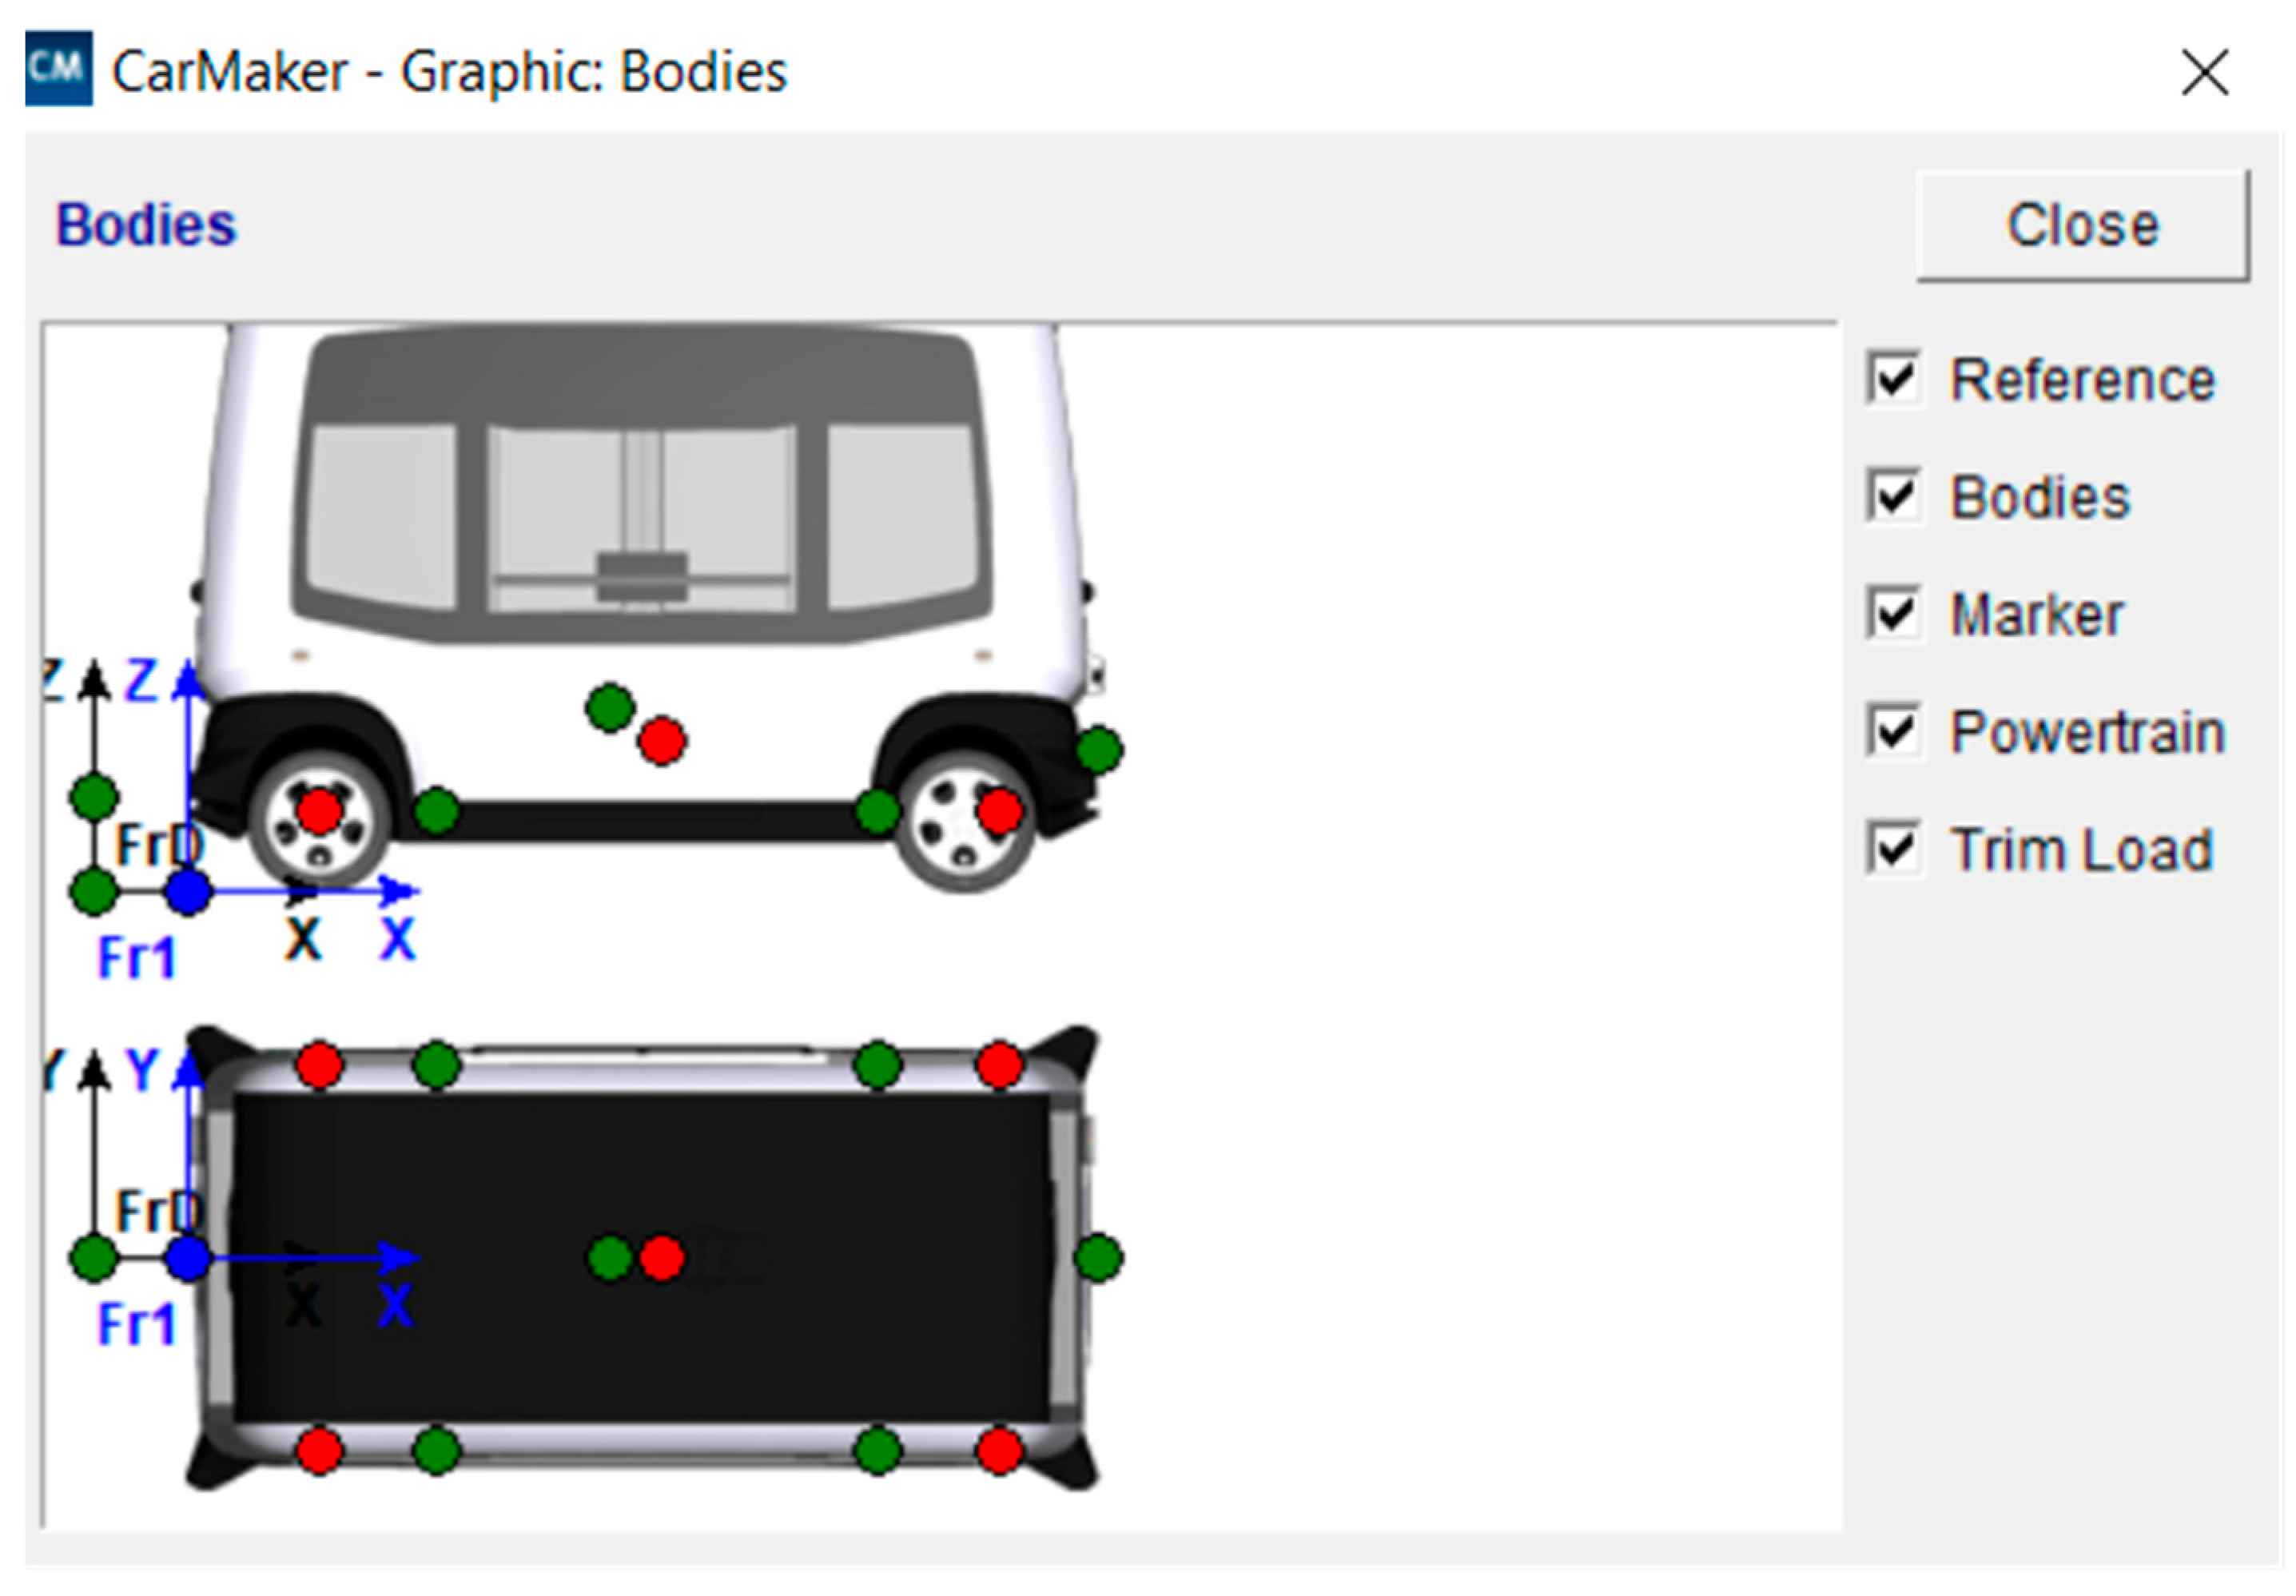
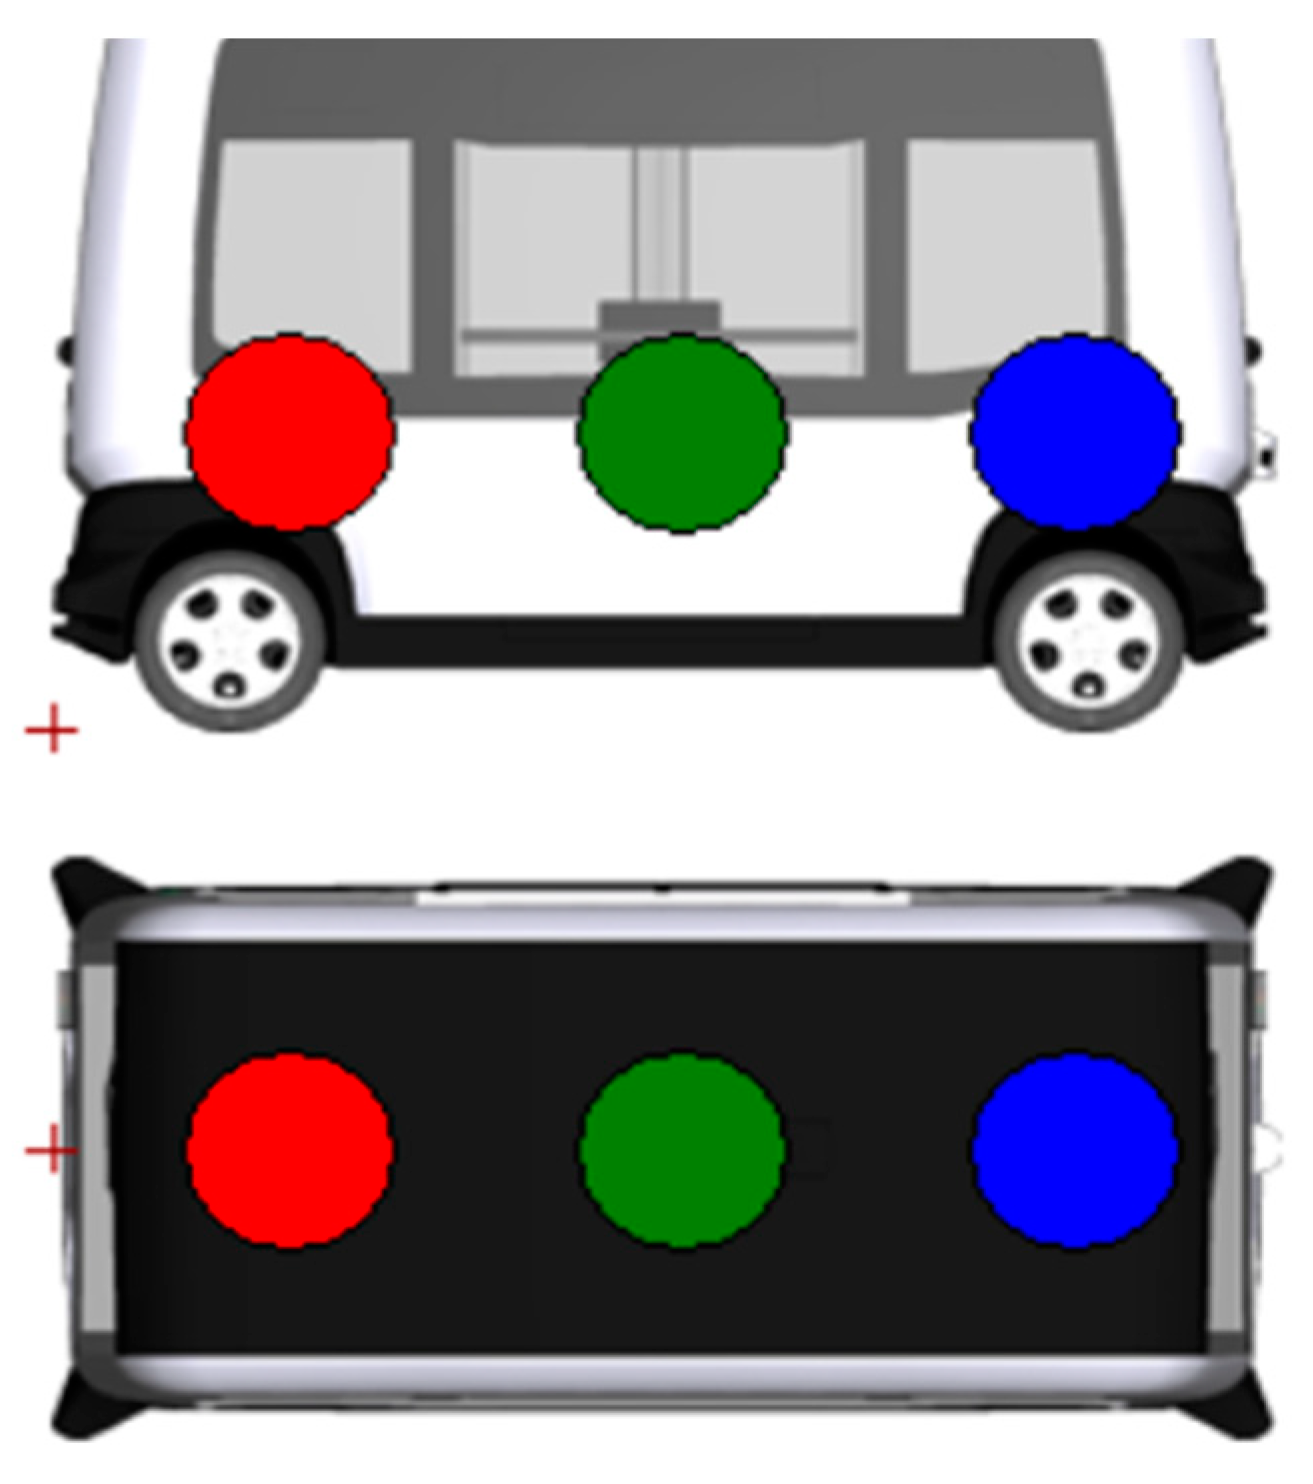
For visual representation of a module’s body in IPG CarMaker, a 3D model of EasyMile EZ10 is used, as pictured in
Figure 2 which contains reference points. The vehicle outer shell does not have any functional impact on the simulation, being strictly used for visual representation using add-ons such as IPG Movie or MovieNX to render the digitized route, vehicle model, and its actions, as well as the behavior of suspension components and surrounding traffic and road characteristics (e.g., road profile elevations, corners or roundabouts, pedestrian crossings, traffic lights, etc.). Reference points, bodies, markers, and powertrain location are also shown in the Figure, which impact weight distribution, maneuvering, and handling of the vehicle.
Following the definition of a single module, it is necessary to define a road train formed by two and four vehicles, which are used in the simulation for different sectors of the route. Also, the definition of a full-size bus is considered to be close to a road train of four autonomous modules. A four-module road train has a maximum passenger capacity of forty-eight people, while the electric bus has a maximum carrying capacity of sixty individuals.
Table 3 shows the configuration of two and four connected modules.
Having defined all the necessary models, the next step in the analysis is to determine the simulation scenarios to be run and routes to be referenced. In order to keep the analysis at a conceptual level, generic cases of public transport routes are taken, as follows:
Airport → City Center (AC);
City Center → Neighborhood (CN);
City Center → Central Train Station (CT).
Route characteristics are taken from Google Maps, using the city of Cluj-Napoca as a source. The routes used indicate all distances, turns, and elevations, combining all kinds of commonly encountered road elements such as climbs, descents, straights, and tight turns. Existing bus routes from Cluj-Napoca that mirror the above-mentioned trajectories are:
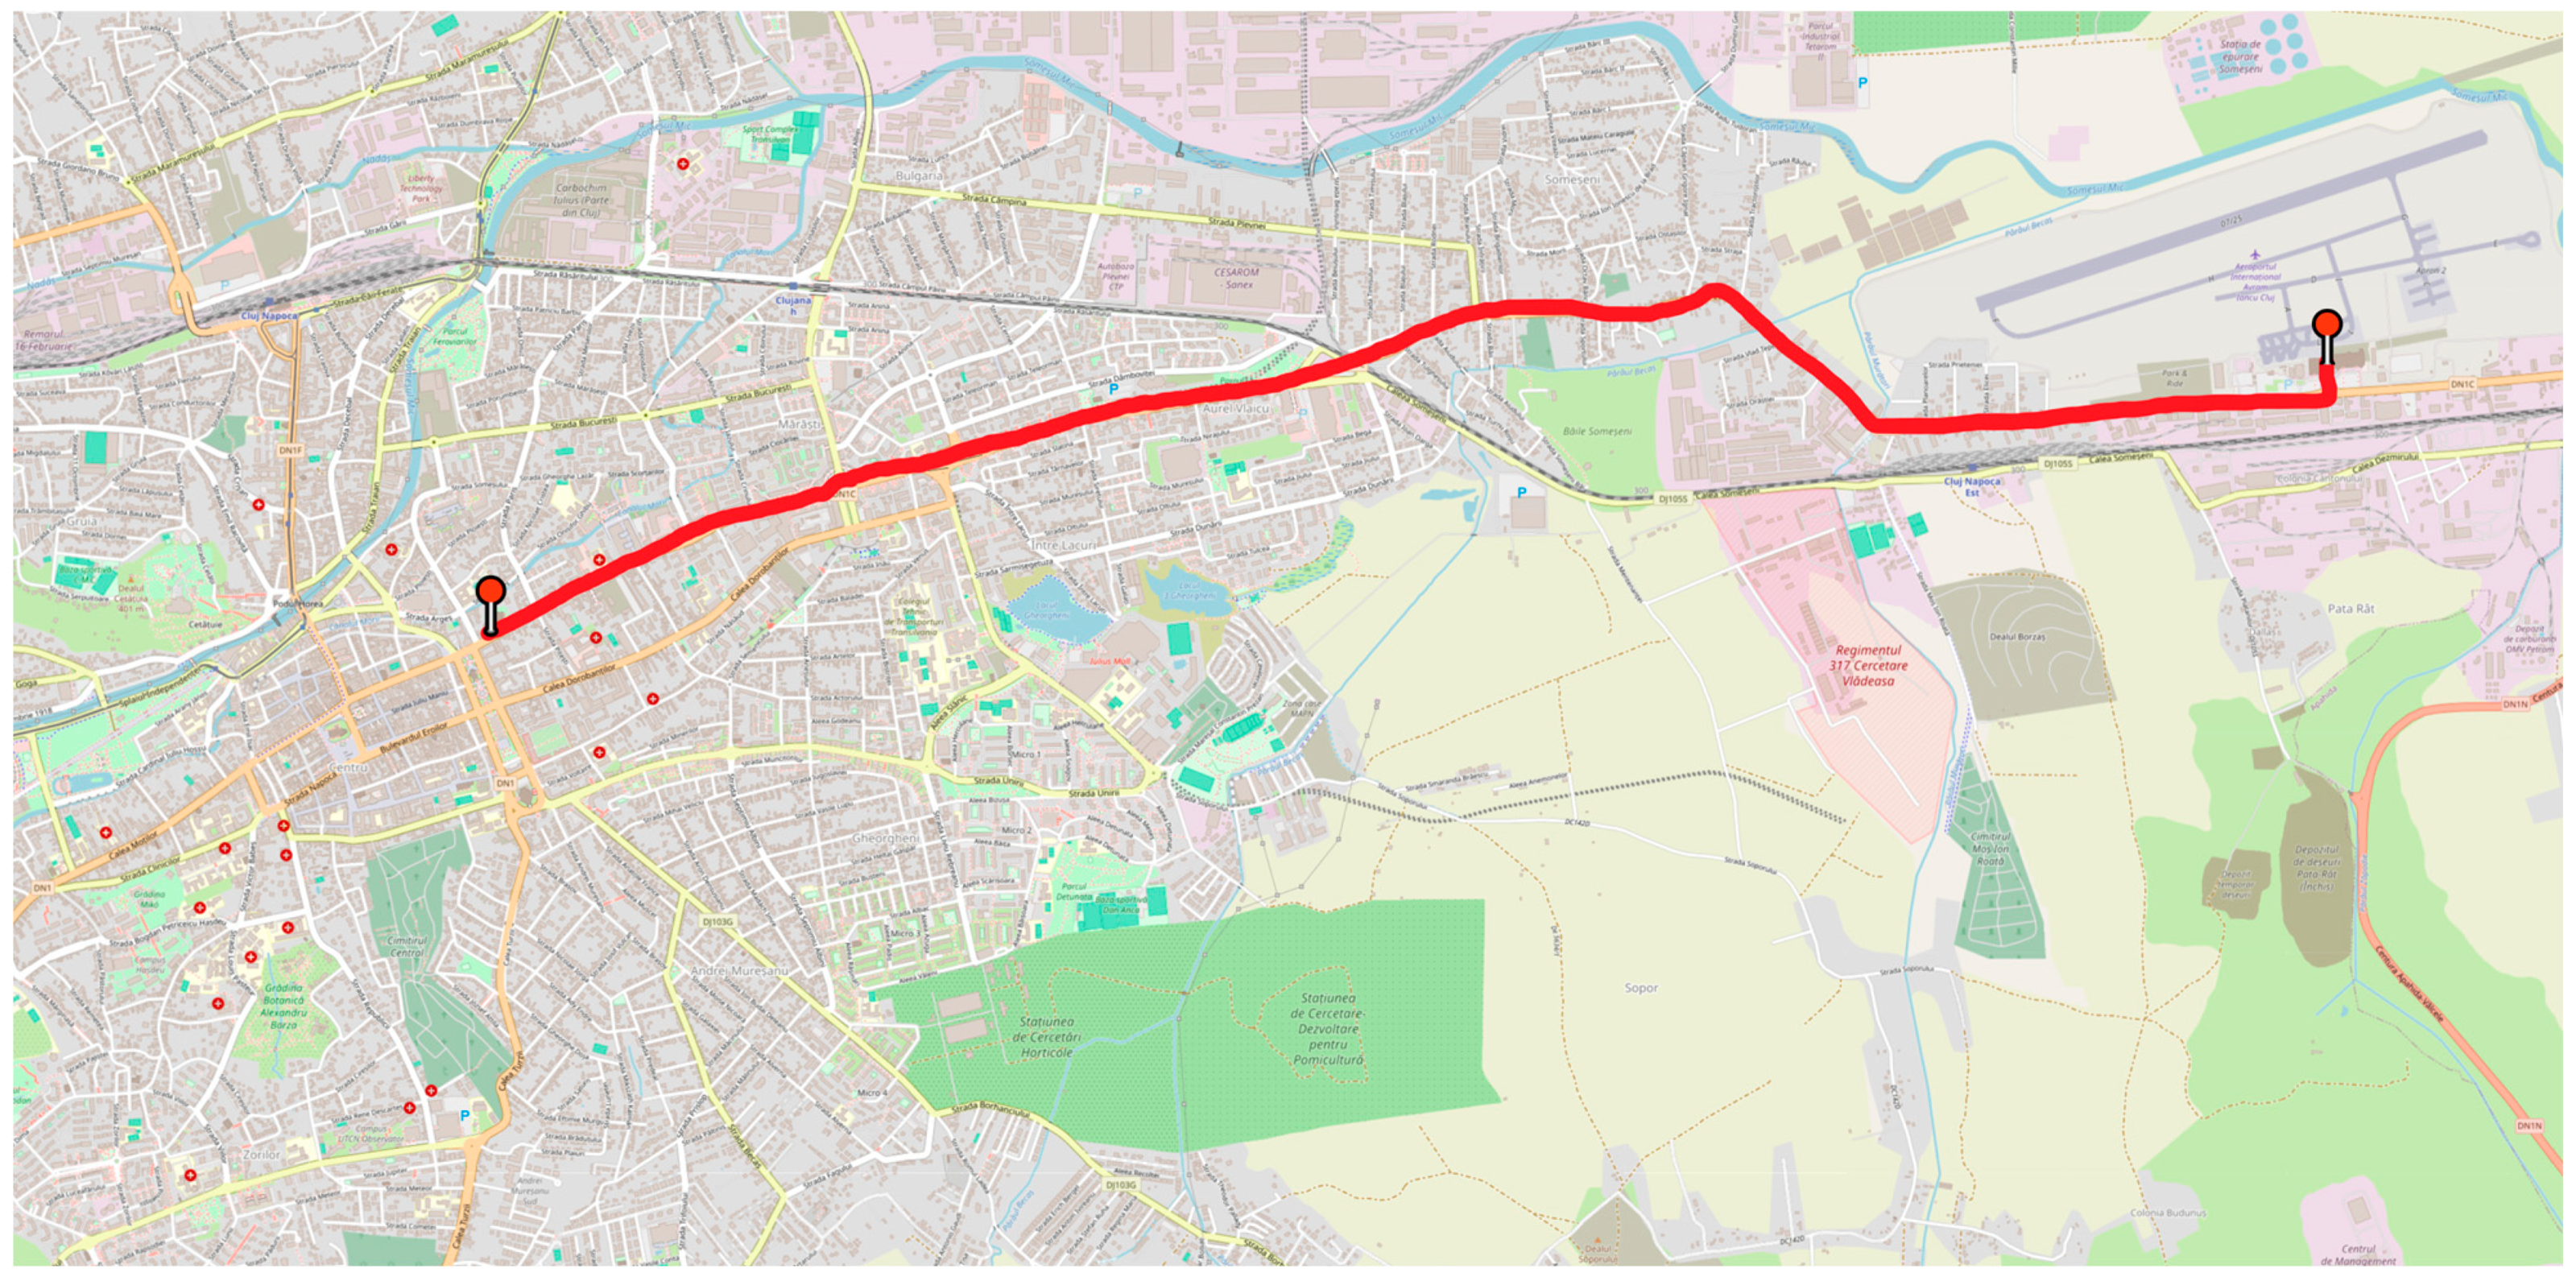
AC—Cluj “Avram Iancu” International Airport (most Eastern part of the city) → Cluj-Napoca City Center;
CN—Cluj-Napoca City Center → Mănăștur neighborhood (most Western part of the city);
CT—Cluj-Napoca City Center → Cluj-Napoca Central Train Station.
Figure 3 illustrates the satellite view of the route from the airport to the city center.
By extracting the data from the defined route on the map, the CarMaker tool allows users to create a replica of that exact route in the simulation software, taking into account all the elevations, turns, driving lanes, etc.
For the purposes of this paper, the simulation is kept simple, without stops, traffic lights, or roundabouts; the route has on its entire length two lanes, one for each travel direction; and the maneuvering of the vehicle is performed following standard driver behavior without exceeding a traveling speed of 20 km/h. Considering that a significant length of the travel routes contain dedicated bus lanes, as well as the fact that the MAV implementation is aimed to be performed, at least in the incipient steps of landside development, during nighttime, when traffic is low, traffic characteristics are not considered for this conceptual analysis and scenarios. In future simulations and test runs, the impact of traffic on the public transport alternatives will be studied in order to identify the necessary adjustments to be made to the existing infrastructure to facilitate a safe and optimized way of equipment exploitation.
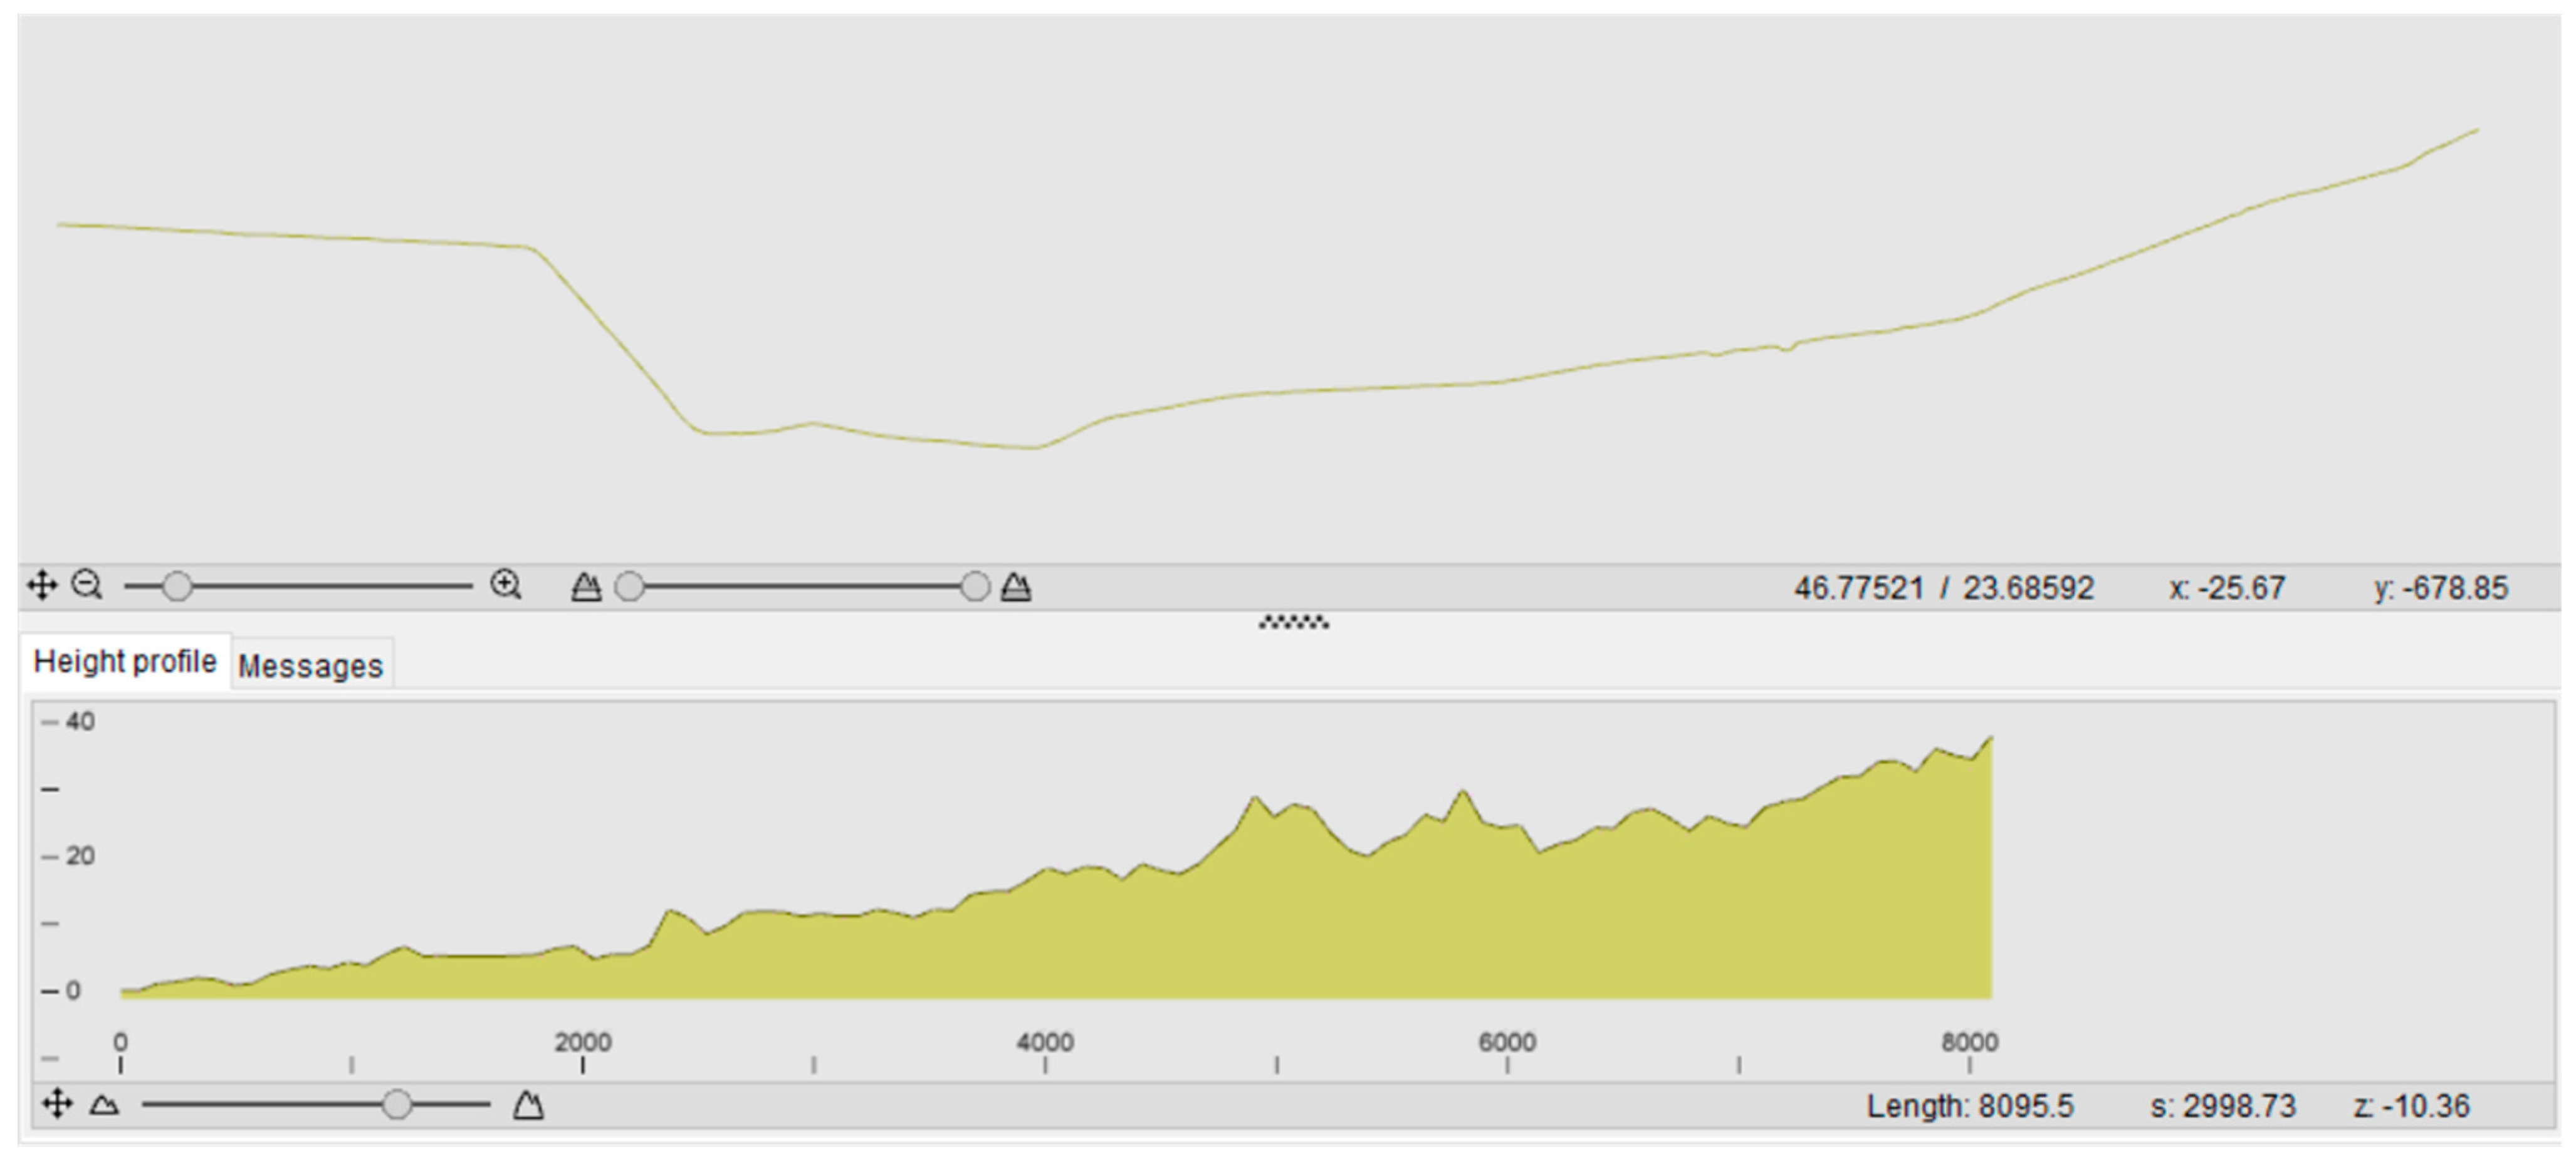
A digitized route of 8.095 m is presented in
Figure 4 using the IPG CarMaker’s Scenario Editor. In this view, the defined path is seen in the upper part of the Figure, while the lower graph shows the road elevation profile.
Following the same procedure, all routes are generated in the tool, and simulations are performed by referring to the below scenarios, indicating that the MAV solution will split its modules when reaching the city center, continuing to run the transportation tasks to the train station and Neighborhood with two modules in each direction, whereas the full-size bus alternative will need two buses to cover the routes, even though it is not operating at full or near full capacity, as per
Table 4.
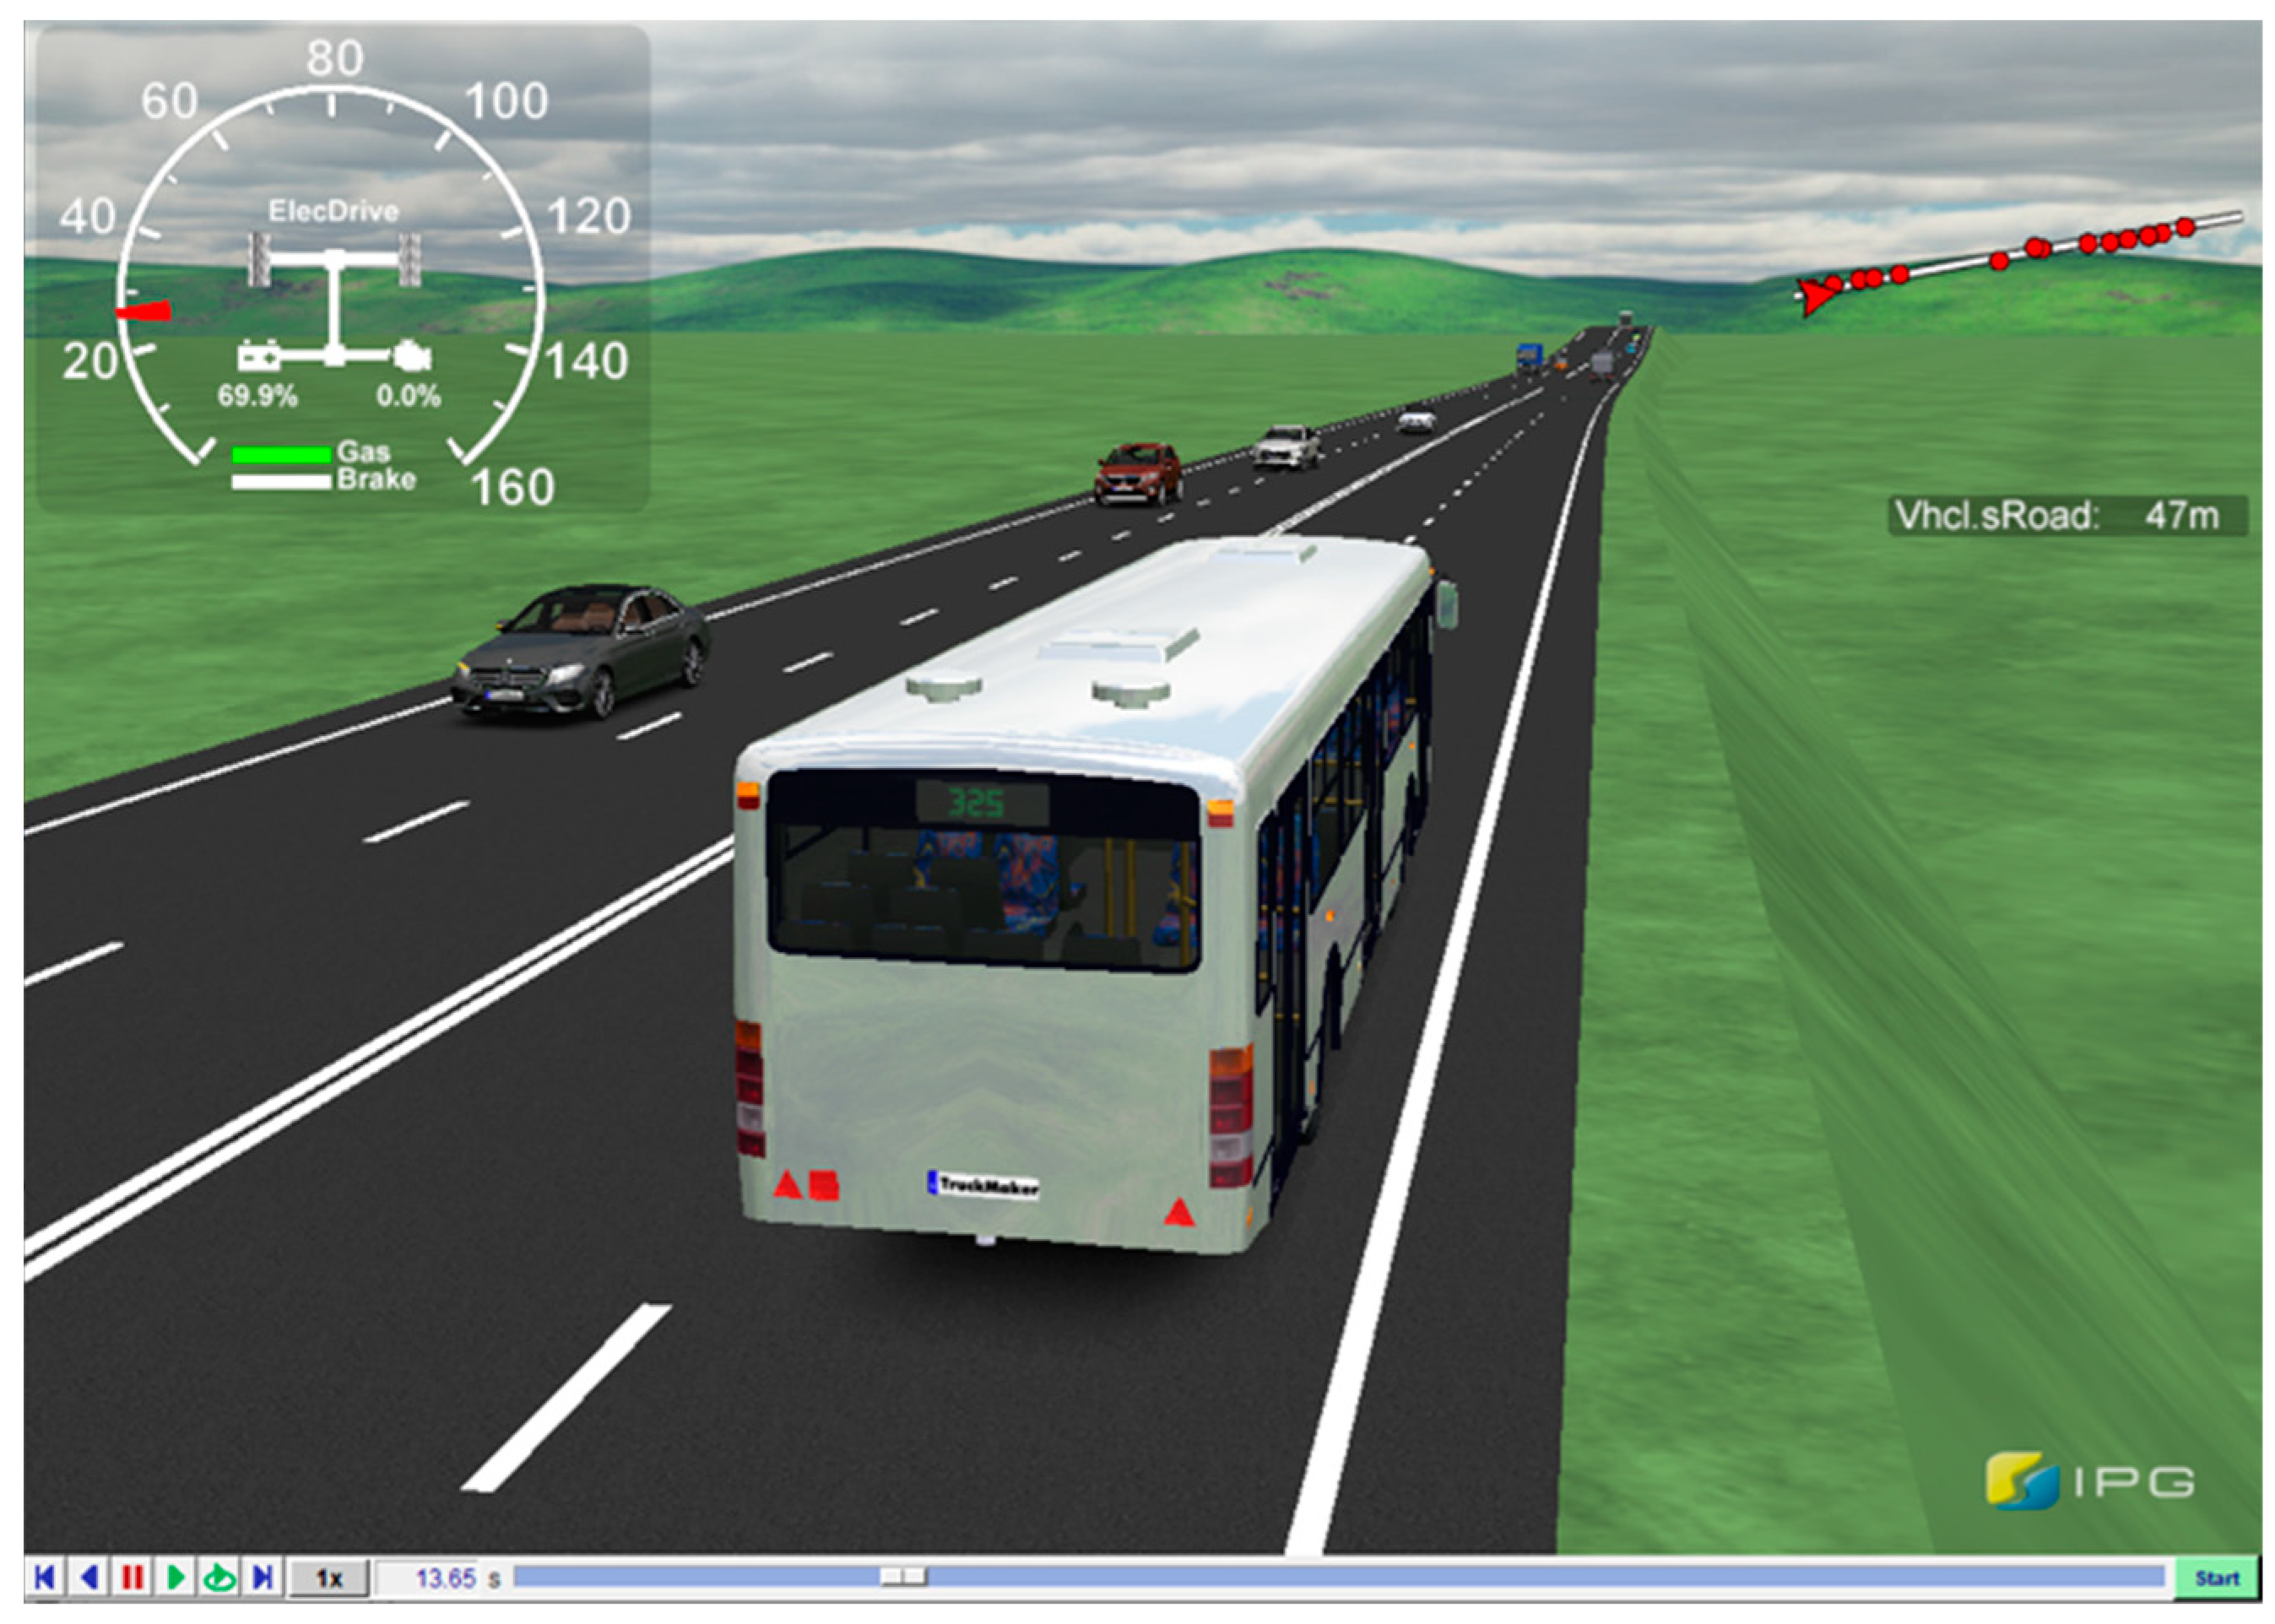
Using the IPG Movie add-on to visualize the simulation process, an MAV road train consisting of four autonomous modules can be observed, as shown in
Figure 5. Additionally,
Figure 6 shows an electric bus model during simulation on a four-lane road.
After running all simulations, the results are centralized, focusing mainly on energy consumption parameters specific to battery electric powertrains: high-voltage battery electrical energy consumption [kWh], available battery capacity [Ah] and State-of-Charge [%], current drawn from the battery [A], and absolute energy consumption [kWh] defined by the control module of the powertrain. In the following Results chapter, information on average energy consumption [kWh/km] and State-of-Charge (SoC) is compared.
2.2. Weight Distribution
The study’s accuracy and dependability are enhanced by the inclusion of weight in the simulations through the addition of passengers and their luggage, which more precisely mimics real-world circumstances. The simulations can capture the changing weight distribution as the vehicle travels along its route by precisely simulating passenger boarding at bus stops. Researchers can examine how the influx of passengers affects the performance and energy efficiency of the vehicle using this dynamic representation. Additionally, it enables the assessment of methods to enhance operational efficiency in terms of passenger flow, seating configurations, and boarding procedures.
Adding load to the vehicle is essential for examining how weight distribution affects the performance and efficiency of the battery electric bus in numerous ways. Using factors such as the location of heavy components, passenger distribution, and cargo placement, IPG CarMaker 12.0.1 software enables precise weight distribution across the vehicle. This level of specificity guarantees an accurate representation of actual situations and offers information on the precise regions where weight distribution can be optimized to increase energy efficiency.
A mean value of 84 kg per person, including luggage, has been considered in the weight distribution process, as shown in
Figure 7. This number represents an estimate of the weight that each passenger typically carries, taking into account both their body weight and any accompanying luggage [
31].
To estimate how many people will board the vehicles during the simulated scenarios, the study uses data on passenger demand and ridership patterns that are currently available, based on the crowd at the bus station. Capacity-wise, each autonomous module is still considered to be able to accommodate no more than twelve passengers, while the electric bus can take up to 60 people on board.
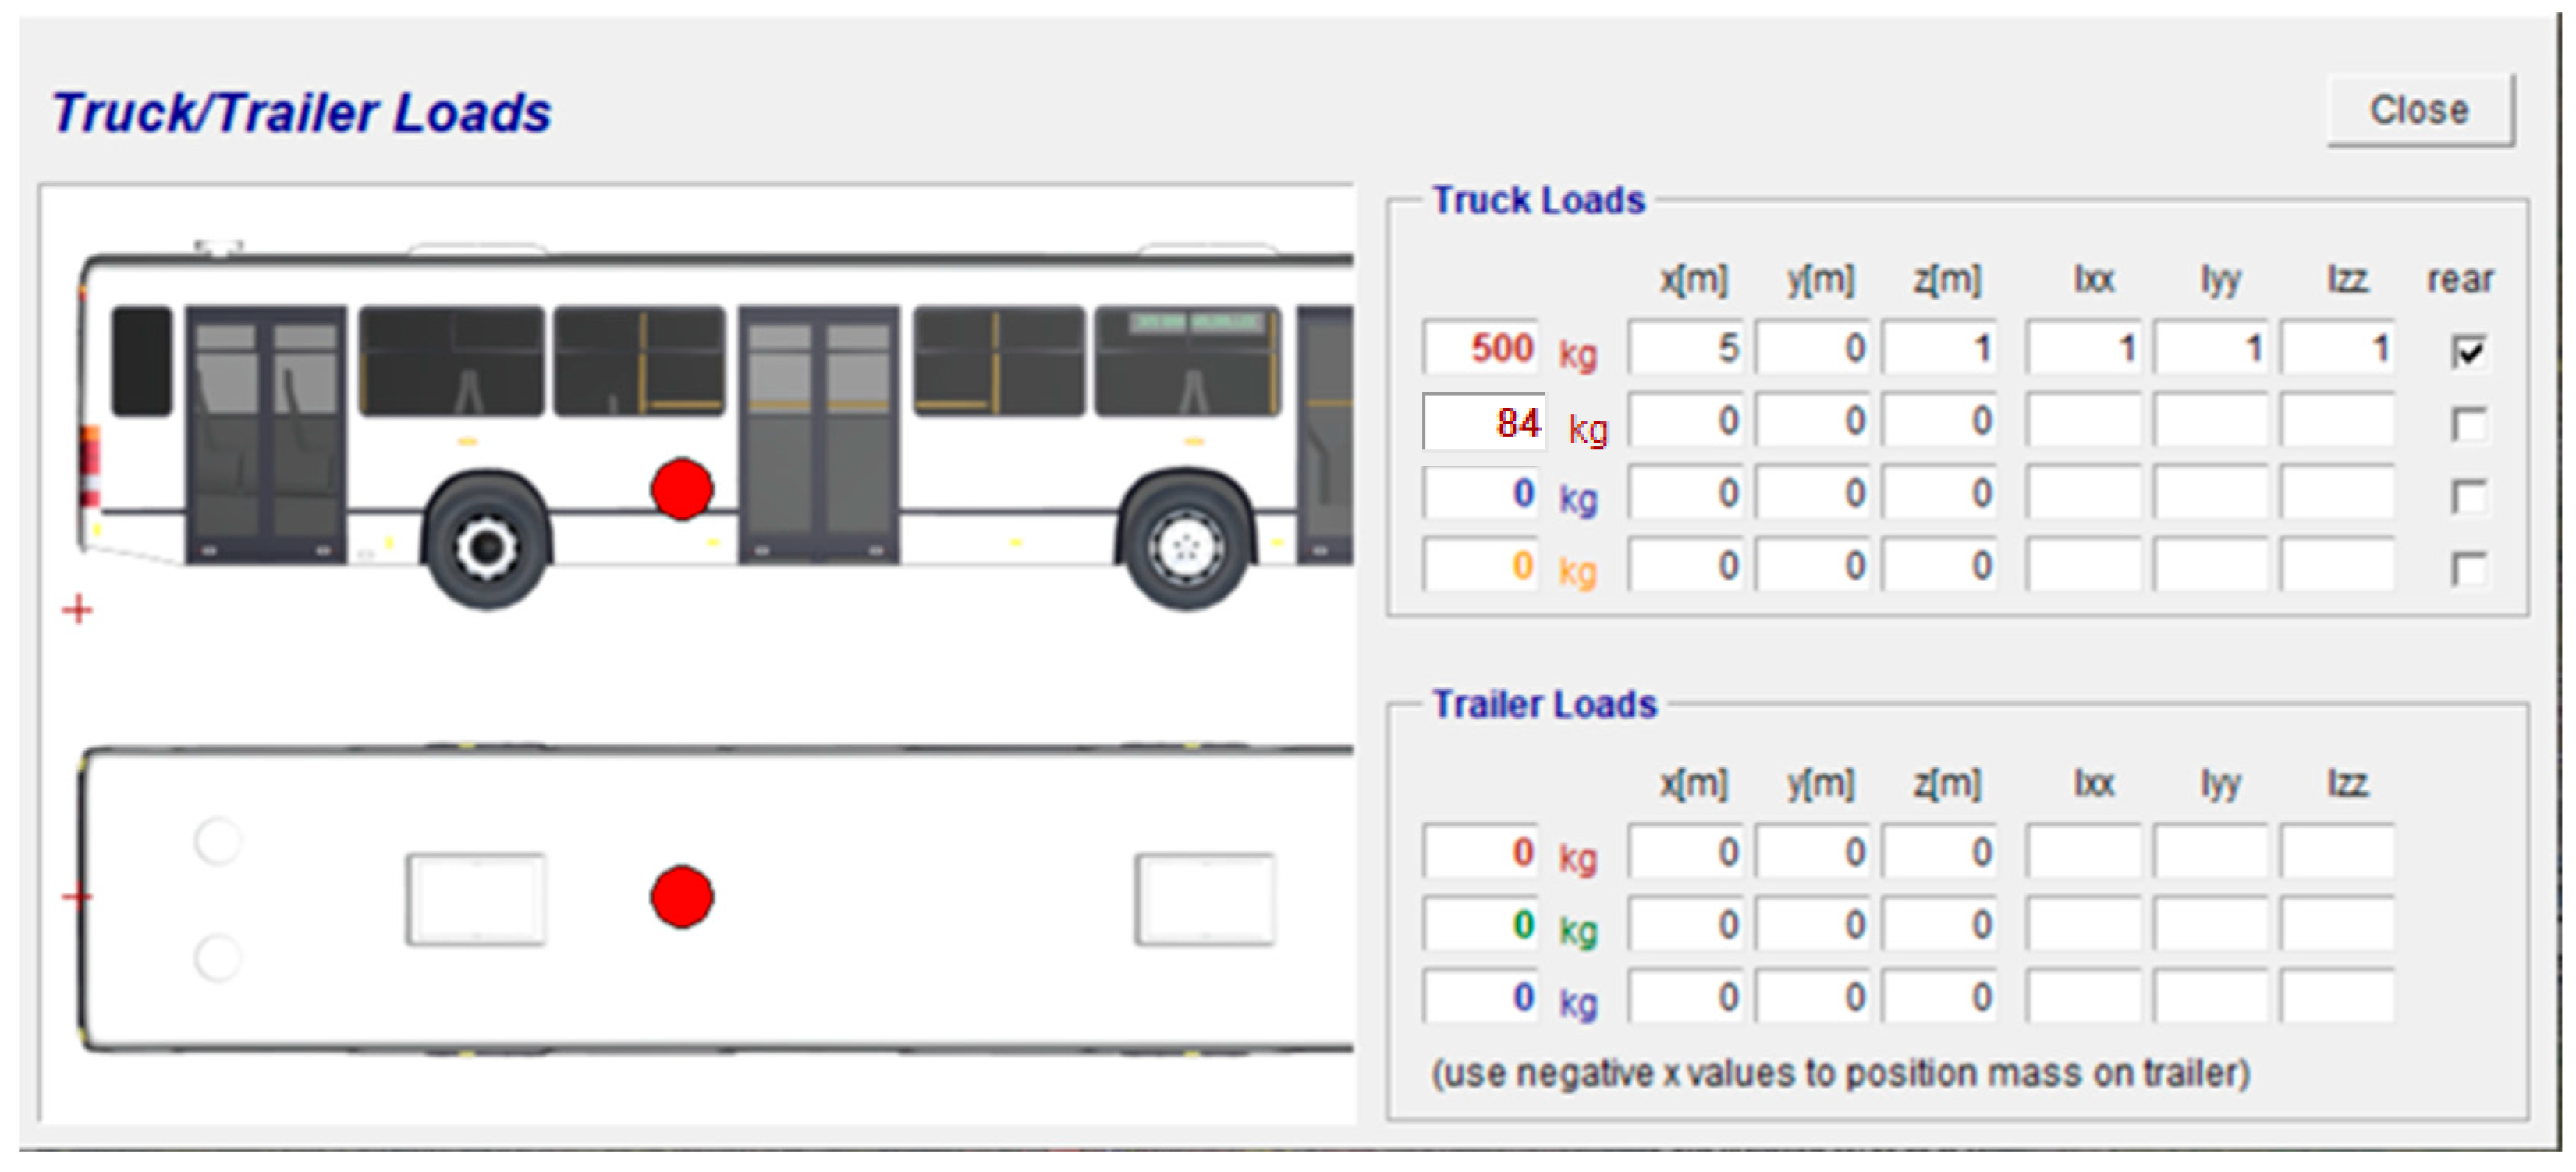
Passenger loads for the electric bus are defined in TruckMaker (
https://www.ipg-automotive.com/en/products-solutions/software/truckmaker/, accessed on 5 April 2024), the software solution from IPG Automotive GmbH that allows the modeling and simulation of trucks, buses, and other heavy-duty vehicles. The definition of the weight distribution is performed in an equivalent way to that in CarMaker. Up to four generalized loads are placed on a three-dimensional axis, simulating passengers and baggage inside the bus. In the
Figure 8, load definition on an electric bus model is illustrated.
The simulations accurately reflect the inherent variability and unpredictability of passenger positioning by incorporating randomization into the weight distribution process. This randomness accounts for elements such as passenger preferences, boarding order, and the distribution of available standing and sitting areas.
3. Results
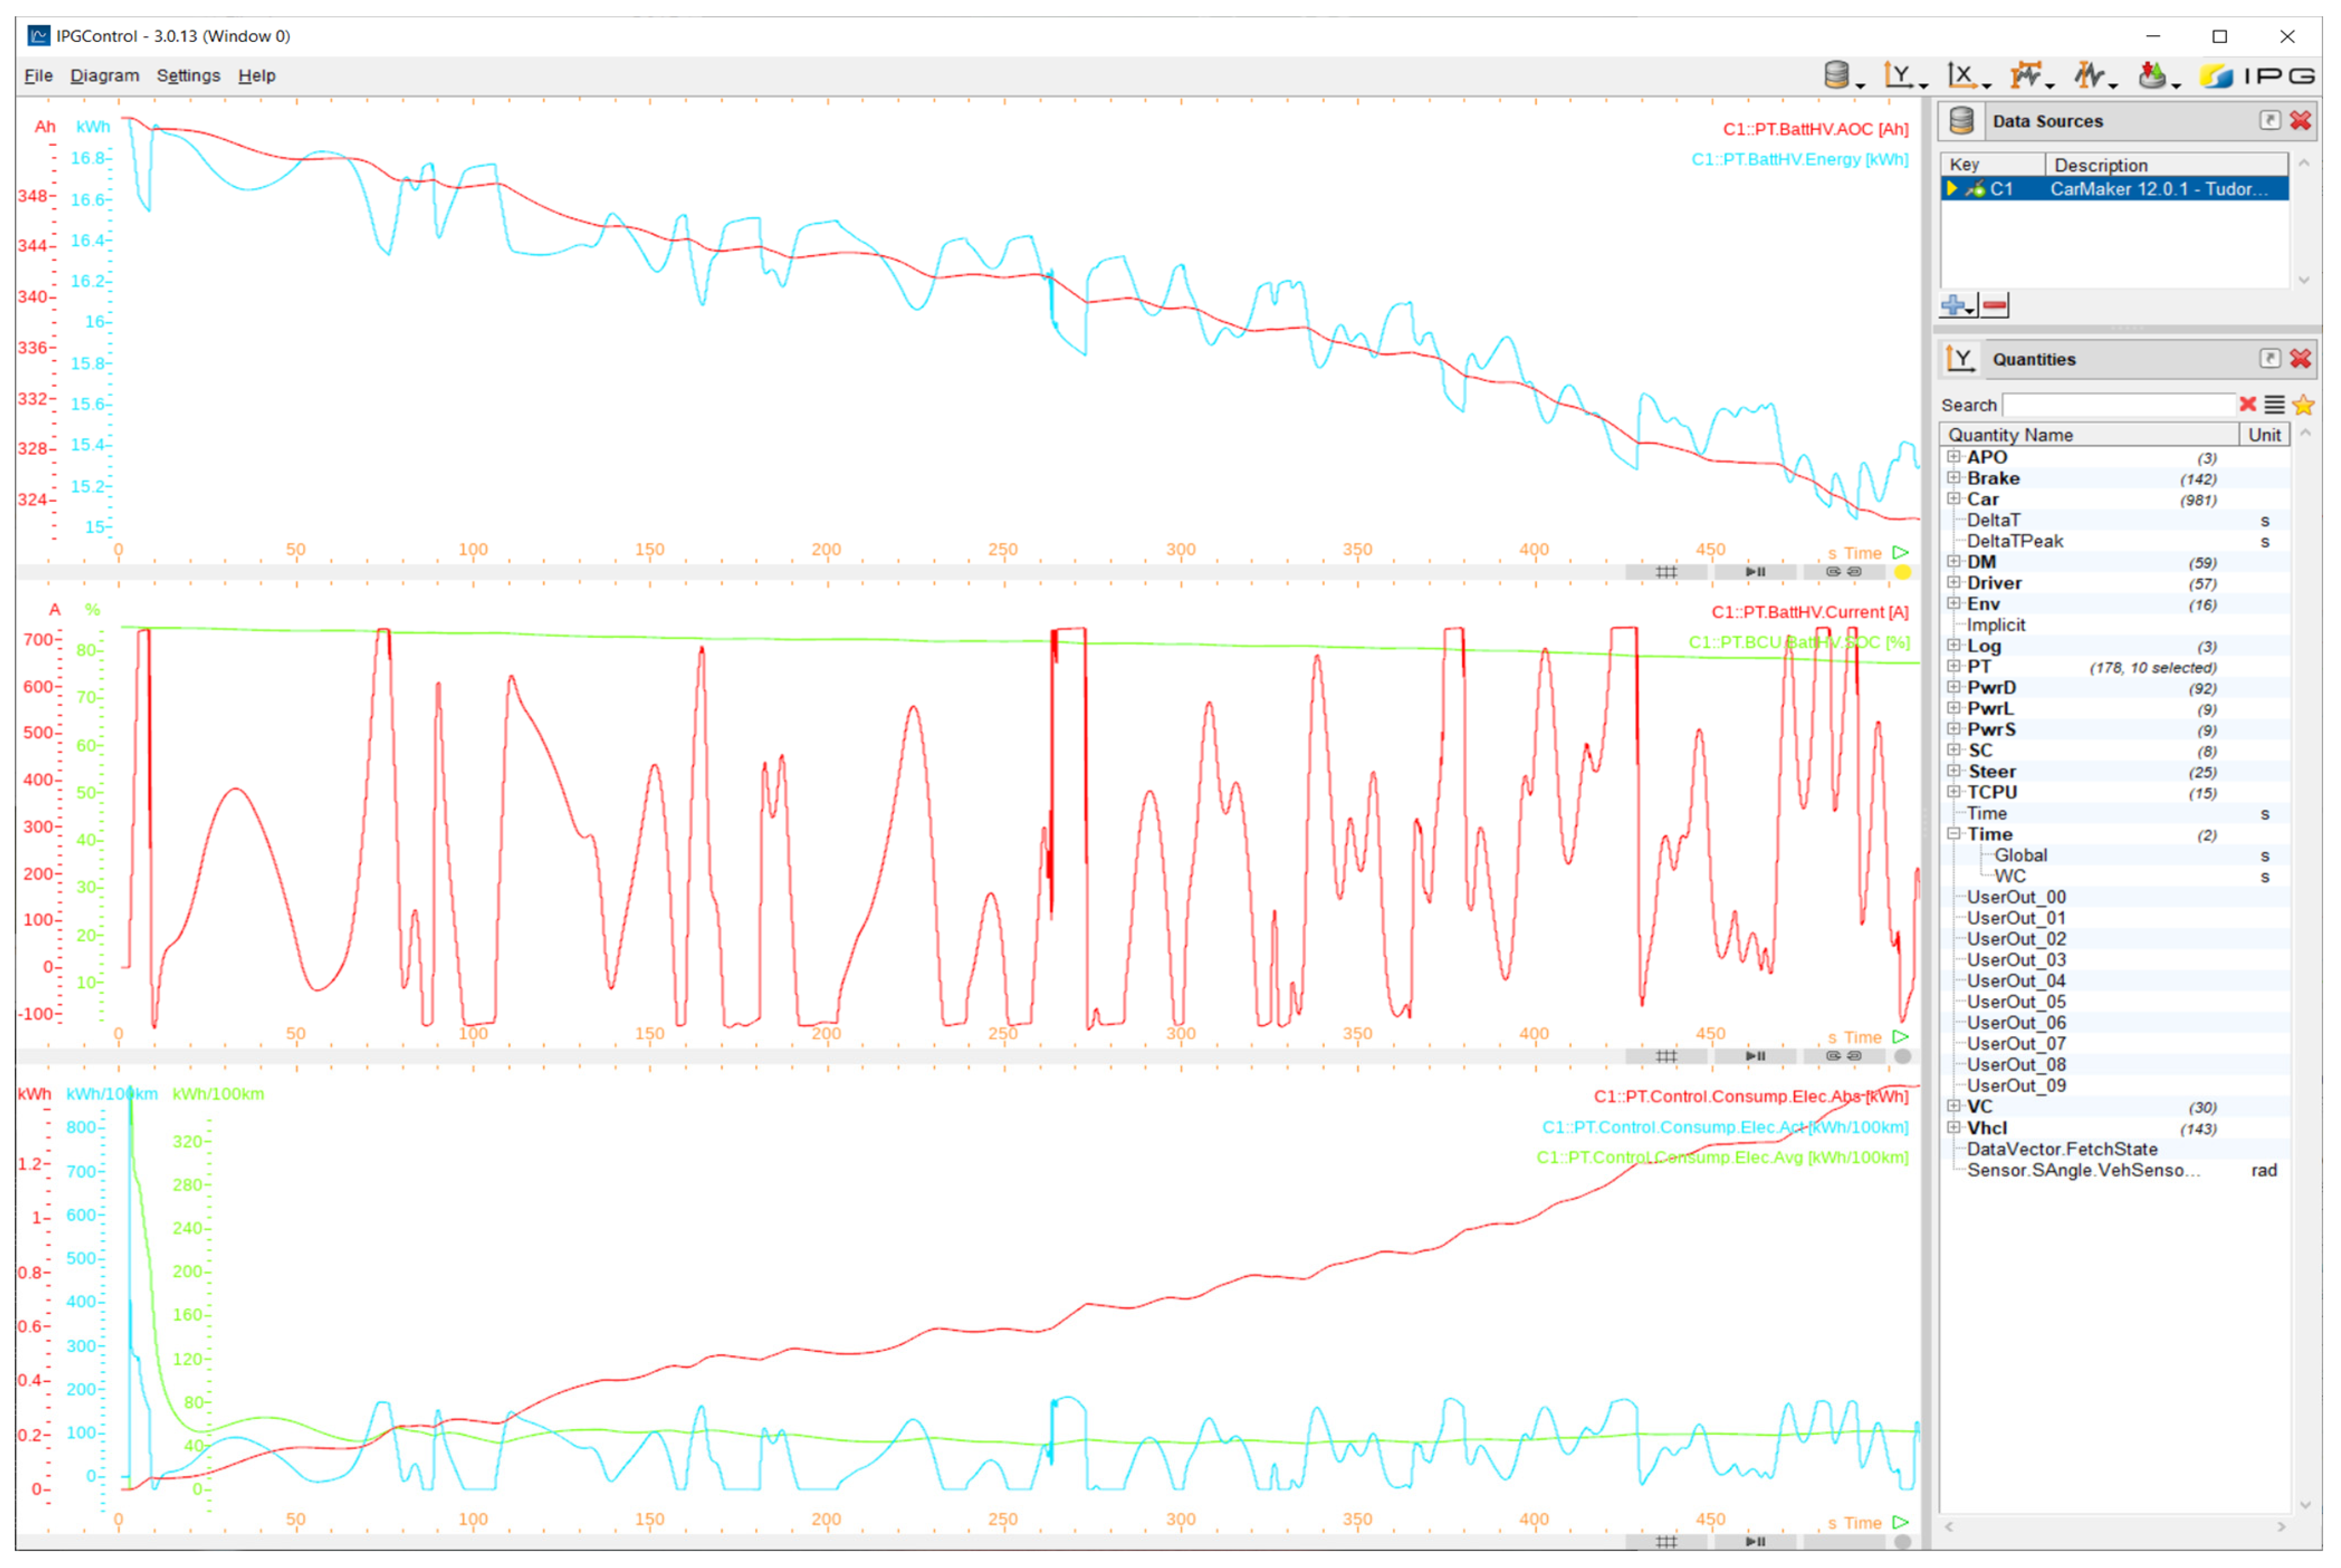
Simulation results are gathered using the IPG Control add-on, which allows real-time visualization of the results by plotting any selected quantities in user-defined graphs.
To easily follow the evolution of the model states and determine if the results are plausible, the IPG Control interface is configured as shown in
Figure 9.
The top graph in the Figure presents the evolution of available energy [kWh] and available charge (AoC) [Ah] of the high-voltage battery, while the center graph illustrates the battery’s State-of-Charge (SoC) [%], and current [A]. The bottom graph shows the actual and average electrical energy consumption [kWh/100 km] and absolute electrical energy consumption [kWh] during a simulation scenario of 500 s, representing a sector run of the entire digitized route.
In real-life scenarios, the placement of boarded passengers inside the vehicle is difficult to control, as each passenger has different preferences or needs that dictate their chosen seating or standing location during the trip. The combined weight of multiple people impacts the overall weight distribution of the vehicle. Its effect on the energy efficiency of the buses is studied using three different cases. In these scenarios, the front, middle, and rear sections of the buses had higher load concentrations, respectively. Besides the passenger load on the vehicles, all simulation parameters are kept the same: driving path, elevation profiles, speed limit of 20 km/h, standard driver behavior, no corner cutting.
By centralizing and analyzing simulation results related to the conventional transport solution (i.e., two full-size buses used to cover the previously defined routes), the below described data is observed.
As mentioned in
Table 5, the average electrical energy consumption is observed to be higher in scenarios where the majority of passenger weight is distributed to the rear of the bus. It should be noted that on the rear axle is where the drive motors are also placed.
Having the weight distributed evenly on the sides and the majority of it placed in the middle of the bus helps increase energy efficiency and keeps the SOC of the high voltage battery pack at a higher level during the simulation. Average energy consumption is at its lowest level in
Table 6. Moving further from the drive axle, a front-biased weight distribution simulation shows improved results based on rear-biased cases but does not match the efficiency of centered passenger mass inside the electric bus.
Table 7 shows the results for the majority of weight placed in the frontal passenger area.
For the MAV fleet solution, where four modules are used to travel from the airport to the city center and then split into two road trains, each consisting of two modules, the overall energy consumption results are considered. In particular scenarios, it is essential to consider that the leading modules might draw more electrical energy from their battery packs, resulting in reduced range and more wear on the electrical components and some mechanical components as well. For this reason, a more detailed analysis is hinted by this paper, which implies looking at software solutions that allow simulation of MAVs operating together in a predetermined environment. As of the present access and capabilities of the available software, the defined scenarios can lead to results that show the conceptual impact of modular vehicle fleets, but they do not indicate exact numbers in terms of efficiency, energy consumption reduction, or equipment wear indications. The MAV fleet is comprised of four separate vehicles, each maintaining uniform weight distribution throughout its framework. During the simulation, each vehicle maintains an even distribution of weight, ensuring consistent performance and stability throughout the entire system. The intentional strategy of distributing weight enhances the vehicle’s efficiency and versatility in different operational situations.
In
Table 8, the combined simulation results of the MAV application are listed.
It should be noted that the initial State-of-Charge of the batteries is set at 85%, considering that the vehicle leaves the depot where it is charging and travels without running any passenger transport tasks until it reaches the starting point of the route—the airport’s terminal bus station. Upon leaving the charging station, the vehicle is charged between 90% and 100%, considered to be fully charged.
In both simulation scenarios, it can be observed that the autonomous vehicles end their tasks with a State-of-Charge of over 50%, allowing them to at least travel a returning route to the starting point. In any case, the scalability and planning of such vehicles are key factors in ensuring that tasks can be carried out without issues related to effective range or unexpected energy consumption. For each particular case of MAV applications, a reserve charge is taken into account based on the length of the routes, landmarks, weather conditions, and other relevant factors.
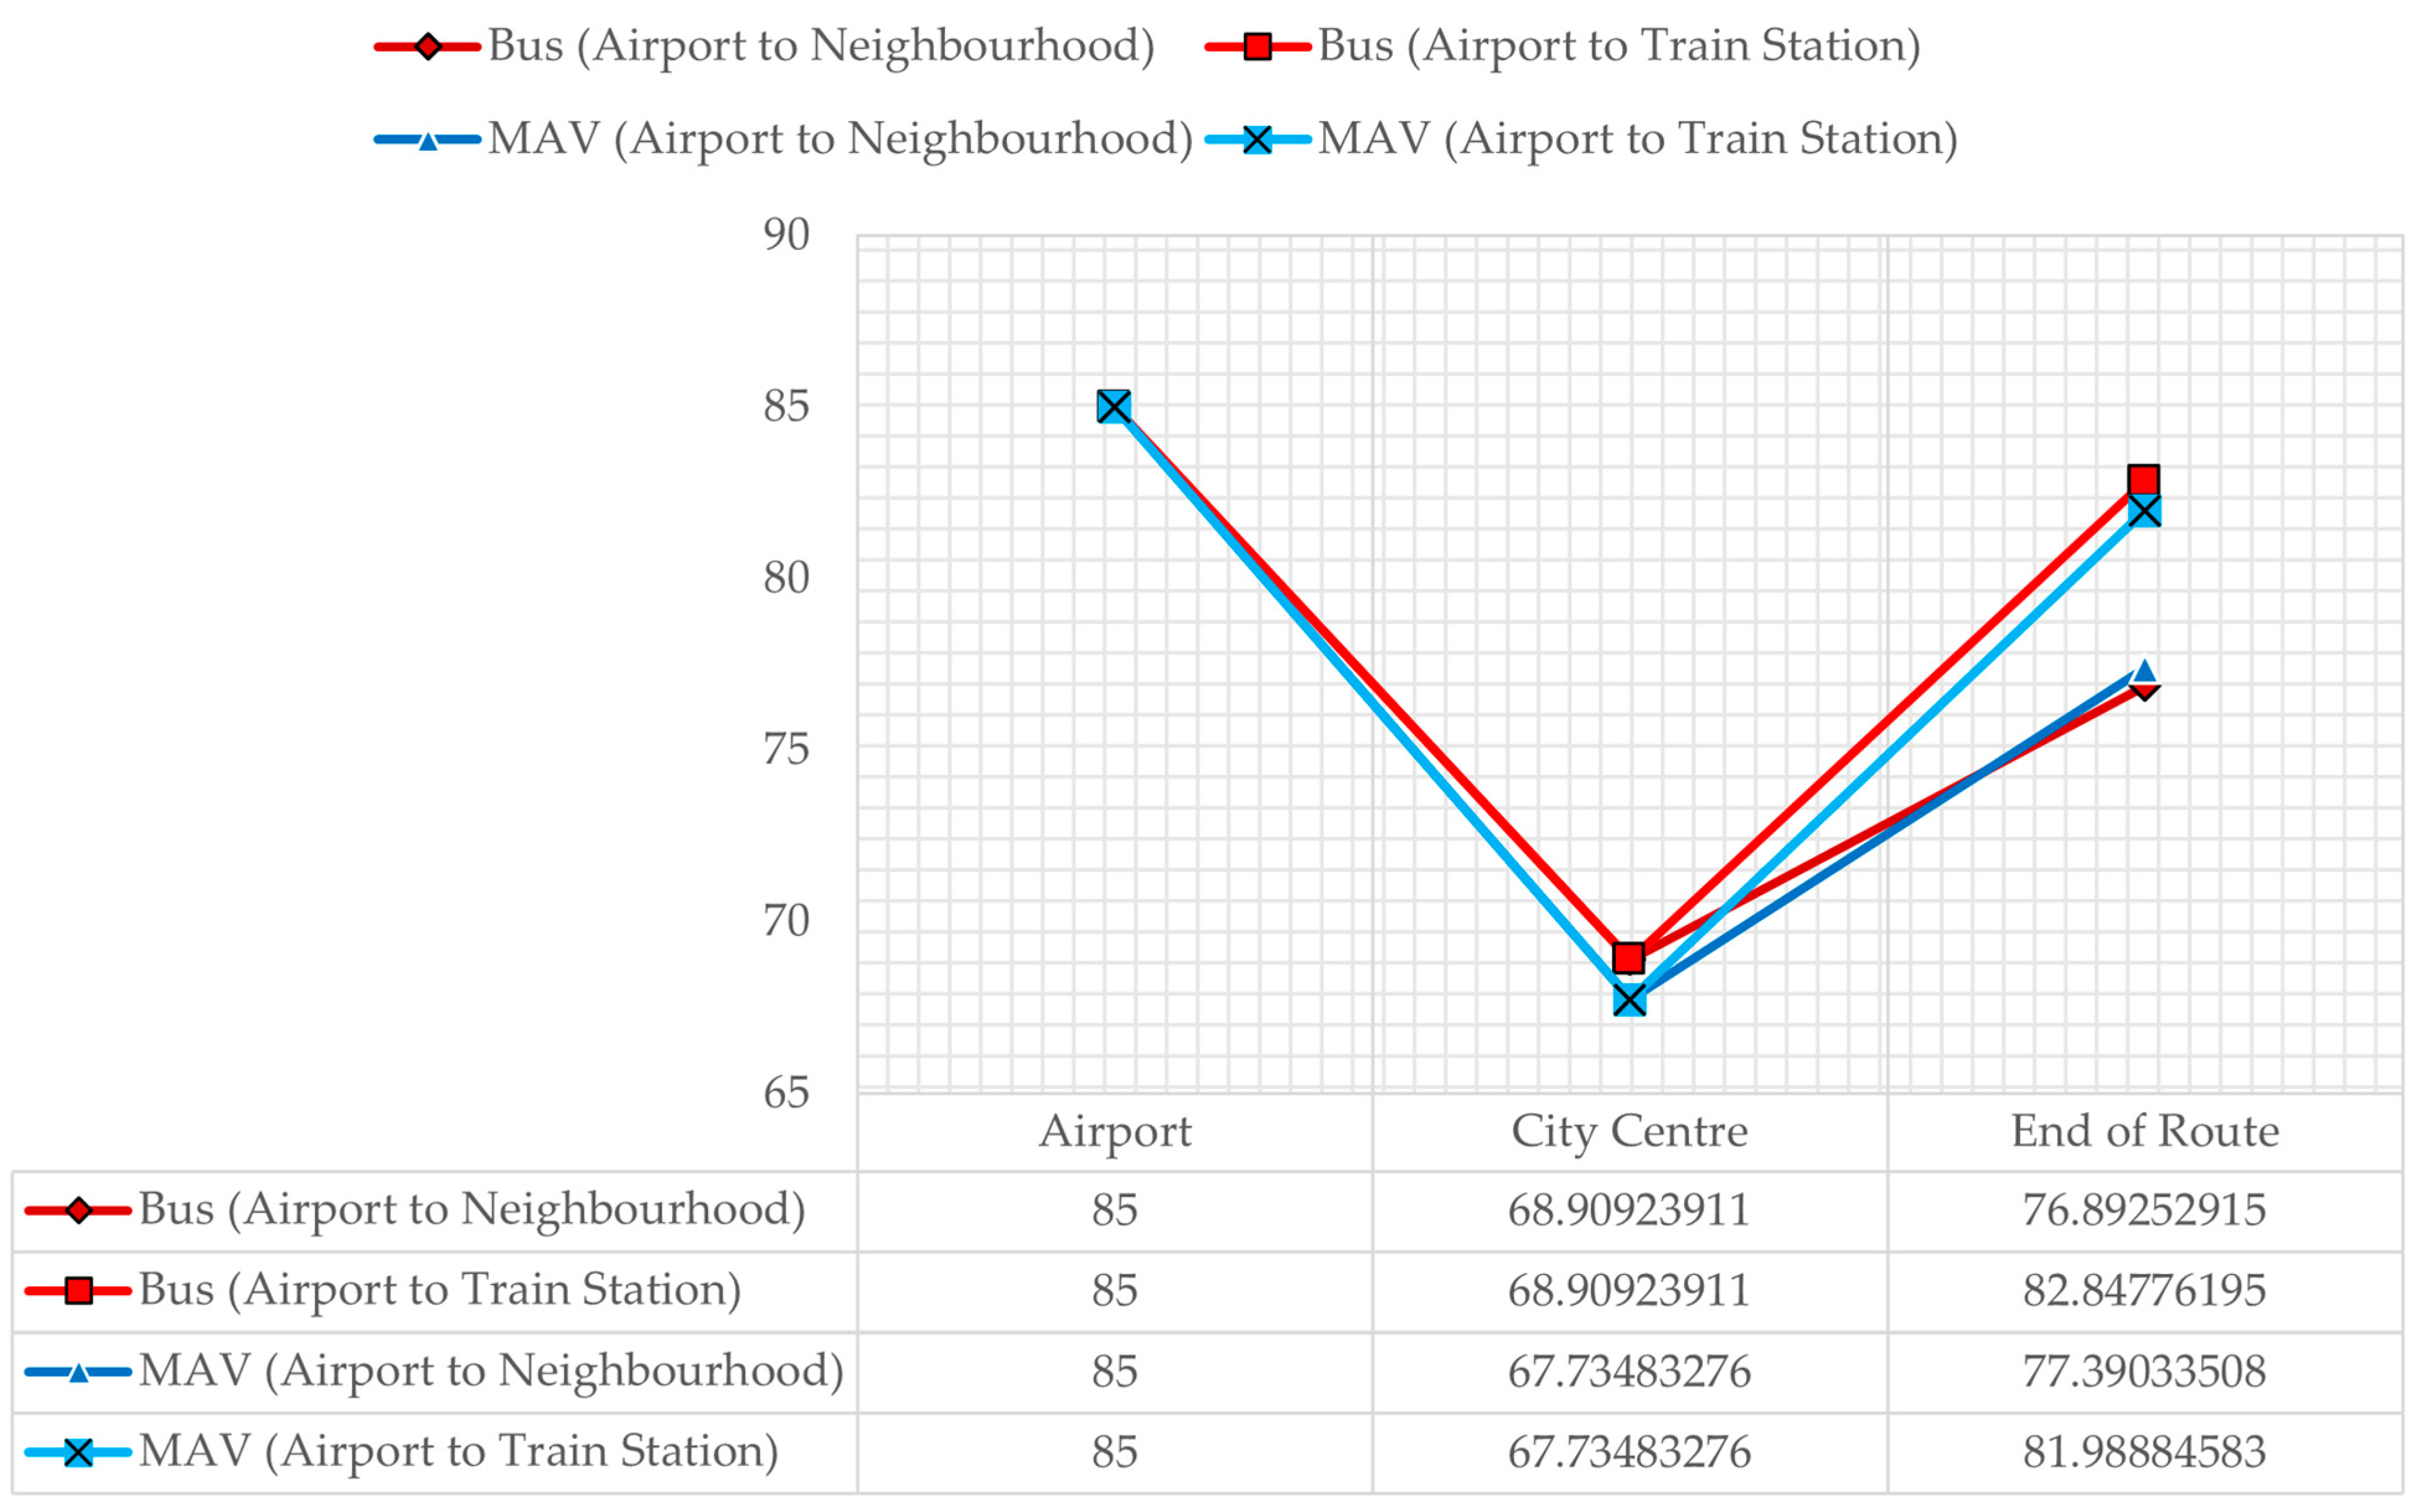
Figure 10 shows the evolution of the batteries’ State-of-Charge during each test run, starting from the airport, through the city center and to the last bus stop of every route, described below as End of Route. The city center is the detaching point, where the common path of the two routes ends and each route continues to its respective destination.
The characteristics of electric buses are illustrated in shades of blue, while MAV performance is shown in shades of red. It can be noticed that the SoC evolution from the airport to the city center is similar for each mobility solution: the electric buses, having the same technical specifications and passenger load, perform the same, while the MAV alternative uses all four modules together to reach the city center, so the cumulated battery discharge is identical. In the city center, the two routes split and follow their respective paths. The route to the train station is shorter, so the remaining charge in the batteries at the end of the route is higher for both BEB (82.84%) and MAV (81.98%). The darker shades of each color are showing the SoC of runs to the Western area of the city, into the neighborhood. The route being longer, the impact on SoC is noticeably higher, obtaining a remaining charge of 76.89% for BEB and 77.39% for MAV.
Although energy consumption characteristics are similar between the two solutions, an evaluation of the overall fleet energy efficiency shows the benefits of the MAV concept. While the BEB solution uses two buses with individual results similar to the modular alternative, by using two units to cover the requested transport routes, it adds to the total energy consumption, offsetting its results.
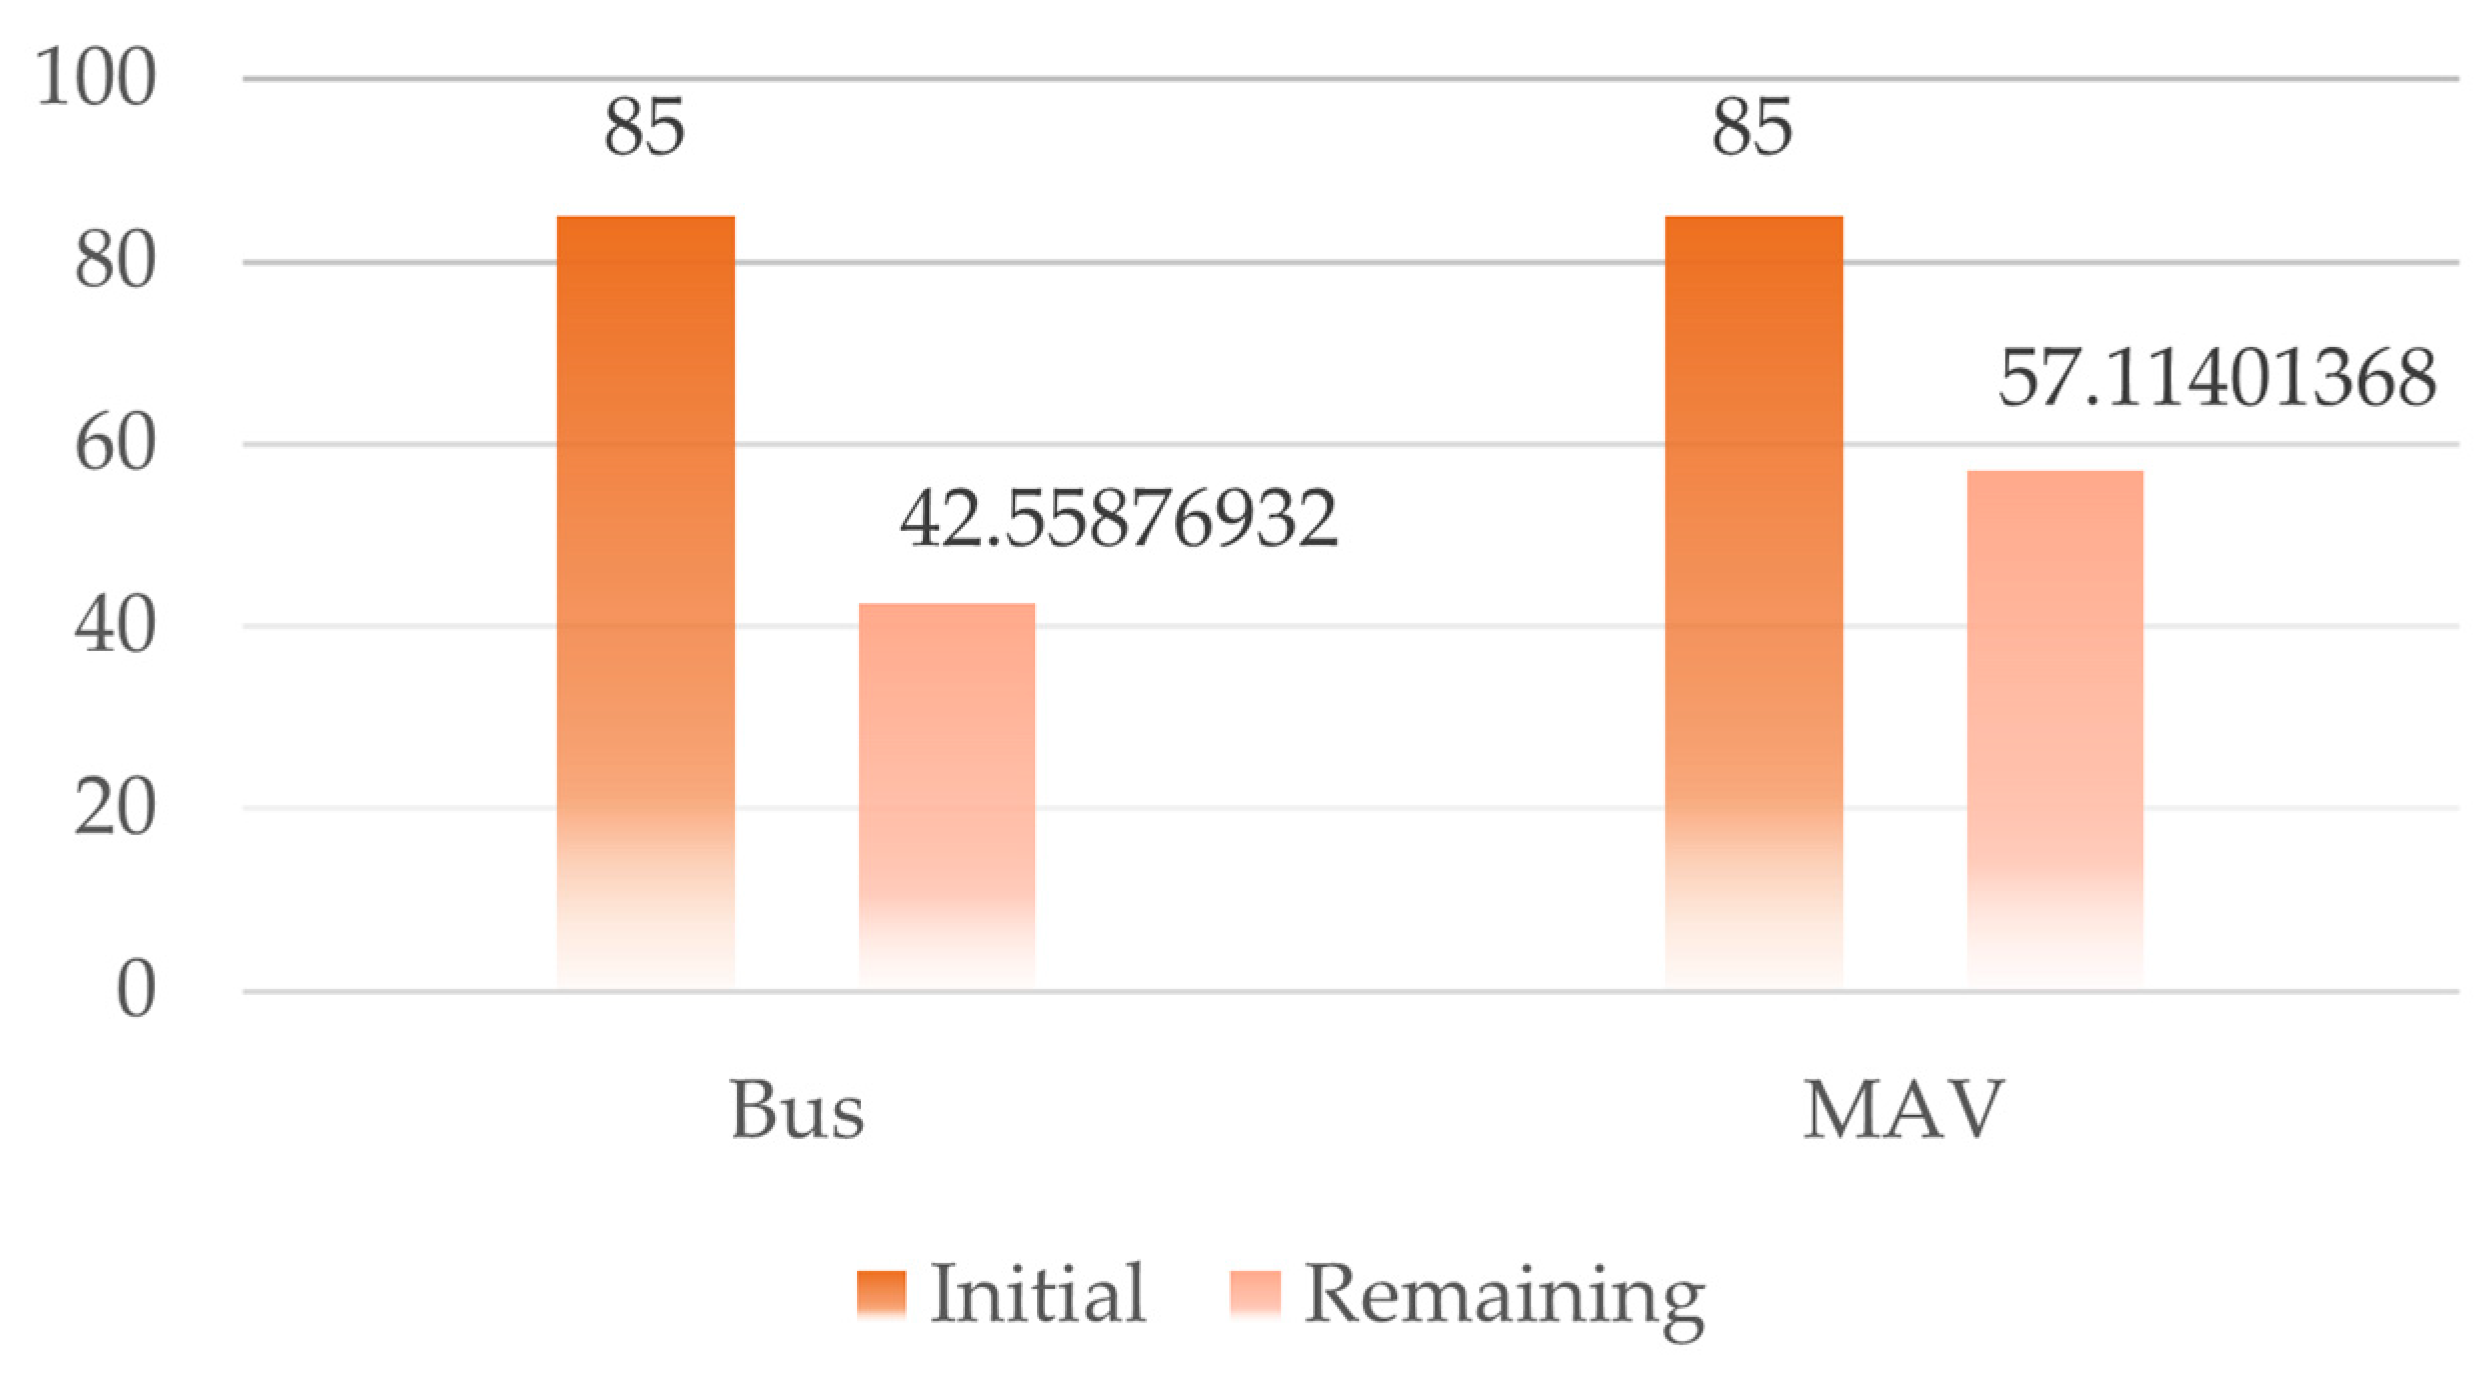
In
Figure 11, a visual comparison of the cumulated SoC [%] is shown, considering the best performance for the electric bus solution—centered weight distribution, with a remaining charge of approximately 42.5%. This Figure demonstrates the energy efficiency of the MAV system, which was further enhanced by its robust performance in terms of time efficiency and passenger comfort. The simplified routes of their service save travel time, enhance the productivity, and prioritizing passenger comfort. The comprehensive strategy offers the MAV as an appealing alternative for urban transport, offering not just energy efficiency but also improved travel experience and the ability to fulfil the varied needs of commuters.
These results indicate that the MAV solution is able to retain (overall) 34.2% more charge in the battery packs while performing tasks on the same routes and carrying the same number of passengers.
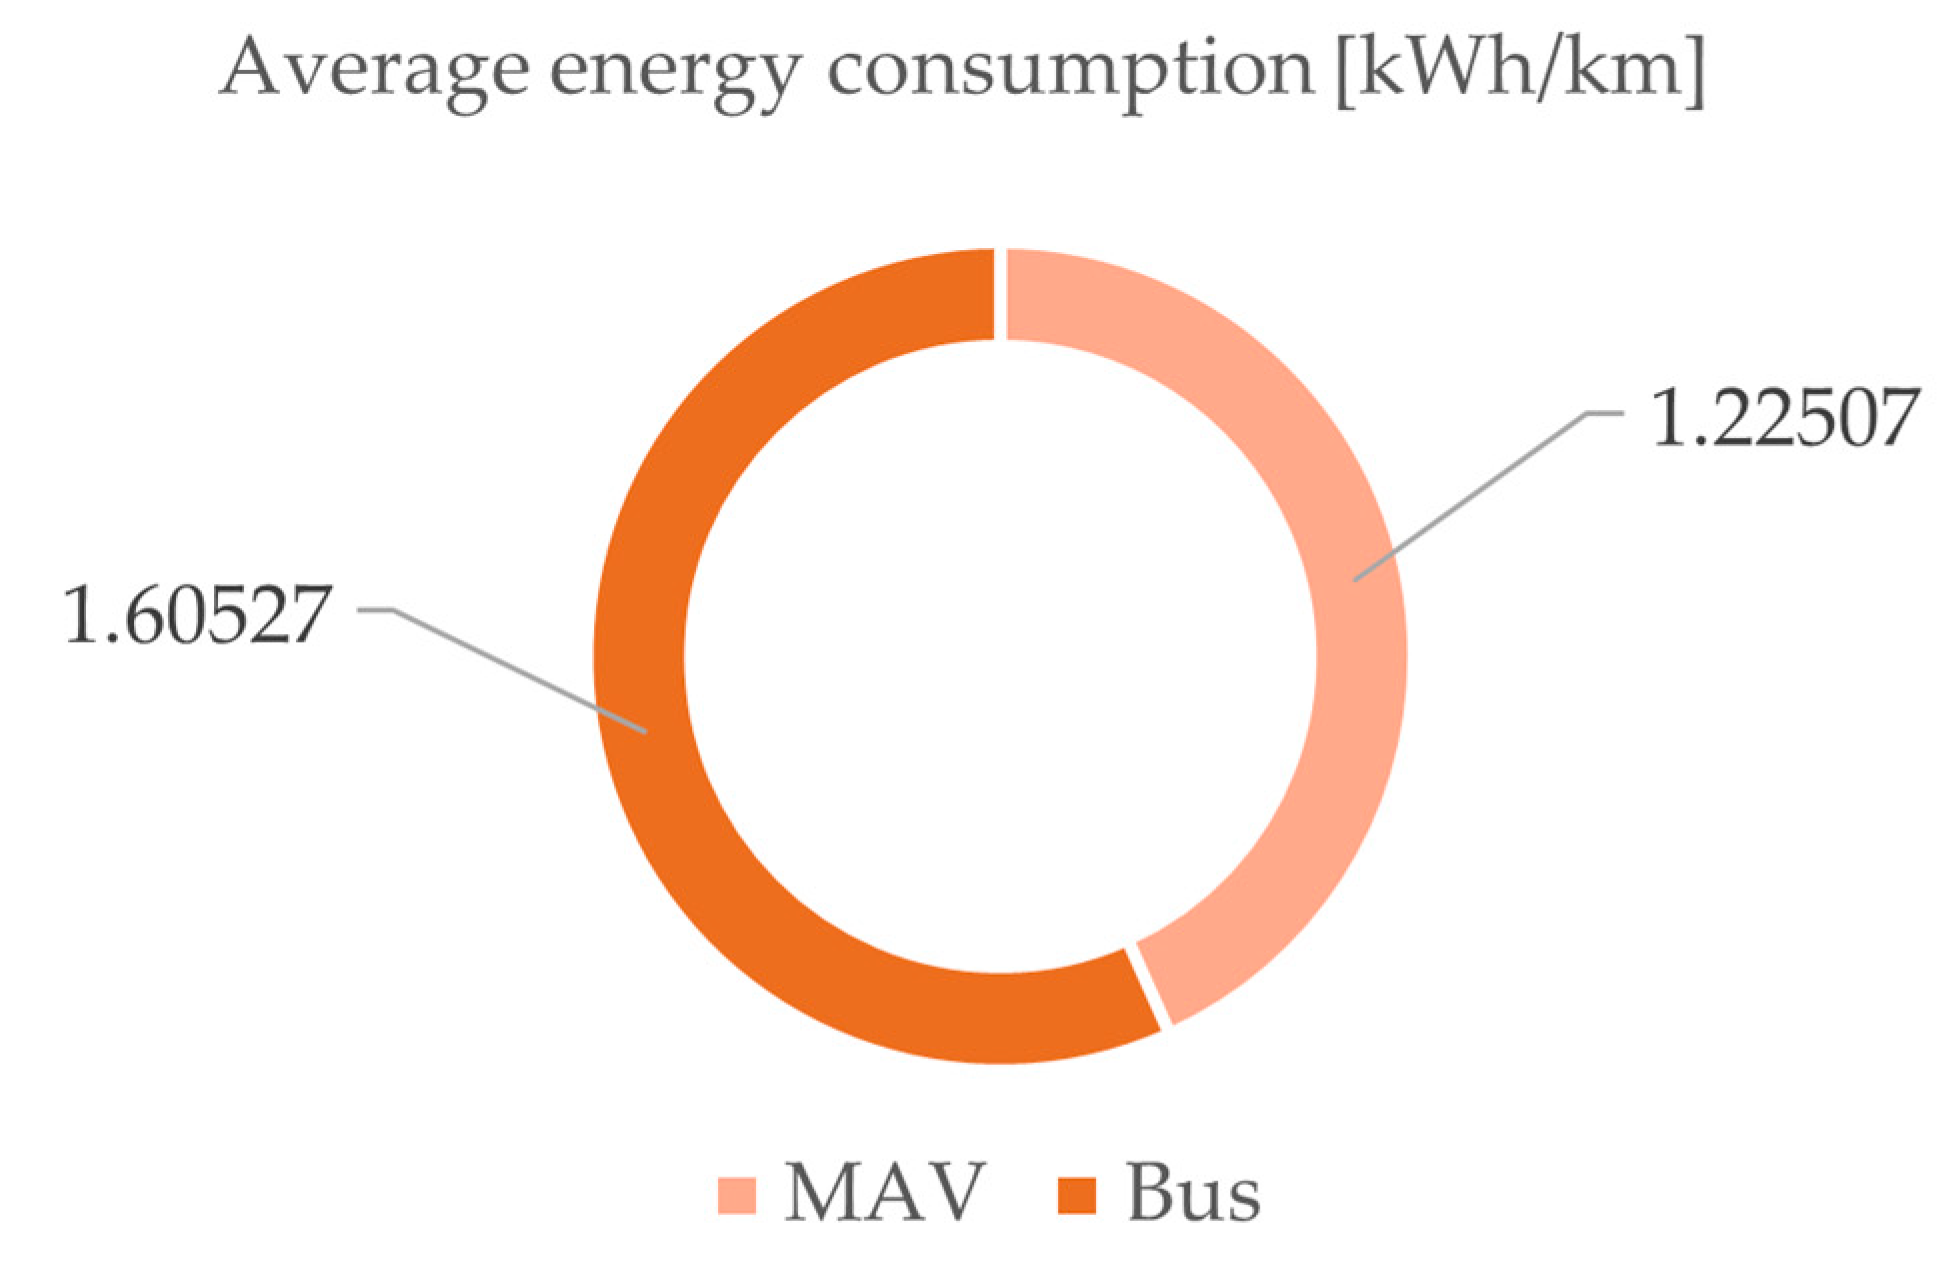
Looking at the average electrical energy consumption, which is measured in kWh/km, the conventional bus solution is 18.6% less efficient compared to the modular alternative. Average energy consumption also takes into consideration the energy recovered while braking at request or while cruising downhill and using the engine braking to keep the travel velocity at the 20 km/h setpoint. A comparison of the results between the two solutions is shown in
Figure 12.
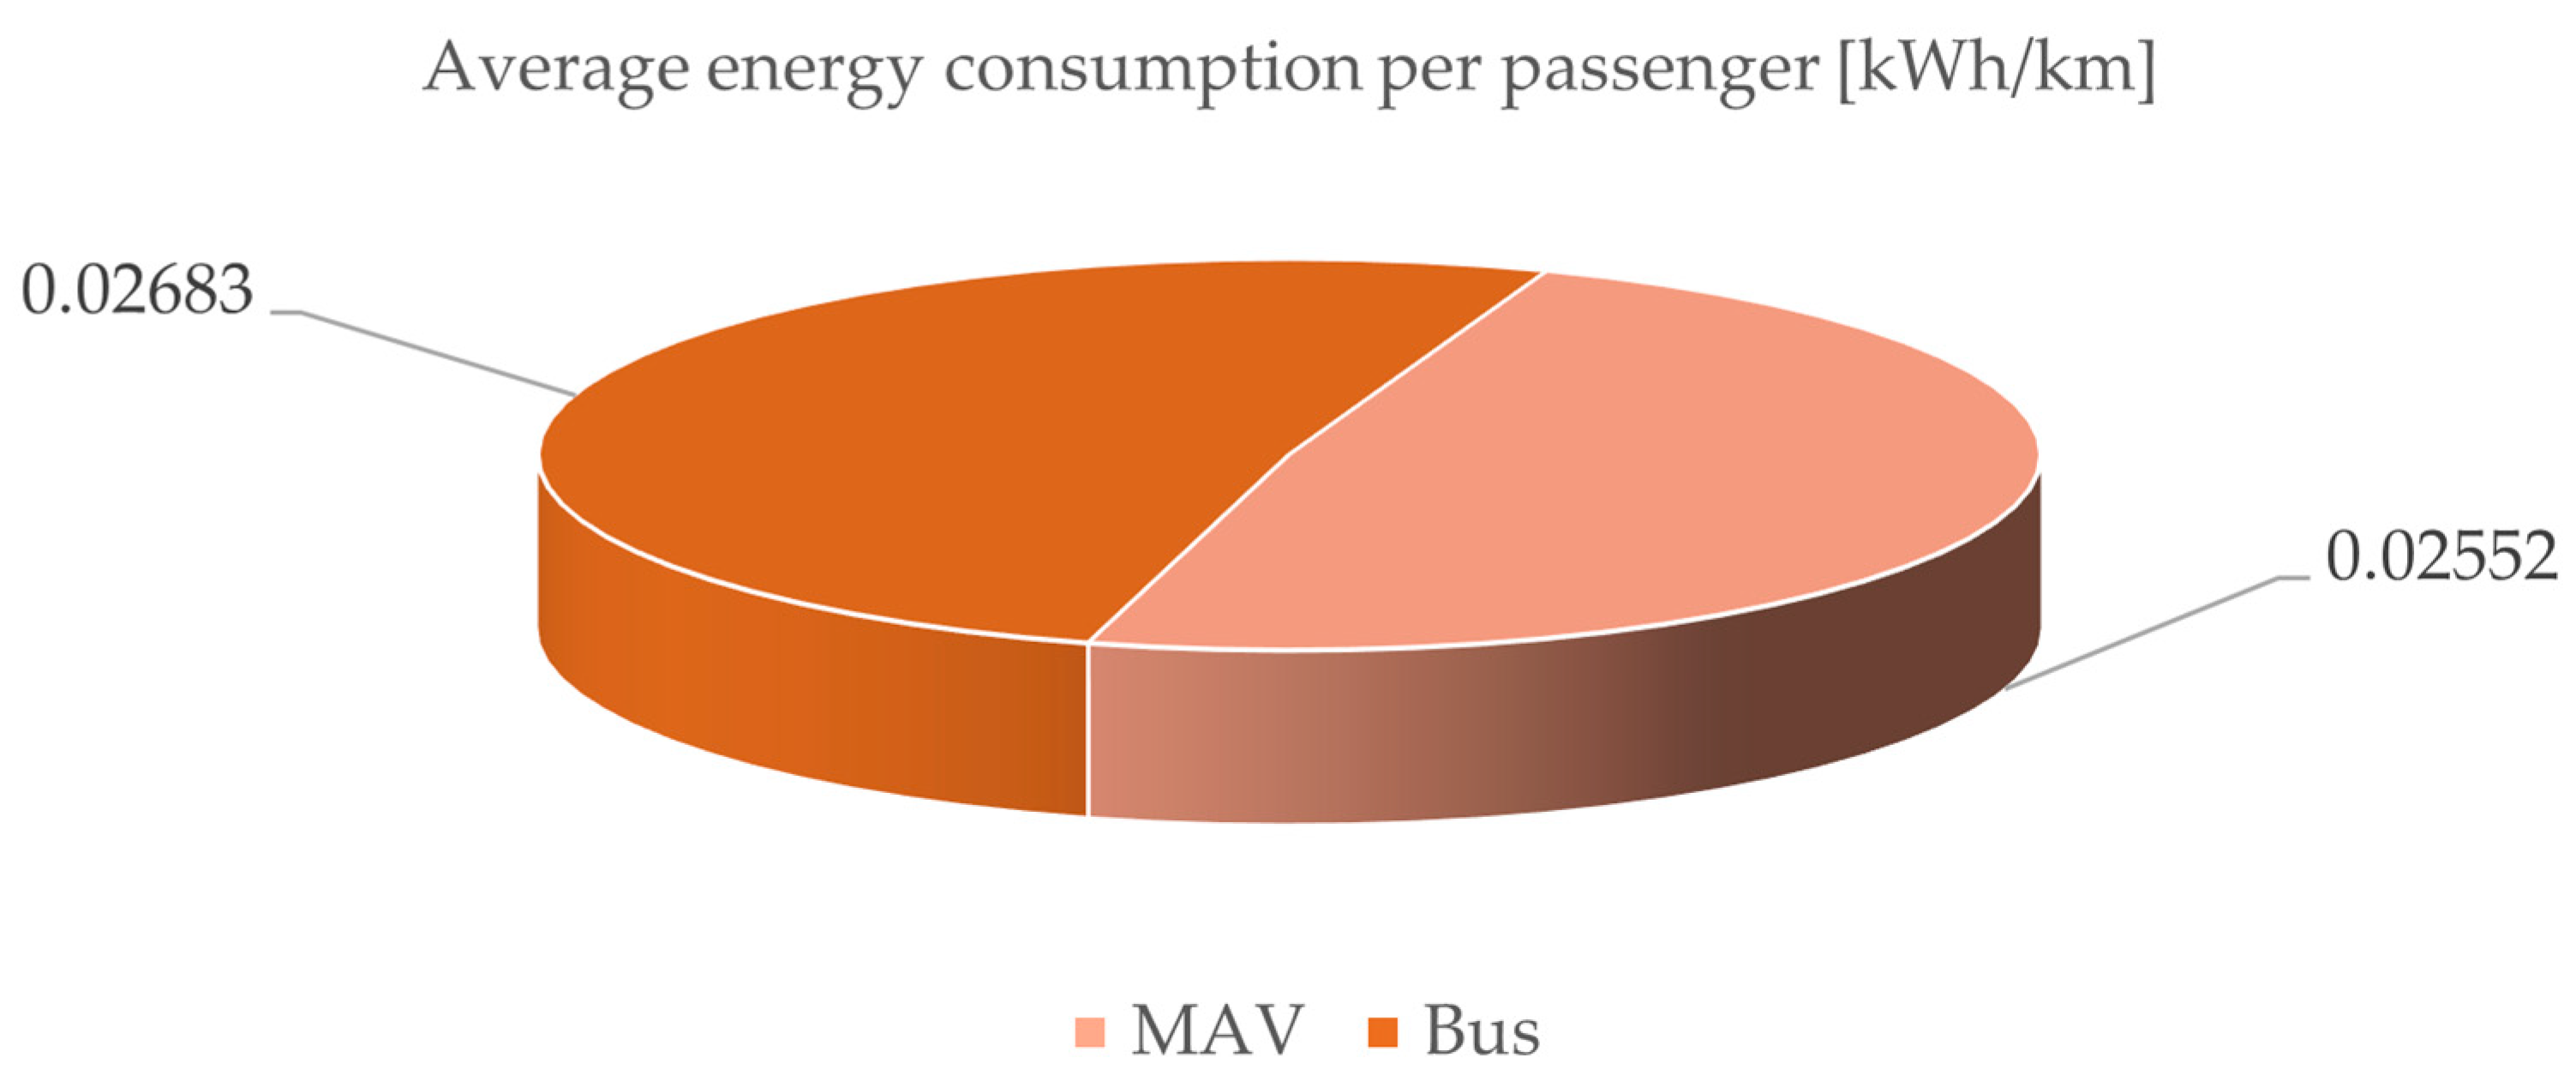
Figure 13 presents a detailed graphic that provides a comparative analysis of the average energy usage per passenger for the two urban mobility alternatives. The maximum passenger capacity of one MAV module is 12, while a road train of four modules will have a maximum capacity of 48 people. In the case of the BEB, the maximum considered capacity is 60 people. With the purpose of evaluating the overall energy consumption per passenger, the data clearly demonstrates a consistent benefit for the MAV solution, with an efficiency edge of about 5% per passenger compared to other mobility options. The consistent advantage emphasizes the inherent efficiency and effectiveness built into the MAV structure, highlighting its potential as a sustainable and friendly transportation choice.
The simulated scenarios use a route of 14.2 km (from the airport to the most Western part of the city) and another of 10.5 km. In order to serve multiple distinct transport routes, multiple vehicles are required, regardless of their setup (BEB or MAV). The MAV system allows flexibility in resource allocation, using all four modules (in the presented case) together, while the BEB solution implies using two vehicles (in the presented case) for it to cover the two distinct travel routes.
It is important to note that the effect of weight distribution on energy consumption varies depending on factors such as traffic conditions and the location of heavy components within the bus, such as the battery pack or electric motor. A rear weight distribution may result in higher energy consumption due to increased resistance and the need for more frequent braking and acceleration in certain traffic scenarios, such as hilly terrain or frequent stops. Furthermore, the placement of heavy components can impact the vehicle’s overall balance and stability, potentially affecting its energy efficiency. As a result, while an even distribution in the middle may result in better overall energy efficiency, other factors that may interact with weight distribution and impact the overall performance of the electric bus in real-world scenarios must be considered.
The weight distribution within each vehicle affected its overall handling and maneuverability. When weight was concentrated in the rear, it influenced acceleration and braking performance, potentially resulting in longer braking distances and reduced acceleration capabilities. Similarly, the weight distribution of the bus influenced its cornering ability, with rear-heavy configurations potentially affecting stability during turns. These findings emphasize the interconnected nature of weight distribution and the various performance parameters of electric buses and autonomous vehicles, emphasizing the importance of weight distribution in optimizing their overall operational characteristics and energy efficiency.
The simulation of autonomous vehicles comprises a complex interaction of multiple dynamic parameters that may significantly affect their performance and feasibility in real-world environments. A principal factor to take into account is the environmental circumstances. Temperature and humidity might impact the functioning of autonomous cars. The effectiveness of the vehicle’s components may be affected by extreme temperatures, while variable humidity levels impact the accuracy of sensors. Therefore, it is necessary to conduct detailed simulations that include a wide range of environmental conditions.
Other crucial factors are the vehicle’s velocity and the effectiveness of the regeneration systems. They are of foremost importance, and they impact the total range and energy consumption of each vehicle.
Moreover, the complexities of routes and their inclines have a noteworthy influence on the performance of autonomous vehicles. In order to test the vehicle’s capacity to move efficiently over multiple landscapes while ensuring safety and energy efficiency, simulations must accurately reproduce a wide array of routes that include distinct terrains and heights.
The upcoming simulations will play a vital role in validating the installation of AVs, particularly given that the municipality is about to assume ownership of these vehicles in the near future. These simulations are crucial for ensuring smooth integration and performance in the municipality’s infrastructure. They will allow for comprehensive testing and improvement to ensure the safe and efficient functioning of AVs in real-world situations.
4. Discussion
As global trends in the transport industry focus on integrating more software into the products and using advanced computing power and equipment to evolve and optimize the basic concepts of functioning, the autonomous vehicle sector continues to grow further. Connected autonomous vehicles are showing up in various private and public applications, leading the way to more advanced and interconnected road networks. The work carried out now by emerging vehicles is paving the road to a future in which an increasing number of vehicle roles are taken over by autonomous cars (e.g., door-to-door delivery, cargo transport, people public transport, etc.).
In fixed route scenarios, such as the ones considered in this paper, the deployment of autonomous vehicles proves to be beneficial in reducing the running costs of shuttle and bus services by eliminating the cost of the driver and exploiting the powertrains and vehicles as a whole in an optimized and safe manner. In 2021, N. Goberville et al. have analyzed the techno-economic implications of autonomous and electric shuttles, concluding that the economic savings of autonomous fleets are directly linked to the size of the shuttles, ranging from 72% for small vehicles down to 35% for extra-large examples [
32].
One of the basic purposes of CAVs is to revolutionize the way we think about transport and optimize each sector and possible application. For a large number of those scenarios, MAVs are a feasible solution that needs to be explored in more detail. As large manufacturers express interest in self-driving and interconnected vehicles, it is just a matter of time for Modular Autonomous Vehicles to become more popular and used on a larger scale. Being a relatively new topic in the industry, the last two decades have opened the doors for rapid development in this area, as technology is more advanced and accessible than ever before. Benefiting from this accessibility are also the smaller companies or start-ups, which can pitch innovative ideas and concepts, leading to faster validation and implementation of the most fitting solutions.
Considering the obtained data from the above-presented simulation actions and analysis, the below points can be considered for further research and studies on specific cases of MAV applications in existing public transport networks, but also in newly developed systems that can accommodate more easily the necessities and benefits of such vehicles:
The basic concept of using multiple modules with the combined capacity of an existing bus leads to a more efficient way of transporting passengers, as the capacity of the vehicles is used in an optimal way, considering the live demand of the network and external factors as well. Reducing times in which vehicles are riding empty is key to reducing the energy consumption of an entire fleet.
The study identified that weight distribution has a significant impact on energy consumption, with a front-weighted distribution using less energy than a rear-weighted configuration. When the weight was evenly distributed in the middle of each vehicle, the most advantageous scenario was noticed. It is important to note, however, that these findings may vary depending on traffic conditions and the placement of heavy components such as the battery pack or electric motor. Furthermore, weight distribution was discovered to influence parameters such as acceleration, braking, and cornering performance, emphasizing the interconnected nature of these variables.
Although the current results show impressive progress, there is still a promising opportunity for further improvement: the incorporation of independent electric motors in each wheel. This methodology shows potential for enhancing the efficiency, accuracy, and management of self-driving vehicles. The utilization of an individual motor in every wheel enhances the system’s agility and response, leading to improved vehicle dynamics and efficiency while simultaneously reducing energy waste.
Advanced fleet management systems become a necessity, once CAVs become more common and take over multiple transportation tasks. The coordination of the vehicles by using advanced optimization algorithms or artificial intelligence is a clear development direction.
For a large part of transportation tasks, MAVs can be adapted with the main goal of optimizing the existing networks. Reduction of energy consumption is facilitated by such improvements, which can also bring comfort benefits to the users (e.g., shorter waiting times, less crowded areas, and less traffic).
New possibilities in software development emerge, together with new applications for diverse types of vehicles in the industry. As one industry adopts the products of another, a prosperous relationship is created between the two.
Completely overhauling the current infrastructure is not absolutely essential. Due to the fast advancement and growing availability of technology, there is potential to address the current lack of readiness in specific sectors. The dynamic nature of technical progress provides an opportunity to address gaps without requiring a total rebuild. As technological developments become more widespread and flexible, they have the potential to strengthen and reinforce weaknesses in infrastructure.
The authors should discuss the results and how they can be interpreted from the perspective of previous studies and the working hypotheses. The findings and their implications should be discussed in the broadest context possible. Future research directions may also be highlighted.
5. Conclusions
Considering the above-mentioned, the cumulated energy consumption of the BEB solution is therefore higher while transporting the same number of passengers at night. The MAV solution proves to be more energy efficient due to its ability to make better use of the available passenger capacity, decreasing the riding time in which the vehicle is driving with a number of passengers less than half of its total transporting capacity. This mode of operation allows for optimized use and more easily predictive wear of the transport equipment while maintaining the same performance, if not exceeding the previous performance in public transport tasks (i.e., waiting and traveling times, traffic safety, user friendliness, social perception of public transport, etc.)
In the early stages of research on this particular case of MAV applications for the airside and landside of the International Airport of Cluj-Napoca, Romania, a positive impact on energy efficiency is identified. These benefits represent a step towards the goals of the hOListic Green Airport (OLGA) research project: reducing the pollutant emissions per passenger to and from the airport. This comparative study comes in support of the proposed Mobility-as-a-Service solution, which links airside and landside activities in order to offer seamless transportation for people arriving in the city by plane and traveling to residential areas or points of interest in the city during the night.
From this initial analysis, our research work will branch out into diverse directions, including on-site testing, simulations, and measurements of CAVs and MAVs for airside and landside operations, integration of such equipment into existing urban transport fleets, and advanced scheduling of transport networks using machine learning algorithms to serve as planning and fleet management systems that can extract the full potential of modular vehicle configurations for everyday transport needs.
In the specific case of Cluj-Napoca, Romania, similar to the majority of European cities, the success of this MaaS solution depends on aVs ability to freely operate and be tested on public roads and in airports or other closed areas, such as campuses, warehouses, factories, technological or industrial parks, etc. The integration of self-driving vehicles and their modular configurations (MAVs) depends on policymakers’ actions in developing an appropriate legal framework for autonomous driving systems (ADS) testing and operation on public streets. Future research on this topic may include specific implications of CAV operations in existing transport networks, their benefits to traffic safety, or long-term running costs, as well as challenges in fleet management complexity, upfront acquisition costs, and more. Studies should focus on creating a know-how database in support of the development and updates of current regulations on ADS. The authors strongly recommend the analysis of current and ongoing studies on smart and sustainable mobility solutions in order to ensure the completeness of legal frameworks, aiming for safer and more sustainable transport in support of society’s benefits.


 ,
, 


