Abstract
The detection of faults during an operational process constitutes a crucial objective within the framework of developing a control system to monitor the structure of industrial mechanisms. Even minor faults can give rise to significant consequences that require swift resolution. This research investigates the impact of overtension in the tooth belt transmission and heating of the screw transmission worm on the vibration signals in a robotic system. Utilizing FFT techniques, distinct frequency characteristics associated with different faults were identified. Overtension in the tooth belt transmission caused localized oscillations, addressed by adjusting the acceleration and deceleration speeds. Heating of the screw transmission worm led to widespread disturbances affecting servo stress and positioning accuracy. A fuzzy logic algorithm based on spectral analysis was proposed for adaptive control, considering the vibration’s frequency and amplitude. The simulation results demonstrated effective damage mitigation, reducing wear on the mechanical parts. The diagnostic approach, relying on limited data, emphasized the feasibility of identifying transmission damage, thereby minimizing maintenance costs. This research contributes a comprehensive and adaptive solution for robotic system diagnostics and control, with the proposed fuzzy logic algorithm showing promise for efficient signal processing and machine learning applications.
1. Introduction
Industrial robots are a cornerstone of modern automated manufacturing, spanning various industries. Their extensive and diverse applications, such as assembly lines, transportation, and complex and costly processes, underscore their indispensable role in contemporary society [1,2]. However, the precise and uninterrupted operation of these mechanisms depends on the seamless functioning of all their systems, including power components, control systems, and mechanical connections. Disruptions to any of these parts can lead to production failures and the loss of material and energy resources [3,4].
Typically, diagnostic systems embedded in robot controllers are oriented toward monitoring the condition of the power components and control systems of the robot. While such systems allow for monitoring the operation of the robot’s main units and detecting malfunctions, they often overlook smaller mechanical connections, such as gearboxes, hinges, and other elements. The inability to track the behavior of mechanical connections makes these robot parts the most challenging for fault detection, potentially resulting in serious consequences, including complete robot failure [1,3].
The diagnosis of faults in robots uses many methods [3,5,6]:
- Mathematical methods (fast and short-time Fourier transform, continuous wavelet transforms) [7,8];
- Modeling methods (fuzzy logic, machine learning, and other artificial intelligence methods) [8,9];
- Condition monitoring methods (control currents, temperature of mechanical parts, noise control, etc.) [10,11].
Therefore, for diagnostics, each of the methods presented has its own scope of application and is used to achieve various goals [1,6,7]. The mathematical methods are a powerful tool for evaluating and analyzing data, thereby identifying anomalies in the behavior of the mechanism. The modeling methods offer predictive and control capabilities, assessing discrepancies in the data obtained [11,12]. The condition monitoring methods enable real-time data acquisition, constantly evaluating possible deviations from normal operation, thereby allowing problems to be detected before a failure occurs.
The application of fuzzy logic-based diagnostic and control methods is of particular interest in the context of identifying faults in the mechanical parts of the robot. This approach avoids the use of precise mathematical models and ensures operation even if the integrity of the input data is compromised, in conditions in which other methods are least effective. The fuzzy logic algorithm processes information in such a way as to create a reliable system for diagnosing, controlling, and rectifying faults in challenging operating conditions [13,14].
The use of fuzzy logic principles allows for the adequate and adaptive adjustment of the robot’s operating characteristics, taking into account uncertainties. This enables the maintenance of operational reliability, timely detection of damage, and determination of preventive measures for preserving structures and for their maintenance. Integrating such a system based on fuzzy logic is a way to enhance the stability and reliability of mechanisms, reduce equipment downtime, and improve performance in changing conditions [15,16].
This article is organized as follows: Section 2 of this article is a description of a Cartesian robot and its diagnosis system with a controller. The main faults detected by the controller are shown. Section 3 illustrates the gearbox structure of the Cartesian robot and includes the benefits and limitations of each part. Based on this information, the main gearbox faults are described. Section 4 describes the methodology used for generating the results of this article. Section 5 presents the specification of the test bench, the diagnosis results, and their description. Based on these results, the fuzzy logic algorithm was built. This section also shows the fuzzy logic algorithm modeling results for control parameters and fault type diagnosis.
2. Cartesian Robot Description
The Cartesian robot is a commonly found industrial robot in production [17]. This type of robot is used for any task, like moving details in the technological lines, working with dangerous materials, and accurate processes. Cartesian robots have different structures for any purpose [18]. The sketches of the main types of it are presented in Figure 1.
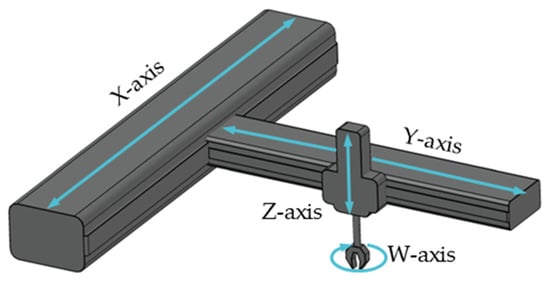
Figure 1.
The sketch of Cartesian robots with fourorthogonal axes.
As seen from the figure, Cartesian robots have a few degrees of freedom. This means that the diagnosis system should have a special base of rules for each axis.
2.1. Hirata Cartesian Robot
The Hirata Cartesian robot (HCR), described in this research, is a Cartesian robot consisting of four axes set up perpendicular to each other. This robot was designed to work with special attachments and devices, for the implementation of different operations in which humans cannot participate [19,20]. A view of the HCR is presented in Figure 2.
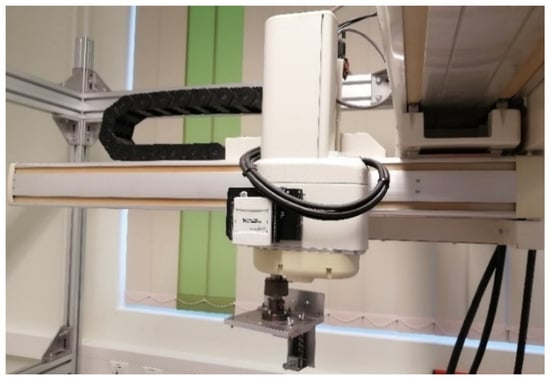
Figure 2.
The view of HCR.
2.2. Diagnosis System of the HCR
The diagnosis system of the HCR consists of the controller, the teach pendant, and various sensors, such as overload and origin sensors, limited switches, and encoders [19,21]. The view of the controller and teach pendant of the HCR are presented in Figure 3a,b.
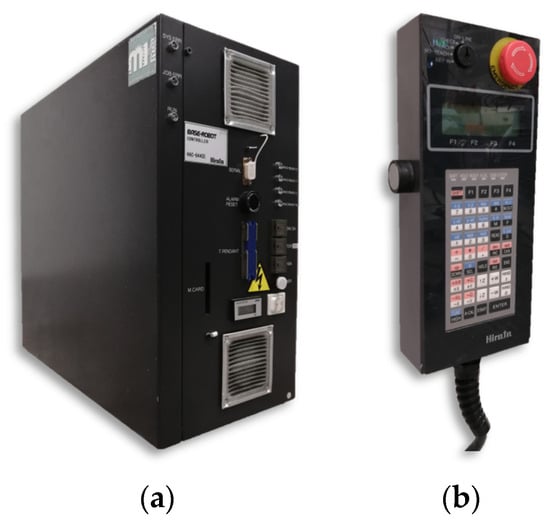
Figure 3.
The view of the controller (a) and teach pendant (b) of the HCR.
Before starting work, the auto-calibration (A-cal) of the HCR should be executed. The A-cal mode is a regime for automatically returning the robot axes to their original positions and checking whether any faults are connected to the control and power systems of the robot. In this mode, the state information is executed [19,21].
The main faults are detected in the power and control systems of the robot. The list of the main faults is presented in Table 1. When a fault occurs in the controller or servo drive of the robot during the work process, a message about failure appears on the teach pendant [19,21].

Table 1.
The list of main faults of the HCR.
The message “XXXX” shows the status of each axis of the robot. For example, the message “0101” means the faults occurred at the Y and W axes of the HCR.
The diagnosis system of the HCR may detect faults only in the control or power system of the robot. However, in the mechanical parts of the robot, such as gearboxes and joints, detection does not exist. The diagnosis system of the robot generates warnings and stops the mechanism only after fault consequences occur. This means that the mechanical parts of the robot are the weakest places; the robot is subject to the devastating consequences of even the slightest damage in case of failures occurring here [19,21].
3. HCR Gearbox
The gearbox of the HCR consists of two types of transmissions: tooth belt transmission (TBT) and screw transmission (ST). The TBT provides constant resolution for each axis with high accuracy, and the ST provides smooth movement of the robot. The sketch of the gearbox is presented in Figure 4.
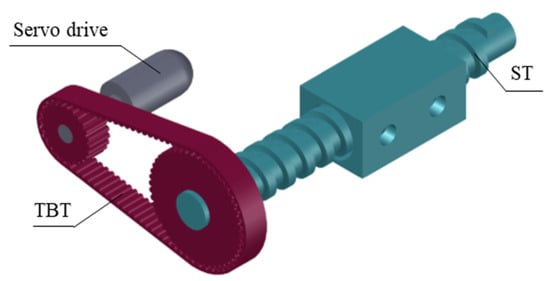
Figure 4.
The sketch of the gearbox of the HCR.
Each of the gearbox parts has benefits and limitations that influence the Cartesian robot’s work.
3.1. Tooth Belt Transmission
The benefits of the tooth belt transmission are a constant gear ratio, no need for lubrication, quiet work, and lack of undesirable vibrations. Consequently, the TBT has a large torque-carrying capacity, transmits mechanical power with constant speed, and lacks slippage between pulleys and timing belts. The limits of the TBT are associated with its benefits. The work of the TBT is provided by the tension of the timing belt. In this case, the tension adds resistance to torque and additional load to the motor shaft. Also, one of the conditions for normal working of the TBT is pulley alignment [22,23]. The real view of the tooth belt transmission of the gearbox is presented in Figure 5.
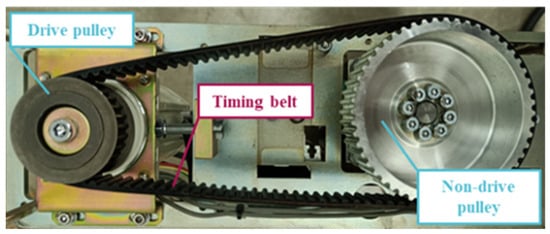
Figure 5.
View of the tooth belt transmission.
3.2. Screw Transmission
Just like the tooth belt transmission, the screw transmission has a number of similar benefits, such as quiet and smooth motion, lack of undesirable vibrations, and simple design. Also, the ST has a high load-carrying capacity, self-deceleration property due to high inertia, and compact construction, which minimizes the needed length of the work area. The limits of the ST are low efficiency and additional wearing during the mechanism’s operation. In this case, expensive antifriction materials and lubrication must be used to avoid constant repairing of the transmission [24]. The real view of the screw transmission of the gearbox is presented in Figure 6.
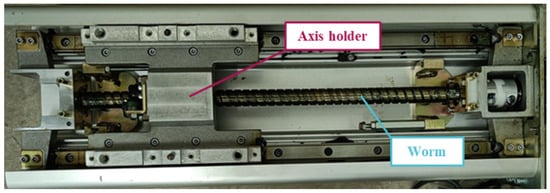
Figure 6.
View of the screw transmission.
Based on the listed properties, the gearbox provides control of the HCR without significant noises, additional vibrations, and other disturbances. Also, this combination of transmissions leads to the following control characteristics of the robot as presented in Table 2 [20].
Table 2.
Axis characteristics of the HCR.
The construction of the robot provides a good combination of speed and accuracy. In this case, the robot can work with various conditions and different processes, such as 3D-printing, movement processes, or working with dangerous materials and environments.
3.3. Gearbox Faults
The faults that occur during the working of the HCR have different characteristics and lead to various consequences. Any smaller deviations from nominal work have a possibility to cause serious damage to the robot and production. Besides the listed benefits and limitations, the gearbox has a few failures, such as heating, overtension of the timing belt, and jamming or teeth cracks [3].
Overtension of the timing belt occurs due to the misalignment of the transmission pulleys. In the case of misalignment by the vertical axis, high tension and skewing of the belt occur, leading to an additional load on the servo drives and resistance torque on the servo drive shaft. On the other hand, misalignment by the horizontal axis leads to low tension of the timing belt; however, in this case, the belt may fly off the pulley, and the robot will stop without any damage. Low tension works like a damper in the case of the HCR gearbox [18,25]. An example of displaced pulleys and, consequently, overtension of the belt is presented in Figure 7.
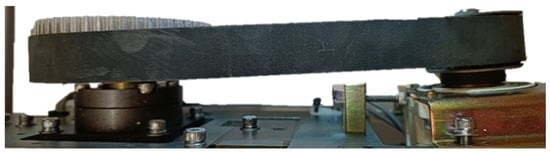
Figure 7.
Example of the overtensioned timing belt of the gearbox.
The gearbox heats up under the following circumstances: when there is no lubricant, in conditions of high pollution, and if the gearbox part is under voltage. This failure leads to additional vibrations in the whole work area of the gearbox. As a result, the accuracy of the robot is reduced, and the wear of the gearbox material (tooth wheels, worm, screw mechanism, etc.) is increased. This failure is the second most common error that occurs in this type of gearbox. Usually, this mechanical damage refers to the parts of the transmission that are subject to continuous contact [24,26]. An example of the effect of heating on the screw worm of the gearbox is presented in Figure 8.
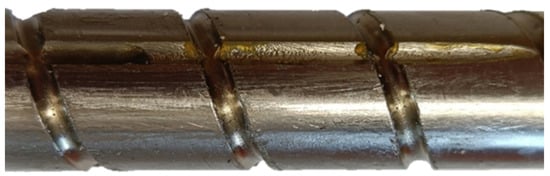
Figure 8.
Example of the effect of heating on the screw worm of the gearbox.
Jamming or teeth cracks occur in two ways. The first part of this fault is fatigue of the metal, and the second part is unbalanced parts of the gearbox or loss of structural rigidity. Jamming of the gearbox leads to intermittent vibrations or a full stop of the robot. Teeth cracks provide cycle vibrations and deviations from the nominal accuracy and positioning of the robot [26,27]. An example of a broken pulley, in case of the appearance of a foreign body, is presented in Figure 9.
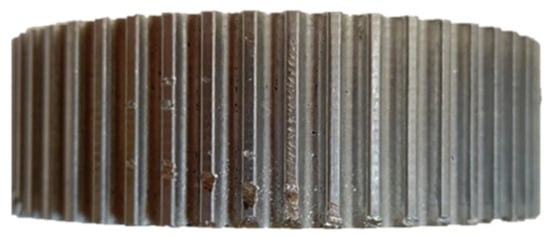
Figure 9.
Example of pulley teeth cracks of the gearbox.
4. Diagnosis and Control Methods
Every fault that arises during robot operations possesses a distinct spectrum, which can be monitored through a few different methods. This study employed two specific methods. The initial approach involved utilizing the fast Fourier transform, enabling the assessment of various vibrations present in the output signal. The second method employed a fuzzy logic algorithm, thereby enabling the development of a control system that permits the robot to continue functioning under faulty conditions.
4.1. Fast Fourier Transform Diagnosis Method
The fast Fourier transform (FFT) is a sophisticated algorithmic technique widely employed in various fields of science, engineering, and mathematics. This transformation allows for the analysis of complex signals and the extraction of information about their frequency components [28,29].
The FFT technique finds applications in diverse fields, including signal processing, telecommunications, image processing, audio analysis, scientific computing, and many more. It allows researchers, engineers, and analysts to quickly analyze and manipulate signals in the frequency domain, enabling tasks such as filtering, spectral analysis, correlation, convolution, and data compression. Its efficiency has made it an indispensable tool in digital signal processing, providing the capability to handle real-time data streams and process vast amounts of information with minimal computational overhead [30,31].
The fast Fourier transform method is a groundbreaking algorithm that has transformed the landscape of digital signal processing and numerous related fields by providing an efficient means to compute the discrete Fourier transform. Its ability to drastically reduce the computational complexity of this operation has made it a cornerstone in modern scientific and engineering applications, allowing for the exploration and extraction of valuable insights from complex datasets in the frequency domain [32,33].
4.2. Fuzzy Logic Control Method
The fuzzy logic control method is an advanced computational approach used to make decisions and draw conclusions in situations in which the boundaries between different states or conditions are not well defined. Rooted in the principles of fuzzy logic, this method is particularly effective when dealing with complex and uncertain systems in which traditional binary logic might fall short [34].
Unlike classical logic, which relies on crisp definitions of true or false, fuzzy logic allows for degrees of truth to be expressed. It accommodates the inherent imprecision and uncertainty present in many real-world scenarios, making it well suited for diagnostic applications across various fields such as engineering, medicine, finance, and more [35,36]. The working scheme for fuzzy logic is illustrated in Figure 10.
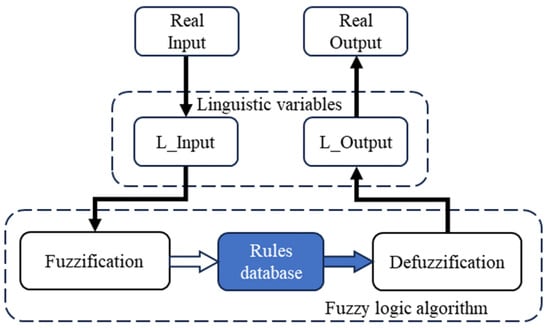
Figure 10.
General scheme of the fuzzy logic algorithm.
The fuzzy logic algorithm operates through several key stages:
- Identification of linguistic variables: Initial parameters are established to construct descriptions for input and output variables. For example, the variable “speed” is defined with specific values, such as “slow” or “fast”.
- Establishment of fuzzy sets: Each linguistic variable and its corresponding value are defined by a fuzzy set, characterized by a membership function. These functions, which can take various forms like triangular or Gaussian, enable the flexibility of fuzzy logic, eliminating the need for precise mathematical models.
- Fuzzification: Input variables are matched with their respective membership functions to generate a fuzzy output, determining the degree of membership of the input variable within a specific fuzzy set.
- Formulation of fuzzy rule base: Fuzzy rules are defined that dictate the algorithm’s actions based on combinations of input variables. These rules, based on linguistic variables and sets, employ logical operations like AND/OR to organize them into relevant categories.
- Defuzzification: The inverse process of fuzzification, converting the degree of membership of the output parameter based on fuzzy rules into a numerical value. This numerical value guides subsequent control actions.
The fuzzy logic control method excels in scenarios in which uncertainty and imprecision are prevalent, such as medical diagnosis, fault detection in complex systems, risk assessment, and decision-making in dynamic environments.
5. Experimental Part
5.1. Experimental Test Bench
A test bench was built for conducting experiments. The view of the test bench is presented in Figure 11.
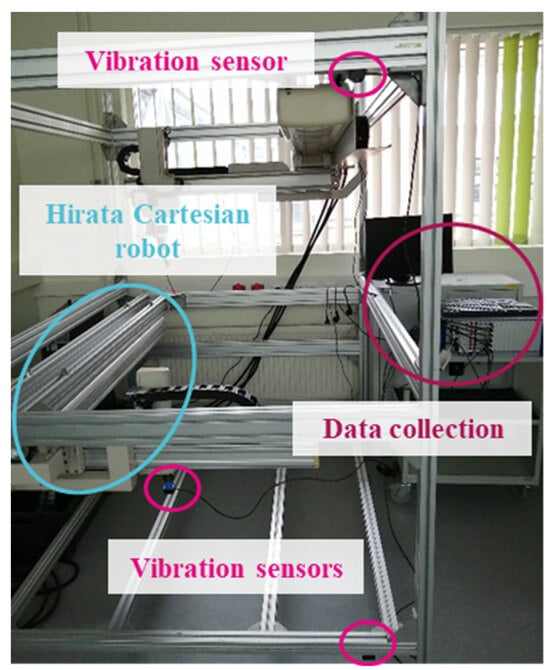
Figure 11.
View of the experimental test bench.
The test bench consists of the Hirata Cartesian robot, the data collection system based on Dewetron, and three vibration sensors installed on the grab system of the robot and the top and bottom of the test bench.
The main sensor for measuring robot vibrations is installed on the Z-axis, directly on the gripping system. This placement allows the tracking of vibrations along both axes of the robot. The sensors placed above and below the laboratory stand structure are intended for measuring the stand’s vibrations to eliminate additional noise from the main signal. This approach helps mitigate the influence of the stand’s vibrations on the magnitude of the main sensor’s signal. Accelerometers of the DIS QG40N-series (DIS Sensors, Soest, Netherlands) were used for the experiment. The technical specifications of the sensor are presented in Table 3.
Table 3.
Technical specification of DIS QG40N.
Gearbox faults were sequentially introduced into the robot’s structure. To obtain the necessary data, artificial faults were separately created in the gearbox, namely, overtension of the tooth belt transmission and heating of the screw transmission. For overtension of the belt, a displacement of the transmission pulleys was performed, as this type of damage is the most common. For heating the worm, lubrication was removed, simulating the case of contamination/drying of lubrication in the transmission.
During the experiment, several conditions were established: a minimum rotation speed of the robot’s servo motor was set (200 rpm/s) to avoid unwanted damage. Measurements were conducted along two axes of the robot, X and Y, the robot movements were linear to track changes in the reference and faulty signals.
The experiment consisted of the following steps:
- Data acquisition, collection of all data from vibration sensors by unfaulty (reference) and faulty signals. The vibrational signal, captured by accelerometers, was converted into an electrical signal, and proceeded into Dewetron inputs for processing, visualization, and storage.
- Data processing, transformation of output vibration signals into spectra to obtain vibration amplitude analysis. Following data collection, Fourier transform analysis was performed to analyze the acquired data. Also, to eliminate unwanted noise by comparing signals from the accelerometers, Matlab (9.10.0.1602886, R2021a) filters were used.
- Compilation of fuzzy logic rules library based on the spectra. Based on spectral analysis, data collection was conducted, and a rule base for the fuzzy logic algorithm was developed. This formed the foundation for the diagnostic and control system.
- Development of a fuzzy logic control system.
5.2. Diganosis Results
During the experiment, vibration signals were acquired as the output. To analyze the frequency characteristics of these signals, the FFT technique was employed. The resulting spectra from this analysis of the tooth belt transmission due to overtension, captured along two axes, are presented in Figure 12a,b.
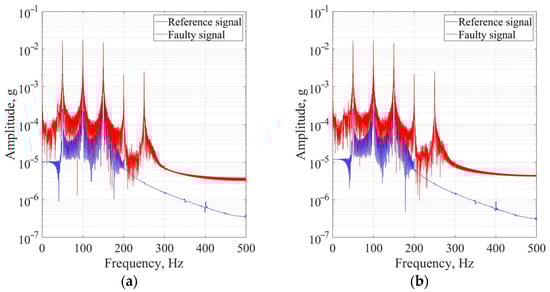
Figure 12.
The spectral analysis of the output vibration signal by X-axis (a) and Y-axis (b) for the overtension fault of tooth belt transmission.
The graphs depict two signal types: a reference signal representing the transmission belt’s normal tension (as per factory settings) and a faulty signal indicating overtension caused by a shift in the pulley axes’ center. As seen from the reference signal, the nominal frequencies of the HCR gearbox were at the level 50, 100, and 150 Hz.
The additional noises that manifest between the main frequencies are oscillations of other robot parts that cannot be rigidly fixed, such as cable lines and protective metal structures. The nominal amplitude of the robot structure oscillations should not exceed 0.3 g. Considering the low noise amplitude, the presence of various frequency ranges, and the appearance of additional frequencies when the robot breaks down, which can be used to determine the type of damage, noise can be disregarded for the optimization and simplification of algorithm operations.
The belt overtension in the tooth belt transmission results in frequent oscillations occurring at the transition points within the robot’s operational area. Transition points refer to instances in which the robot changes direction during its movement. Consequently, the tension of the belt affects the robot’s performance only at specific locations within its operational space. Furthermore, the spectrum analysis highlights that the frequencies of vibration of the belt overtension are at the level of 200–250 Hz.
The resulting spectral analysis of the screw transmission, captured along two axes, in the case of the heating fault, is presented in Figure 13a,b.
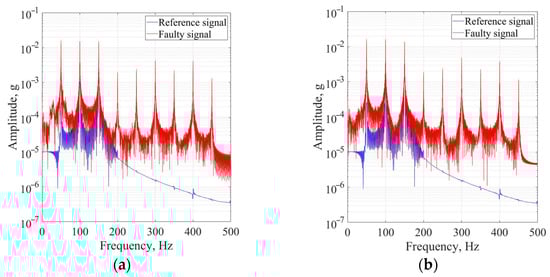
Figure 13.
The spectral analysis of the output vibration signal by X-axis (a) and Y-axis (b) for the heating fault of screw transmission.
In contrast to the negative consequences of overtension in the belt, damage to the torque transmission worm can result in significant disturbances throughout the entire path of the robot’s movement, affecting not only specific points.
These vibrations can lead to increased stress on the robot’s servos, reduced positioning accuracy, and significant wear on other components of the mechanism. Furthermore, an analysis of the vibration spectrum indicated that these vibrations were not cyclic but rather stochastic, making their elimination and reduction of their impact more challenging. One proposed method to mitigate the effects of errors in the robot’s design is to increase the torque in the servo drive to prevent potential gear jamming. Also, the frequency vibration diapason is wider than that in the case of the overtension fault and is equal to 200–450 Hz.
Based on subsequent comparisons of the frequency spectra, it is possible to develop a fuzzy logic algorithm that will determine the extent of damage in the transmission and propose corresponding speed and torque patterns for the robot control system.
5.3. Fuzzy Logic Algorithm Results
Based on the information obtained from the spectral analysis, it is possible to create a fuzzy logic algorithm for the diagnosis and control of the robot. Depending on the amplitude and vibration frequency, it is necessary to control the speed, torque, and acceleration of the moving parts of the robot. Diagnosis according to the fuzzy logic algorithm should be based on the frequency spectrum of the vibrational signal and the presence of vibration amplitude, i.e., the presence of low-frequency signals with a high fault amplitude, as well as high-frequency signals with low or high fault amplitudes. This will indicate transmission damage, and depending on the frequency range, the type of failure will be determined. The scheme of the fuzzy logic algorithm process is presented in Figure 14.
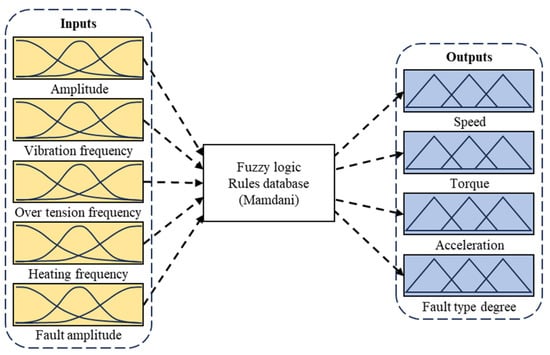
Figure 14.
The scheme of the fuzzy logic algorithm process.
The membership functions of input and output variables that determine the fuzzy logic algorithm to control robot servomotors are presented in Figure 15a,b.
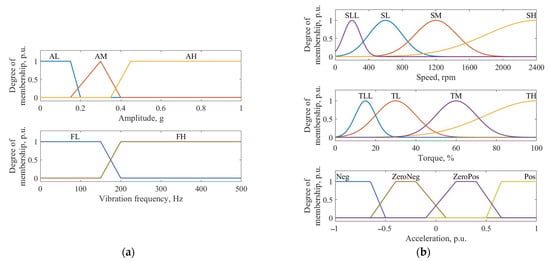
Figure 15.
The control membership functions of input (a) and output (b) variables.
As seen in Figure 15, each membership function describes the linguistic variable. For the inputs, the variables were AL, FL—low amplitude and frequency of vibrations; AM—medium amplitude; AH, FH—high amplitude and frequency. For the outputs, the variables were SLL, TLL—minimum speed and torque of the servomotor; SL, TL—low speed and torque; SM, TM—medium speed and torque; SH, TH—high speed and torque; Pos, Neg—racing and braking of the robot, respectively; ZeroPos, ZeroNeg—weak acceleration and deceleration of the robot. The form of the membership functions was chosen in such a way that the input variables corresponded to the data based on the spectral analysis. The output variables were designed to ensure the smooth control of speed and torque, as well as maintain the required degree of acceleration or deceleration of the robot.
The membership functions of input and output variables that determine the fuzzy logic diagnosis algorithm for mechanical faults in the robot transmission are presented in Figure 16a,b.
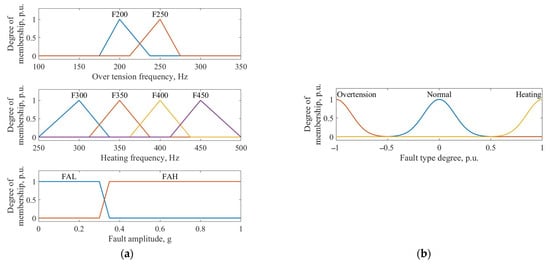
Figure 16.
The diagnosis membership functions of input (a) and output (b) variables.
As seen in Figure 16, for the inputs, the variables were F200, F250, F300, F350, F400, and F450—the vibration frequencies for 200, 250, 300, 350, 400, and 450 Hz, respectively; FAL—low fault amplitude of the vibration, FAH—high fault amplitude of the vibration. For the output, the variable fault types and their magnitudes were chosen in such a way that it was possible to identify mechanical damage in the transmission. Thus, the normal state of the transmission was equal to 0; the presence of belt overtension was equal to −1; and the presence of worm heating was equal to 1.
The modeling results of the control parameters (speed, torque, and acceleration) are illustrated in Figure 17a–c.
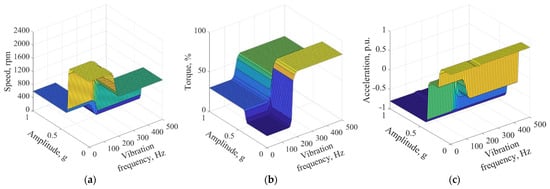
Figure 17.
Results of modeling fuzzy logic algorithm for control parameters speed (a), torque (b), and acceleration (c).
As seen from the simulation results, with an increase in the amplitude and frequency of vibrations, the robot’s speed decreased while the torque increased. This occurred to reduce the impact of vibrations on the robot’s structure and prevent undesirable consequences and further breakdowns. The reduction in speed leads to a decrease in inertia, thereby reducing the amplitude of vibrations, while increasing the torque helps overcome the current impact of damage and diminishes its influence on the transmission. Regarding acceleration, the situation is different. Acceleration depends more on the amplitude of the vibrations than on their frequency, so with an increase in amplitude, the acceleration decreases. This results in the damping of vibrations, stabilizing the entire system.
The rule base of the fuzzy logic algorithm was structured in such a way that the control system’s output parameters contributed to reducing the impact of damage on the transmission while ensuring the mechanical system’s functionality. This ensures minimal wear on mechanical parts and, in turn, does not interrupt the execution of operational tasks, allowing the completion of the work cycle. Moreover, this control method is easily adjustable, making the entire system much more flexible and adaptive.
The modeling results for the diagnosis are illustrated in Figure 18a,b.
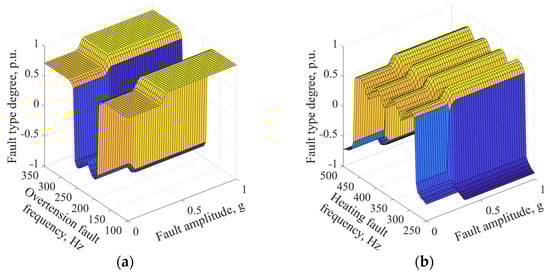
Figure 18.
The control membership functions of input (a) and output (b) variables.
The diagnostic modeling results indicate the likelihood of damage in the transmission. Thus, the closer the output parameter is to the corresponding value for the presence of the corresponding frequency in the vibrational spectrum of the signal (−1 for overtension fault and 1 for worm heating fault), the more likely the presence of damage. By comparing the diagnostic patterns of damage with real signals, it is possible to identify the presence of damage even with a limited amount of data, relying solely on the frequency and amplitude of vibrations. It is important to note that values from the vibration sensor’s input signal should be considered within specific frequency ranges. Therefore, in the presence of the necessary frequencies in the signal spectrum, the onset of damage can be identified even with the slightest amplitude. This diagnostic approach significantly reduces the frequency of repairs, meaning equipment maintenance will occur as needed, reducing overall maintenance costs.
Similar to the control system, this diagnostic system is easily adaptable to various types of damage, making it a versatile solution for signal processing and machine learning.
6. Conclusions
In conclusion, tests on the developed test bench prove the effectiveness of the methodology for diagnosing and controlling mechanical faults in robotic systems. The data collection, processing, and fuzzy logic algorithms to identify and address common issues like belt tension and gear heating in robot transmissions are used.
Analysis of the vibration signals from the experiments gave insights into different fault frequencies. By spotting distinct patterns through spectral analysis, a strong fuzzy logic algorithm for diagnosing and fixing faults accurately based on vibration frequency and amplitude was developed.
The fuzzy logic algorithm effectively adjusts robot parameters like speed, torque, and acceleration to mitigate the impact of faults on the transmission system. This ensures smooth operation while reducing wear on mechanical parts and preventing breakdowns.
The diagnostic modeling results highlight the reliability of the approach in identifying damage in the transmission system, even with limited data. This reduces the need for frequent repairs and lowers maintenance costs.
Overall, our findings emphasize the potential of fuzzy logic-based systems for enhancing the reliability of robots in dynamic industrial environments. The flexible methodology offers real-time fault detection and management, improving operational efficiency and reducing downtime in automated manufacturing processes.
For future work, we plan to explore other types of mechanical damage, upgrade our fuzzy logic rule database, and validate our algorithm for controlling and diagnosing faults. We will also investigate the use of fuzzy logic in machine learning and predictive maintenance. Additionally, our research can aid in setting up digital twins of transmission systems, robots, and other connected elements.
Author Contributions
Conceptualization, S.A.; methodology, S.A.; validation, A.R., T.V. and K.K.; formal analysis, S.A.; investigation, S.A.; resources, S.A.; data curation, S.A., T.V. and A.K.; writing—original draft preparation, S.A.; writing—review and editing, K.K.; visualization, S.A.; super-vision, A.R. and T.V. All authors have read and agreed to the published version of the manuscript.
Funding
The research leading to these results received funding from PSG453, 2020–2024, “Digital twin for propulsion drive of autonomous electric vehicle”.
Institutional Review Board Statement
Not applicable.
Informed Consent Statement
Not applicable.
Data Availability Statement
The data presented in this study are available on request from the corresponding author. The data are not publicly available due to privacy.
Conflicts of Interest
The authors declare no conflicts of interest.
References
- Adam, H.E.A.; Kimotho, J.K.; Njiri, J.G. Multiple Faults Diagnosis for an Industrial Robot Fuse Quality Test Bench Using Deep-Learning. Results Eng. 2023, 17, 101007. [Google Scholar] [CrossRef]
- Alobaidy, M.A.; Abdul-Jabbar, D.J.; Al-khayyt, S. Faults Diagnosis in Robot Systems: A Review. Al-Rafidain Eng. J. 2020, 25, 166–177. [Google Scholar] [CrossRef]
- Autsou, S.; Rassõlkin, A.; Vaimann, T.; Kudelina, K. Analysis of Possible Faults and Diagnostic Methods of the Cartesian Industrial Robot. Proc. Est. Acad. Sci. 2022, 71, 227–240. [Google Scholar] [CrossRef]
- Khalastchi, E.; Kalech, M. Fault Detection and Diagnosis in Multi-Robot Systems: A Survey. Sensors 2019, 19, 4019. [Google Scholar] [CrossRef]
- Autsou, S.; Vaimann, T.; Rassolkin, A.; Kudelina, K. Spectrum Analysis Additional Vibrations of Cartesian Robot by Different Control Modes. In Proceedings of the 2022 18th Biennial Baltic Electronics Conference (BEC), Tallinn, Estonia, 4–6 October 2022; Volume 2022, pp. 1–5. [Google Scholar] [CrossRef]
- Wescoat, E.; Kerner, S.; Mears, L. A Comparative Study of Different Algorithms Using Contrived Failure Data to Detect Robot Anomalies. Procedia Comput. Sci. 2022, 200, 669–678. [Google Scholar] [CrossRef]
- Nentwich, C.; Junker, S.; Reinhart, G. Data-Driven Models for Fault Classification and Prediction of Industrial Robots. Procedia CIRP 2020, 93, 1055–1060. [Google Scholar] [CrossRef]
- Raja, H.A.; Kudelina, K.; Asad, B.; Vaimann, T. Perspective Chapter: Fault Detection and Predictive Maintenance of Electrical Machines. In New Trends in Electric Machines-Technology and Applications; IntechOpen: London, UK, 2023; Volume 11, p. 14. ISBN 978-1-83969-852-1. [Google Scholar]
- Chen, C.C.; Liu, Z.; Yang, G.; Wu, C.C.; Ye, Q. An Improved Fault Diagnosis Using 1d-Convolutional Neural Network Model. Electronics 2021, 10, 59. [Google Scholar] [CrossRef]
- Nentwich, C.; Daub, R. Comparison of Data Sources for Robot Gear Condition Monitoring. Procedia CIRP 2022, 107, 314–319. [Google Scholar] [CrossRef]
- Uhlmann, E.; Polte, J.; Geisert, C. Condition Monitoring Concept for Industrial Robots. Proceedins of the 17th IMEKO TC 10 EUROLAB Virtual Conference “Global Trends in Testing, Diagnostics & Inspection for 2030”, Online, 20–22 October 2020; pp. 253–257. [Google Scholar]
- Kudelina, K.; Vaimann, T.; Rassolkin, A.; Kallaste, A.; Huynh, V.K. Heat Pump Induction Motor Faults Caused by Soft Starter Topology-Case Study. In Proceedings of the 2021 IEEE 19th International Power Electronics and Motion Control Conference (PEMC), Gliwice, Poland, 25–29 April 2021; pp. 454–459. [Google Scholar] [CrossRef]
- Angles Medina, G.C.; Rosas Paredes, K.; Zúñiga Carnero, M.; Sulla-Torres, J. Diagnostics in Tire Retreading Based on Classification with Fuzzy Inference System. Appl. Sci. 2022, 12, 9955. [Google Scholar] [CrossRef]
- Filo, G. A Review of Fuzzy Logic Method Development in Hydraulic and Pneumatic Systems. Energies 2023, 16, 7584. [Google Scholar] [CrossRef]
- Souza, R.T.; Lira, G.R.S.; Costa, E.G.; Oliveira, A.C.; Neto, A.F.L. Methodology for Circuit Breaker Contact Diagnosis through Dynamic Resistance Measurements and Fuzzy-Logic-Based Analysis. Energies 2024, 17, 15. [Google Scholar] [CrossRef]
- Ineza Havugimana, L.F.; Liu, B.; Liu, F.; Zhang, J.; Li, B.; Wan, P. Review of Artificial Intelligent Algorithms for Engine Performance, Control, and Diagnosis. Energies 2023, 16, 1206. [Google Scholar] [CrossRef]
- Malhan, R.K.; Thakar, S.; Kabir, A.M.; Rajendran, P.; Bhatt, P.M.; Gupta, S.K. Generation of Configuration Space Trajectories Over Semi-Constrained Cartesian Paths for Robotic Manipulators. IEEE Trans. Autom. Sci. Eng. 2022, 20, 193–205. [Google Scholar] [CrossRef]
- Autsou, S.; Vaimann, T.; Rassõlkin, A.; Kudelina, K.; Asad, B. Influence of Different Tooth Belt Transmission Faults on the Work of a Cartesian Robot. In Proceedings of the 2022 20th International Conference on Mechatronics—Mechatronika (ME), Pilsen, Czech Republic, 7–9 December 2022; pp. 1–5. [Google Scholar] [CrossRef]
- Shinagawa, T.; Kumamoto, K. Robot Controller User’s Guide; Hirata Corporation: Tokyo, Japan, 2000. [Google Scholar]
- Shinagawa, T.; Kumamoto, K. Base Robot User’s Guide; Hirata Corporation: Tokyo, Japan, 2000. [Google Scholar]
- Shinagawa, T.; Kumamoto, K. Teach Pedant Operation Manual, 6th ed.; Hirata Corporation: Tokyo, Japan, 2000. [Google Scholar]
- Bortnowski, P.; Kawalec, W.; Król, R.; Ozdoba, M. Types and Causes of Damage to the Conveyor Belt—Review, Classification and Mutual Relations. Eng. Fail. Anal. 2022, 140, 106520. [Google Scholar] [CrossRef]
- Chamorro, J.; Vallejo, L.; Maynard, C.; Guevara, S.; Solorio, J.A.; Soto, N.; Singh, K.V.; Bhate, U.; Ravi Kumar, G.V.V.; Garcia, J.; et al. Health Monitoring of a Conveyor Belt System Using Machine Vision and Real-Time Sensor Data. CIRP J. Manuf. Sci. Technol. 2022, 38, 38–50. [Google Scholar] [CrossRef]
- Stojanovic, B.; Tanasijevic, S.; Marjanovic, N.; Ivanovic, L.; Blagojevic, M. Wear as the Criterion of Mechanical Transmitters Working Life. J. Balk. Tribol. Assoc. 2011, 17, 215–222. [Google Scholar]
- Pandya, H.; Kundaliya, D.; Mehta, J.; Gorasiya, J. A Review: Identify Reasons of Timing Belt Failure Analysis with Corrective & Preventive Measures. Int. J. Eng. Dev. Res. 2016, 4, 206–211. [Google Scholar]
- Ling, L.; Rong, W. Failure Analysis on Fracture of Worm Gear Connecting Bolts. Eng. Fail. Anal. 2014, 36, 439–446. [Google Scholar] [CrossRef]
- Tao, Z.; Chen, H.; Zhang, X.; Jiang, Y. Failure Analysis of Worm Gear in Worm Transmission. J. Phys. Conf. Ser. 2021, 1965, 012132. [Google Scholar] [CrossRef]
- Zak, J.; Korzynska, A.; Pater, A.; Roszkowiak, L. Fourier Transform Layer: A Proof of Work in Different Training Scenarios. Appl. Soft Comput. 2023, 145, 110607. [Google Scholar] [CrossRef]
- Zhang, Y.; Xing, K.; Bai, R.; Sun, D.; Meng, Z. An Enhanced Convolutional Neural Network for Bearing Fault Diagnosis Based on Time–Frequency Image. Meas. J. Int. Meas. Confed. 2020, 157, 107667. [Google Scholar] [CrossRef]
- Boldsaikhan, E.; Corwin, E.M.; Logar, A.M.; Arbegast, W.J. The Use of Neural Network and Discrete Fourier Transform for Real-Time Evaluation of Friction Stir Welding. Appl. Soft Comput. J. 2011, 11, 4839–4846. [Google Scholar] [CrossRef]
- Ganapathy, N.; Veeranki, Y.R.; Swaminathan, R. Convolutional Neural Network Based Emotion Classification Using Electrodermal Activity Signals and Time-Frequency Features. Expert Syst. Appl. 2020, 159, 113571. [Google Scholar] [CrossRef]
- Daldal, N.; Cömert, Z.; Polat, K. Automatic Determination of Digital Modulation Types with Different Noises Using Convolutional Neural Network Based on Time–Frequency Information. Appl. Soft Comput. J. 2020, 86, 105834. [Google Scholar] [CrossRef]
- Ayat, S.O.; Khalil-Hani, M.; Ab Rahman, A.A.H.; Abdellatef, H. Spectral-Based Convolutional Neural Network without Multiple Spatial-Frequency Domain Switchings. Neurocomputing 2019, 364, 152–167. [Google Scholar] [CrossRef]
- Arji, G.; Ahmadi, H.; Nilashi, M.; Rashid, T.A.; Hassan Ahmed, O.; Aljojo, N.; Zainol, A. Fuzzy Logic Approach for Infectious Disease Diagnosis: A Methodical Evaluation, Literature and Classification. Biocybern. Biomed. Eng. 2019, 39, 937–955. [Google Scholar] [CrossRef] [PubMed]
- Bacha, M.; Terki, A. Diagnosis Algorithm and Detection Faults Based on Fuzzy Logic for PV Panel. Mater. Today Proc. 2022, 51, 2131–2138. [Google Scholar] [CrossRef]
- Wang, K.; Jiang, X.; Wang, S.; Han, Z. Power Switch Open Circuit Fault Diagnosis Strategy for Novel Fault-Tolerant Electric Drive System Based on Fuzzy Logic. Energy Rep. 2022, 8, 914–921. [Google Scholar] [CrossRef]
Disclaimer/Publisher’s Note: The statements, opinions and data contained in all publications are solely those of the individual author(s) and contributor(s) and not of MDPI and/or the editor(s). MDPI and/or the editor(s) disclaim responsibility for any injury to people or property resulting from any ideas, methods, instructions or products referred to in the content. |
© 2024 by the authors. Licensee MDPI, Basel, Switzerland. This article is an open access article distributed under the terms and conditions of the Creative Commons Attribution (CC BY) license (https://creativecommons.org/licenses/by/4.0/).