
Efficient Strategic Pricing in a Dual-Channel Stackelberg Supply Chain: Incorporating Remanufacturing and Sales Commissions across Multiple Periods


Abstract
1. Introduction
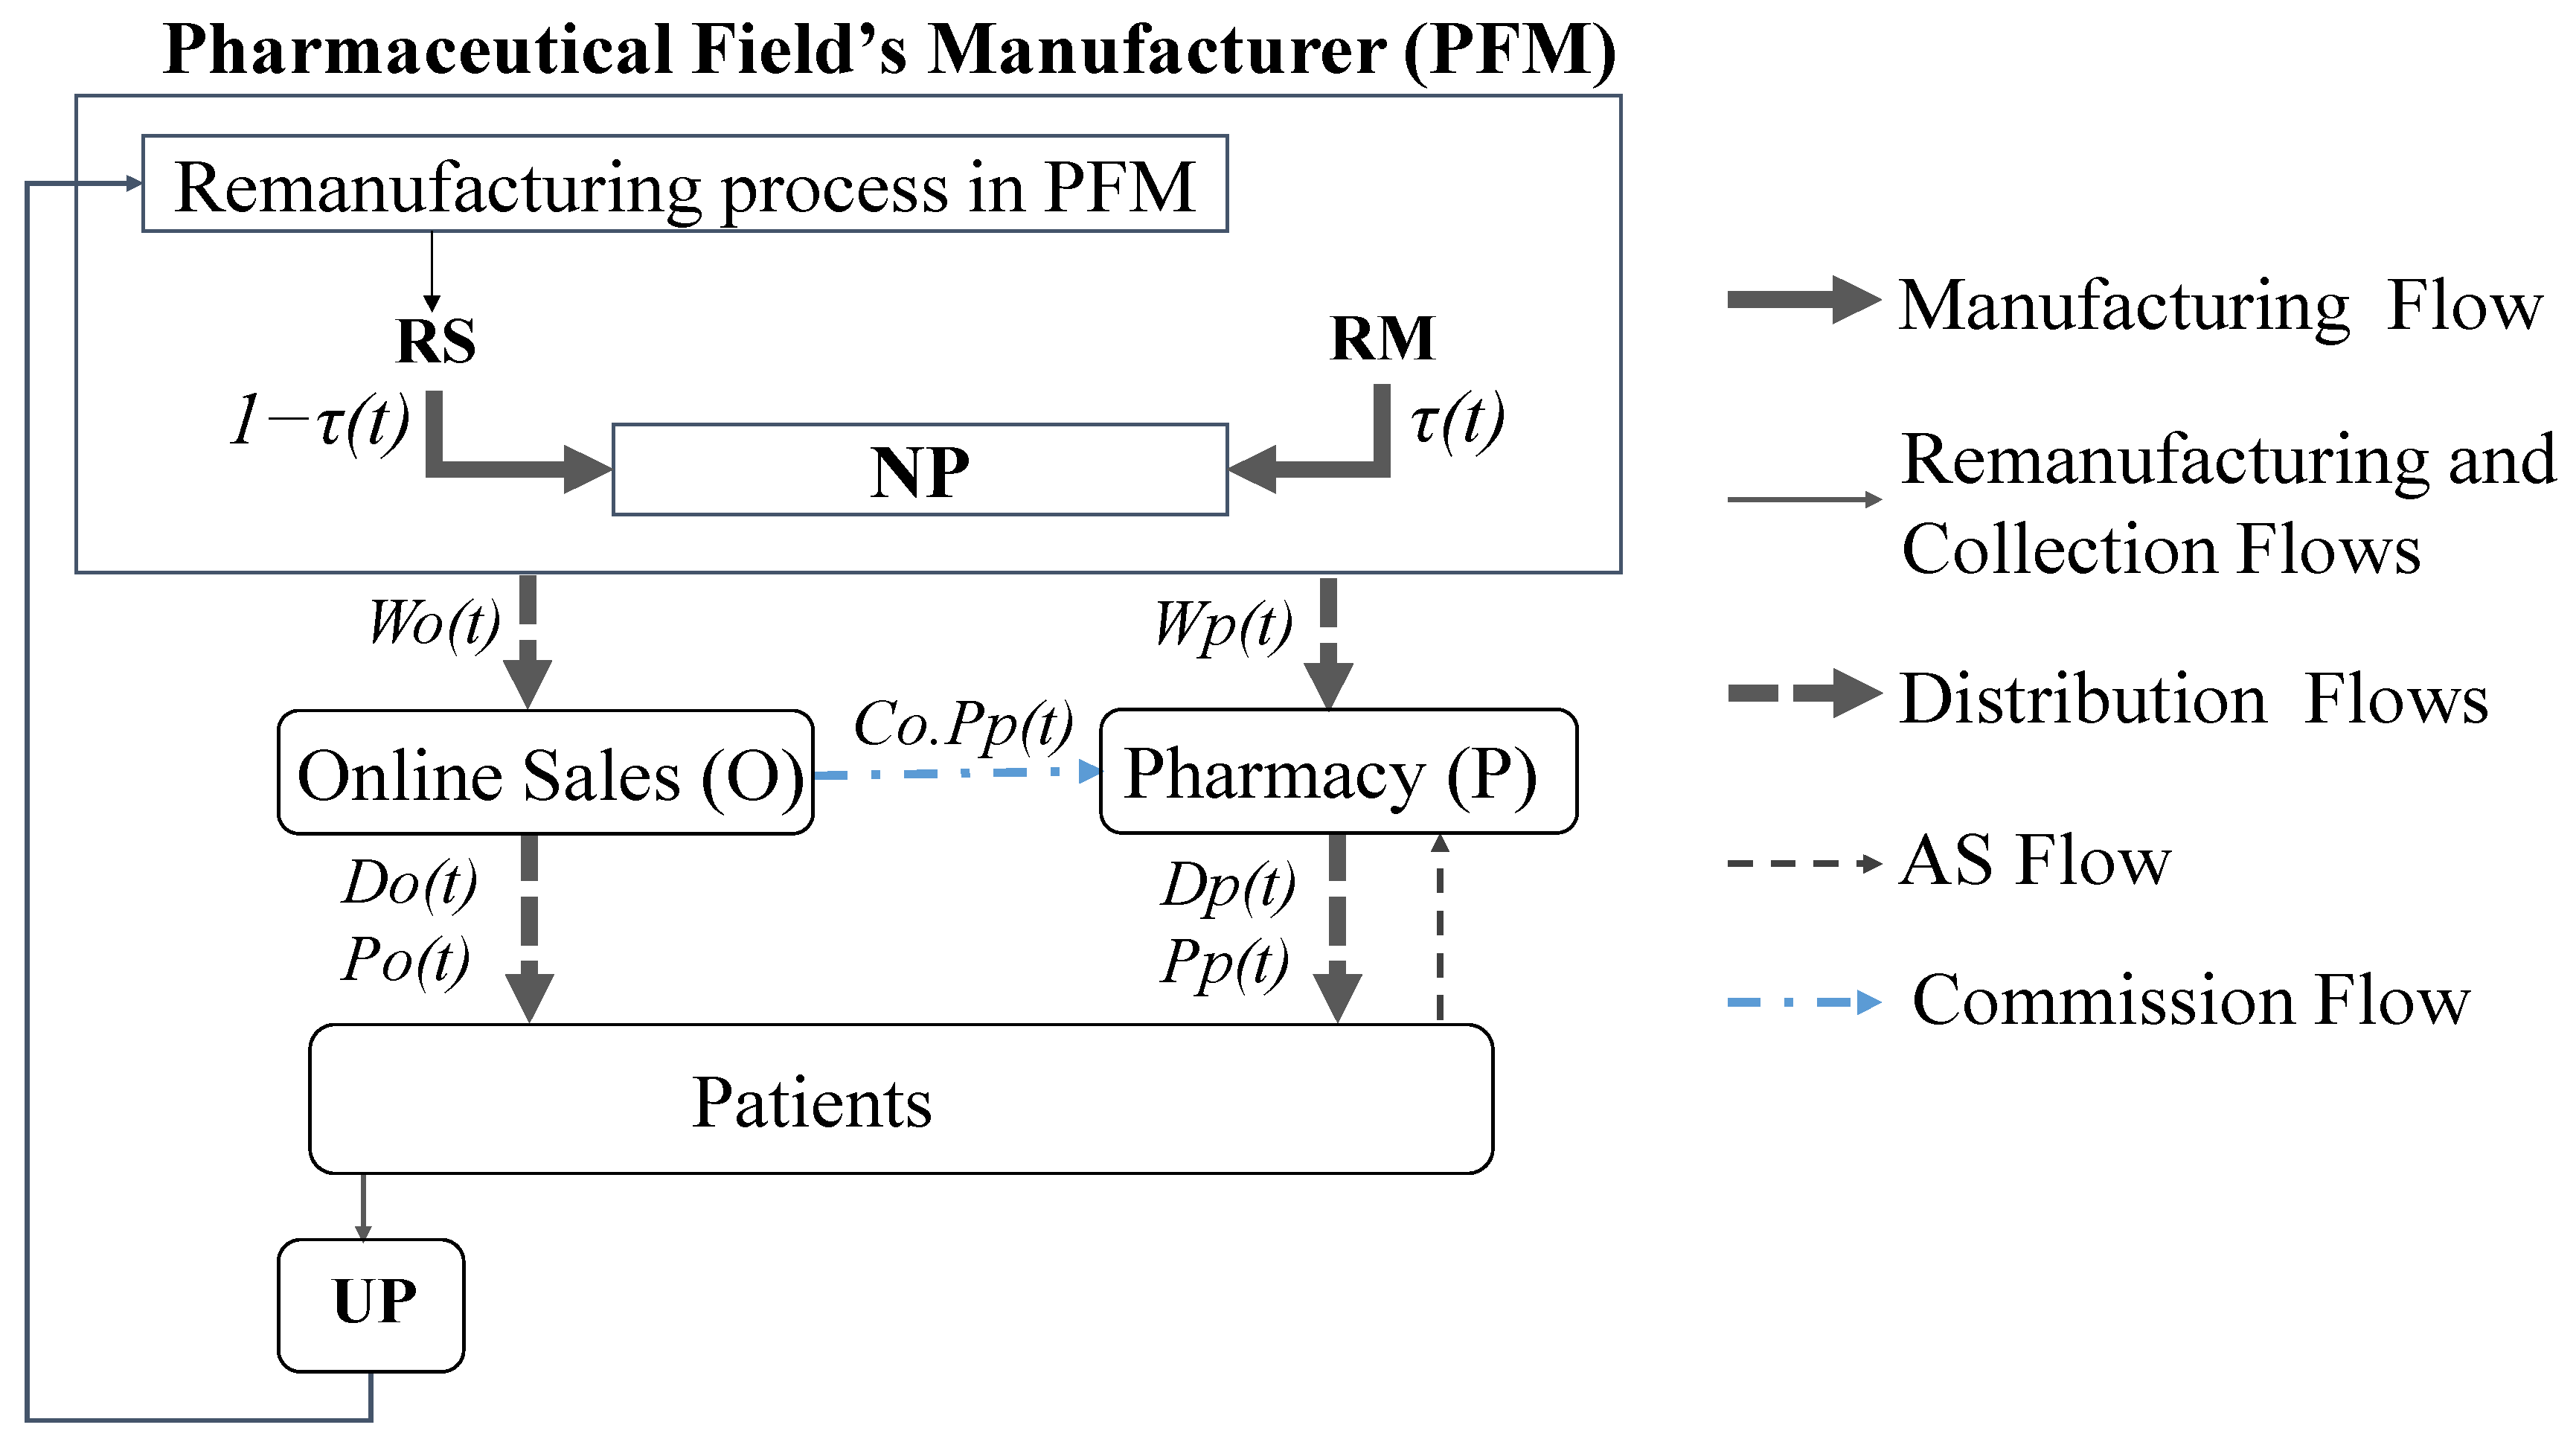
2. Problem Setting
| H | Length of the planning horizon |
| t | Period index |
| A(t) | Market size at period t if the product is free |
| Mc | Unit manufacturing cost of a product entirely produced from raw materials |
| δ | Unit cost saving of an entirely remanufactured product |
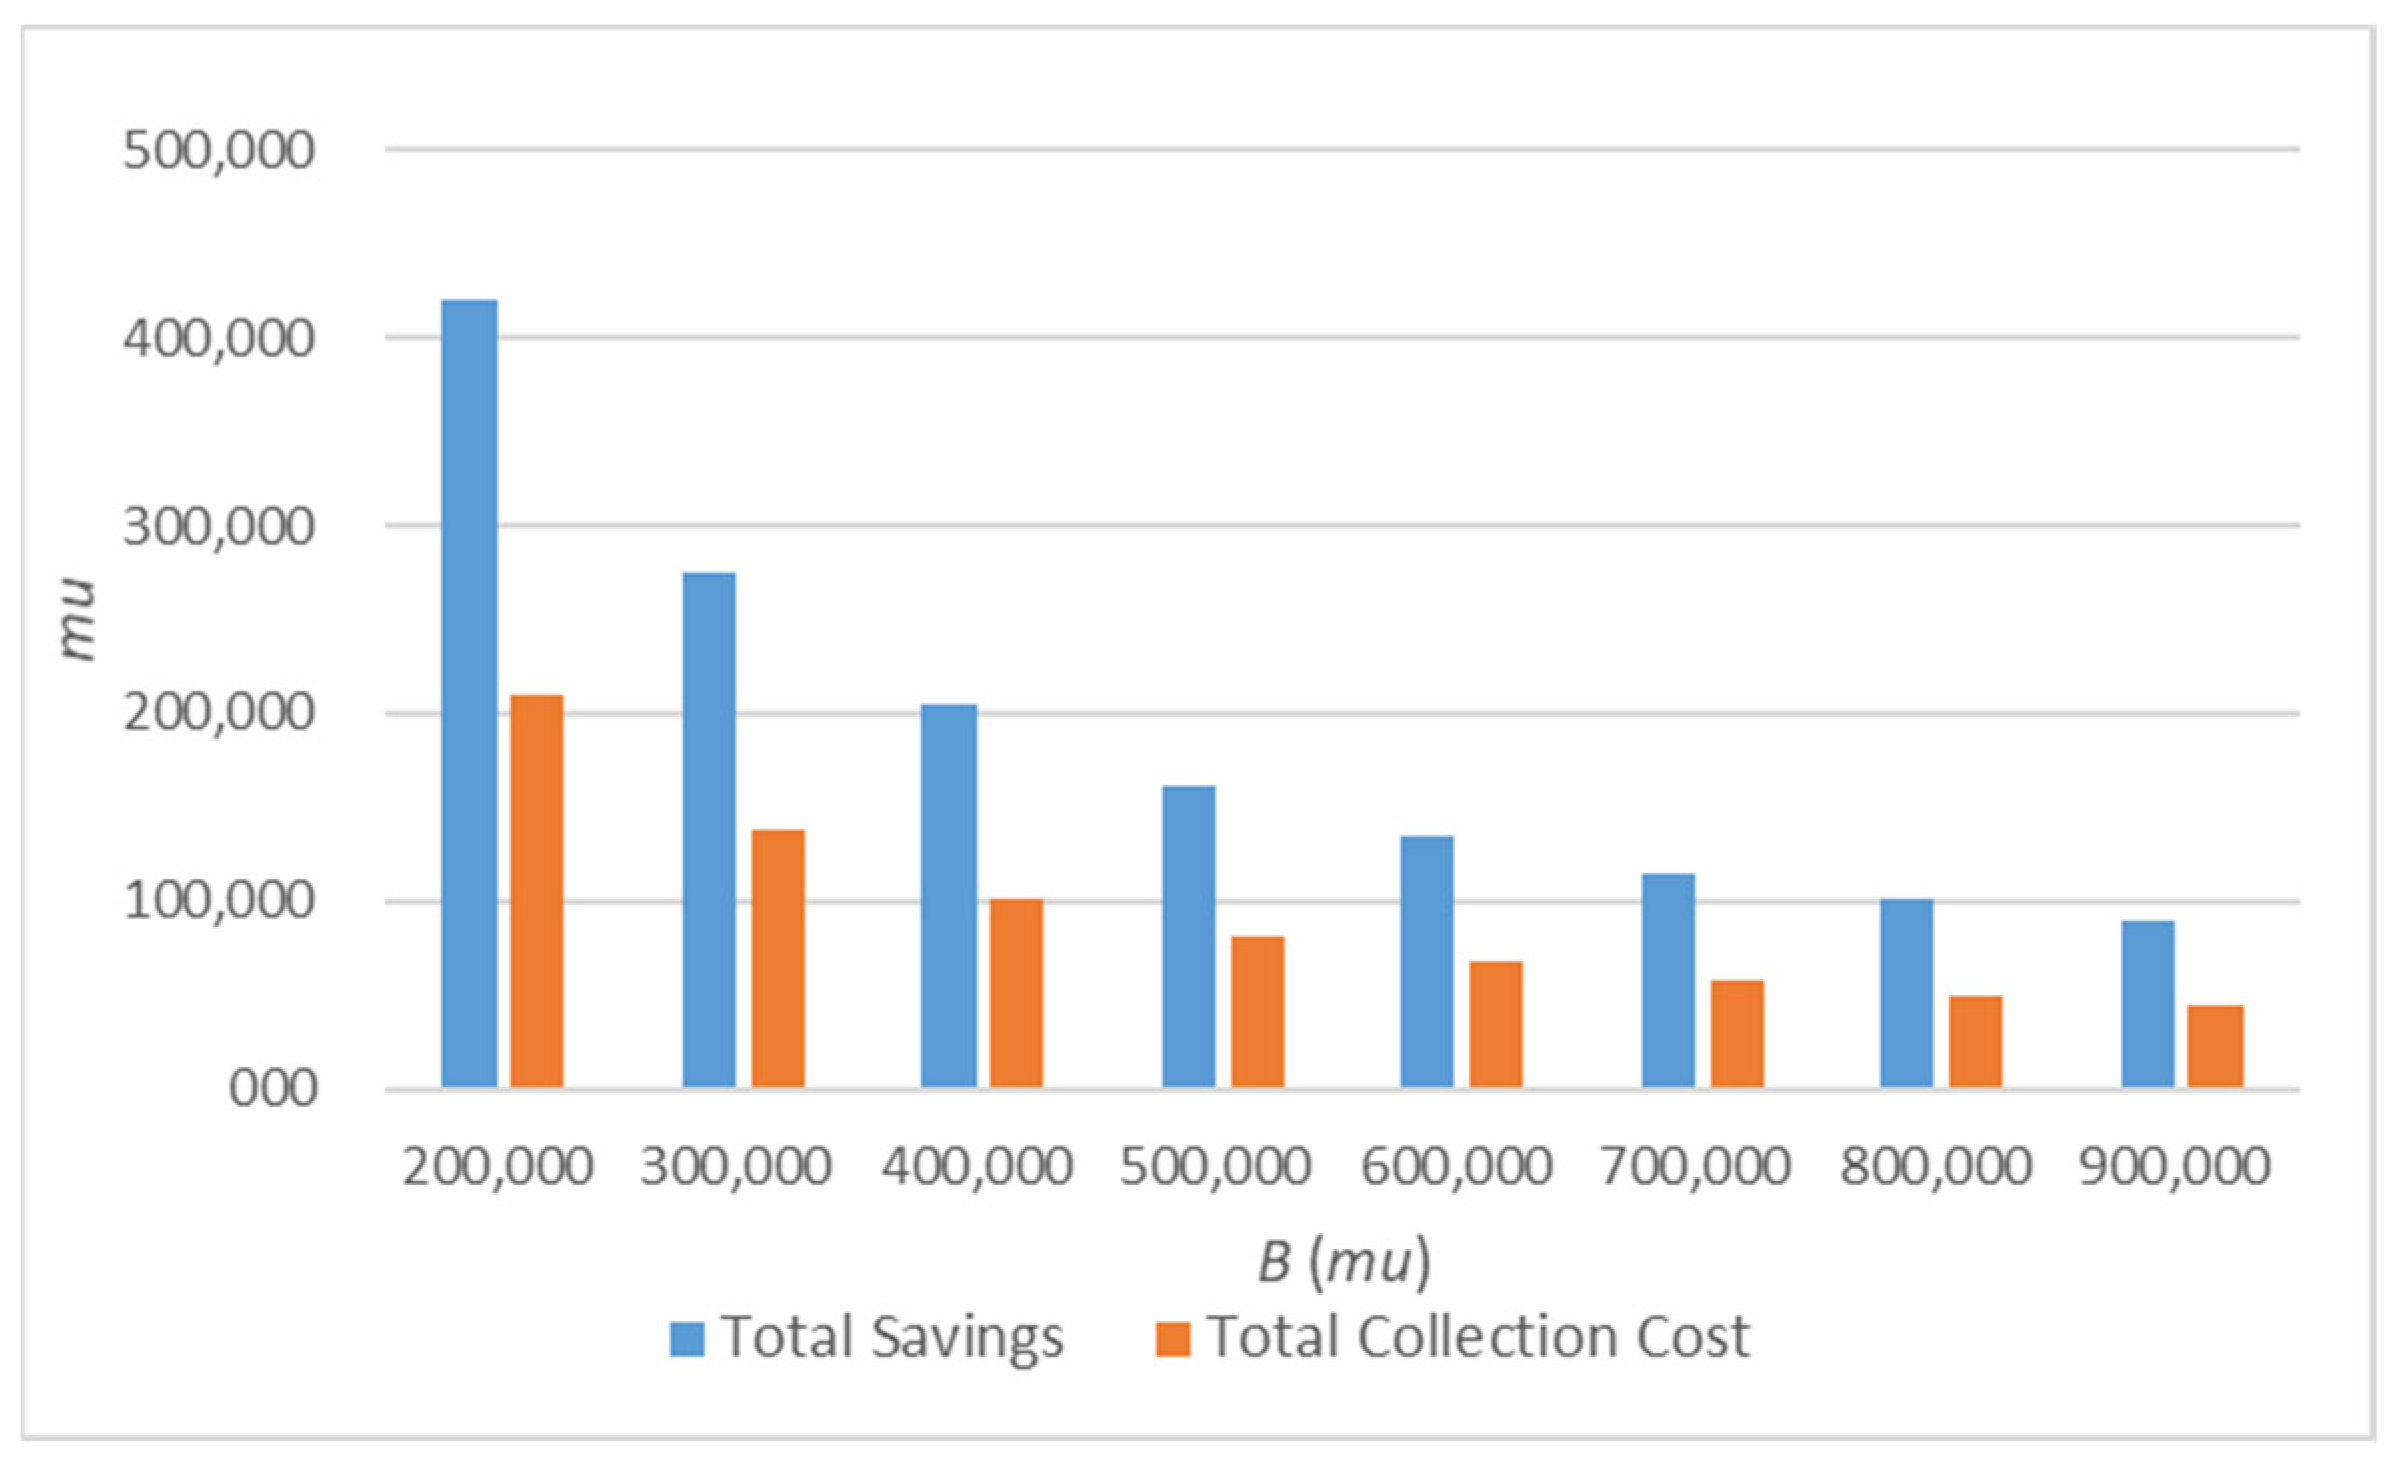
| B | Collection cost’s scaling parameter |
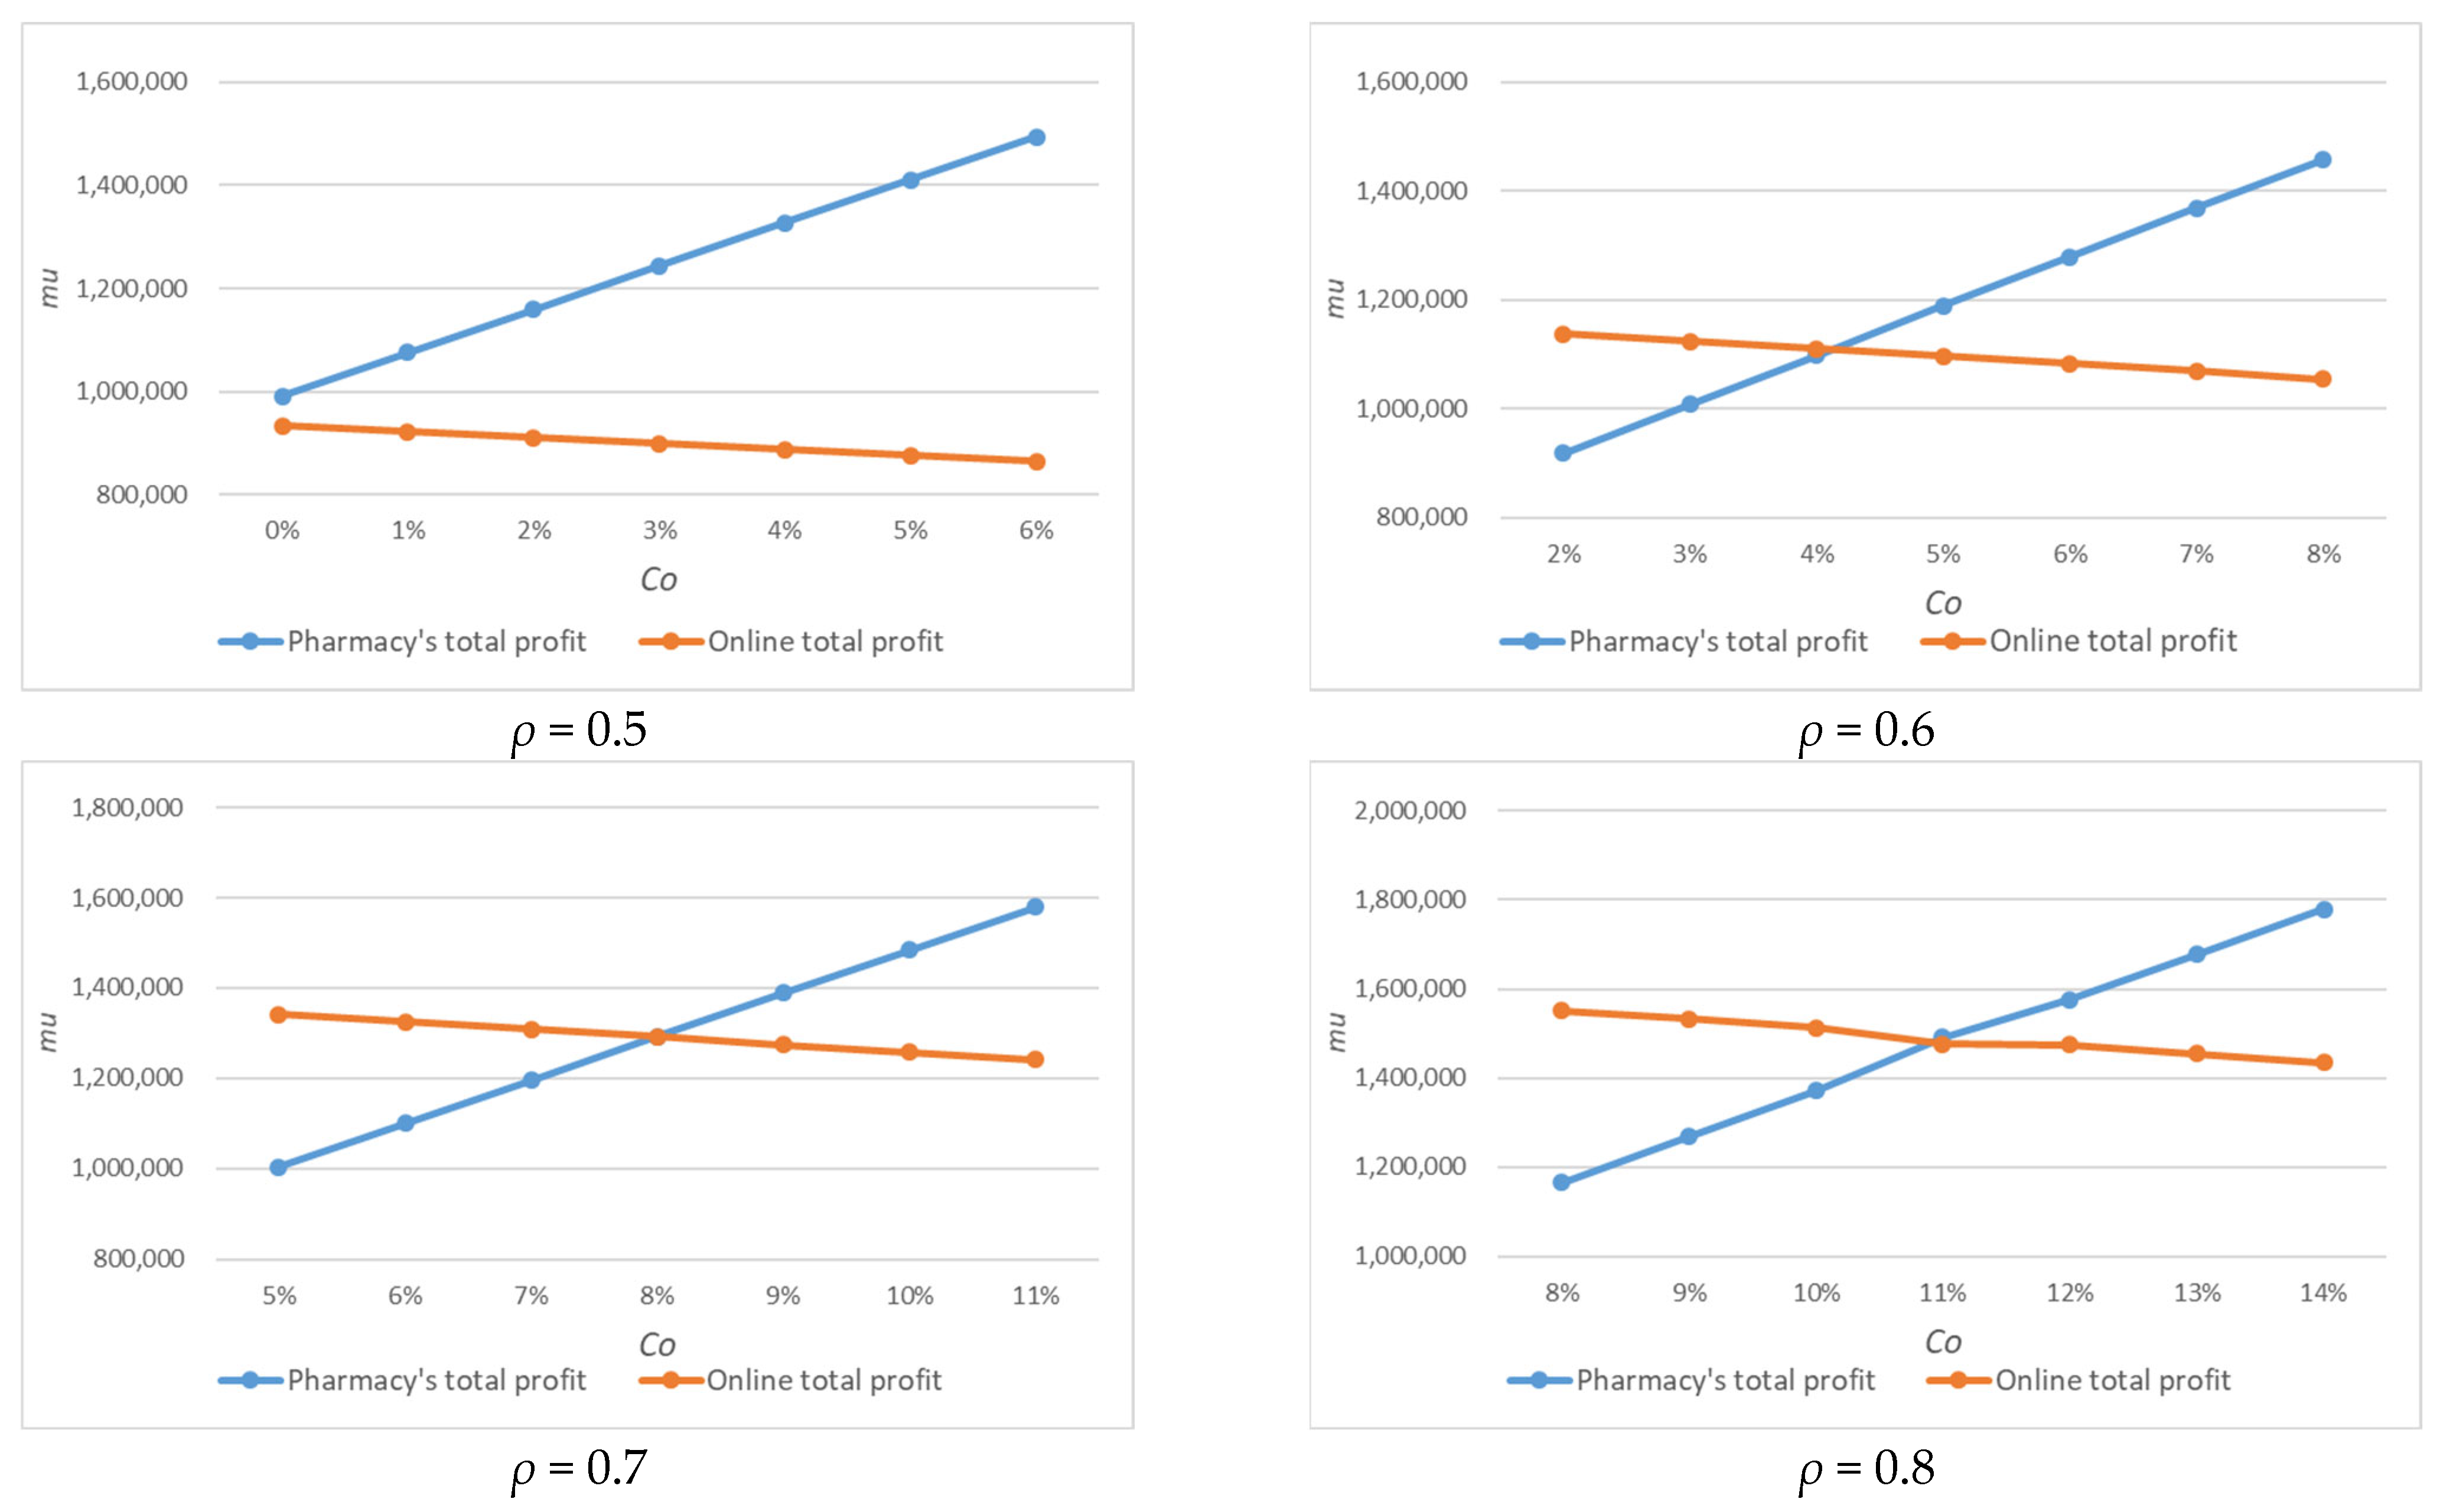
| ρ | Customer preference for purchasing the product via the online platform |
| αp | Self-price sensitivity of the pharmacy’s demand |
| αo | Self-price sensitivity of online demand |
| β | Sensitivity of the demand in one channel to price changes in the other channel |
| Rp | Proportion of the demand sold by the pharmacy returned to AS |
| Ro | Proportion of the demand sold online returned to AS |
| Uas | Unit processing cost of a returned product |
| Co | Unit sales commission between both distribution channels |
| Pp(t) | Product’s unit selling price proposed by the pharmacy in period t |
| Po(t) | Product’s unit selling price proposed by the online platform in period t |
| Wp(t) | Product’s unit wholesale price from the manufacturer to the pharmacy during period t |
| Wo(t) | Product’s unit wholesale price from the manufacturer to the online platform during period t |
| Dp(t) | Pharmacy’s demand during period t |
| Do(t) | Demand of the online platform during period t |
| τ(t) | Remanufacturing rate during period t |
| πM | Total profit of the manufacturer during the planning horizon |
| πP | Total profit of the pharmacy during the planning horizon |
| πO | Total profit of the online platform during the planning horizon |
3. Mathematical Model
- (1)
- Only the pharmacy (P) provides AS for returned products sold in both channels in return for a commission on each sale from the online platform (O). The manufacturer (M) determines the unit sales commission Co between both channels
- (2)
- All the price sensitivity parameters αp, αo and β are positive and independent. Also, the self-price sensitivity of the pharmacy, αp, is higher than the online self-price sensitivity αo due to the AS provided by the pharmacy.
- (3)
- For each period, the production process could include a ratio τ(t) of remanufactured subcomponents in the manufacturing of new products
- (4)
- All the new products either entirely manufactured from transforming raw materials, containing remanufactured subcomponents and fully obtained from remanufacturing used products are considered identical
- (5)
- Even considering a decentralized configuration, the manufacturer (M), the pharmacy (P) and the online platform (O) operate under the assumption of possessing perfect information regarding the decisions of the other members of the supply chain. Their objective is to maximize their own profits.
4. Numerical Results and Sensitivity Analysis
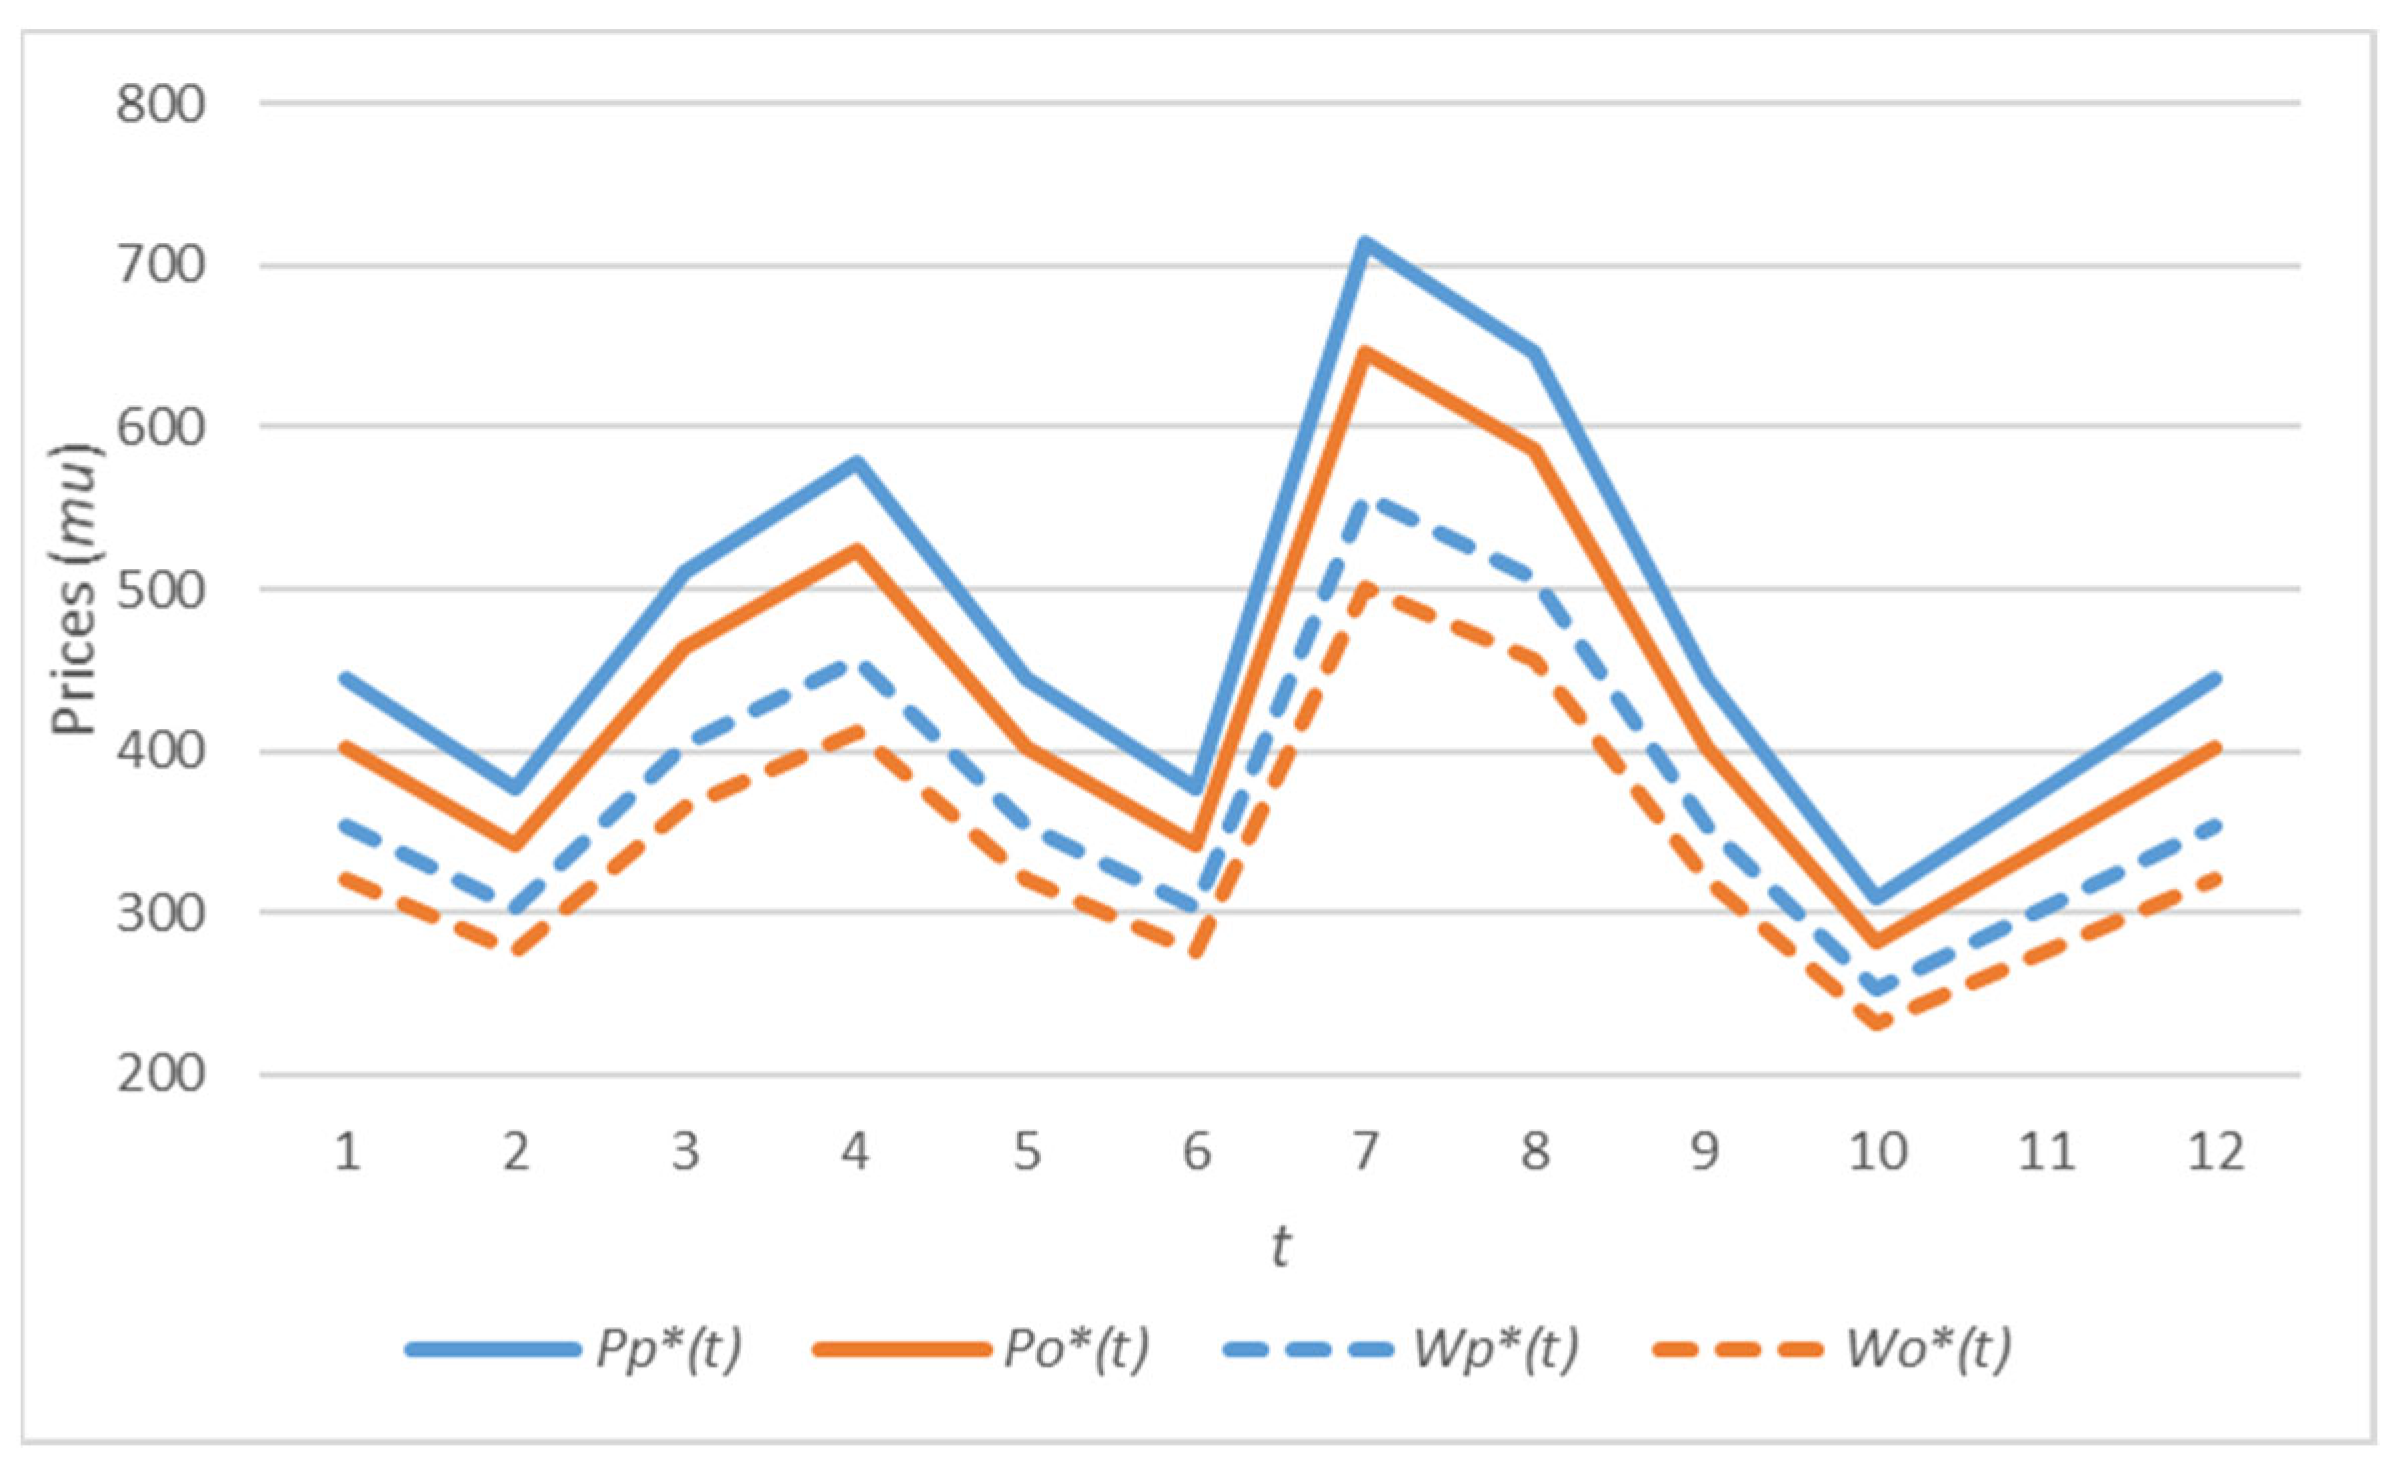
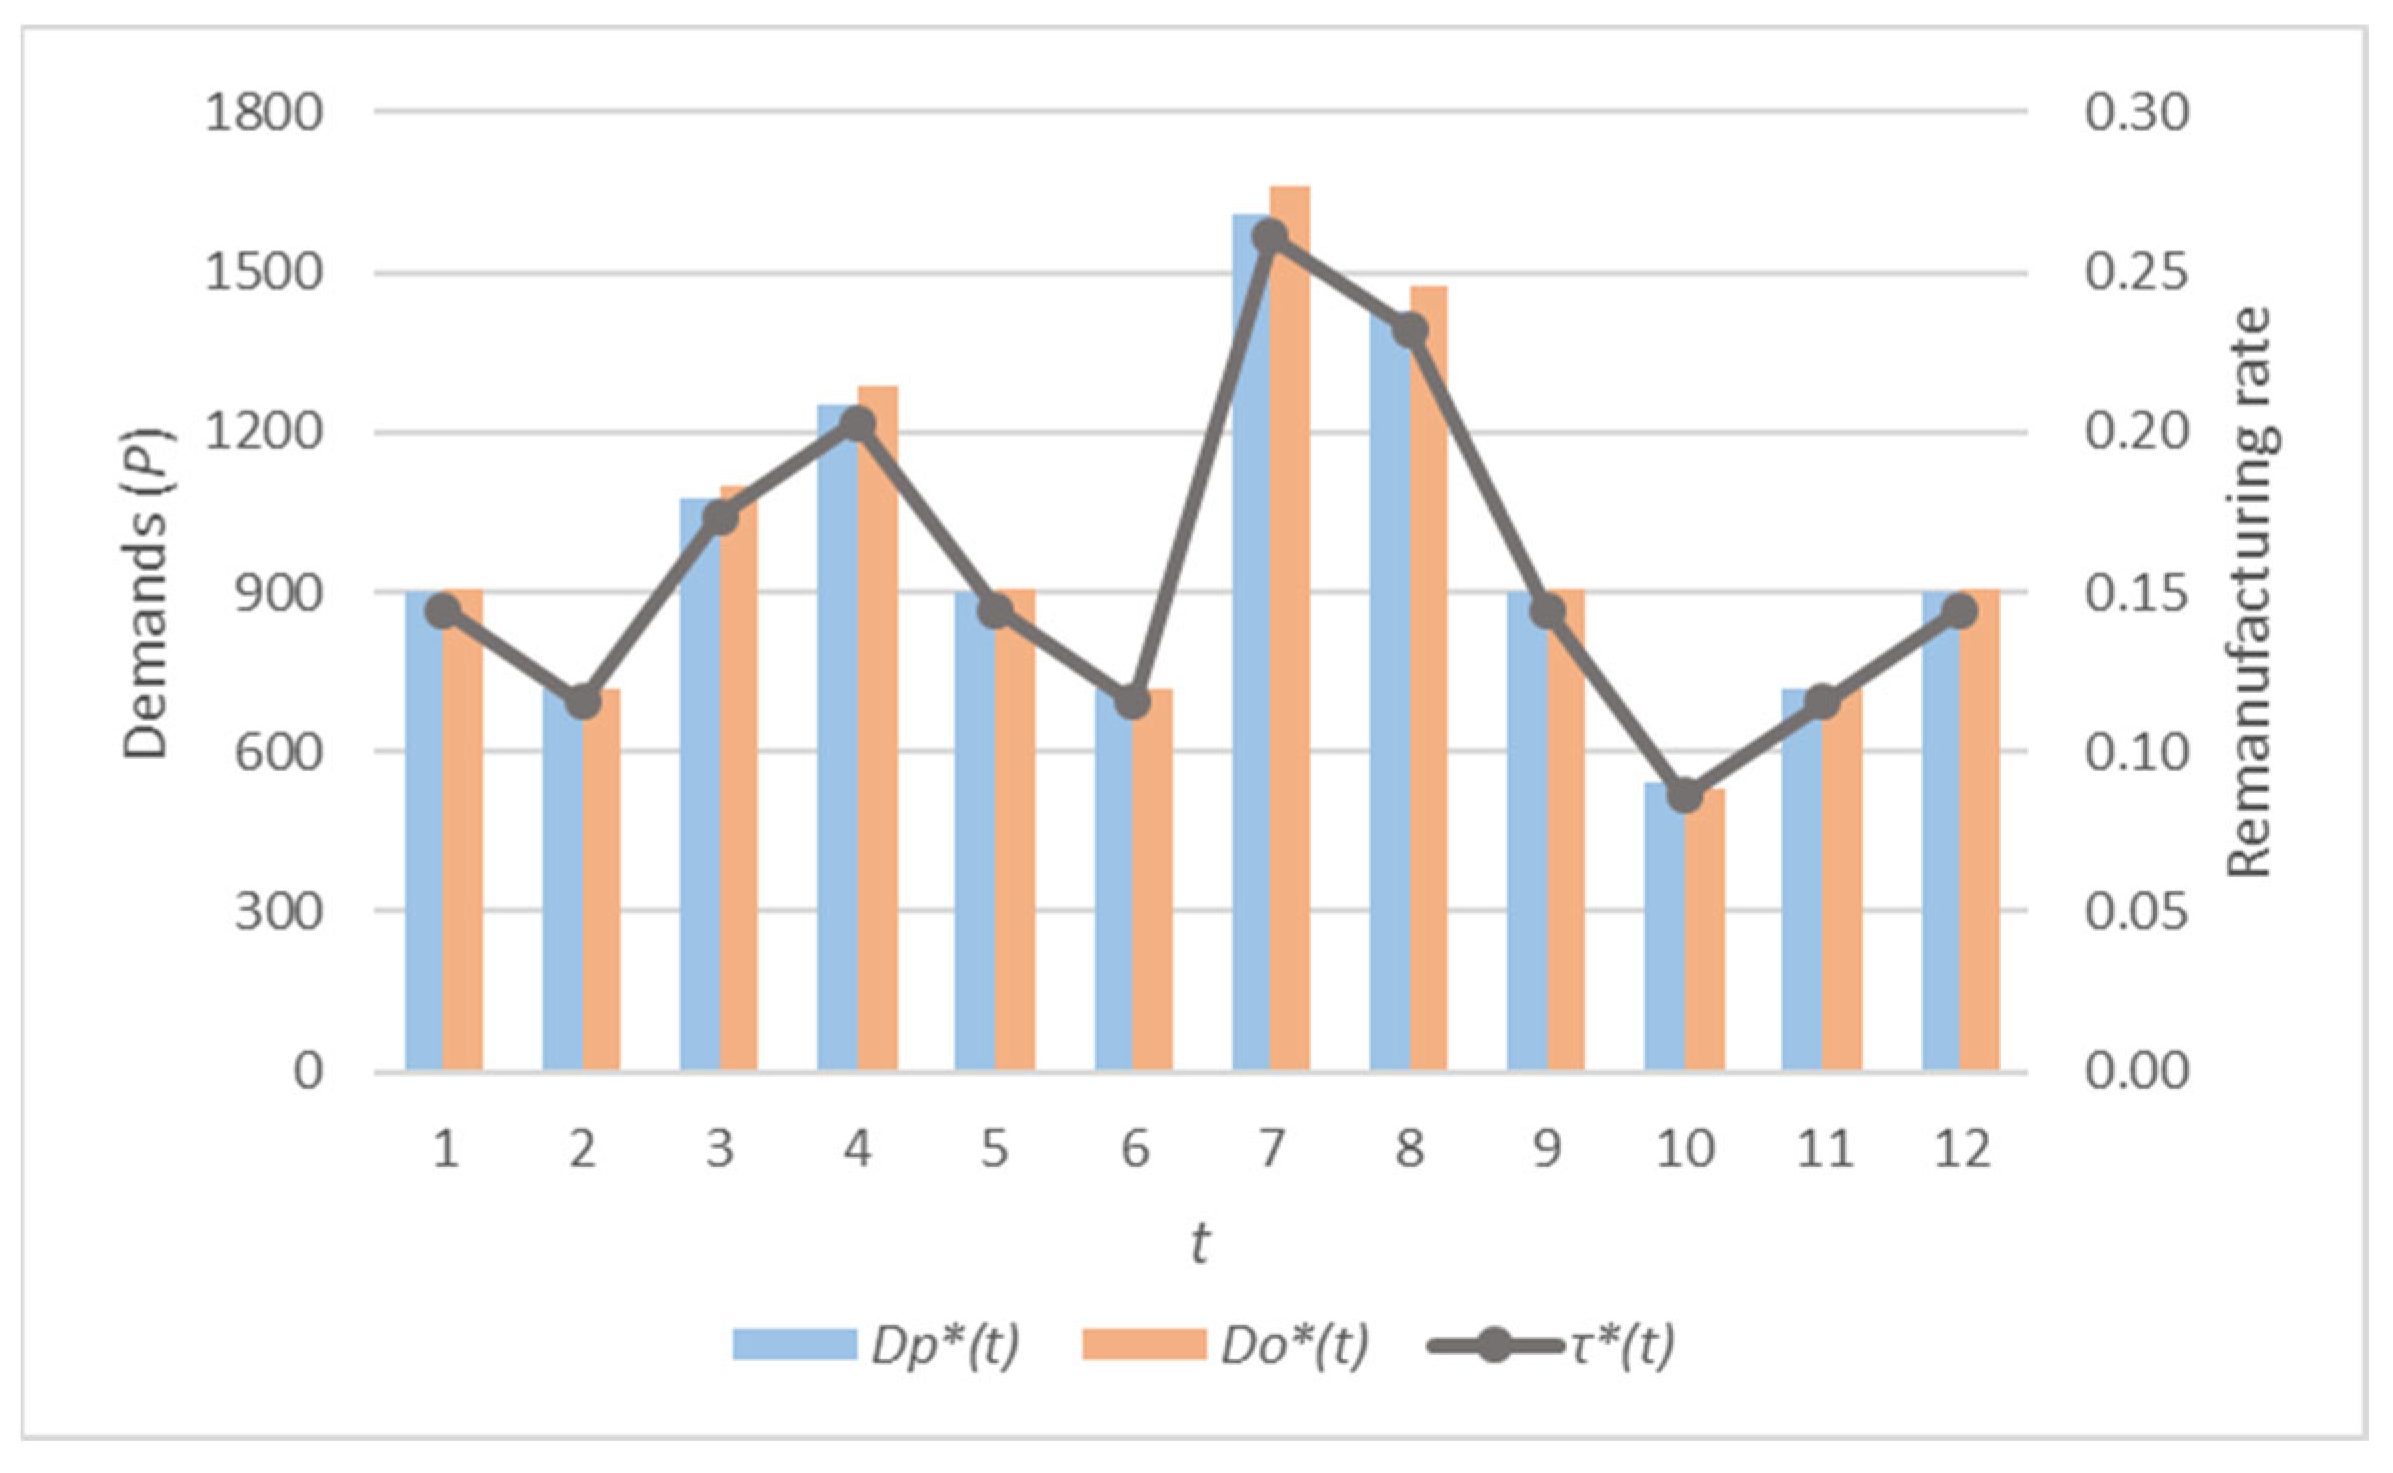
4.1. Numerical Example
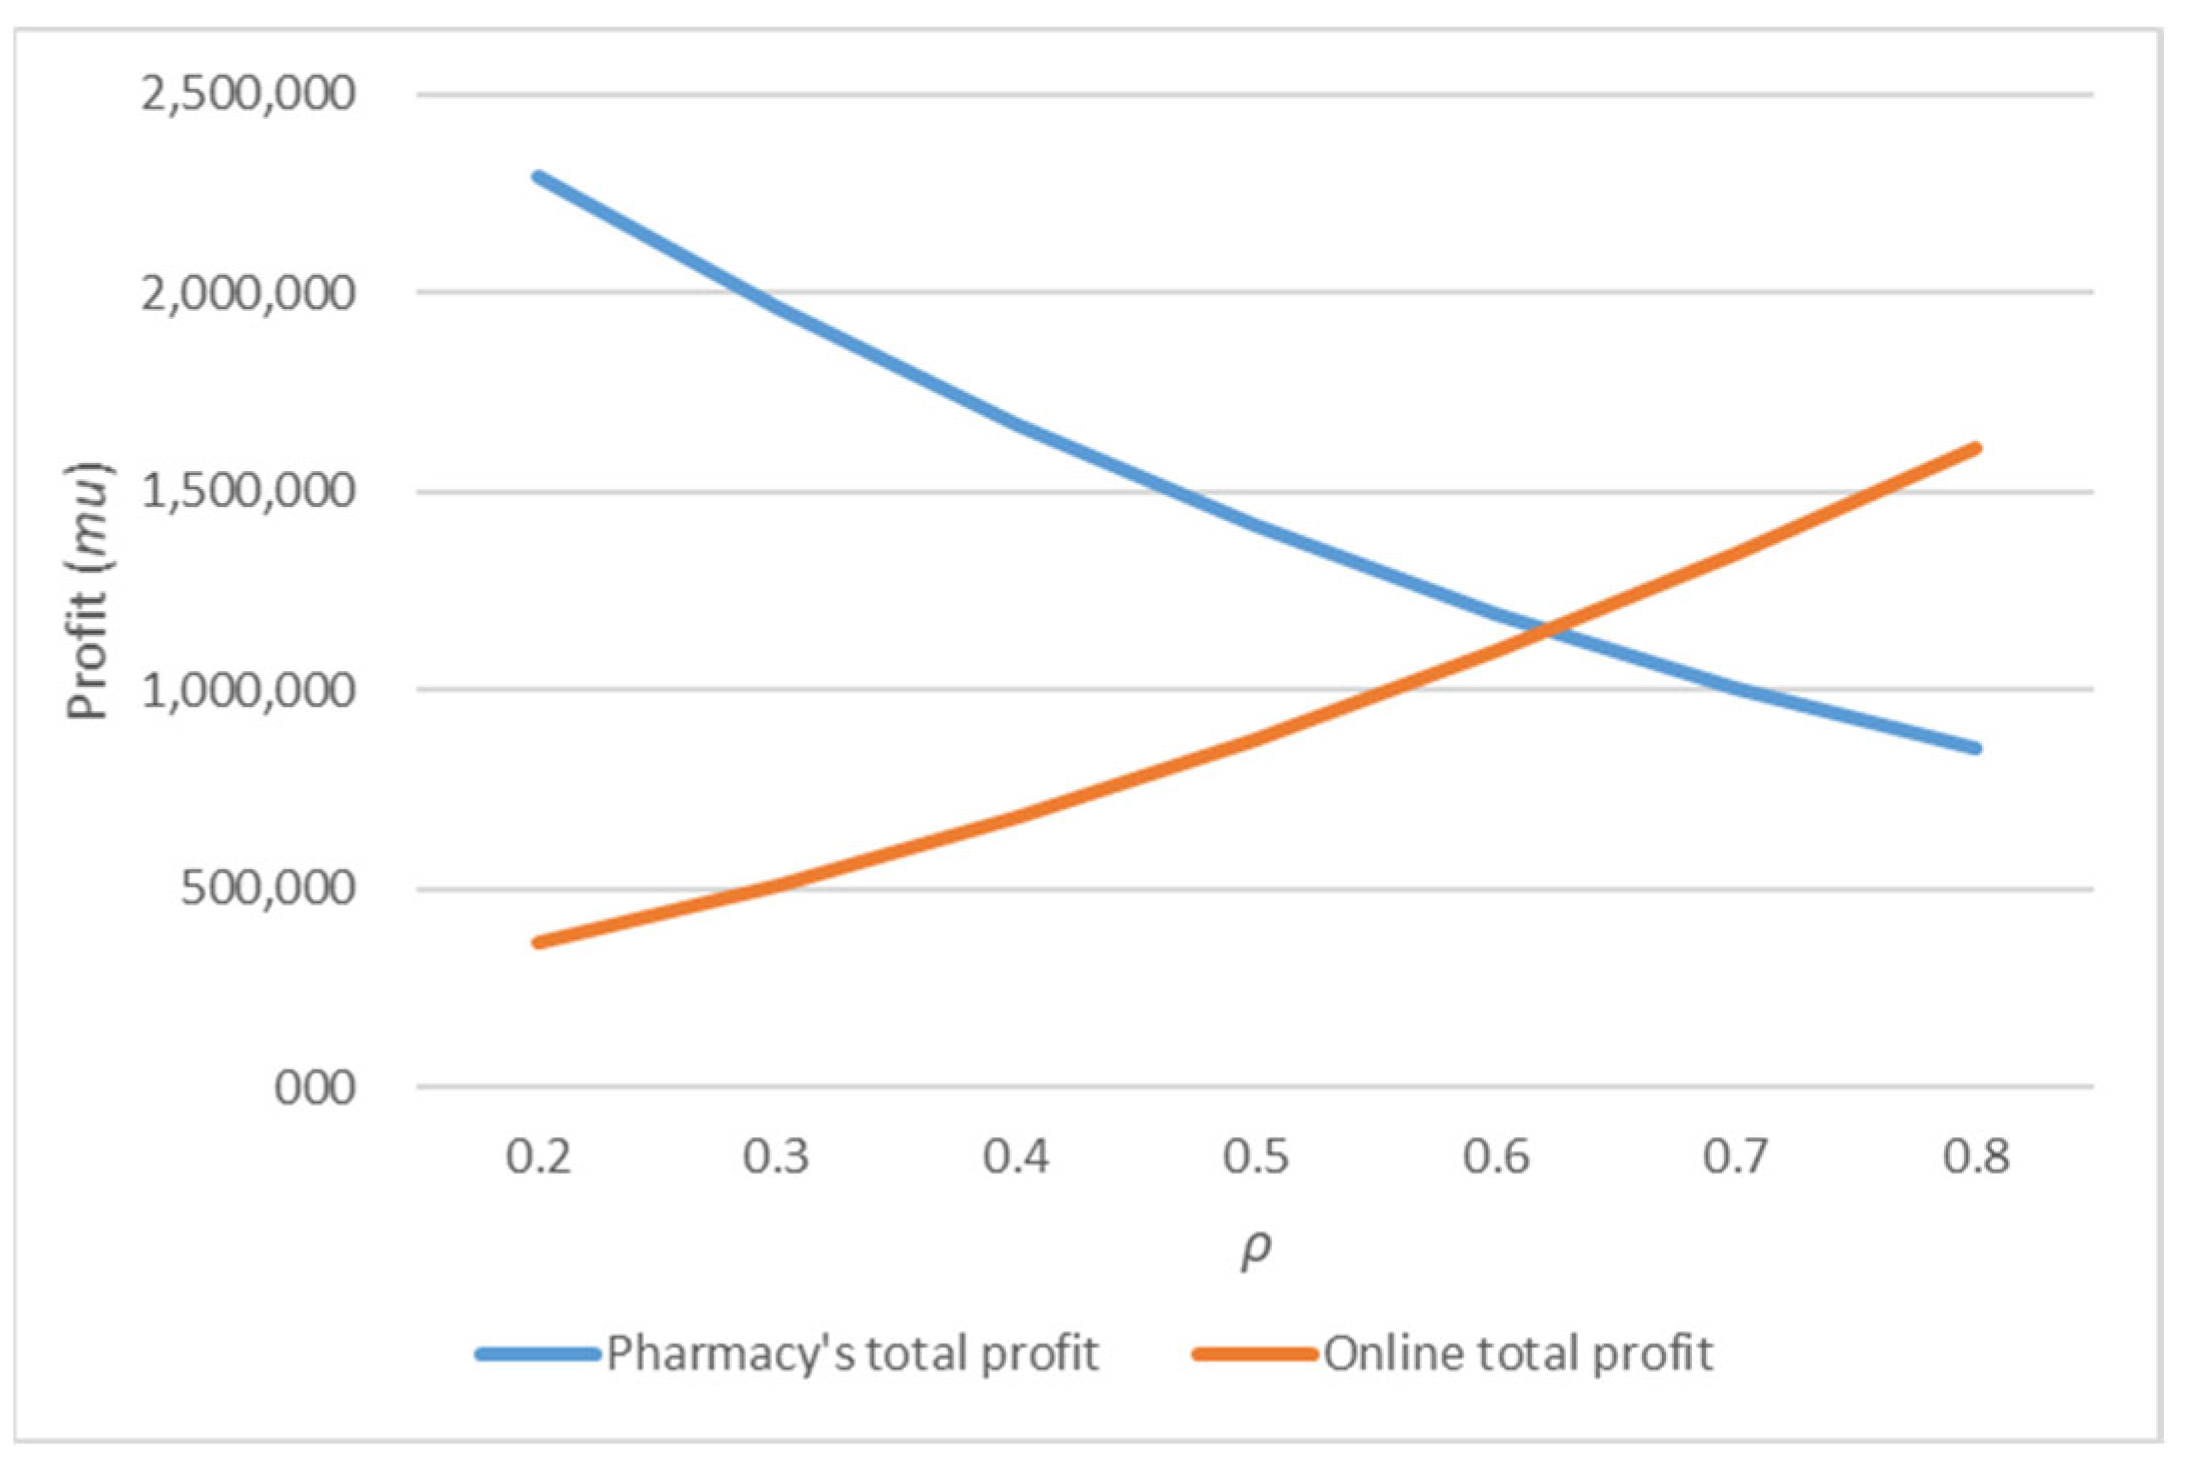
4.2. Sensitivity Analyses According to the Customer Preference ρ
4.3. Sensitivity Analyses following the Variations in the Scaling Parameter of the Collection Cost B
4.4. Sensitivity Analyses According to the Sales Commission Co
5. Conclusions
Author Contributions
Funding
Institutional Review Board Statement
Informed Consent Statement
Data Availability Statement
Conflicts of Interest
References
- Hermes, S.; Pfab, S.; Hein, A.; Weking, J.; Böhm, M.; Krcmar, H. Digital Platforms and Market Dominance: Insights from a Systematic Literature Review and Avenues for Future Research. In Proceedings of the Twenty-Fourth Pacific Asia Conference on Information Systems, Dubai, United Arab Emirates, 22–24 June 2020; Volume 42. [Google Scholar]
- Le, H.T.; Carrel, A.L.; Shah, H. Impacts of online shopping on travel demand: A systematic review. Transp. Rev. 2022, 42, 273–295. [Google Scholar] [CrossRef]
- Grewal, R.; Saini, A.; Kumar, A.; Dwyer, F.R.; Dahlstrom, R. Marketing channel management by multinational corporations in foreign markets. J. Mark. 2018, 82, 49–69. [Google Scholar] [CrossRef]
- Cao, P.; Fan, M.; Liu, K. Optimal dynamic pricing problem considering patient and impatient customers’ purchasing behaviour. Int. J. Prod. Res. 2015, 53, 6719–6735. [Google Scholar] [CrossRef]
- Chen, L.; Mislove, A.; Wilson, C. An empirical analyses of algorithmic pricing on amazon marketplace. In Proceedings of the 25th International Conference on World Wide Web, Montreal, QC, Canada, 11–15 April 2016; pp. 1339–1349. [Google Scholar] [CrossRef]
- Hankar, M.; Birjali, M.; Beni-Hssane, A. Used car price prediction using machine learning: A case study. In Proceedings of the 2022 11th International Symposium on Signal, Image, Video and Communications (ISIVC), El Jadida, Morocco, 18–20 May 2022; pp. 1–4. [Google Scholar] [CrossRef]
- Ofek, E.; Bertini, M.; Koenigsberg, O.; Klopfenstein, A. Pricing at Netflix. In Harvard Business School Case; 521-004; Harvard Business School: Boston, MA, USA, 2020. [Google Scholar]
- Moghadam, M.R.S.; Kamalabadi, I.N.; Karbasian, B. Joint pricing and inventory control modelling for obsolescent products: A case study of the telecom industry. Int. J. Appl. Decis. Sci. 2019, 12, 375–401. [Google Scholar] [CrossRef]
- Adida, E. Outcome-based pricing for new pharmaceuticals via rebates. Manag. Sci. 2021, 67, 892–913. [Google Scholar] [CrossRef]
- Anggriani, Y.; Ramadaniati, H.U.; Sarnianto, P.; Pontoan, J.; Suryawati, S. The impact of pharmaceutical policies on medicine procurement pricing in Indonesia under the implementation of Indonesia’s social health insurance system. Value Health Reg. Issues 2020, 21, 1–8. [Google Scholar] [CrossRef]
- Saqib, Z.A.; Qin, L.; Menhas, R.; Lei, G. Strategic Sustainability and Operational Initiatives in Small-and Medium-Sized Manufacturers: An Empirical Analysis. Sustainability 2023, 15, 6330. [Google Scholar] [CrossRef]
- Mahmood, S.; Misra, P.; Sun, H.; Luqman, A.; Papa, A. Sustainable infrastructure, energy projects, and economic growth: Mediating role of sustainable supply chain management. Ann. Oper. Res. 2024, 1–32. [Google Scholar] [CrossRef]
- Dominguez, R.; Cannella, S.; Framinan, J.M. Remanufacturing configuration in complex supply chains. Omega 2021, 101, 102268. [Google Scholar] [CrossRef]
- Gong, B.; Zhang, H.; Gao, Y.; Liu, Z. Blockchain adoption and channel selection strategies in a competitive remanufacturing supply chain. Comput. Ind. Eng. 2023, 175, 108829. [Google Scholar] [CrossRef]
- Yang, L.; Gao, M.; Feng, L. Competition versus cooperation? Which is better in a remanufacturing supply chain considering blockchain. Transp. Res. Part E Logist. Transp. Rev. 2022, 165, 102855. [Google Scholar] [CrossRef]
- Yang, L.; Hu, Y.; Huang, L. Collecting mode selection in a remanufacturing supply chain under cap-and-trade regulation. Eur. J. Oper. Res. 2020, 287, 480–496. [Google Scholar] [CrossRef]
- Zou, Z.; Wang, F.; Lai, X.; Hong, J. How does licensing remanufacturing affect the supply chain considering customer environmental awareness? Sustainability 2019, 11, 1898. [Google Scholar] [CrossRef]
- Karimabadi, K.; Arshadi-khamseh, A.; Naderi, B. Optimal pricing and remanufacturing decisions for a fuzzy dual-channel supply chain. Int. J. Syst. Sci. Oper. Logist. 2020, 7, 248–261. [Google Scholar] [CrossRef]
- Hamzaoui, A.F.; Turki, S.; Rezg, N. Unified strategy of production, distribution and pricing in a dual-channel supply chain using leasing option. Int. J. Prod. Res. 2024, 1–19. [Google Scholar] [CrossRef]
- Farouk, H.A.; Sadok, T.; Nidhal, R. Pricing and remanufacturing decisions in a dual channel reverse supply chain: Study of three configurations with after sales services. IFAC-PapersOnLine 2022, 55, 1758–1763. [Google Scholar] [CrossRef]
- San Gan, S.; Pujawan, I.N.; Widodo, B. Pricing decision model for new and remanufactured short-life cycle products with time-dependent demand. Oper. Res. Perspect. 2015, 2, 1–12. [Google Scholar] [CrossRef]
- Li, K.; Li, Y.; Gu, Q.; Ingersoll, A. Joint effects of remanufacturing channel design and after-sales service pricing: An analytical study. Int. J. Prod. Res. 2019, 57, 1066–1081. [Google Scholar] [CrossRef]
- Ma, P.; Li, K.W.; Wang, Z.J. Pricing decisions in closed-loop supply chains with marketing effort and fairness concerns. Int. J. Prod. Res. 2017, 55, 6710–6731. [Google Scholar] [CrossRef]
- Gao, J.; Han, H.; Hou, L.; Wang, H. Pricing and effort decisions in a closed-loop supply chain under different channel power structures. J. Clean. Prod. 2016, 112, 2043–2057. [Google Scholar] [CrossRef]
- Liu, W.; Qin, D.; Shen, N.; Zhang, J.; Jin, M.; Xie, N.; Chen, J.; Chang, X. Optimal pricing for a multi-echelon closed loop supply chain with different power structures and product dual differences. J. Clean. Prod. 2020, 257, 120281. [Google Scholar] [CrossRef]
- Liu, W.; Liu, W.; Shen, N.; Xu, Z.; Xie, N.; Chen, J.; Zhou, H. Pricing and collection decisions of a closed-loop supply chain with fuzzy demand. Int. J. Prod. Econ. 2022, 245, 108409. [Google Scholar] [CrossRef]
- Zhou, L.; Gupta, S.M. Pricing strategy and competition for new and remanufactured products across generations. J. Remanufacturing 2022, 12, 47–88. [Google Scholar] [CrossRef]
- Soleimani, F. Optimal pricing decisions in a fuzzy dual-channel supply chain. Soft Comput. 2016, 20, 689–696. [Google Scholar] [CrossRef]
- He, Y.; Huang, H.; Li, D. Inventory and pricing decisions for a dual-channel supply chain with deteriorating products. Oper. Res. 2020, 20, 1461–1503. [Google Scholar] [CrossRef]
- Cao, K.; He, P.; Liu, Z. Production and pricing decisions in a dual-channel supply chain under remanufacturing subsidy policy and carbon tax policy. J. Oper. Res. Soc. 2020, 71, 1199–1215. [Google Scholar] [CrossRef]
- Zhu, C.; Liang, J.; Liu, Y. Pricing Decision of the Dual-Channel Supply Chain with the Manufacturer’s Extended Warranty. Systems 2023, 11, 313. [Google Scholar] [CrossRef]
- Wei, J.; Zhao, J. Pricing and remanufacturing decisions in two competing supply chains. Int. J. Prod. Res. 2015, 53, 258–278. [Google Scholar] [CrossRef]
- Wang, R.; Wang, S.; Yan, S. Pricing and coordination strategies of dual channels considering consumers’ channel preferences. Sustainability 2021, 13, 11191. [Google Scholar] [CrossRef]
- Ghasemy Yaghin, R.; Goh, M. Procurement, production, and price planning under visibility and risk: A generalised Benders decomposition method. Int. J. Prod. Res. 2021, 59, 5626–5646. [Google Scholar] [CrossRef]
- Modak, N.M.; Kelle, P. Managing a dual-channel supply chain under price and delivery-time dependent stochastic demand. Eur. J. Oper. Res. 2019, 272, 147–161. [Google Scholar] [CrossRef]
- Zhang, C.; Liu, Y.; Han, G. Two-stage pricing strategies of a dual-channel supply chain considering public green preference. Comput. Ind. Eng. 2021, 151, 106988. [Google Scholar] [CrossRef]
- Kalantari, S.S.; Esmaeili, M.; Taleizadeh, A.A. Selling by clicks or leasing by bricks? A dynamic game for pricing durable products in a dual-channel supply chain. J. Ind. Manag. Optim. 2023, 19, 1107–1138. [Google Scholar] [CrossRef]
- Farouk, H.A.; Sadok, T.; Nidhal, R. Multi-Periodic Pricing, Remanufacturing and Warranty Length Optimal Decisions within a Dual-Channel Supply Chain. In Proceedings of the 2023 9th International Conference on Control, Decision and Information Technologies (CoDIT), Rome, Italy, 3–6 July 2023; pp. 1–6. [Google Scholar] [CrossRef]
- Keshavarz-Ghorbani, F.; Arshadi Khamseh, A. Modeling and optimizing a multi-period closed-loop supply chain for pricing, warranty period, and quality management. J. Ambient. Intell. Humaniz. Comput. 2022, 13, 2061–2089. [Google Scholar] [CrossRef]
- Jiang, Y.; Liu, Y.; Shang, J.; Yildirim, P.; Zhang, Q. Optimizing online recurring promotions for dual-channel retailers: Segmented markets with multiple objectives. Eur. J. Oper. Res. 2018, 267, 612–627. [Google Scholar] [CrossRef]


| H = 12 | A(1) = 6000 P | A(2) = 5000 P | A(3) = 7000 P | A(4) = 8000 P |
| A(5) = 6000 P | A(6) = 5000 P | A(7) = 10 000 P | A(8) = 9000 P | A(9) = 6000 P |
| A(10) = 4000 P | A(11) = 5000 P | A(12) = 6000 P | Mc = 100 mu/P | δ = 40 mu/P |
| αp = 12 P/mu | αo = 14 P/mu | β = 8 P/mu | Rp = 0.2 | Ro = 0.2 |
| Uas = 20 mu/P | Co = 5% | B = 500,000 mu |
| B (mu) | τ*(1) | τ*(2) | τ*(3) | τ*(4) | τ*(5) | τ*(6) | τ*(7) | τ*(8) | τ*(9) | τ*(10) | τ*(11) | τ*(12) | mean τ*(t) |
|---|---|---|---|---|---|---|---|---|---|---|---|---|---|
| 200,000 | 0.36 | 0.29 | 0.44 | 0.52 | 0.37 | 0.29 | 0.67 | 0.59 | 0.37 | 0.22 | 0.29 | 0.37 | 0.4 |
| 300,000 | 0.24 | 0.19 | 0.29 | 0.34 | 0.24 | 0.19 | 0.44 | 0.39 | 0.24 | 0.14 | 0.19 | 0.24 | 0.26 |
| 400,000 | 0.18 | 0.14 | 0.22 | 0.25 | 0.18 | 0.14 | 0.33 | 0.29 | 0.18 | 0.11 | 0.14 | 0.18 | 0.2 |
| 500,000 | 0.14 | 0.11 | 0.17 | 0.2 | 0.14 | 0.12 | 0.26 | 0.23 | 0.14 | 0.09 | 0.12 | 0.14 | 0.15 |
| 600,000 | 0.12 | 0.1 | 0.14 | 0.17 | 0.12 | 0.1 | 0.22 | 0.19 | 0.12 | 0.07 | 0.1 | 0.12 | 0.13 |
| 700,000 | 0.1 | 0.08 | 0.12 | 0.14 | 0.1 | 0.08 | 0.19 | 0.17 | 0.1 | 0.06 | 0.08 | 0.1 | 0.11 |
| 800,000 | 0.09 | 0.07 | 0.11 | 0.13 | 0.09 | 0.07 | 0.16 | 0.14 | 0.09 | 0.05 | 0.07 | 0.09 | 0.1 |
| 900,000 | 0.08 | 0.06 | 0.1 | 0.11 | 0.08 | 0.06 | 0.14 | 0.13 | 0.08 | 0.05 | 0.06 | 0.08 | 0.09 |
Disclaimer/Publisher’s Note: The statements, opinions and data contained in all publications are solely those of the individual author(s) and contributor(s) and not of MDPI and/or the editor(s). MDPI and/or the editor(s) disclaim responsibility for any injury to people or property resulting from any ideas, methods, instructions or products referred to in the content. |
© 2024 by the authors. Licensee MDPI, Basel, Switzerland. This article is an open access article distributed under the terms and conditions of the Creative Commons Attribution (CC BY) license (https://creativecommons.org/licenses/by/4.0/).
Share and Cite
Hamzaoui, A.F.; Turki, S.; Rezg, N. Efficient Strategic Pricing in a Dual-Channel Stackelberg Supply Chain: Incorporating Remanufacturing and Sales Commissions across Multiple Periods. Appl. Sci. 2024, 14, 4180. https://doi.org/10.3390/app14104180
Hamzaoui AF, Turki S, Rezg N. Efficient Strategic Pricing in a Dual-Channel Stackelberg Supply Chain: Incorporating Remanufacturing and Sales Commissions across Multiple Periods. Applied Sciences. 2024; 14(10):4180. https://doi.org/10.3390/app14104180
Chicago/Turabian StyleHamzaoui, Ahmed Farouk, Sadok Turki, and Nidhal Rezg. 2024. "Efficient Strategic Pricing in a Dual-Channel Stackelberg Supply Chain: Incorporating Remanufacturing and Sales Commissions across Multiple Periods" Applied Sciences 14, no. 10: 4180. https://doi.org/10.3390/app14104180
APA StyleHamzaoui, A. F., Turki, S., & Rezg, N. (2024). Efficient Strategic Pricing in a Dual-Channel Stackelberg Supply Chain: Incorporating Remanufacturing and Sales Commissions across Multiple Periods. Applied Sciences, 14(10), 4180. https://doi.org/10.3390/app14104180