
Intelligent Diagnosis of Concrete Defects Based on Improved Mask R-CNN


Abstract
1. Introduction
- (1)
- Constructed the dataset from multiple defects of concrete. Collected the concrete defect images, including crack, exposed bar, spalling, efflorescence and void, and used data expansion techniques (translation, flip, brightness change and noise addition) to expand the dataset, which solves the problem of the unbalanced number of samples in the concrete defect dataset and enhances the robustness and generalization of the model.
- (2)
- Optimized the scale and aspect ratio of the prior box. Used the K-means clustering algorithm to determine the most appropriate scale and aspect ratio of the prior box for the multiclass concrete defect dataset aforementioned, so that the rectangular prediction boxes could be evenly distributed on the concrete defects and the redundancy of prediction boxes could be reduced.
- (3)
- Replaced the residual network (ResNet101) with the lightweight network MobileNetV2 as the backbone network of Mask R-CNN, and combined with the path aggregation network (PANet), which solves the problem that ResNet101 has a lower ability to extract shallow feature information and its speed of computation is slow. Embedded attention mechanism modules in FPNs, which increased the extraction of semantic information by the model, and effectively avoided the influence of background on the performance of the model.
2. Methods
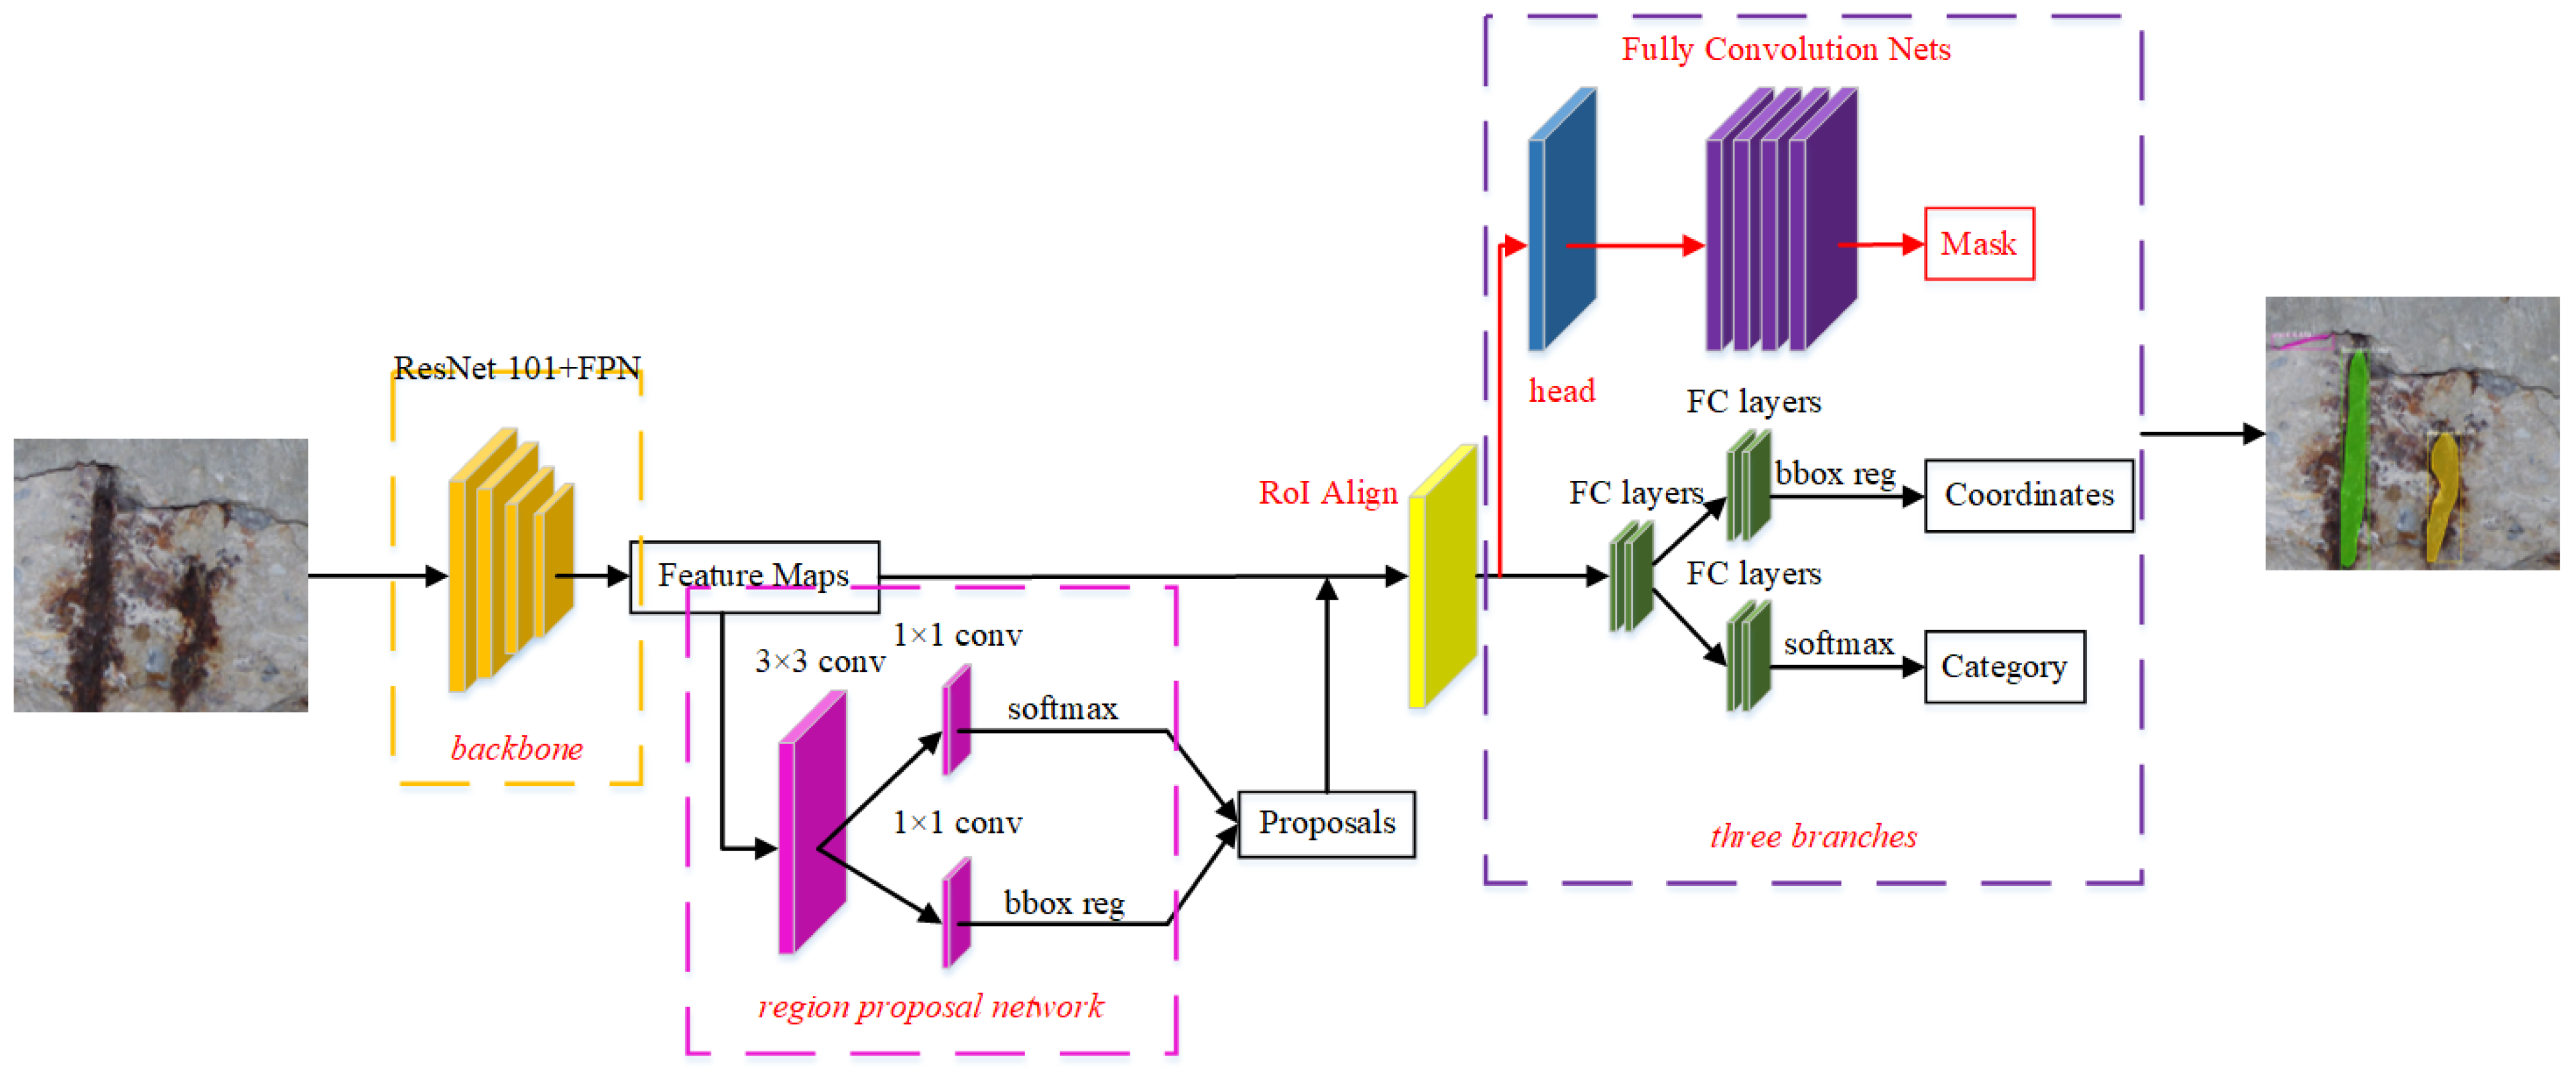
2.1. Mask R-CNN
- (1)
- Feature extraction network: combined ResNet101 and FPNs to extract the multiscale feature map. As shown in Figure 2, the left is ResNet101, and the original image is convolved and pooled to obtain the feature figures C1–C5 of the five stages. Then, C5 is copied into P5, P5 is up-sampled, C4 is conducted dimensionality reduction and then C4 and P5 are fused to obtain P4, and so on, forming a top-down feature pyramid. Generally, convolutional neural networks (CNNs) directly use the feature maps of the last layer to predict the targets; although the feature map of the last layer has strong semantics, the resolution is relatively low, so the relatively small targets cannot be detected easily. FPN fuses the high semantic feature information of the higher layer with the high-resolution feature information of the lower layer, and can make the prediction on each feature layer, so that the features of smaller targets can be extracted more easily.
- (2)
- Region proposals: input feature map into region proposal network (RPN), take each pixel in the feature map as the center, map out nine different anchor boxes (which are formed by a free combination of three different aspect ratios (0.5, 1, 2) and three different pixel scales (1282, 2562 and 5122)) on the original image, to obtain multiple candidate regions of interest (ROIs); These candidate ROIs are judged by softmax on whether they contain targets, and bounding box regression is used to correct the position of anchors. The non-maximum suppression algorithm is used to filter out some candidate ROIs. Then, obtain region proposals.
- (3)
- ROI Align: through ROI Align, the region proposals are aligned to each pixel of the feature map, and each pixel of the feature map is aligned to fixed features.
- (4)
- Fully connected network: the region proposals which are aligned by pixel and fixed features are used for target classification and prediction box regression (target location).
- (5)
- Mask branch: generates a prediction box and classifies and masks the pixel points inside the box to obtain the semantic segmentation results.
2.2. Improvement on Mask-RCNN
3. Experimental Data and Parameters
3.1. Experimental Data
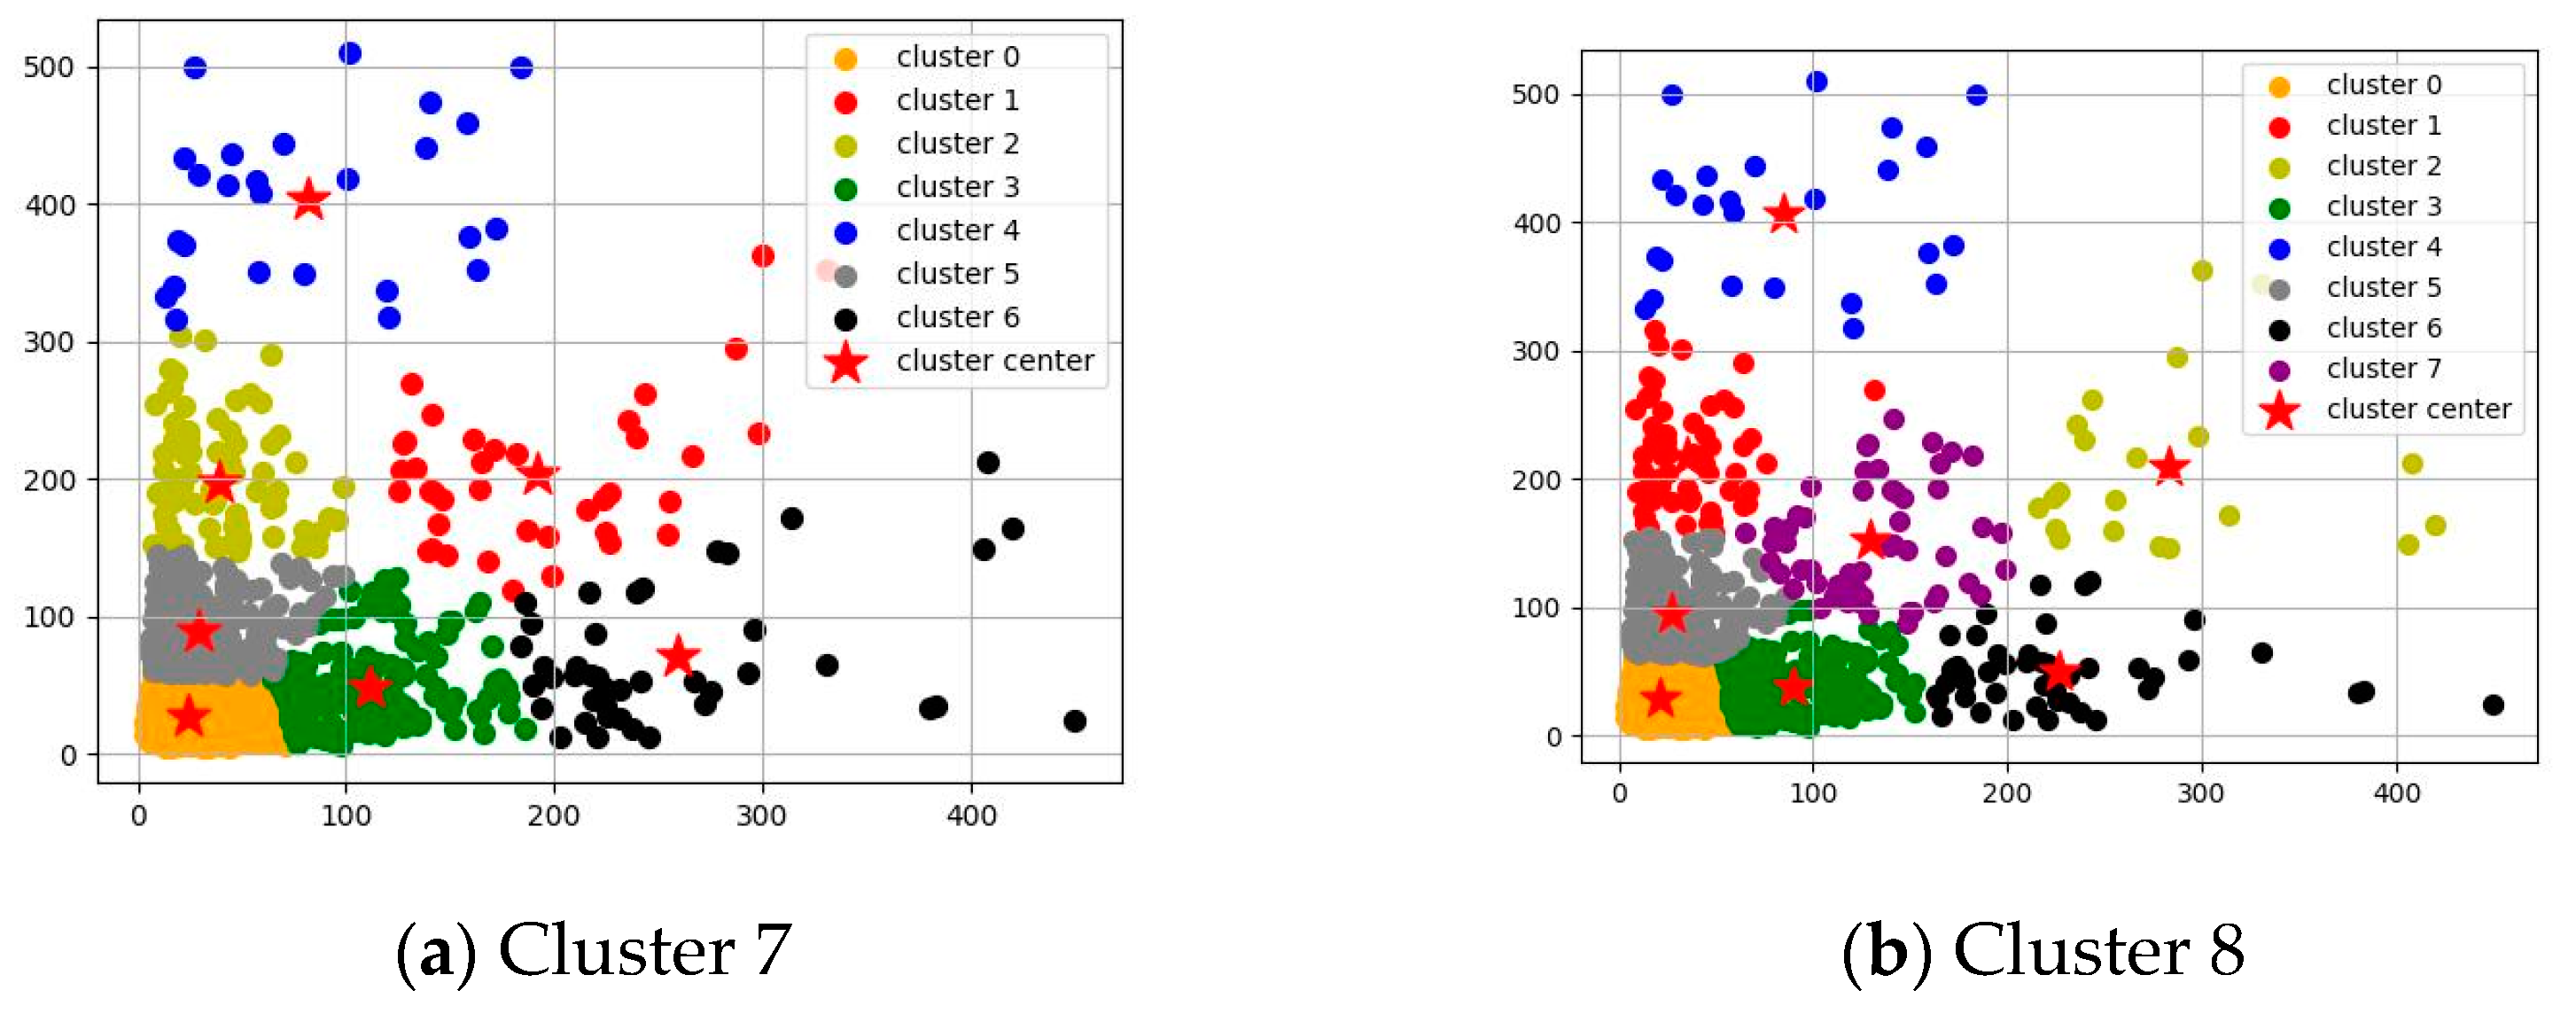
3.2. Aspect Ratios of the Anchor Boxes
3.3. Model Training
3.4. Evaluation Index
4. Experimental Evaluation and Analysis
4.1. Influence of the Aspect Ratios of the Anchor Boxes
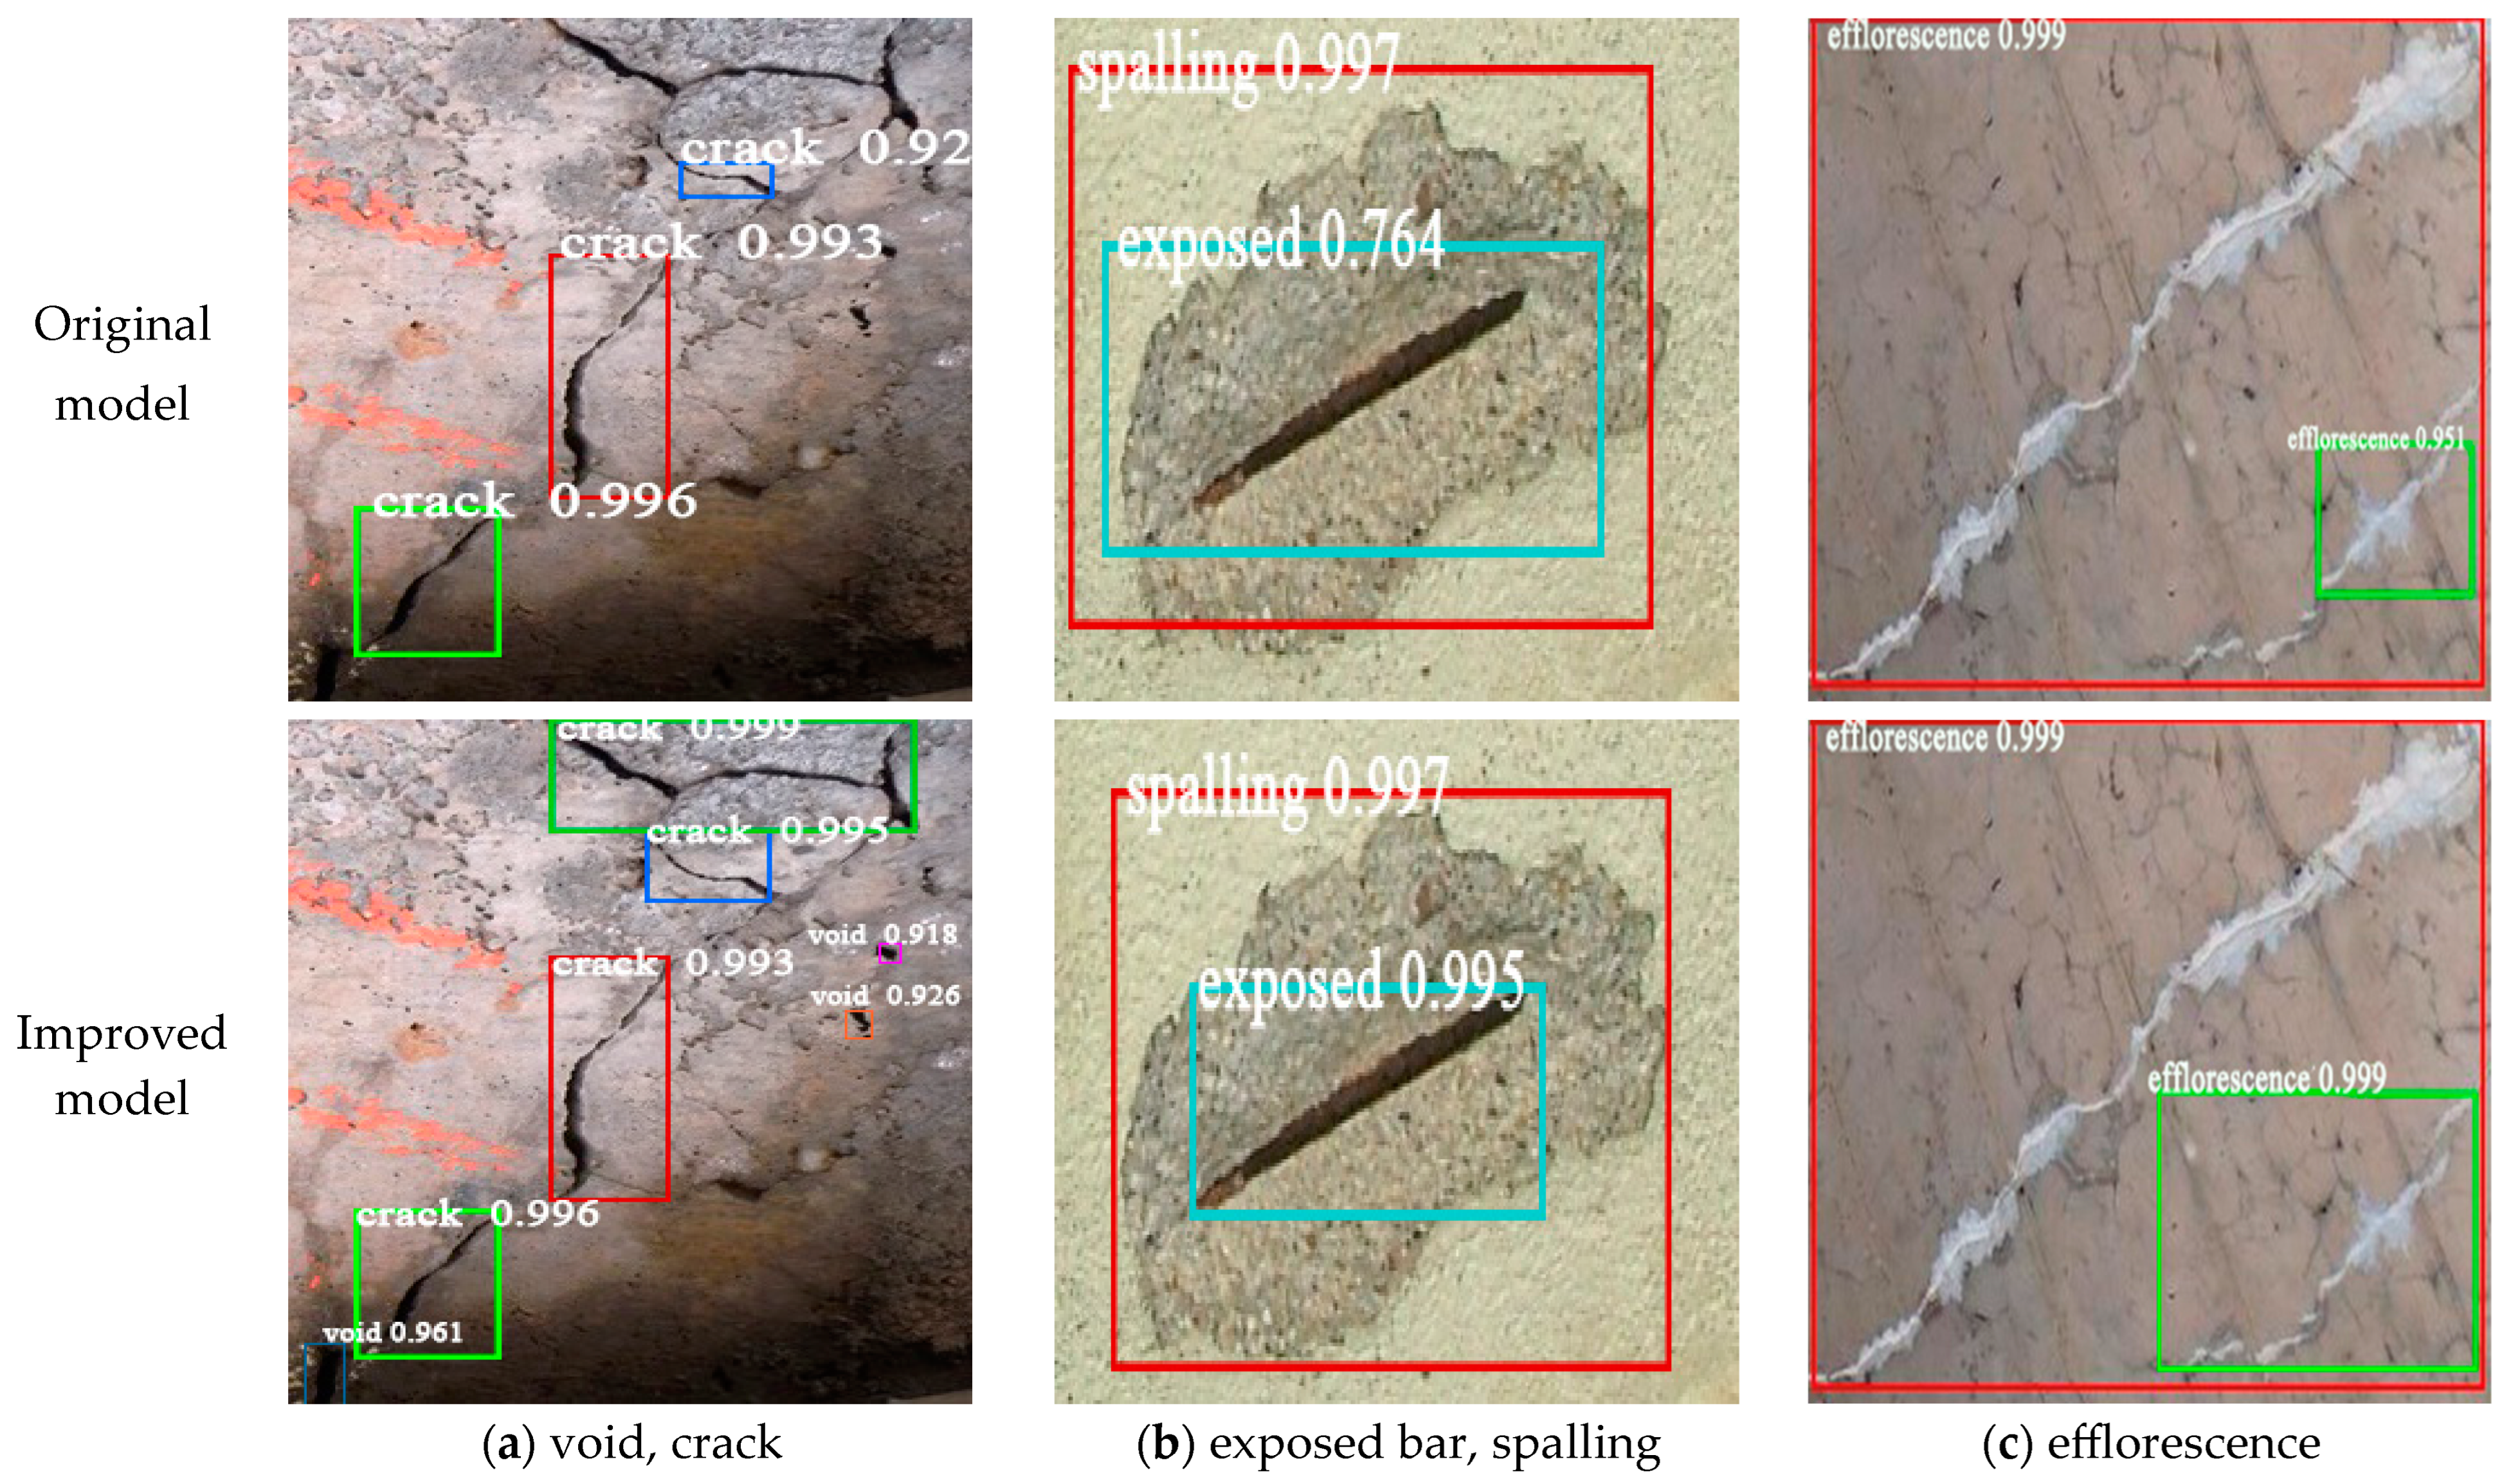
4.2. Improved Mask-RCNN Detection Results
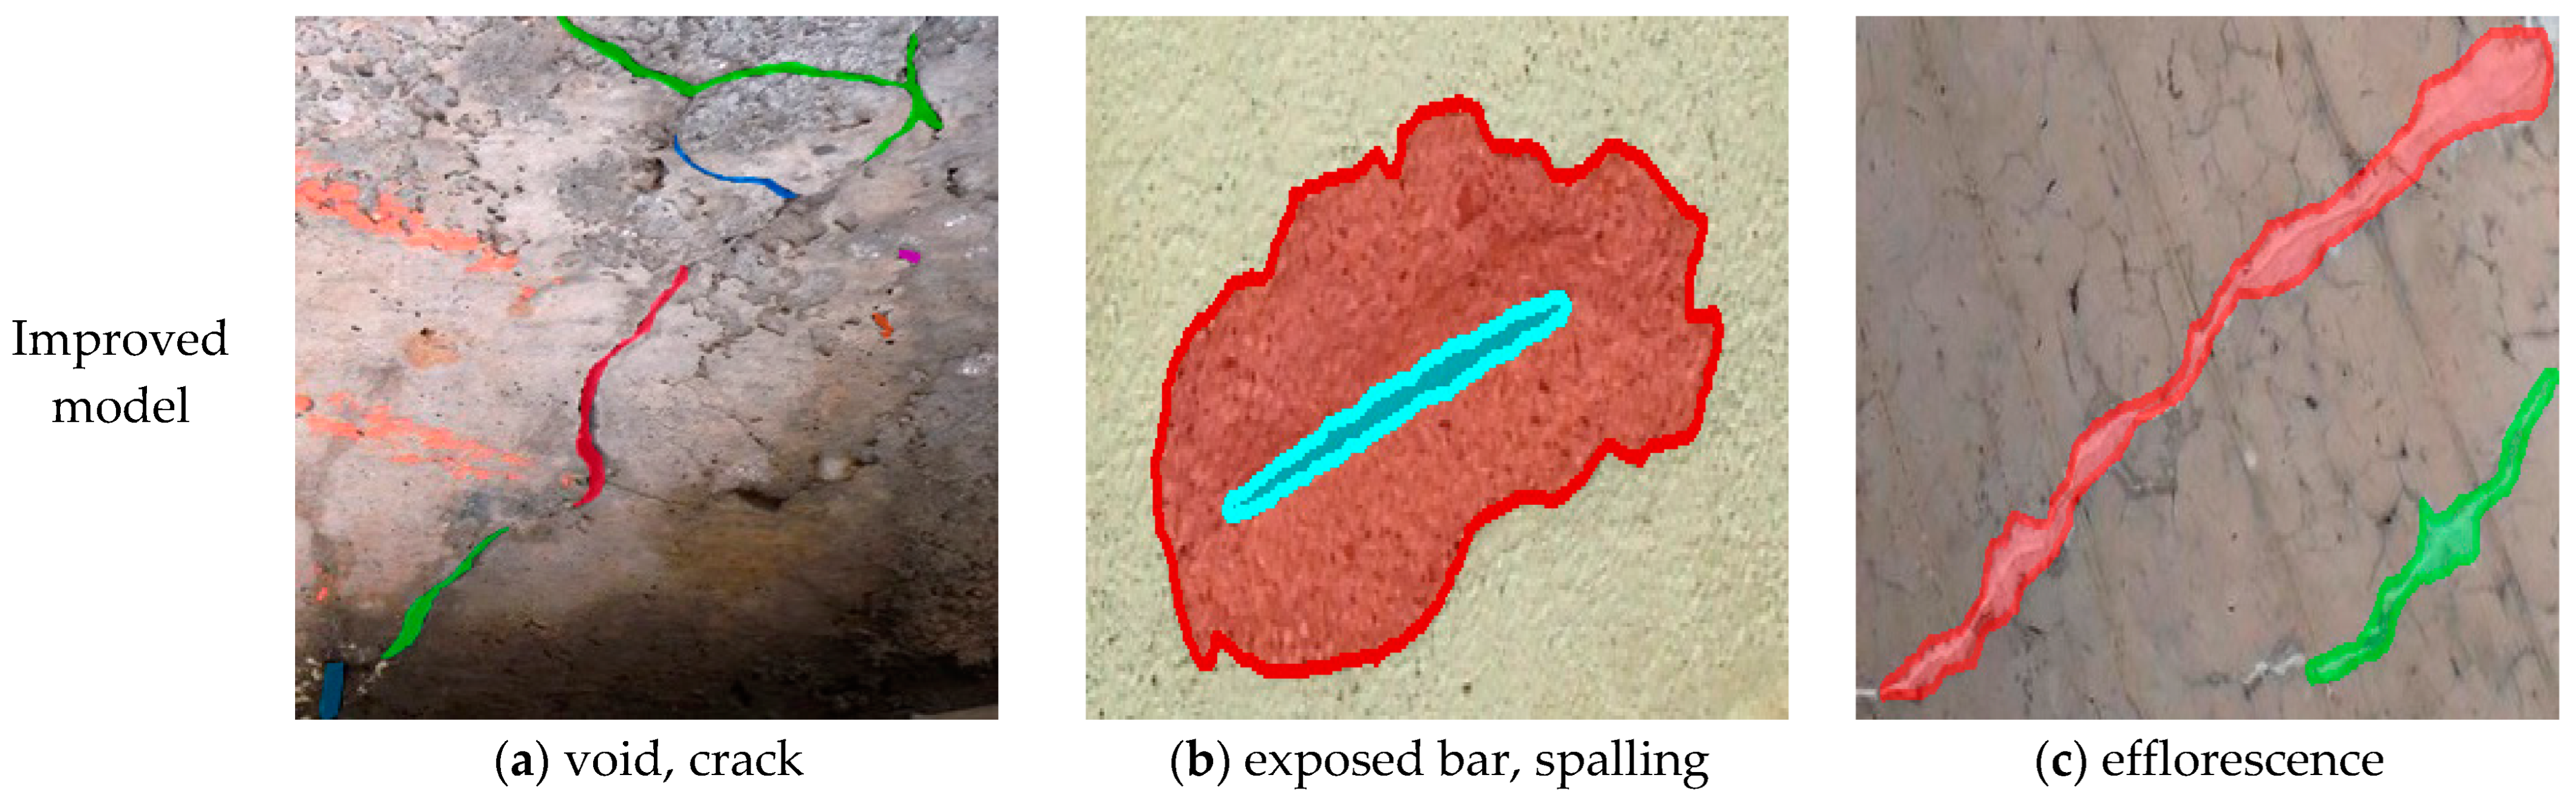
4.3. Instance Segmentation Visualization Results
4.4. Predicted Results of Different Network Models
5. Detection Results of Open Dataset
6. Engineering Applications
7. Conclusions
- (1)
- The K-means clustering algorithm can improve the precision and recall rate of the Mask-RCNN network model for the target detection of multiscale concrete defects.
- (2)
- The improvement method proposed in this paper can reduce the number of model parameters and calculations, and improve the model calculation speed and inference speed. The improved Mask R-CNN model can more accurately locate and detect the defect, and the precision and recall rate are higher than the original model, and the missed detection and error mask operation are reduced.
- (3)
- Comparing the accuracy and inference time of the original Mask-RCNN model and the YOLOv5, Faster-RCNN for defect identification, the improved Mask-RCNN model has the highest overall accuracy (mAP = 92.5%) with a very small difference in inference time.
- (4)
- The improved Mask R-CNN proposed in this paper has higher detection accuracy for the images taken by the UAVs which is new and untrained; the overall accuracy, recall rate and mAP values reach 94.7%, 95.3%, and 90.6%, respectively, and it is suitable for actual engineering applications.
Author Contributions
Funding
Institutional Review Board Statement
Informed Consent Statement
Data Availability Statement
Conflicts of Interest
References
- Rathod, H.; Gupta, R. Sub-surface Simulated Damage Detection using Non-destructive testing techniques in reinforced-concrete slabs. Constr. Build. Mater. 2019, 215, 754–764. [Google Scholar] [CrossRef]
- Scattarreggia, N.; Salomone, R.; Moratti, M.; Malomo, D.; Pinho, R.; Calvi, G.M. Collapse analysis of the multi-span reinforced concrete arch bridge of caprigliola, Italy. Eng. Struct. 2022, 251, 113375. [Google Scholar] [CrossRef]
- Salem, H.; Helmy, H. Numerical investigation of collapse of the Minnesota I-35W bridge. Eng. Struct. 2014, 59, 635–645. [Google Scholar] [CrossRef]
- Pinho, R.; Scattarreggia, N.; Orgnoni, A.; Lenzo, S.; Grecchi, G.; Moratti, M.; Calvi, G.M. Forensic estimation of the residual capacity and imposed demand on a ruptured concrete bridge stay at the time of collapse. Structures 2023, 55, 1595–1606. [Google Scholar] [CrossRef]
- Scattarreggia, N.; Malomo, D.; DeJong, M.J. A new Distinct Element meso-model for simulating the rocking-dominated seismic response of RC columns. Earthq. Eng. Struct. Dyn. 2022, 52, 828–838. [Google Scholar] [CrossRef]
- Malomo, D.; Pinho, R.; Penna, A. Using the applied element method for modelling calcium silicate brick masonry subjected to in-plane cyclic loading. Earthq. Eng. Struct. Dyn. 2018, 47, 1610–1630. [Google Scholar] [CrossRef]
- Xu, Z.; Lu, X.; Guan, H.; Lu, X.; Ren, A. Progressive-Collapse Simulation and Critical Region Identification of a Stone Arch Bridge. J. Perform. Constr. Facil. 2013, 27, 43–52. [Google Scholar] [CrossRef]
- Peng, X.; Zhong, X.; Zhao, C.; Chen, A.; Zhang, T. A UAV-based machine vision method for bridge crack recognition and width quantification through hybrid feature learning. Constr. Build. Mater. 2021, 299, 123896. [Google Scholar] [CrossRef]
- Wang, H.-F.; Zhai, L.; Huang, H.; Guan, L.-M.; Mu, K.-N.; Wang, G.-P. Measurement for cracks at the bottom of bridges based on tethered creeping unmanned aerial vehicle. Autom. Constr. 2020, 119, 103330. [Google Scholar] [CrossRef]
- Dorafshan, S.; Thomas, R.J.; Maguire, M. Comparison of deep convolutional neural networks and edge detectors for image-based crack detection in concrete. Constr. Build. Mater. 2018, 186, 1031–1045. [Google Scholar] [CrossRef]
- Kheradmandi, N.; Mehranfar, V. A critical review and comparative study on image segmentation-based techniques for pavement crack detection. Constr. Build. Mater. 2022, 321, 126162. [Google Scholar] [CrossRef]
- Zhong, B.; Wu, H.; Ding, L.; Love, P.E.D.; Li, H.; Luo, H.; Jiao, L. Mapping Computer Vision Research in Construction: Developments, Knowledge Gaps and Implications for Research. Autom. Constr. 2019, 107, 102919. [Google Scholar] [CrossRef]
- Wang, K.; Chen, K.; Du, H.; Liu, S.; Xu, J.; Zhao, J.; Chen, H.; Liu, Y.; Liu, Y. New image dataset and new negative sample judgment method for crop pest recognition based on deep learning models. Ecol. Inform. 2022, 69, 101620. [Google Scholar] [CrossRef]
- Yang, L.; Li, Z.; Ma, S.; Yang, X. Artificial intelligence image recognition based on 5G deep learning edge algorithm of Digestive endoscopy on medical construction. Alex. Eng. J. 2021, 61, 1852–1863. [Google Scholar] [CrossRef]
- Fujiyoshi, H.; Hirakawa, T.; Yamashita, T. Deep learning-based image recognition for autonomous driving. IATSS Res. 2019, 43, 244–252. [Google Scholar] [CrossRef]
- Ak, A.; Topuz, V.; Midi, I. Motor imagery EEG signal classification using image processing technique over GoogLeNet deep learning algorithm for controlling the robot manipulator. Biomed. Signal Process. Control 2021, 72, 103295. [Google Scholar] [CrossRef]
- Aggarwal, A.; Toshniwal, D. A hybrid deep learning framework for urban air quality forecasting. J. Clean. Prod. 2021, 329, 129660. [Google Scholar] [CrossRef]
- Ye, W.; Deng, S.; Ren, J.; Xu, X.; Zhang, K.; Du, W. Deep learning-based fast detection of apparent concrete crack in slab tracks with dilated convolution. Constr. Build. Mater. 2022, 329, 127157. [Google Scholar] [CrossRef]
- Zhou, Z.; Zhang, J.; Gong, C. Automatic detection method of tunnel lining multi-defects via an enhanced You Only Look Once network. Comput. Civ. Infrastruct. Eng. 2022, 37, 762–780. [Google Scholar] [CrossRef]
- Jang, K.; An, Y.; Kim, B.; Cho, S. Automated crack evaluation of a high-rise bridge pier using a ring-type climbing robot. Comput. Civ. Infrastruct. Eng. 2020, 36, 14–29. [Google Scholar] [CrossRef]
- Ali, R.; Kang, D.; Suh, G.; Cha, Y.-J. Real-time multiple damage mapping using autonomous UAV and deep faster region-based neural networks for GPS-denied structures. Autom. Constr. 2021, 130, 103831. [Google Scholar] [CrossRef]
- Kang, D.; Benipal, S.S.; Gopal, D.L.; Cha, Y.-J. Hybrid pixel-level concrete crack segmentation and quantification across complex backgrounds using deep learning. Autom. Constr. 2020, 118, 103291. [Google Scholar] [CrossRef]
- Deng, J.; Lu, Y.; Lee, C.S. Imaging-based crack detection on concrete surfaces using You Only Look Once network. Struct. Health Monit. 2020, 20, 484–499. [Google Scholar] [CrossRef]
- Park, S.E.; Eem, S.-H.; Jeon, H. Concrete crack detection and quantification using deep learning and structured light. Constr. Build. Mater. 2020, 252, 119096. [Google Scholar] [CrossRef]
- Jiang, Y.; Pang, D.; Li, C. A deep learning approach for fast detection and classification of concrete damage—ScienceDirect. Autom. Constr. 2021, 128, 103785. [Google Scholar] [CrossRef]
- Liu, Z.; Cao, Y.; Wang, Y.; Wang, W. Computer vision-based concrete crack detection using U-net fully convolutional networks. Autom. Constr. 2019, 104, 129–139. [Google Scholar] [CrossRef]
- Wei, F.; Yao, G.; Yang, Y.; Sun, Y. Instance-level recognition and quantification for concrete surface bughole based on deep learning. Autom. Constr. 2019, 107, 102920. [Google Scholar] [CrossRef]
- Joshi, D.; Singh, T.P.; Sharma, G. Automatic surface crack detection using segmentation-based deep-learning approach. Eng. Fract. Mech. 2022, 268, 108467. [Google Scholar] [CrossRef]
- Kim, B.; Cho, S. Image-based concrete crack assessment using mask and region-based convolutional neural network. Struct. Control. Health Monit. 2019, 26, e2381. [Google Scholar] [CrossRef]
- Xu, Y.; Li, D.; Xie, Q.; Wu, Q.; Wang, J. Automatic defect detection and segmentation of tunnel surface using modified Mask R-CNN. Measurement 2021, 178, 109316. [Google Scholar] [CrossRef]
- Chen, X.; Fang, H.; Lin, T.Y.; Vedantam, R.; Gupta, S.; Dollár, P. Microsoft COCO Captions: Data Collection and Evaluation Server. arXiv 2015, arXiv:1504.00325. [Google Scholar] [CrossRef]
- Mundt, M.; Majumder, S.; Murali, S.; Panetsos, P.; Ramesh, V. Meta-learning Convolutional Neural Architectures for Multi-target Concrete Defect Classification with the COncrete DEfect BRidge IMage Dataset. In Proceedings of the IEEE/CVF Conference on Computer Vision and Pattern Recognition, Long Beach, CA, USA, 15–20 June 2019; pp. 11188–11197. [Google Scholar]


| Evaluation Indicator | Defect Type | Total | ||||||||||
|---|---|---|---|---|---|---|---|---|---|---|---|---|
| Crack | Exposed Bars | Spalling | Efflorescence | Void | ||||||||
| Original | K-Means | Original | K-Means | Original | K-Means | Original | K-Means | Original | K-Means | Original | K-Means | |
| TP | 185 | 189 | 253 | 254 | 207 | 205 | 259 | 262 | 215 | 214 | 1119 | 1124 |
| FP | 16 | 15 | 10 | 9 | 12 | 10 | 15 | 13 | 17 | 14 | 70 | 61 |
| FN | 25 | 21 | 8 | 7 | 4 | 6 | 20 | 17 | 22 | 23 | 79 | 74 |
| Precision/% | 92.0 | 92.6 | 96.2 | 96.6 | 94.5 | 95.3 | 94.5 | 95.3 | 92.7 | 93.9 | 94.1 | 94.8 |
| recall rate/% | 88.1 | 90.0 | 97.0 | 97.3 | 98.1 | 97.2 | 92.8 | 93.9 | 90.7 | 90.3 | 93.4 | 93.8 |
| AP/% | 81.1 | 83.3 | 93.3 | 94.0 | 92.7 | 92.6 | 87.7 | 89.5 | 85.9 | 84.8 | 88.1 | 88.8 |
| Evaluation Indicator | Defect Type | Total | ||||||||||
|---|---|---|---|---|---|---|---|---|---|---|---|---|
| Crack | Exposed Bars | Spalling | Efflorescence | Void | ||||||||
| Improved | K-Means | Improved | K-Means | Improved | K-Means | Improved | K-Means | Improved | K-Means | Improved | K-Means | |
| TP | 196 | 189 | 259 | 254 | 211 | 205 | 264 | 262 | 223 | 214 | 1153 | 1124 |
| FP | 14 | 15 | 7 | 9 | 8 | 10 | 11 | 13 | 12 | 14 | 52 | 61 |
| FN | 12 | 21 | 5 | 7 | 3 | 6 | 15 | 17 | 15 | 23 | 50 | 74 |
| Precision/% | 93.3 | 92.6 | 97.3 | 96.6 | 96.3 | 95.3 | 96.0 | 95.3 | 94.9 | 93.9 | 95.6 | 94.8 |
| recall rate/% | 94.2 | 90.0 | 98.1 | 97.3 | 98.6 | 97.2 | 94.6 | 93.9 | 93.6 | 90.3 | 95.8 | 93.8 |
| AP/% | 88.4 | 83.3 | 97.0 | 94.0 | 95.8 | 92.6 | 92.0 | 89.5 | 89.6 | 84.8 | 92.5 | 88.8 |
| Method | Crack AP/% | Exposed Bars AP/% | Spalling AP/% | Efflorescence AP/% | Void AP/% | mAP/% | Inference Time/s |
|---|---|---|---|---|---|---|---|
| Faster-RCNN | 76.0 | 93.3 | 88.3 | 89.7 | 84.8 | 86.4 | 0.752 |
| YOLOv5 | 71.5 | 82.8 | 85.4 | 85.4 | 74.2 | 79.9 | 0.274 |
| Mask-RCNN | 81.1 | 93.3 | 92.7 | 87.7 | 85.9 | 88.1 | 0.871 |
| Mask-RCNN + K-means | 83.3 | 94.0 | 92.6 | 89.5 | 84.8 | 88.8 | 0.870 |
| Mask-RCNN+* | 87.5 | 96.2 | 94.5 | 90.6 | 88.4 | 91.4 | 0.504 |
| Improved Mask-RCNN | 88.4 | 97.0 | 95.8 | 92.0 | 89.6 | 92.5 | 0.525 |
| Method | Crack AP/% | Exposed Bars AP/% | Spalling AP/% | Efflorescence AP/% | mAP/% | Inference Time/s |
|---|---|---|---|---|---|---|
| Faster-RCNN | 80.2 | 94.6 | 83.9 | 91.2 | 85.0 | 0.692 |
| YOLOv5 | 73.8 | 84.7 | 81.3 | 85.3 | 81.3 | 0.135 |
| Mask-RCNN | 83.0 | 97.5 | 97.6 | 96.1 | 93.6 | 0.811 |
| Mask-RCNN + K-means | 85.1 | 97.3 | 97.6 | 96.2 | 94.1 | 0.815 |
| Mask-RCNN+* | 87.9 | 98.6 | 97.7 | 97.3 | 95.4 | 0.423 |
| Improved Mask-RCNN | 88.1 | 98.9 | 97.8 | 97.6 | 95.6 | 0.467 |
| Evaluation Indicator | Defect Type | Total | ||||
|---|---|---|---|---|---|---|
| Crack | Exposed Bars | Spalling | Efflorescence | Viod | ||
| TP | 53 | 73 | 55 | 27 | 48 | 256 |
| FP | 4 | 2 | 2 | 1 | 4 | 13 |
| FN | 3 | 1 | 3 | 1 | 3 | 11 |
| Precision/% | 92.9 | 97.3 | 96.4 | 96.4 | 92.3 | 94.7 |
| recall rate/% | 94.6 | 98.6 | 94.8 | 96.4 | 94.1 | 95.3 |
| AP/% | 86.3 | 95.9 | 91.2 | 92.7 | 87.1 | |
Disclaimer/Publisher’s Note: The statements, opinions and data contained in all publications are solely those of the individual author(s) and contributor(s) and not of MDPI and/or the editor(s). MDPI and/or the editor(s) disclaim responsibility for any injury to people or property resulting from any ideas, methods, instructions or products referred to in the content. |
© 2024 by the authors. Licensee MDPI, Basel, Switzerland. This article is an open access article distributed under the terms and conditions of the Creative Commons Attribution (CC BY) license (https://creativecommons.org/licenses/by/4.0/).
Share and Cite
Huang, C.; Zhou, Y.; Xie, X. Intelligent Diagnosis of Concrete Defects Based on Improved Mask R-CNN. Appl. Sci. 2024, 14, 4148. https://doi.org/10.3390/app14104148
Huang C, Zhou Y, Xie X. Intelligent Diagnosis of Concrete Defects Based on Improved Mask R-CNN. Applied Sciences. 2024; 14(10):4148. https://doi.org/10.3390/app14104148
Chicago/Turabian StyleHuang, Caiping, Yongkang Zhou, and Xin Xie. 2024. "Intelligent Diagnosis of Concrete Defects Based on Improved Mask R-CNN" Applied Sciences 14, no. 10: 4148. https://doi.org/10.3390/app14104148
APA StyleHuang, C., Zhou, Y., & Xie, X. (2024). Intelligent Diagnosis of Concrete Defects Based on Improved Mask R-CNN. Applied Sciences, 14(10), 4148. https://doi.org/10.3390/app14104148