Abstract
The structural performance of shield tunnel structures is highly susceptible to degradation under complex environmental loads, with the most common manifestation being bolt preload loss. In this study, a shield tunnel numerical simulation model was established to analyze the seismic response of shield tunnels with varying degrees of bolt preload loss. Firstly, the deformation patterns of shield tunnel structures under seismic loads were analyzed. Subsequently, ellipticity and joint opening were selected as seismic resilience assessment indicators based on the mechanical response. A seismic resilience assessment model was then established, including three states: normal state, affected state, and recovered state. The results show a direct relationship between the recovery capacity of tunnel structures and the initial performance of the lining structure, as well as the magnitude of the load. The lower the degree of structure degradation, the greater the structural recovery capacity. Additionally, there is a positive correlation between residual deformation and the initial performance loss of shield tunnel structures, as well as the intensity of seismic loads. This study contributes to enriching the theoretical framework for the seismic resilience assessment of shield tunnels, which have significant implications and provide valuable references for engineering safety.
1. Introduction
Shield tunnels, as an efficient, rapid, and environmentally friendly method for underground transportation construction, have become an indispensable part of urban infrastructure development. The shield tunnel structure, as a non-continuous body composed of prefabricated pipe segments, is prone to significant structural deformation due to the characteristics of its assembled pipe segment structure, which is easily affected by external loads and other factors. This can lead to structural diseases such as water leakage at pipe segment joints, concrete pipe segment cracking and peeling, and pipe segment misalignment, thereby affecting the overall service life of the structure [1,2,3,4,5,6,7]. Hence, the lining performance of the shield tunnel during the operational phase is a crucial factor that influences the sustainable development of urban transportation infrastructure [8,9,10].
An accurate assessment of the structural performance of shield tunnels is a prerequisite for ensuring tunnel structural safety. Currently, research primarily focuses on assessing the tunnel’s load-bearing capacity at a specific moment [11,12]. However, the time-dependent evolution of the tunnel’s structural performance is less considered during the operational phase. In recent years, resilience has been introduced into engineering. Shadabfar et al. [13] categorized current infrastructure resilience assessment models into two main types: deterministic assessment models based on explicit performance functions and probabilistic assessment models that take into account the influence of uncertainty factors. The deterministic models are more widely applied in the resilience assessment of shield tunnels during the operational phase. Huang and Zhang [14] proposed a resilience assessment method based on the tunnel’s horizontal convergence indicator and evaluated the resilience evolution patterns of the tunnel throughout the disturbance-reinforcement process in a ground-loading case study. Lin et al. [15,16] proposed a theoretical model for the resilience assessment of shield tunnels under multiple disturbances, considering deformation indicators such as tunnel convergence and displacement. The development of resilience theory has greatly enriched the dimensions of infrastructure safety assessment.
At present, a large number of scholars have studied the dynamic response of shield tunnels; among them, Xu et al. [17] studied the influence of the damping layer on the dynamic response of the tunnel and proved that the damping layer can effectively reduce the seismic response of the secondary lining of the tunnel. Dong et al. [18] established a model of a shield tunnel containing segment joints and analyzed the influence of segment type on the seismic response of the tunnel structure. Xu et al. [19] used numerical simulation to analyze the seismic response of tunnels in different buried depths and considered the seismic peak strength and concrete strength. Liu et al. [20] used the finite element method to analyze the dynamic response of the subway shield tunnel under the influence of El-Centro earthquake. Wang et al. [21] studied the structure–soil interaction of the shield tunnel in the complex geological strata and the destruction characteristics of the tunnel structure under seismic action. However, the impact of the seismic load on the full cycle of the structure is not considered.
Zhu et al. [22] conducted historical maximum deformation as an indicator to investigate the response characteristics and resilience evolution patterns of shield tunnel structures at different depths under the influence of ground loading and unloading. Zhang et al. [23] conducted a full-scale experiment on the longitudinal joints of shield tunnels; according to the test results, the deformation resistance and load variation rule of tunnel longitudinal joints are obtained to analyze the resilience evolution of longitudinal joints in tunnels. Currently, there is a lack of resilience assessment methods for shield tunnels considering the effects of seismic loads. Additionally, many resilience assessment indicators are based on the deformation of tunnel structures, which may not adequately reflect the resilience of shield tunnels under short-term dynamic loads. Therefore, the mechanical mechanisms and evolution patterns of resilience indicators for shield tunnel structures are not yet clear, which limits their widespread application in engineering.
In this study, a refined numerical simulation model of shield tunnels was established based on the finite element method. The mechanical responses of shield tunnel structures under the combined effects of seismic loads and bolt preload loss are analyzed. Furthermore, various indicators were selected to establish a resilience evolution assessment model that encompasses the normal state, affected state, and recovered state. This study can provide a valuable reference for the seismic resilience assessment of shield tunnels.
2. Resilience Assessment Model
On the basis of existing research, establish a seismic resilience evaluation model for shield tunnel structures under seismic loads. Determine the ellipticity and segment joint opening as resilience evaluation indicators, establish structural performance calculation formulas based on the warning and control values in the specifications, and determine the performance curve of shield tunnel lining.
2.1. Introduction of Resilience Assessment Model
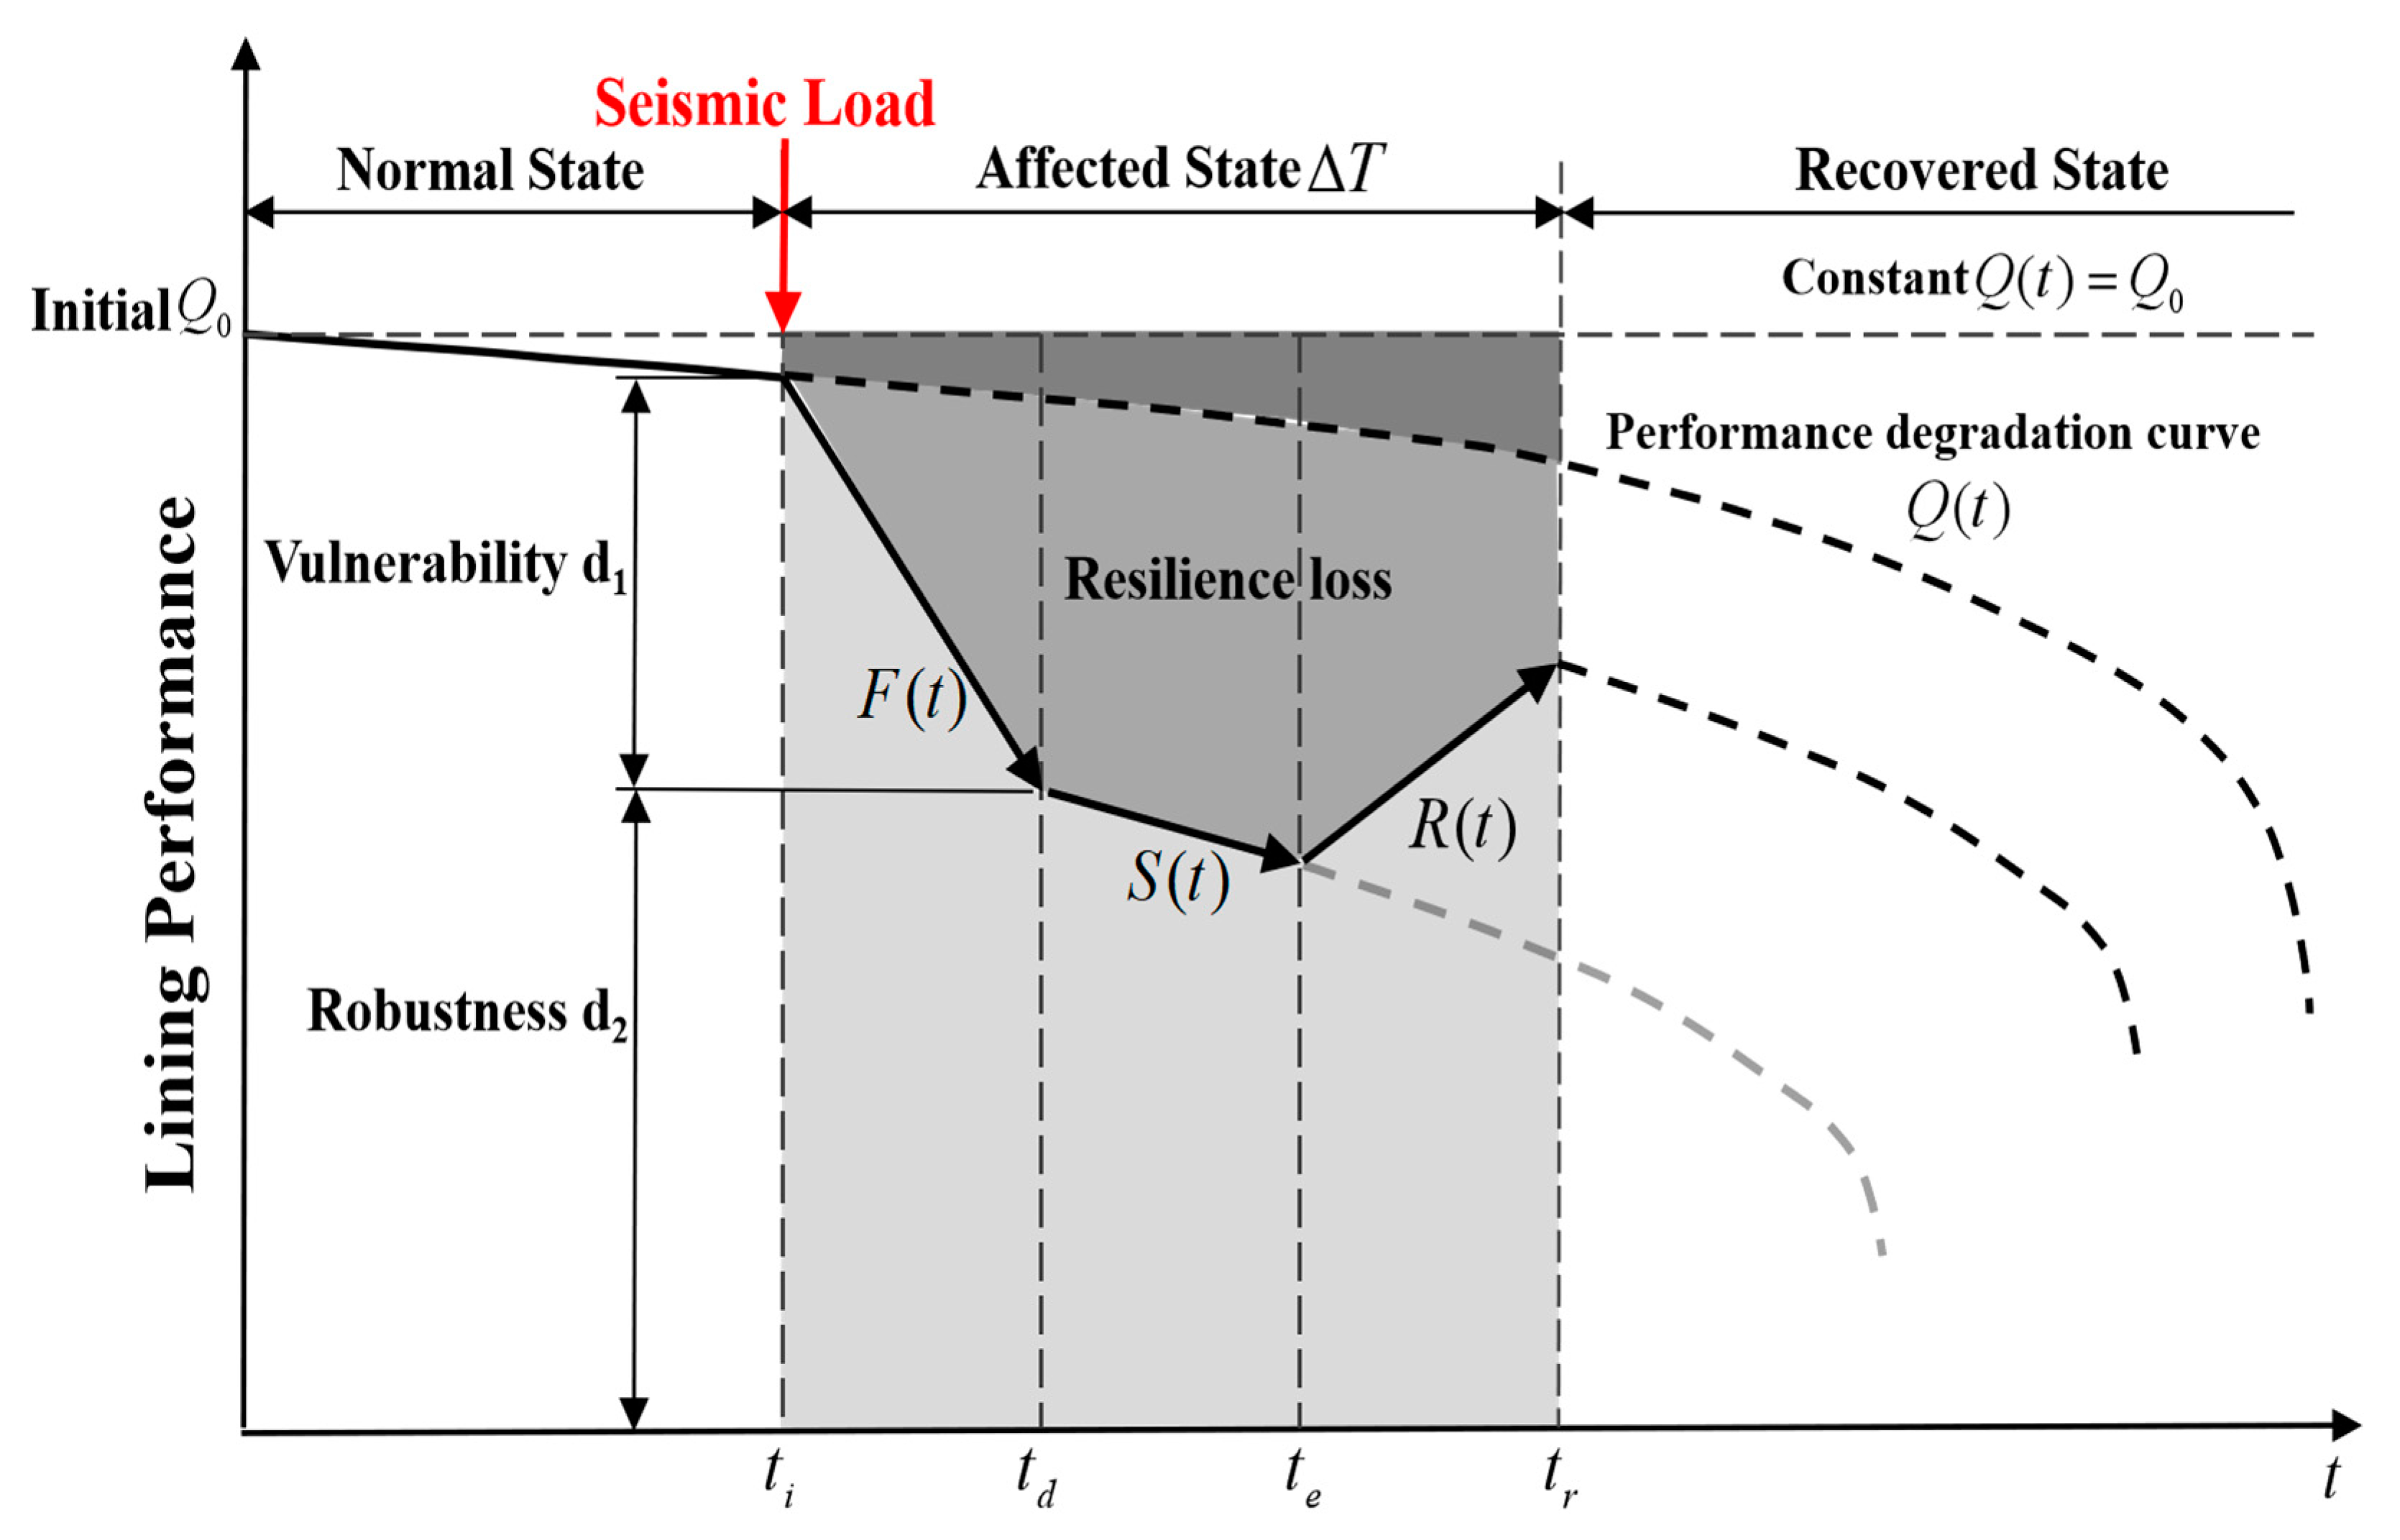
A typical resilience assessment frame is shown in Figure 1. During the long-term operational phase of shield tunnels, the resilience evolution of the shield tunnel can be divided into three states: the normal state, the affected state, and the recovered state. The normal state refers to the gradual evolution of the durability of the shield tunnel over time under the influence of various factors, as indicated by the curve Q(t) in the figure. The affected stage signifies a sudden external force acting on the shield tunnel at a specific moment, leading to a rapid decline in structural performance, as indicated by the red arrow in the figure. In this study, the affected stage specifically refers to the impact of seismic loads. Specifically, the affected state can be subdivided into (a) disruption stage ( is the start time of seismic loads, and F(t) represents the curve of tunnel performance reduction caused by seismic loads during ); (b) evolution stage: (, where S(t) represents the curve of tunnel performance evolution after seismic loads occurred but before any measures were taken); (c) recovery stage (, where R(t) represents the recovery curve of tunnel performance after implementing restoration measures). The downward value d1 during the disturbance stage can be referred to as the vulnerability of the structure, while the residual value d2 reflects the robustness of the tunnel structure.
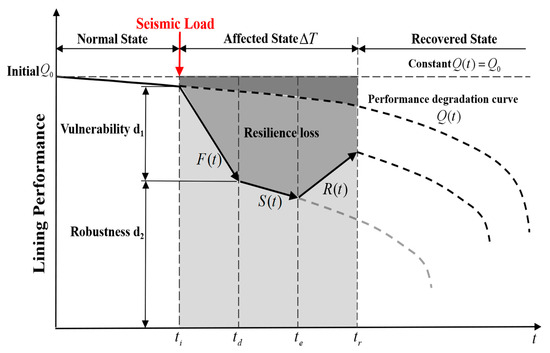
Figure 1.
Framework of shield tunnel resilience evaluation.
Regarding the resilience indicator Re of tunnel structures, both references [14,24] employ the area enclosed by the disturbance-induced performance curve and the normal decay curve divided by the coordinate axes. However, this method does not account for the degradation in structural performance caused by environmental erosion before the disturbance, leading to an overestimation of the resilience indicator. Lin et al. [21] solved this problem by considering the area of the dark-shaded region between the normal performance decay curve and the bounding straight line , as shown in Figure 1. On the other hand, Zhu et al. [22] use a resilience indicator for tunnel structures defined by weighted coefficients to reduce the calculation error. In this study, a resilience assessment model for tunnel structures under seismic loads was established based on extensive studies [20,21,22,24]. The seismic resilience is defined as follows:
where is the initial performance of shield tunnel; is the duration of the affected stage; F, S, and R, respectively, represent the areas enclosed by the tunnel structure performance decay curves, and the coordinate axes during the disruption stage, evolution stage, and recovery stage. They can be calculated by Equations (2)–(4).
2.2. Resilience Assessment Indicators
The selection of appropriate structural performance indicators for shield tunnels is a prerequisite for conducting resilience assessments. The Technical Code for the Protection Structures of Urban Rail Transit [25] recommends the use of a series of safety control indicators for shield tunnels, including the displacement of tunnel structures, radial convergence deformation, track height difference, tunnel deformation curvature radius, segment joint opening, segment crack width, and additional loads. However, it is hard to consider all the above parameters comprehensively in practical engineering. It is common to select certain parameters as important measurement indicators to ensure the safety of tunnel structures. Because under seismic loads, they have significant correlation with the loss of shield tunnel lining performance. In this study, the ellipticity and the joint opening of the shield tunnel are chosen as the resilience assessment indicators separately. Additionally, the damage to segments is an irreversible process, and resilience assessment indicators should reflect the tunnel’s most adverse conditions throughout its entire operational period.
Therefore, when the ellipticity is used as the resilience assessment indicator, the resilience can be calculated by Equation (5).
where is the resilience value; is the ellipticity of the shield tunnel at time t; is the historical maximum horizontal ellipticity of the shield tunnel.
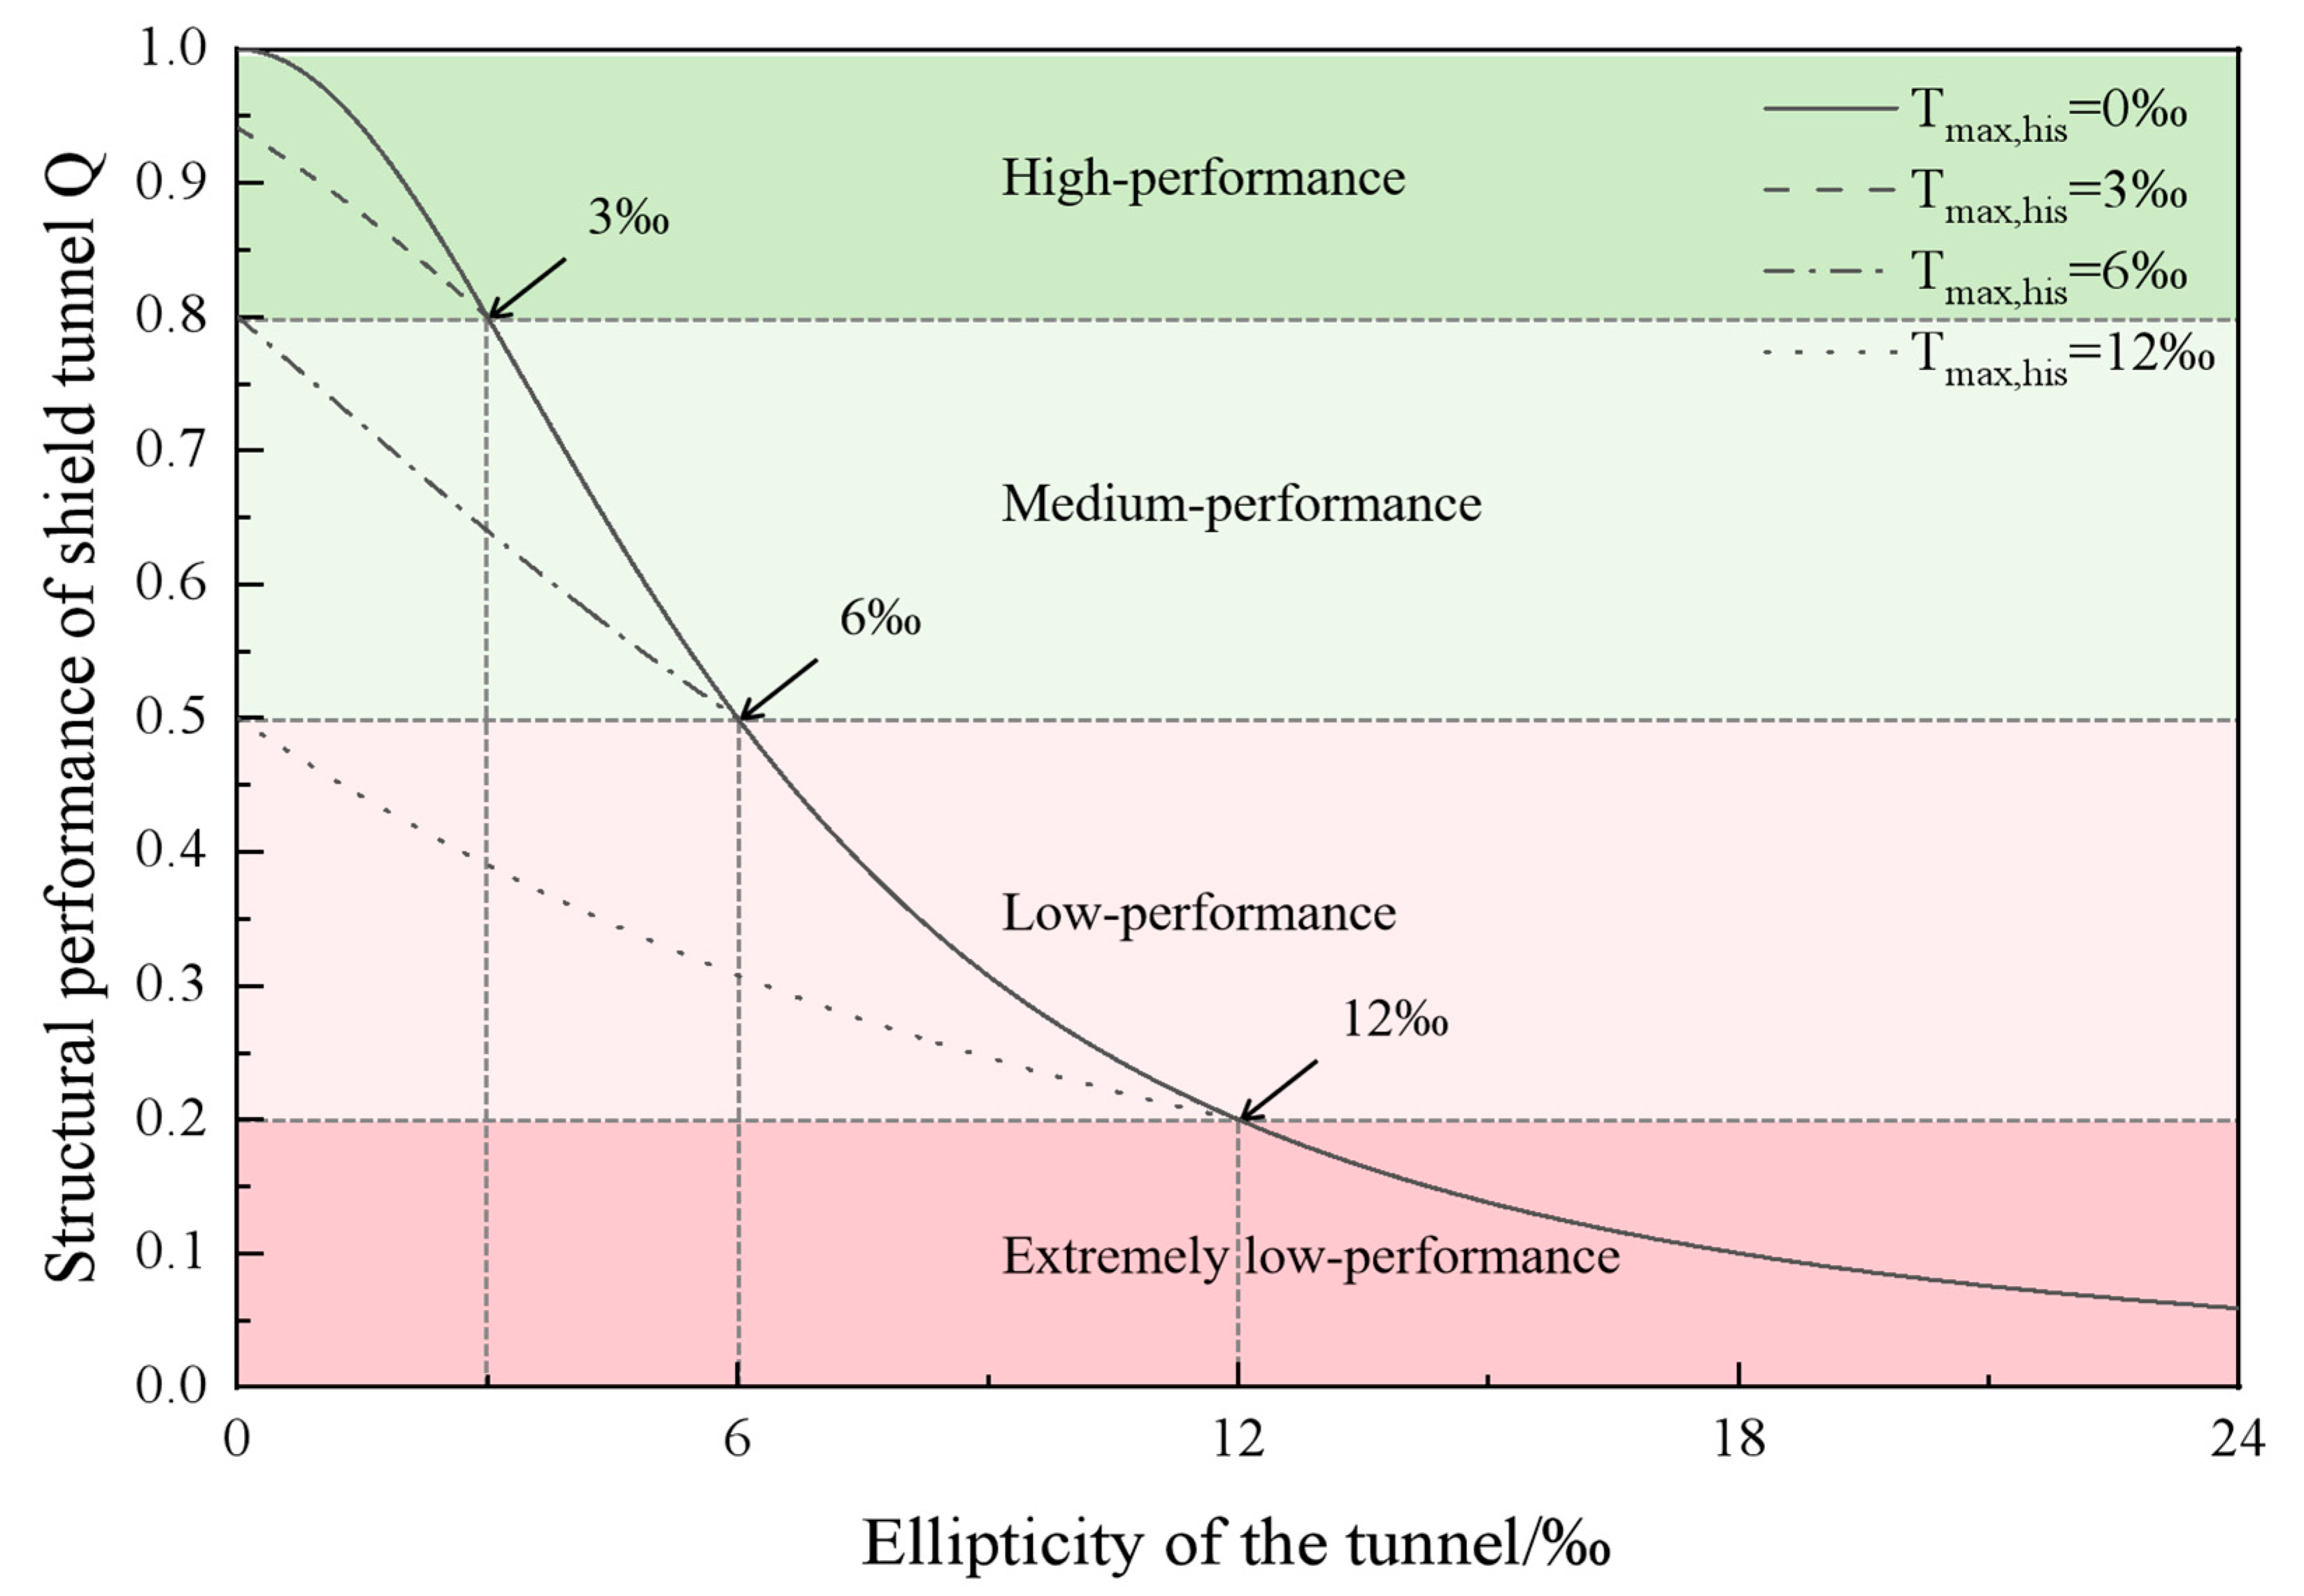
The variation of structural performance with ellipticity is shown in Figure 2. According to the Tunnel Construction and Acceptance Code for Shield Tunnelling [26], the specified limit for ellipticity is 6‰, which is considered conservative. In this study, it is assumed that the lining performance is divided into four levels: high, medium, low, and extreme. The boundary between high–medium performance is 3‰, and the boundary between medium–low performance is 6‰. Additionally, it has been observed based on existing full-scale segment experiments and numerical simulation results that tunnel enters a stage of rapid deformation development when the ellipticity of a shield tunnel exceeds 12‰, indicating an extreme performance.
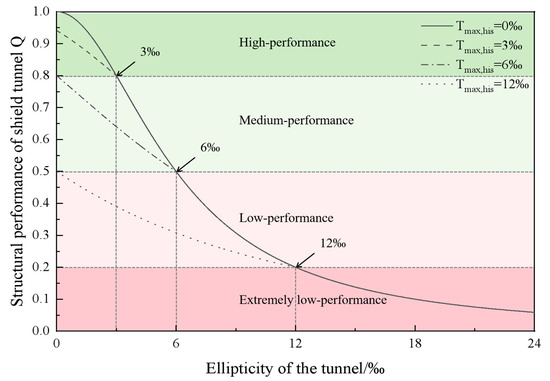
Figure 2.
Lining performance of shield tunnel structure (ellipticity of the tunnel).
The lining performance undergoes a recovery stage after seismic loads, but it cannot fully return to the initial state. As evident from the lining performance curves under different historical maximum convergence deformations in Figure 2, it can be seen that deformation callback measures can restore the performance to the previous level at most when the lining performance declines to a certain level. Resilience is when the shield tunneling ellipticity , indicating good structural performance. Resilience decreases with increases, implying a deterioration in structural performance. Resilience when , signifying the complete loss of structural performance. This method overcomes the issue of varying structural resilience under the same convergence deformation [27], and it possesses a certain degree of universality.
When the segment joint opening is used as the resilience assessment indicator, the resilience can be calculated by Equation (6).
where is the historical maximum ellipticity of the shield tunnel.
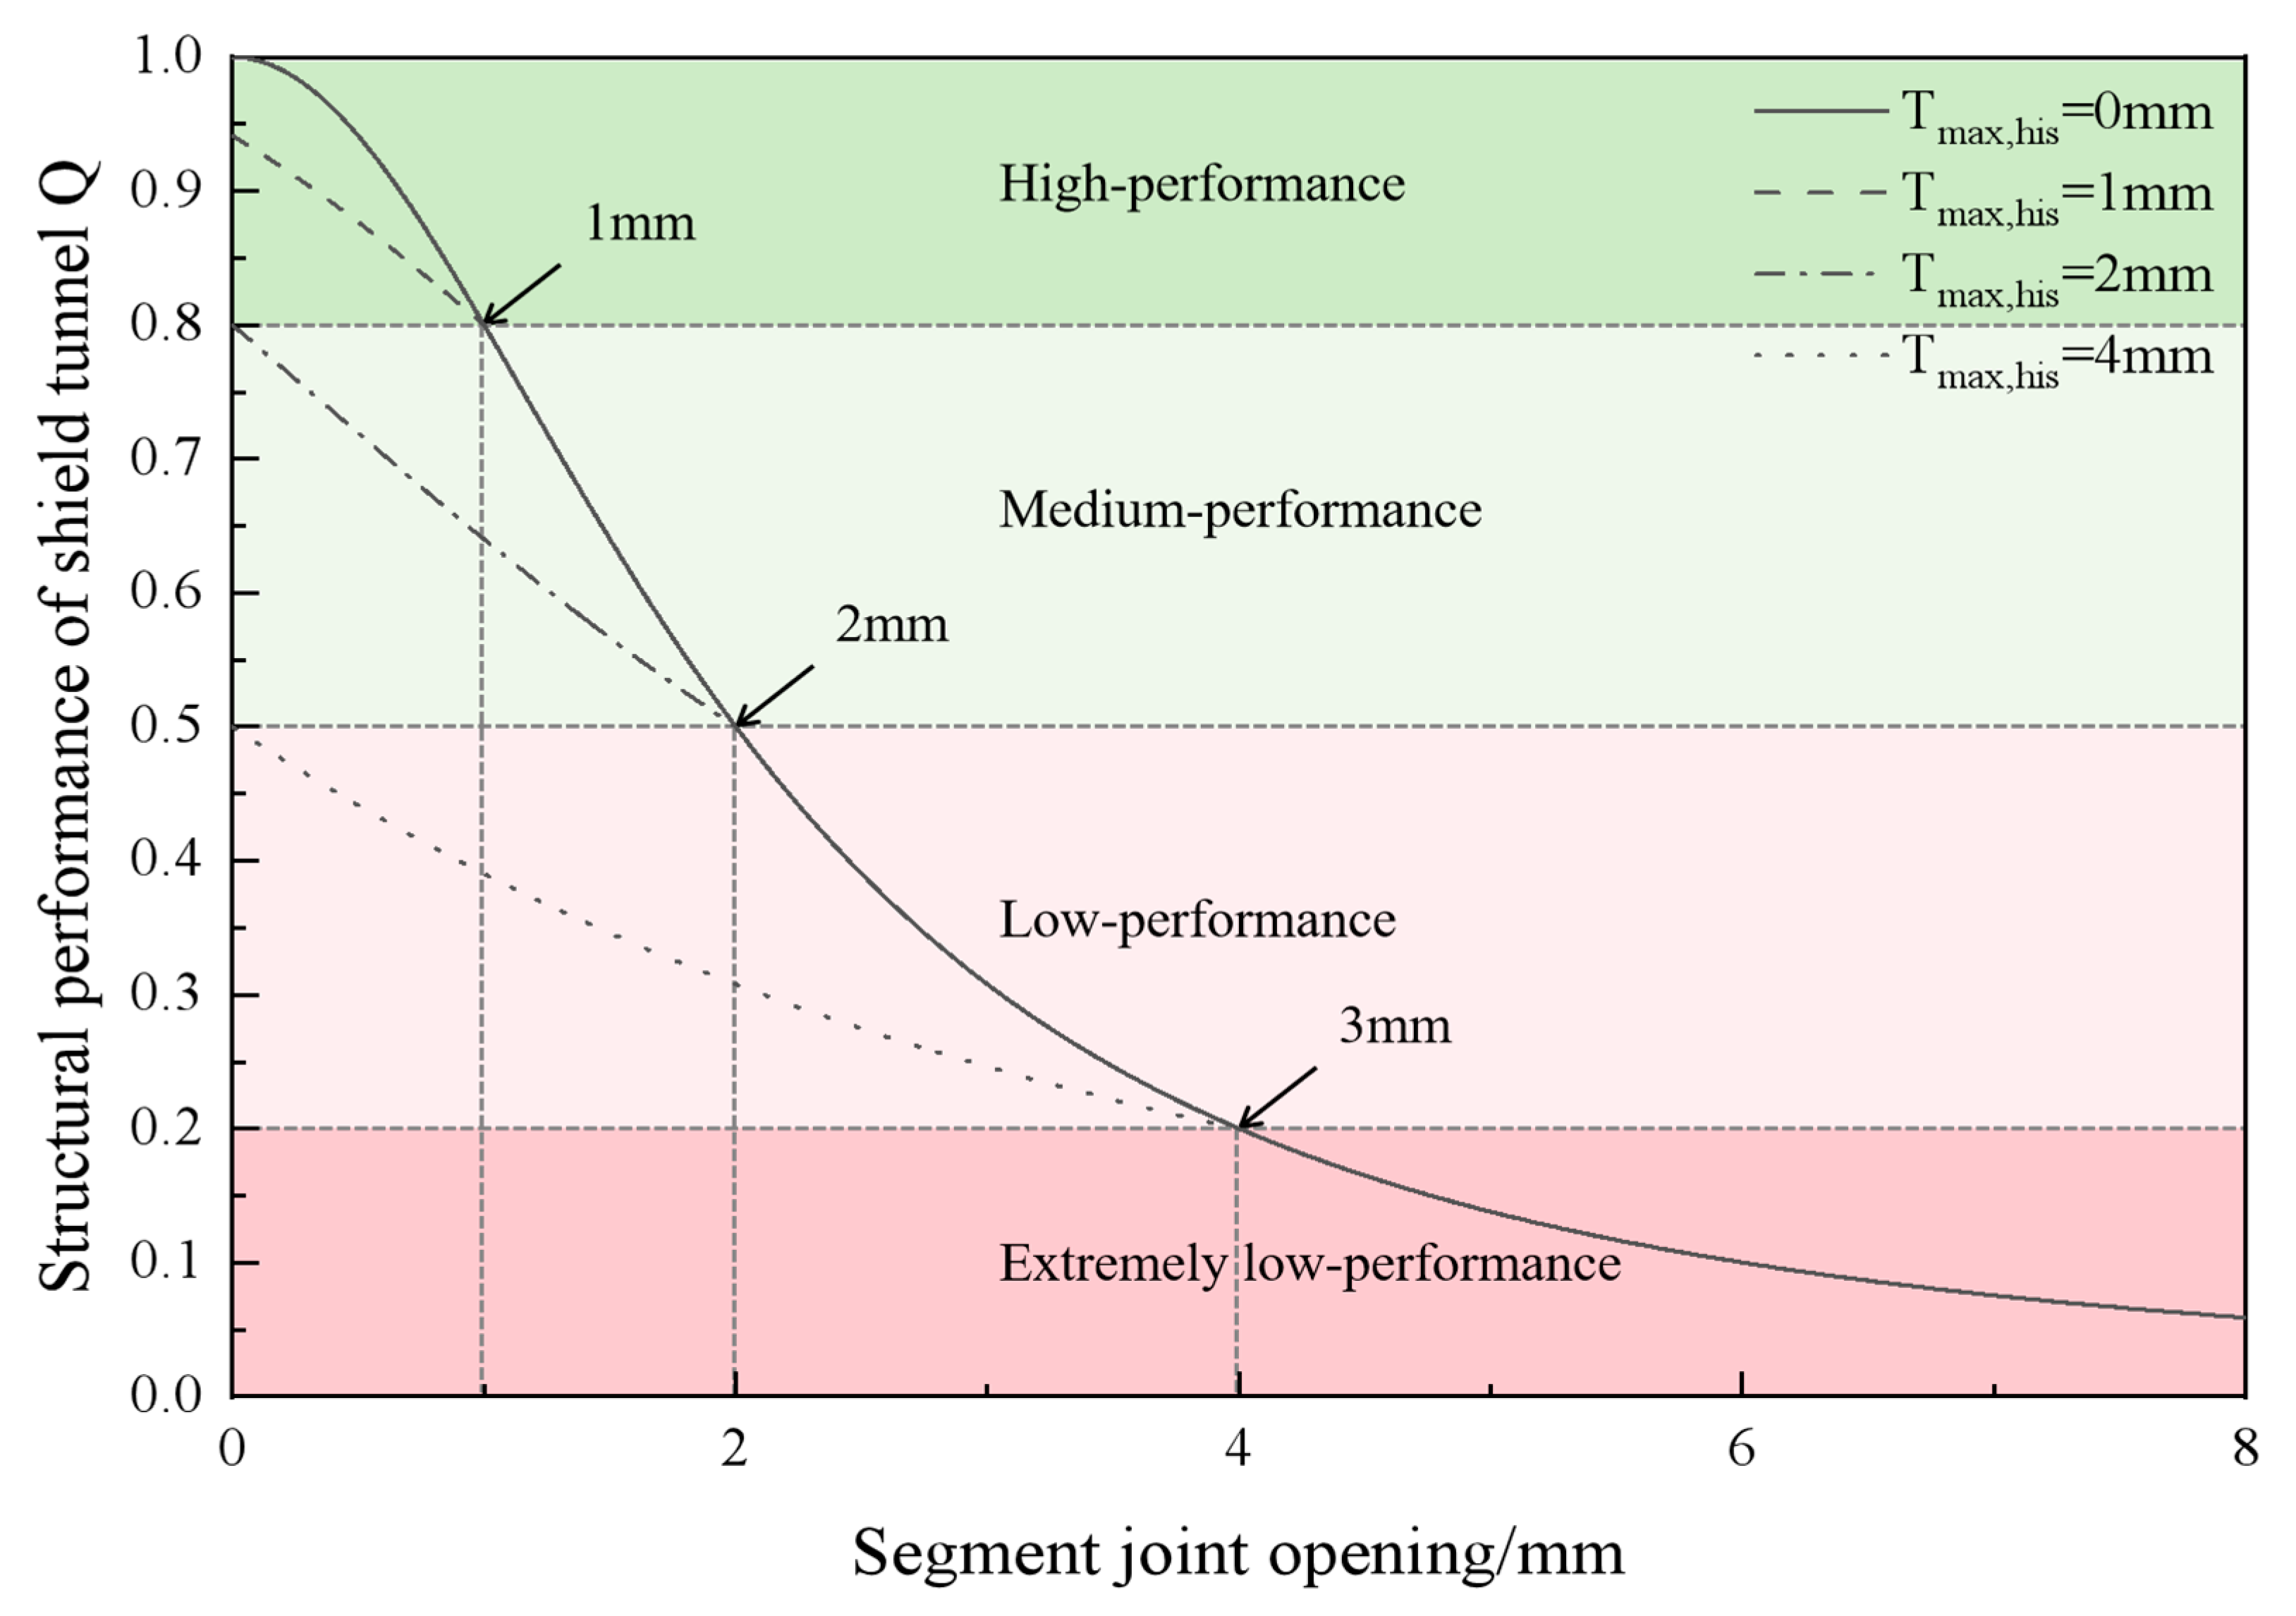
The Technical Specifications for Structural Safety Protection of Urban Rail Transit [28] has specified warning values and control values. The lining performance is categorized into four levels: high, medium, low, and extreme, based on existing full-scale segment experiments and numerical simulation results, as shown in Figure 3. The boundary between high and medium performance is 1 mm, and the boundary between medium and low performance is 2 mm. Tunnel enters a stage of rapid deformation development when the segment joint opening of the tunnel exceeds 4 mm.
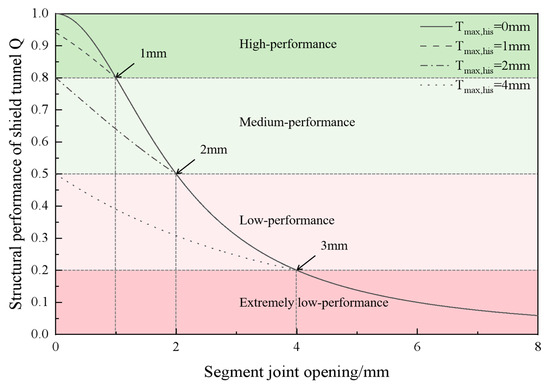
Figure 3.
Lining performance of shield tunnel structure (segment joint opening).
3. Numerical Simulation
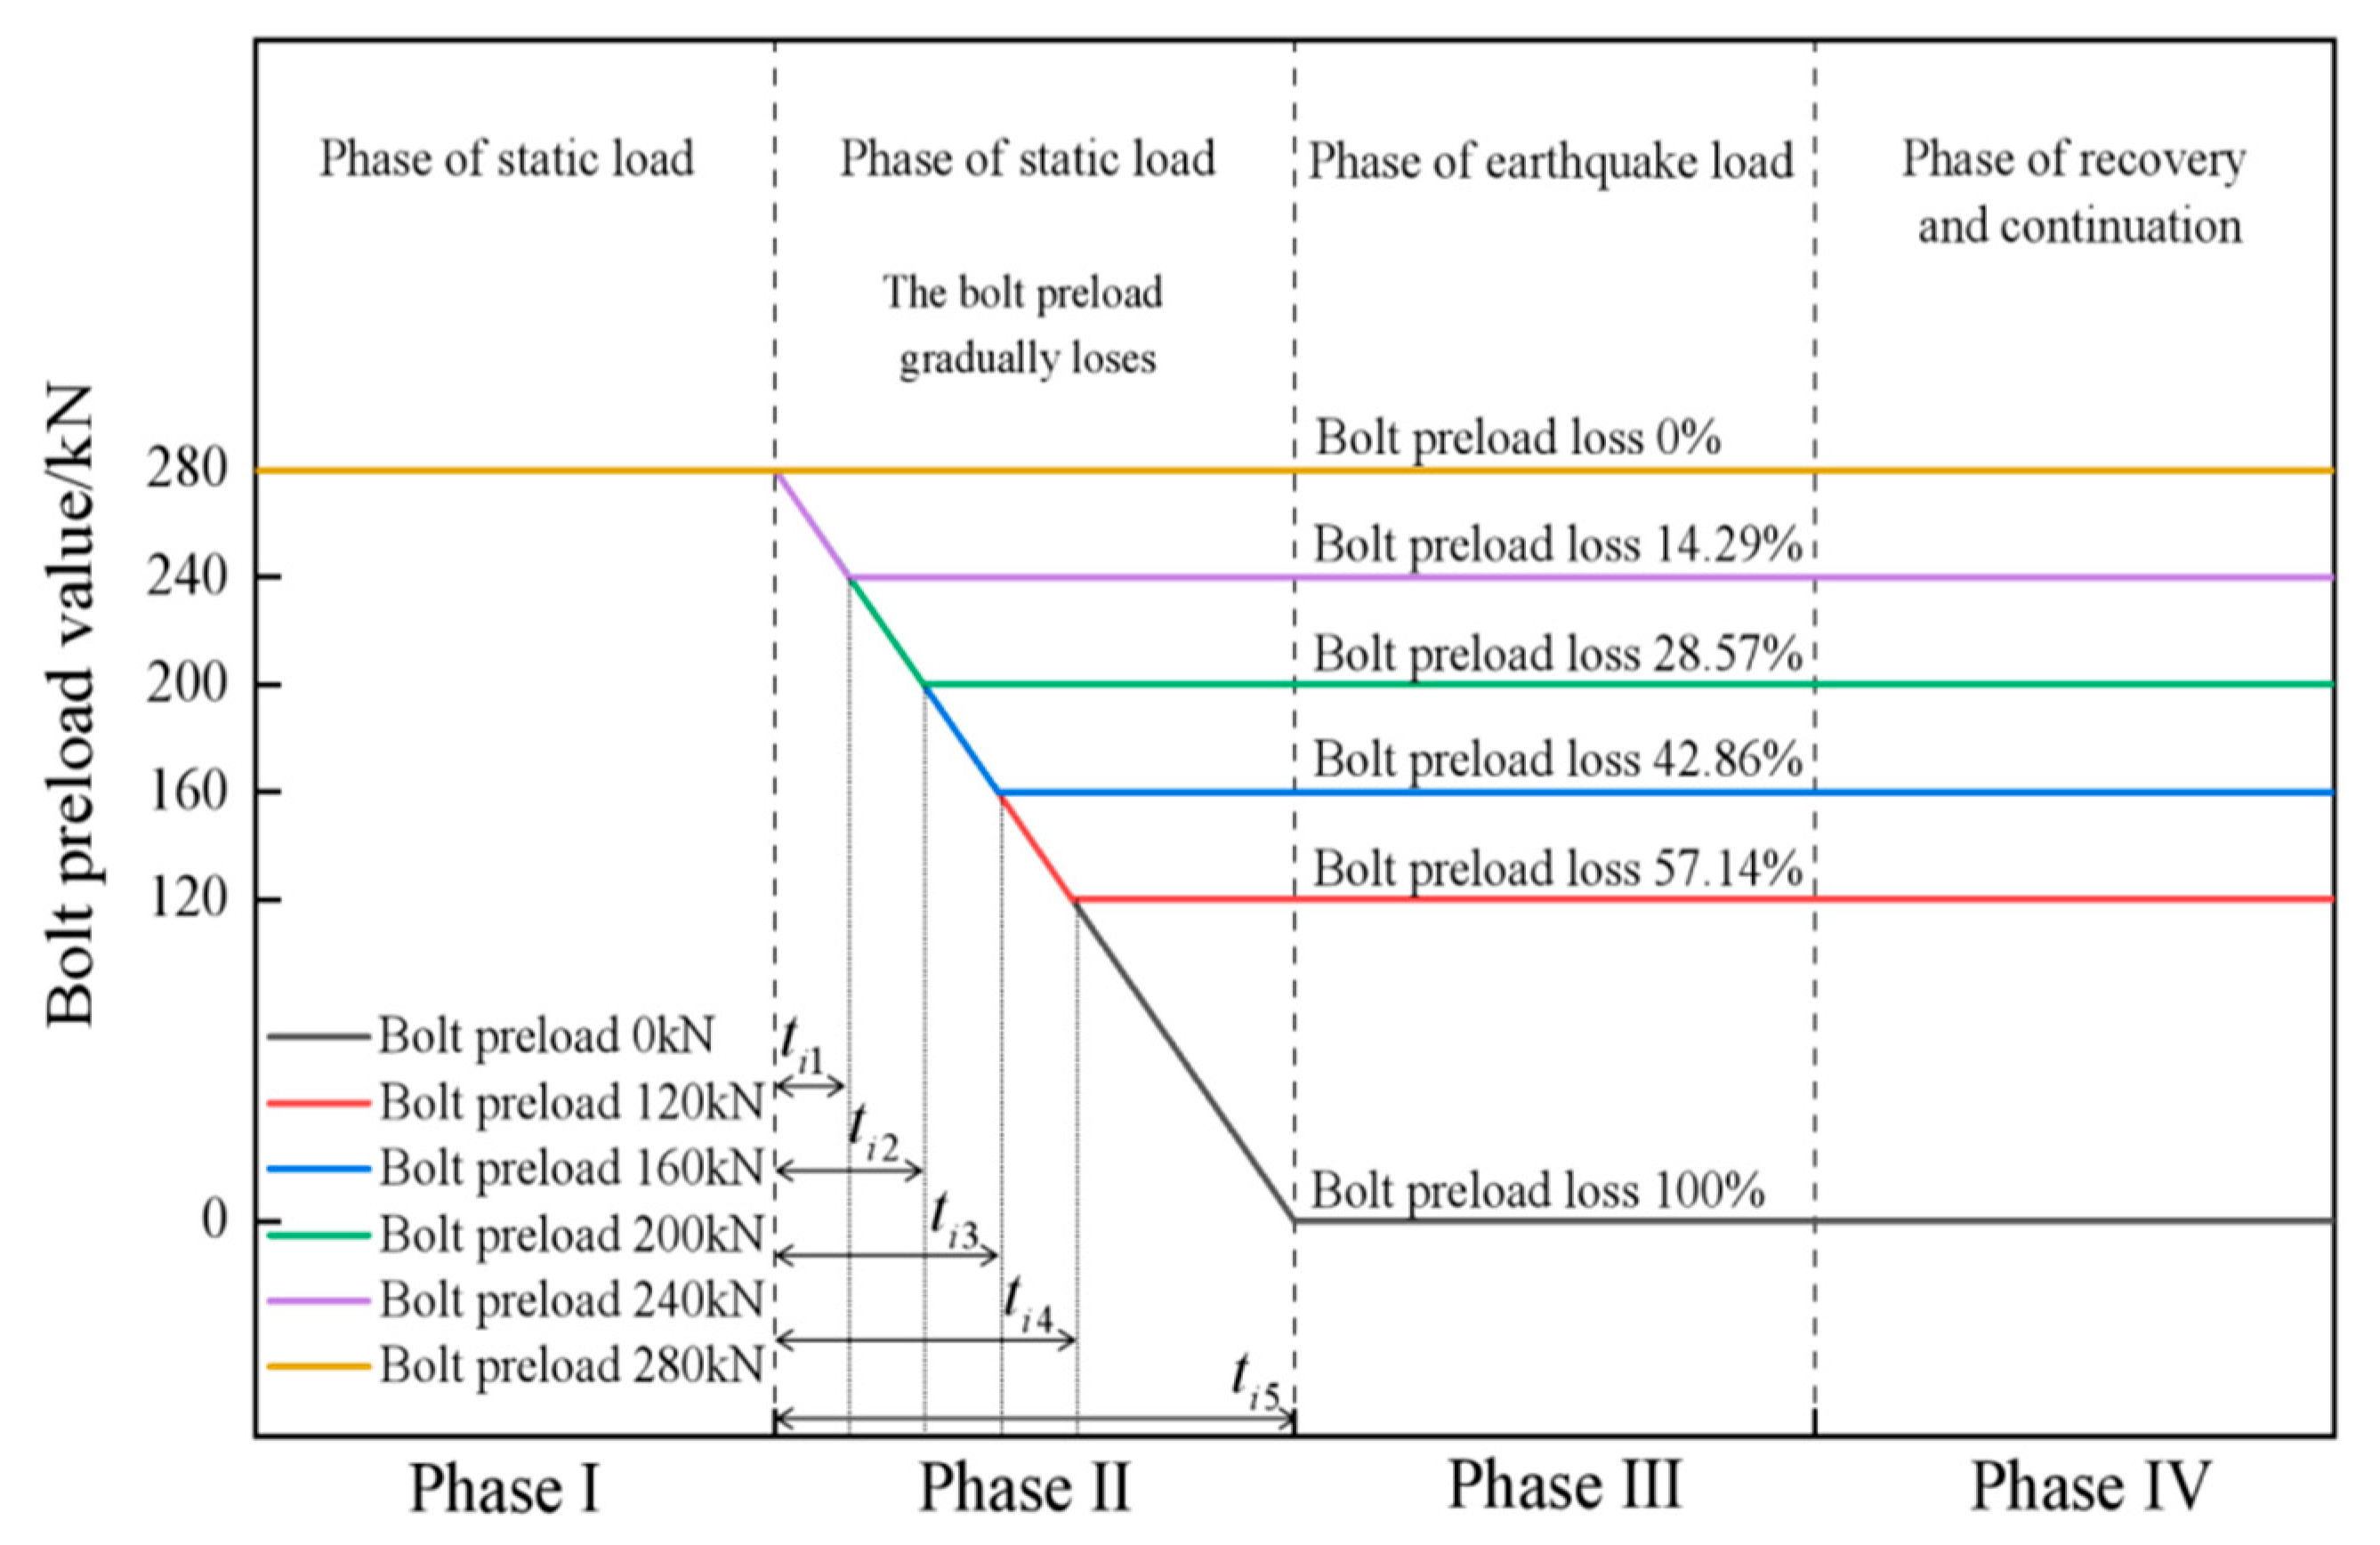
A finite element model considering the bolt preload loss under seismic loads was established. The numerical simulation is divided into four stages, as shown in Figure 4. The first stage is the normal operation phase, during which the performance of the shield tunnel has not degraded. Specifically, under static loads, the high-strength bolts do not experience preload loss, and the preload at this stage is 280 kN [29]. The second stage is the degradation phase of structural performance, in which the preload of the bolts experiences varying degrees of loss. The third stage is the seismic phase, in which seismic loads are applied to the model. The fourth stage is the recovery phase after seismic action. The different conditions under structural performance degradation intensity and seismic load are shown in Table 1.

Figure 4.
Load application stage.

Table 1.
Calculation conditions.
3.1. Establishment of the Finite Element Model
Numerical simulation is widely used in structural dynamic research due to its precise and efficient characteristics. This research uses numerical simulation to develop a three-dimensional finite element model of the soil–shield tunnel model.
3.1.1. Geometric Dimensions
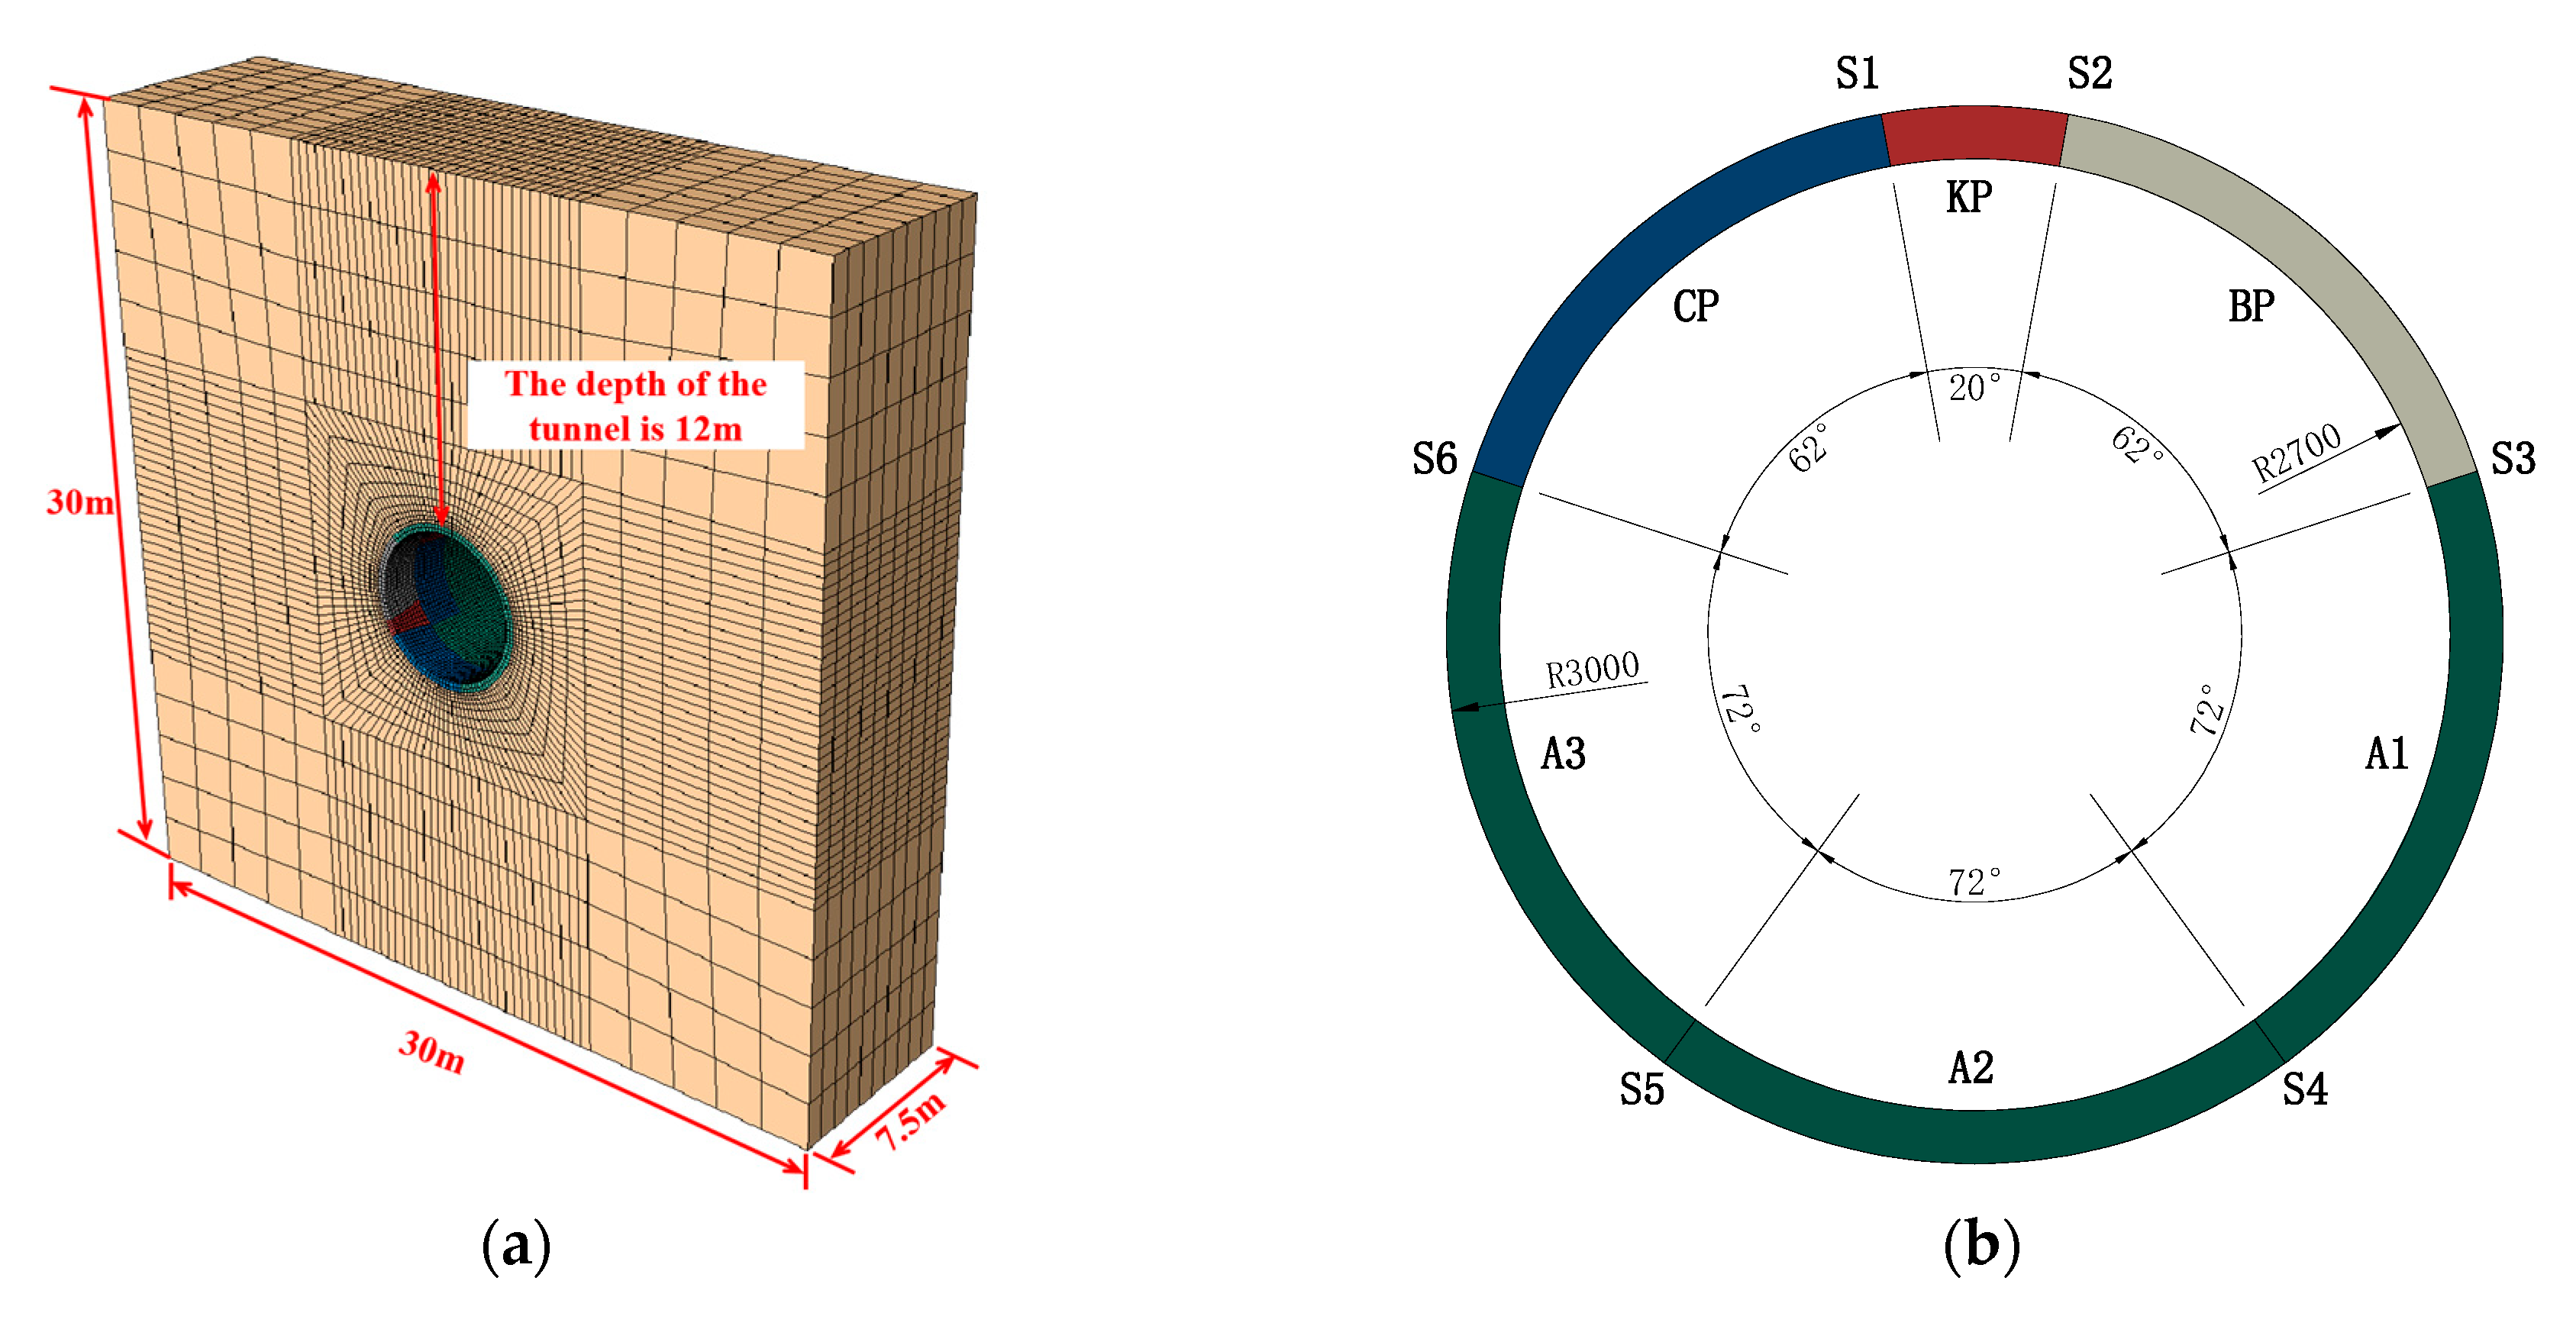
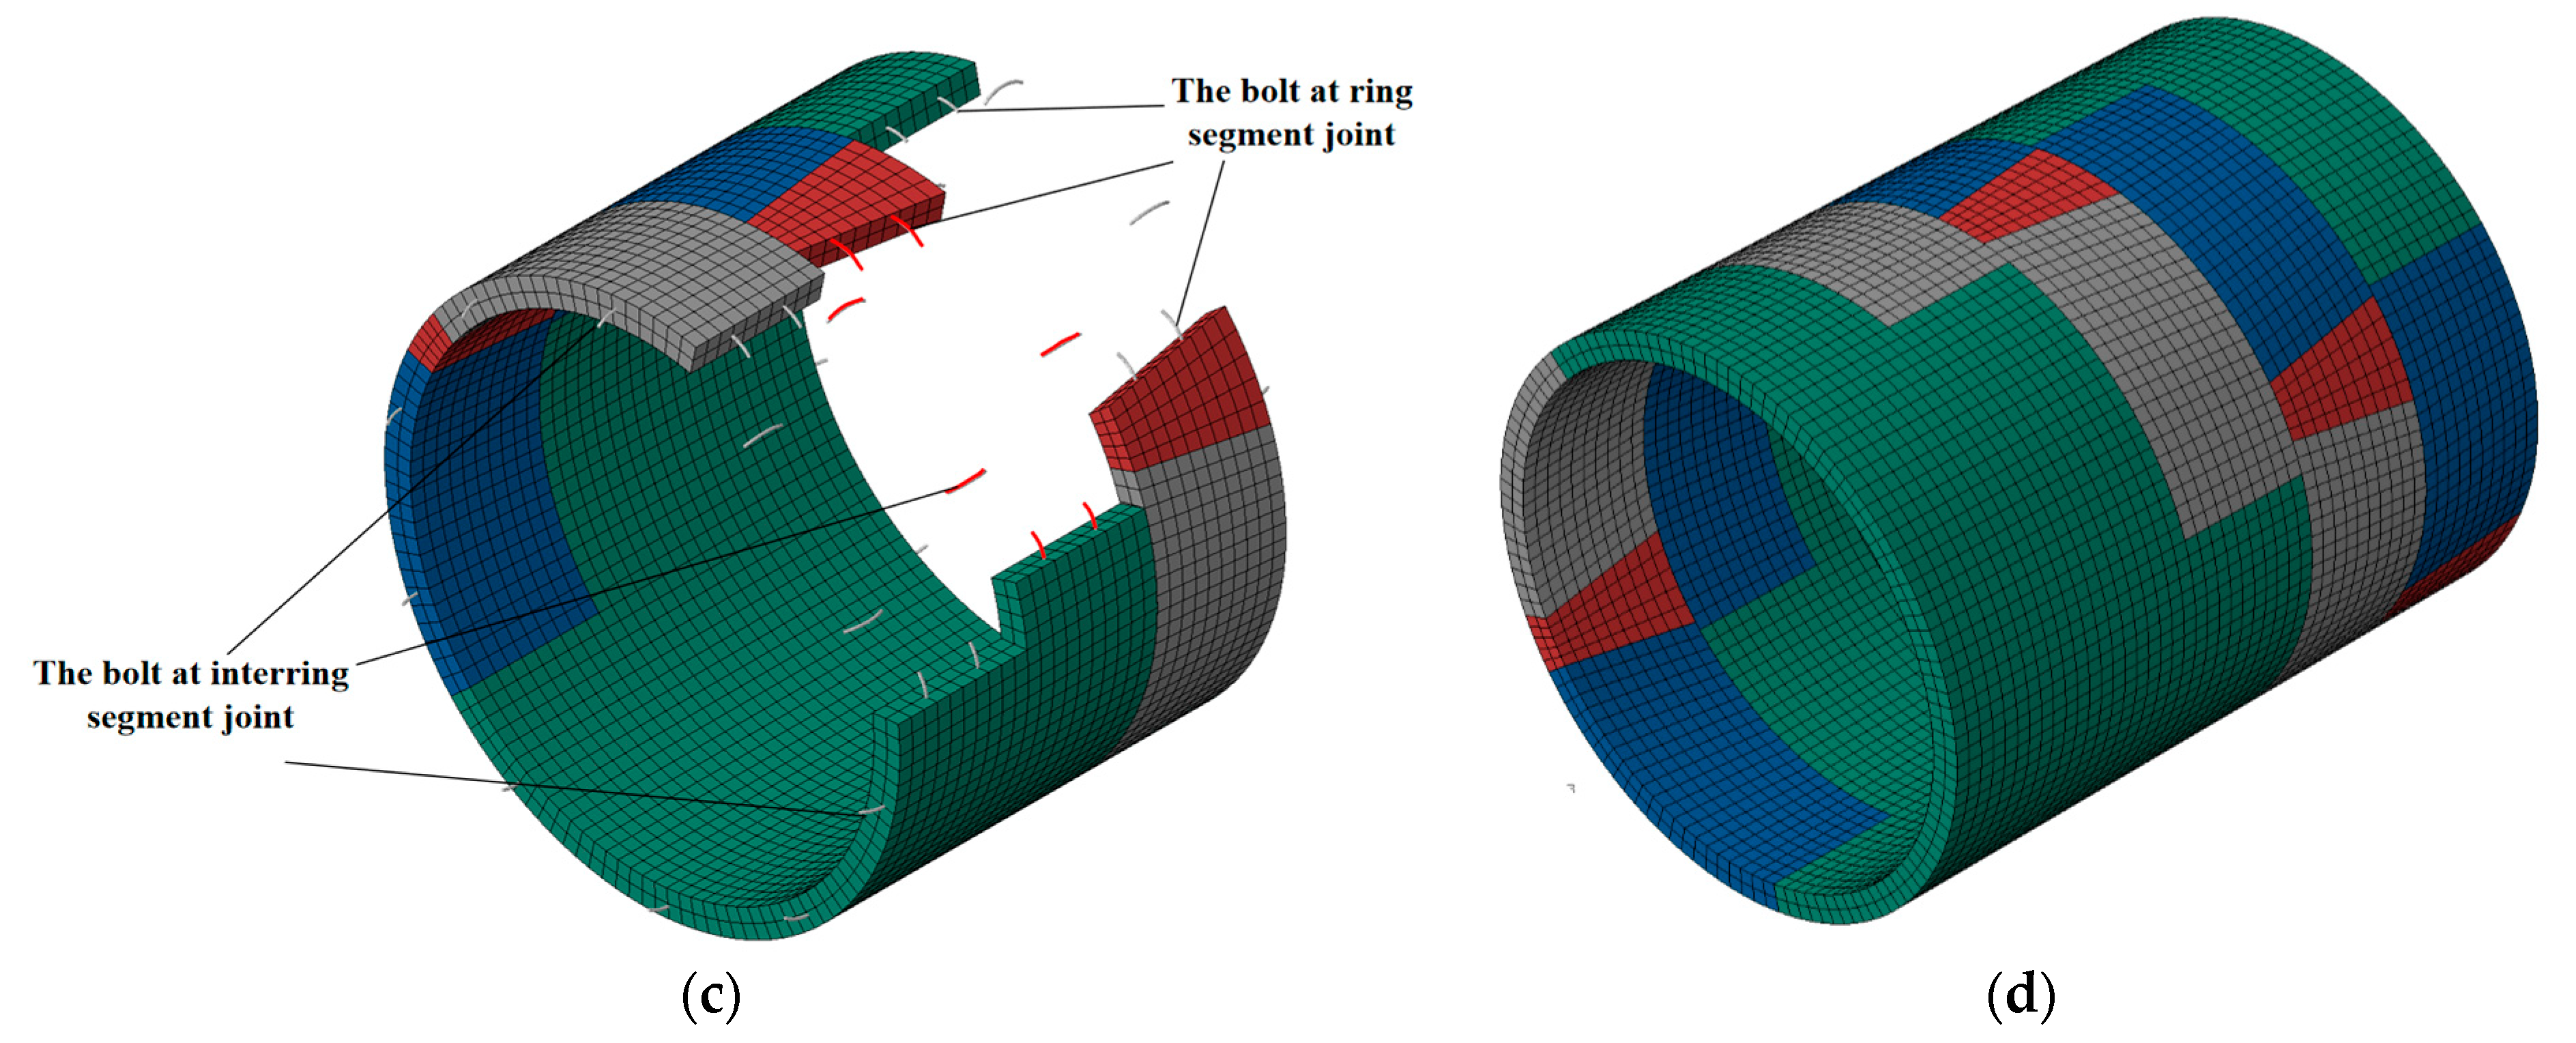
The three-dimensional soil–shield tunnel structure is shown in Figure 5a. The dimensions of the soil are 30 m (width) × 30 m (height) × 7.5 m (length). The tunnel is buried at a depth of 12 m. The distance from the outer diameter to the model boundary is greater than two times the tunnel diameter, which can effectively avoid the influence of boundary effects. The outer diameter of the shield tunnel is 6 m. The thickness of the segments is 0.3 m. The ring width is 1.5 m. A single-ring tunnel is composed of six segments, including three standard segments (A1~A3), two adjacent segments (CP, BP), and one key segment (KP). The central angles for the three types of segments are 72°, 62°, and 20°, respectively, as shown in Figure 5b. Within each ring segment, there are 12 Grade 8.8 M30 circumferential bolts. The adjacent rings are connected using 10 bolts, as shown in Figure 5c. The adjacent rings are assembled with a staggered joint angle of 72°, as shown in Figure 5d.


Figure 5.
Soil–shield tunnel structure model. (a) Stratum–structure model. (b) Layout of segment rings of tunnel. (c) Connection bolts at the joint of shield tunnel segment. (d) Refined model of lining ring.
3.1.2. Material Constitutive
To study the influence of preload loss at joints on the seismic response characteristics of tunnel structures and to ensure calculation accuracy while simplifying the calculations, the model undergoes the following treatments: (1) high-strength bolts are simplified using beam elements, and the material constitutive model adopts a bilinear plastic strengthening model. The elastic modulus in the plastic strengthening section is taken as 1/100 of the elastic modulus in the elastic section. The nominal diameter of the bolt is 30 mm, with a tensile strength of 800 MPa and a yield strength of 640 MPa. (2) The concrete material constitutive model uses the Concrete Damaged Plasticity model with a dilation angle of 38° to reflect the nonlinear variation of concrete segments. The uniaxial stress–strain curve for concrete follows the specifications in the Code for Design of Concrete Structures [30]. The concrete damage parameters are provided in Table 2. (3) The uniform soil layer adopts the Mohr–Coulomb material constitutive model with a dilation angle of 0.01° and a friction angle of 40°. Both concrete segments and soil are modeled using three-dimensional hexahedral eight-node solid elements (C3D8R). The geological and material parameters are presented in Table 3.
Table 2.
Uniaxial stress–strain relationship and concrete damage parameters.
Table 3.
Material parameters.
3.1.3. Interaction
There are three types of contact relationships in the numerical simulation model: contact between adjacent segments, contact between the ground and segments, and contact between the segments and bolts. For the contact between adjacent segments and between the ground and segments, surface-to-surface contact is used. In these contact relationships, the tangential contact employs Coulomb friction with a friction coefficient of 0.35, and normal contact is modeled as hard contact, allowing for separation after contact. The contact between the segments and bolts is modeled as embedded contact, meaning that beam elements representing bolts are embedded within the solid concrete segments.
3.2. Structure Load
To study the effect of seismic loads on the toughness of shield tunnels, three types of peak acceleration Kobe waves were selected for calculation. In reality, seismic waves often propagate from the source through soil to an infinite distance. In order to reduce unnecessary computational complexity, the viscoelastic boundary is used to avoid the absorption and reflection of the seismic wave at the model boundary.
3.2.1. The Selection of Seismic Wave
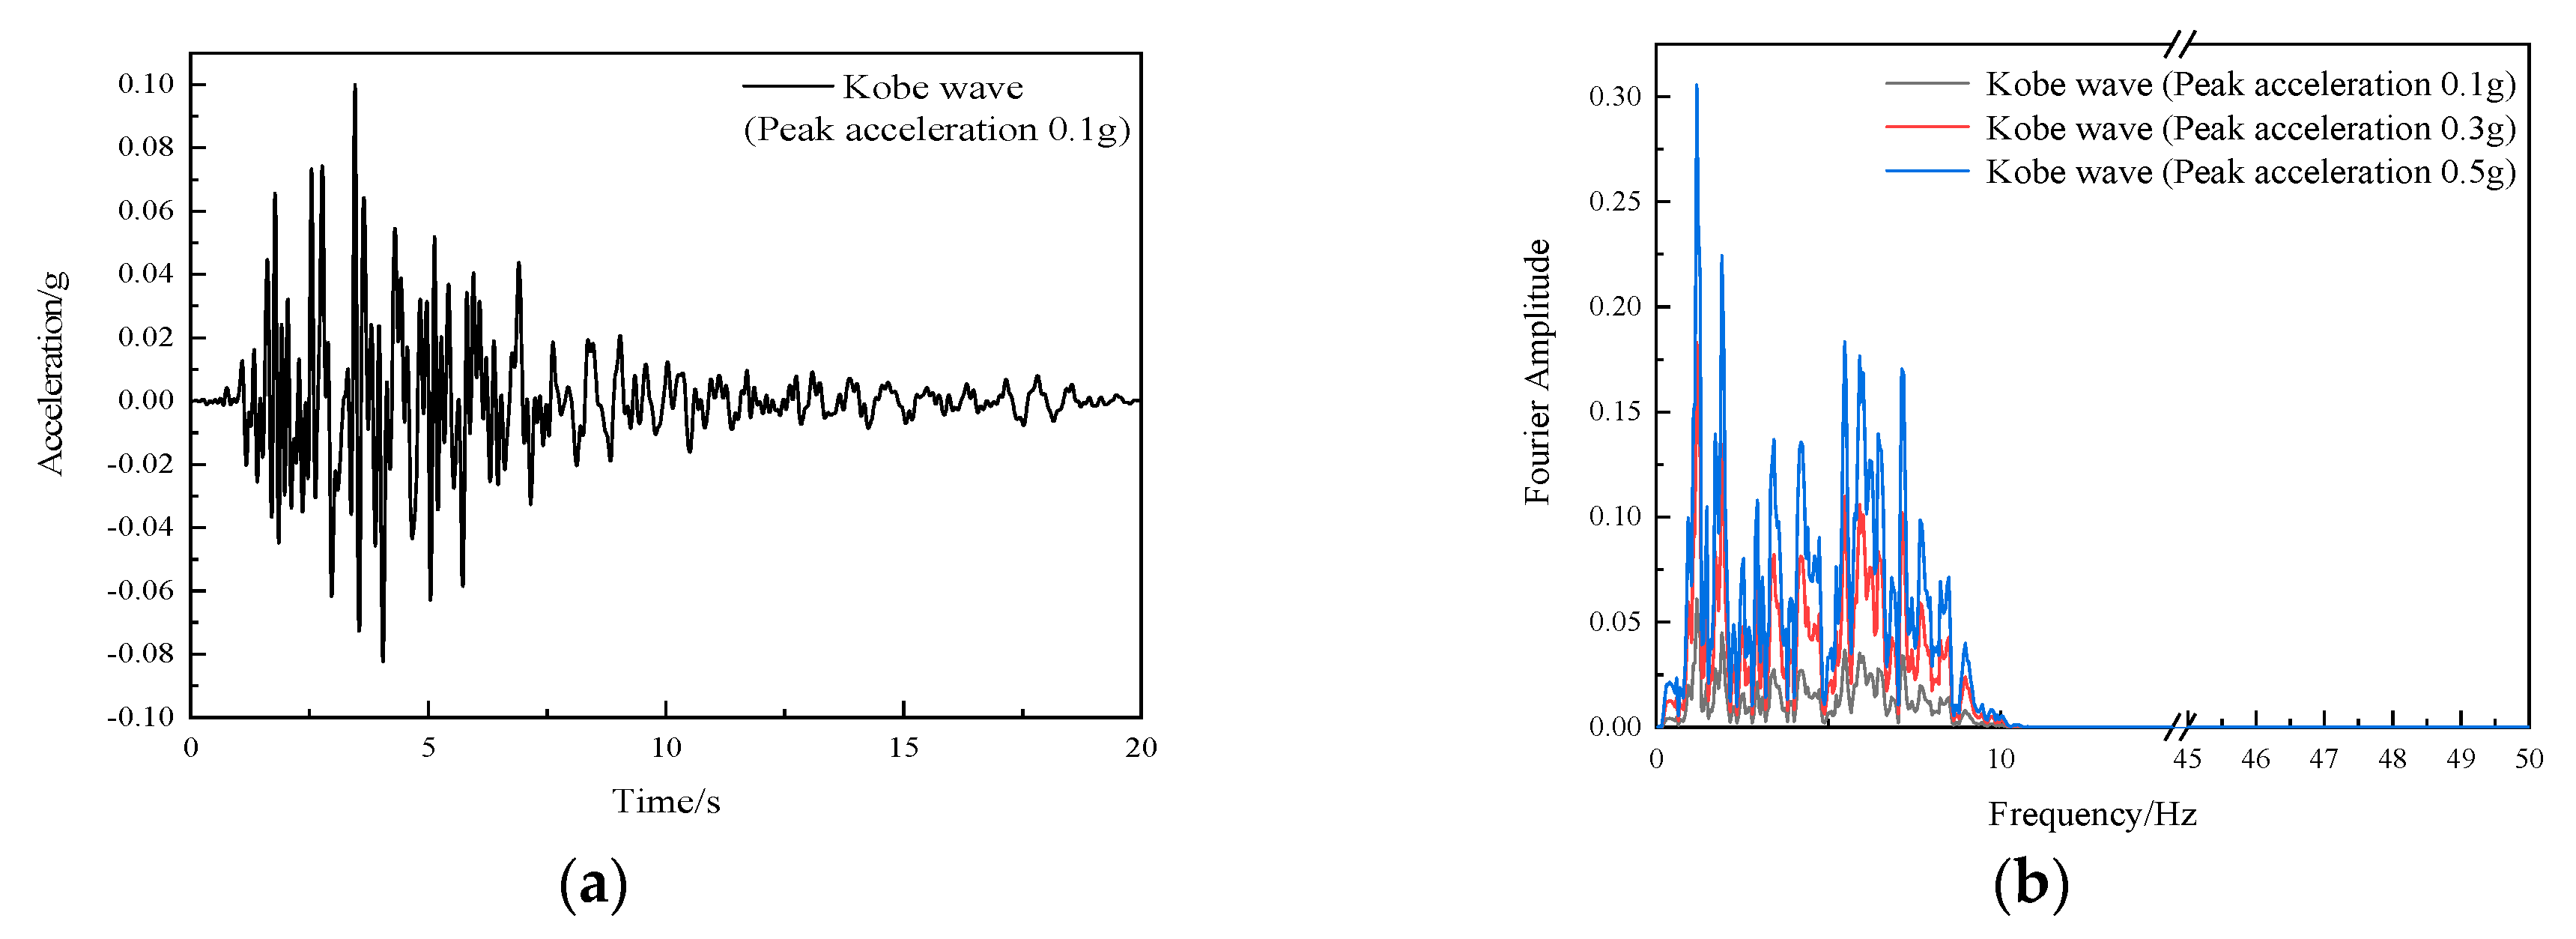
In accordance with the current national standard “Seismic Design Code for Urban Rail Transit Structures”, the relationship between seismic fortification intensity and design basic seismic acceleration values is considered. According to the existing research, when discussing the response of the structure under the seismic load, the type, frequency, and action time of the seismic wave will have an impact on the seismic response of the shield tunnel structure. Existing research shows that the response of seismic wave type is shear wave, and the seismic wave frequency is low frequency [31]. From the existing seismic wave, the Kobe seismic wave, as a kind of low-frequency seismic wave with higher content, will make the shield tunnel appear more obviously deformed [32]. Kobe waves with peak ground accelerations of 0.1 g, 0.3 g, and 0.5 g are selected for the study. The acceleration time history and Fourier spectrum curve for the seismic wave with a peak acceleration of 0.1 g are shown in Figure 6. The acceleration time histories for 0.3 g and 0.5 g can be obtained through proportional scaling. The seismic wave is assumed to have a bottom vertical incidence angle and a duration of 20 s, and the peak ground acceleration of the selected Kobe wave occurs at 3.46 s into the seismic wave.
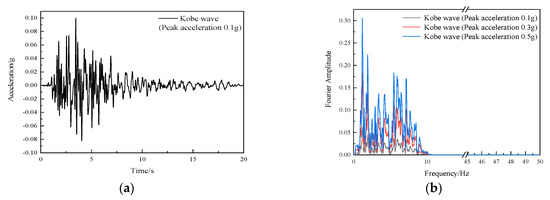
Figure 6.
The Acceleration Time–History and Fourier spectrum of Kobe earthquake motion. (a) Acceleration time course curve (0.1 g Kobe); (b) The seismic wave Fourier spectrum.
3.2.2. Boundary Condition and Seismic Input
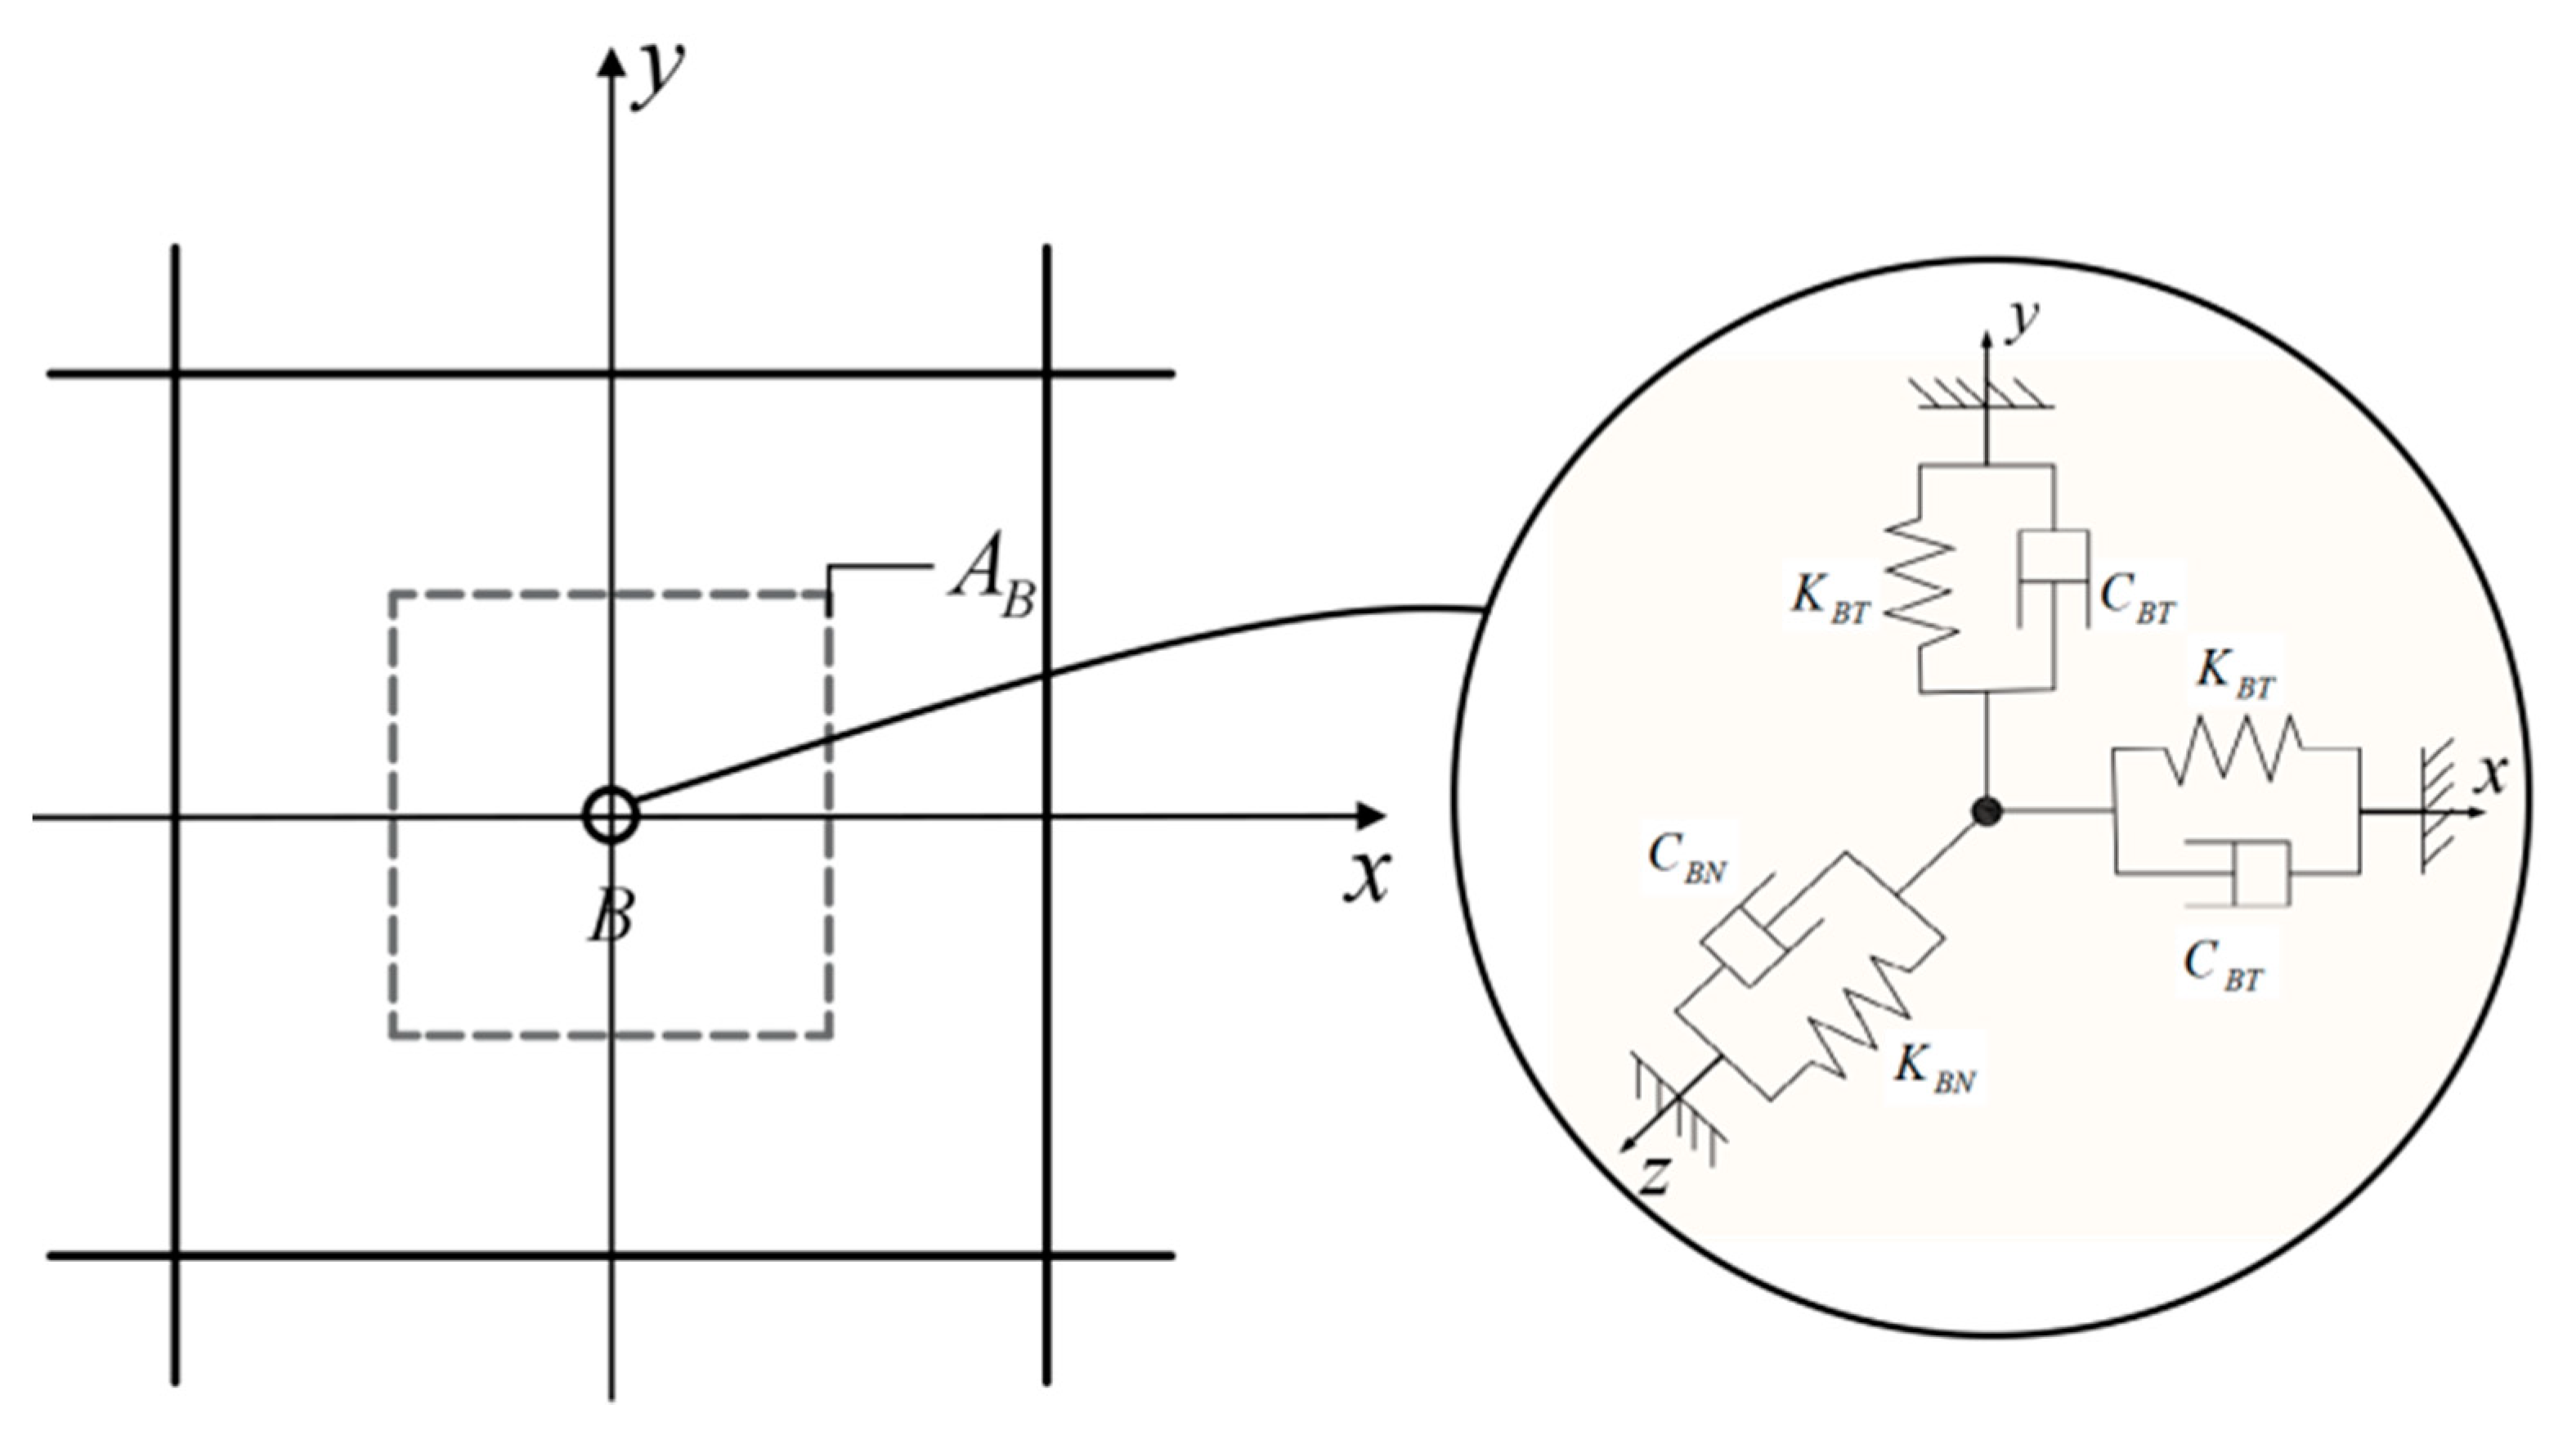
When conducting dynamic analysis considering the interaction between the structure and the foundation, it is necessary for seismic energy to dissipate to the far-field foundation. This requires that the outgoing scattering waves at the calculated finite-range foundation boundary have no reflection. Artificial viscoelastic boundaries can absorb the energy radiating outward from the calculation area. They not only effectively simulate the damping effect of radiation in semi-infinite space but also model the elastic recovery performance of semi-infinite foundations well [33]. Simulating an infinite boundary is achieved by applying three-way spring dampers to the finite element grid nodes. The schematic diagram of the viscoelastic boundary is shown in Figure 7 [34,35,36].
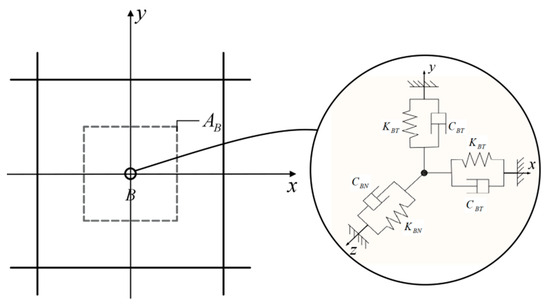
Figure 7.
Three-dimensional viscoelastic boundary.
Spring and damping mechanical parameters calculation formulas are as follows:
where and are the stiffness coefficients of the tangential and normal springs, respectively; and are the damping coefficients of the tangential and normal dampers, respectively; and are correction coefficients for normal and tangential spring stiffness, which are 1.33 and 0.67, respectively; is the shear modulus; is the density; is the distance from the wave source to the artificial boundary node; and are shear and compressional wave velocities, respectively.
Due to the inability of spring dampers to constrain boundary displacements, it is necessary to implement seismic loads through concentrated nodal loads, as shown in the following equation. The affected area of nodes is determined by applying unit loads to the model for statistical purposes.
where is the stiffness coefficients of springs; is the damping coefficients; is the free-field stress tensor; is the free-field displacement vector; is the free-field velocity vector; is the cosine vector of the normal direction outside the boundary; is the influenced area of the boundary node [37].
3.2.3. Preload Loss
The cooling method was used to apply preload to the M30 high-strength bolts [2]. Here, the temperature expansion coefficient of steel is taken as 1.25 × 10⁻⁵ m/°C. Based on this, a linear relationship between the temperature load and the actual pre-tightening force is calculated. During the elastic yield stage of the preload bolt material, for every 1 °C decrease in temperature, the pre-tightening force applied to the M30 high-strength bolt is 1.856 kN. According to the specifications, the preload value for the high-strength bolt is 280 kN, corresponding to a temperature stress value of 150.86 °C. Therefore, the preload values corresponding to each temperature, considering seismic response as the research object, are shown in Table 4.
Table 4.
The preload value corresponds to the temperature stress applied.
4. Tunnel Structure Response Characteristics
4.1. Lining Horizontal Convergence
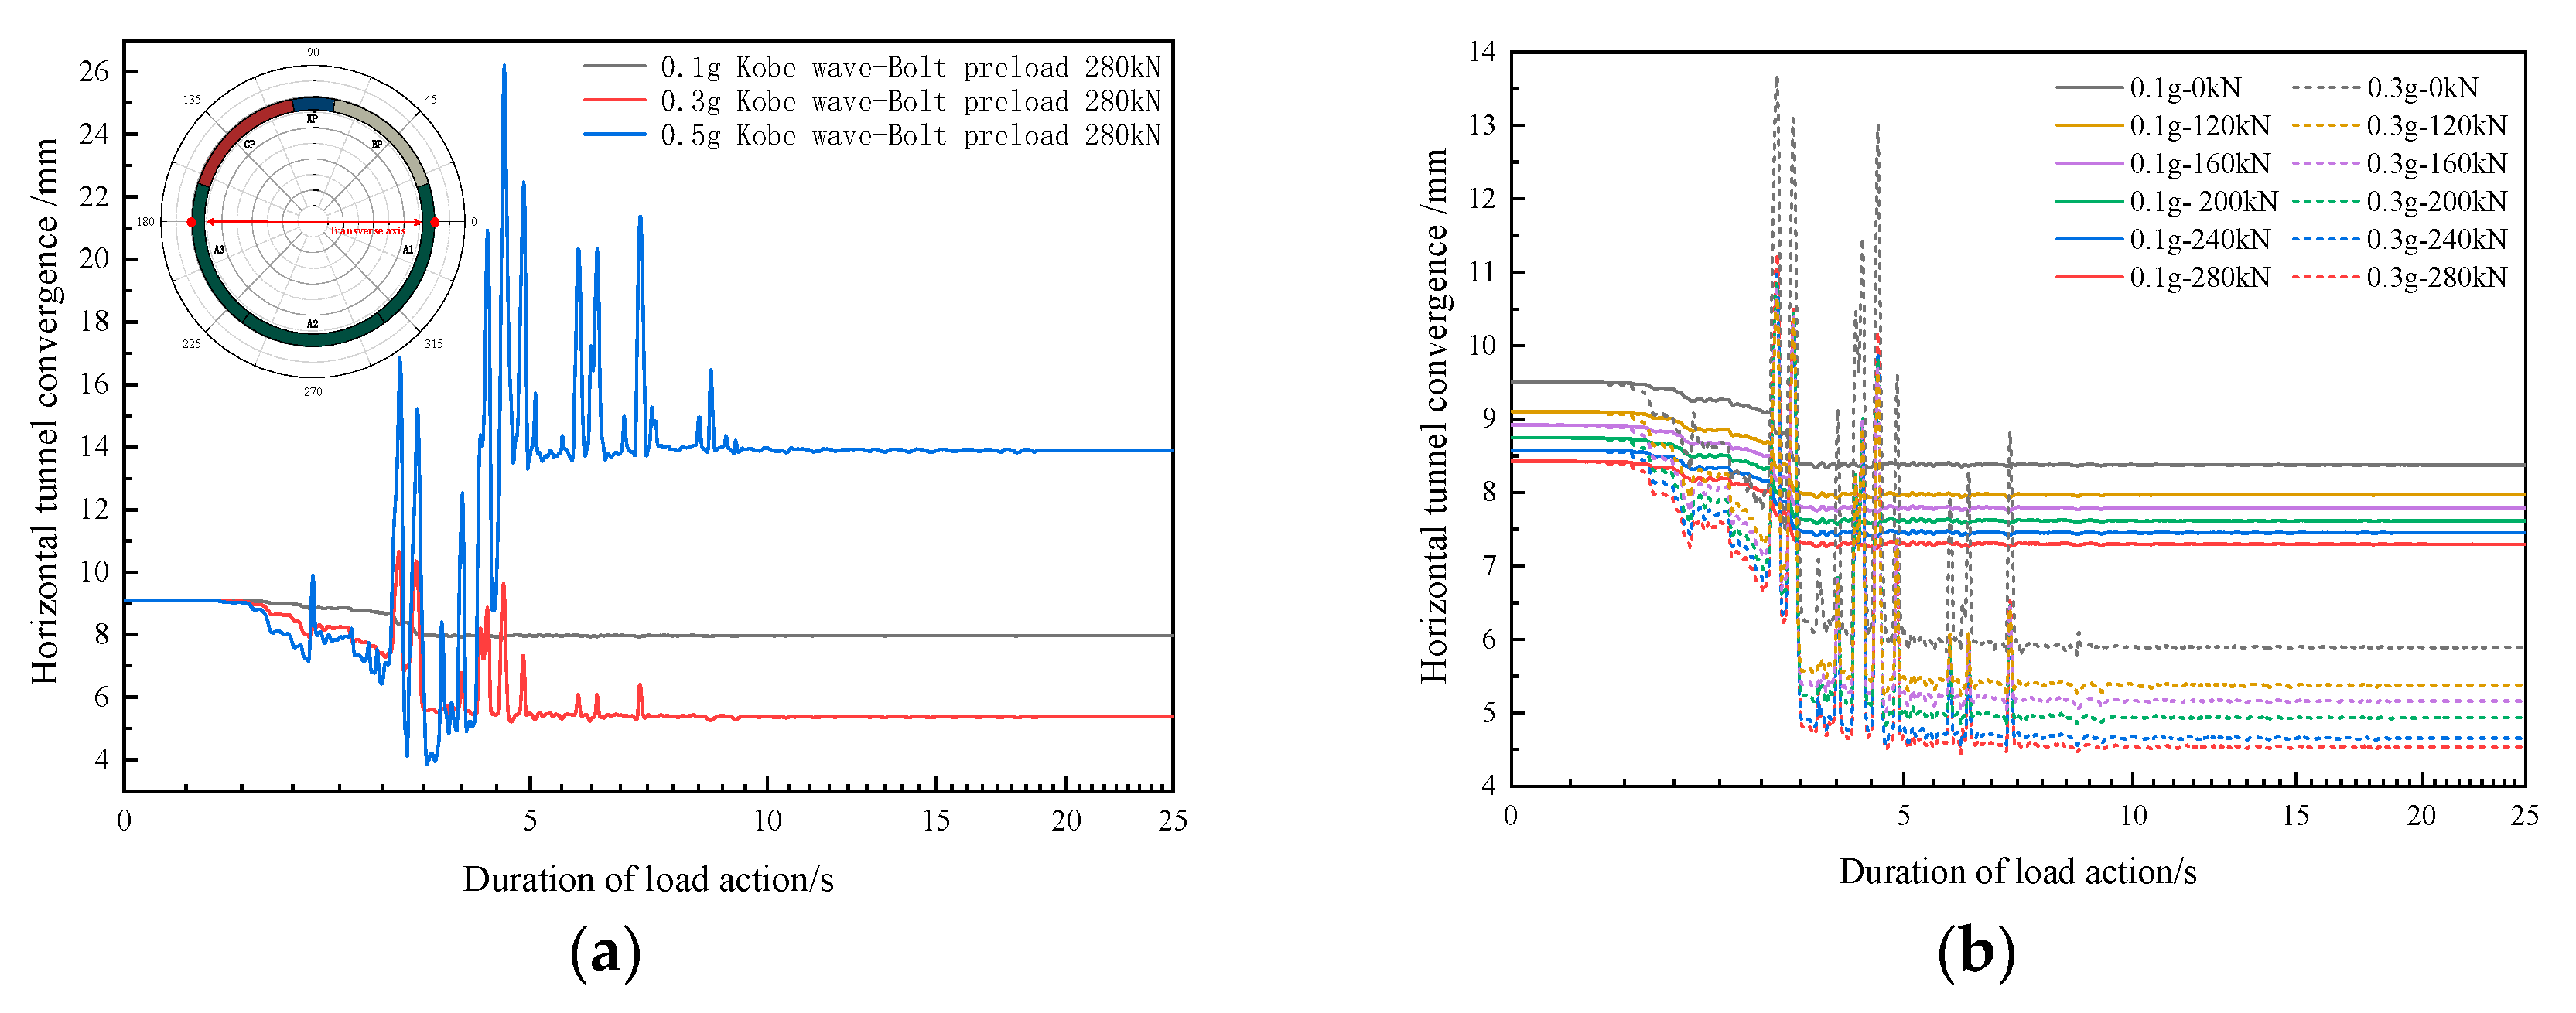
Take the no loss of preload (280 kN) as an example to analyze the response of seismic load. Figure 8a shows the convergence deformation of the middle tunnel ring under the seismic load. Even though the initial stress balance has been carried out on the structure in the course of the pre-treatment process, there are still parts of the structure and soil gravity acting on the structure. Hence, there is inevitably some radial convergent deformation before seismic waves. As shown in Figure 8a, the initial radial deformation already has a value of about 9.103 mm. The structure shows different characteristics under different peak acceleration seismic wave loads. When the peak seismic acceleration is 0.1 g, the lining horizontal convergence and the overall fluctuation in the load period are small. The variation of lining horizontal convergence before and after the seismic load is −1.14 mm. During the 0.3 g earthquake load, the variation value of the convergence deformation is about −3.73 mm, which increases by 227.2% compared to the variation rate at 0.1 g. When the 0.5 g peak acceleration seismic wave is applied, the peak convergence deformation is 26.22 mm. The variation of lining horizontal convergence before and after the seismic load is 4.80 mm. The variation of lining horizontal convergence of the tunnel gradually intensifies with the increase in the peak value of seismic acceleration.
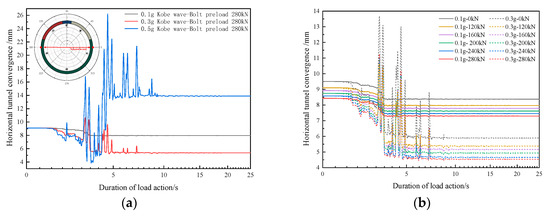
Figure 8.
Lining horizontal convergence of shield tunnel under load action. (a) Different peak acceleration; (b) Different degrees of loss of preload.
Figure 8b shows the variation of lining horizontal convergence of the tunnel with different degrees of loss of preload under 0.1 g and 0.3 g earthquake load. When the seismic load is the same, the convergence deformation of the lining structure shown by each degree of preload loss condition is almost the same as the trend of load change. It was found from Figure 8b that the initial convergence deformation of the structure shows an increasing trend with the degree of preload loss increases. Furthermore, the loss of preload has an impact on the maximum convergence deformation of the structure during the load process and the convergence deformation difference before and after the load action. With the degree of preload loss increasing at 0.1 g, the variation of lining horizontal convergence is −1.1281 mm, −1.1294 mm, −1.1330 mm, −1.1337 mm, −1.1354 mm, and −1.1362 mm, respectively. With the degree of preload loss increasing at 0.3 g, the variation of lining horizontal convergence is −3.6180 mm, −3.7280 mm, −3.7616 mm, −3.8154 mm, −3.8932 mm, and −3.9283 mm, respectively. The variation of lining horizontal convergence gradually increases with the increase in preload loss. And this effect will become more apparent with the increase in the peak value of seismic acceleration.
4.2. Radial Deformation of Tunnel
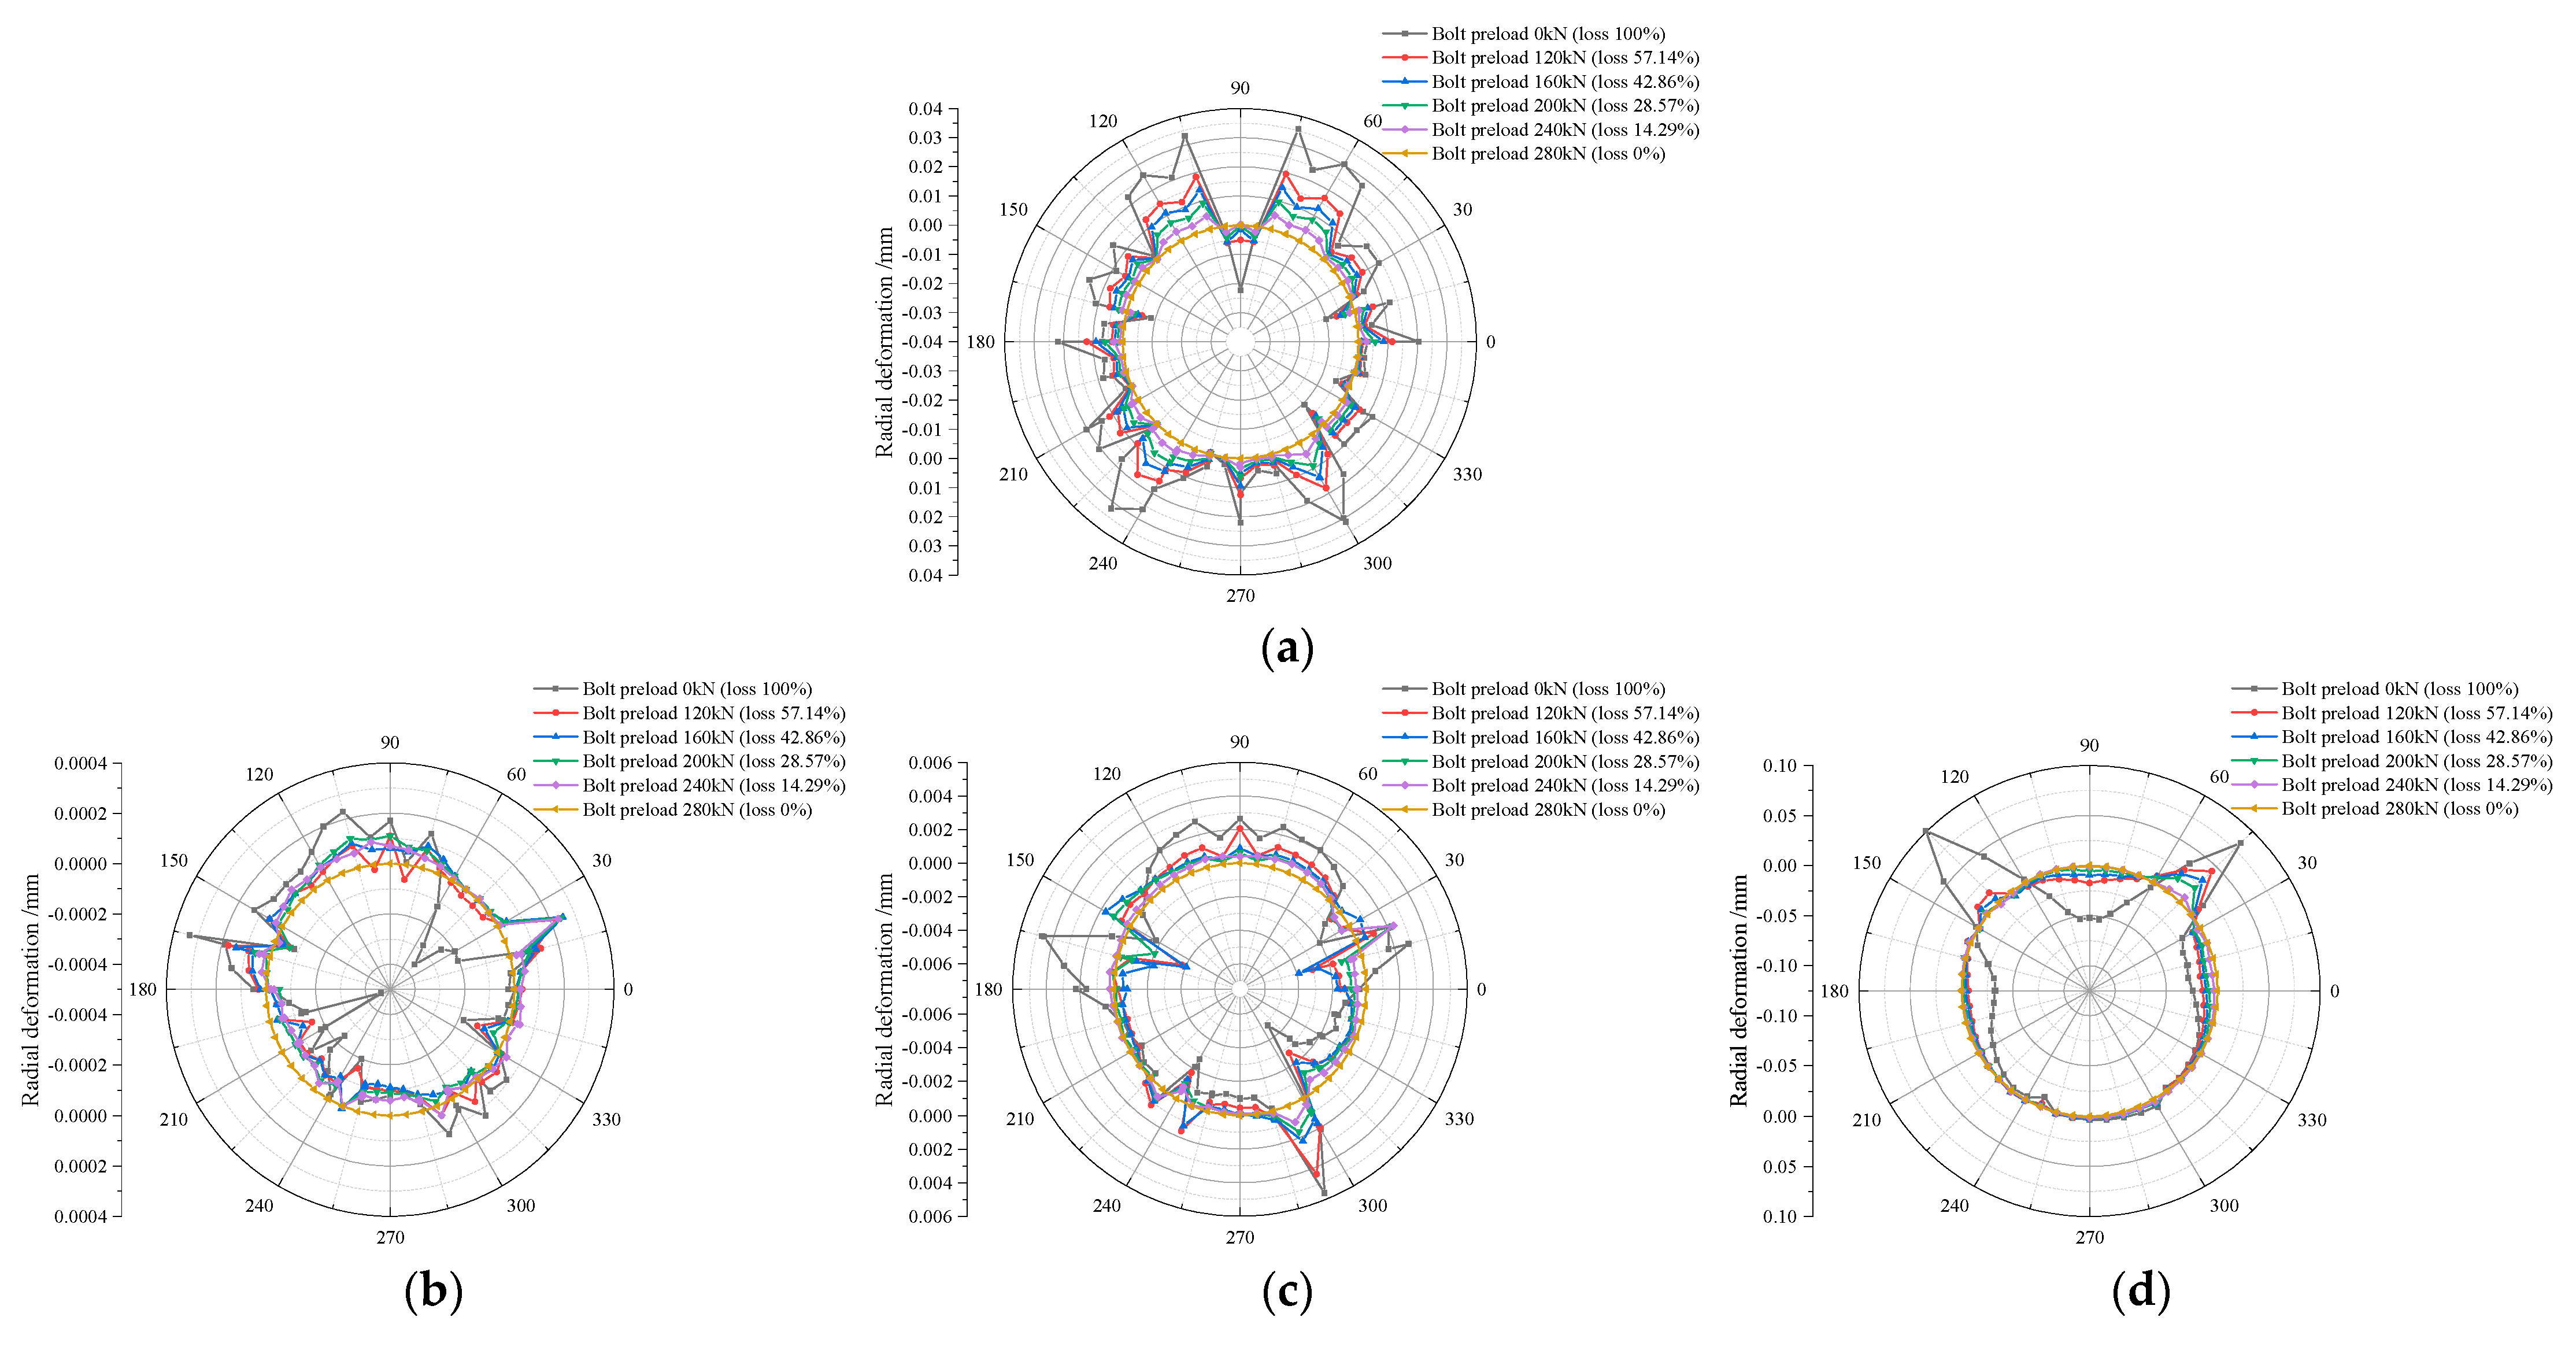
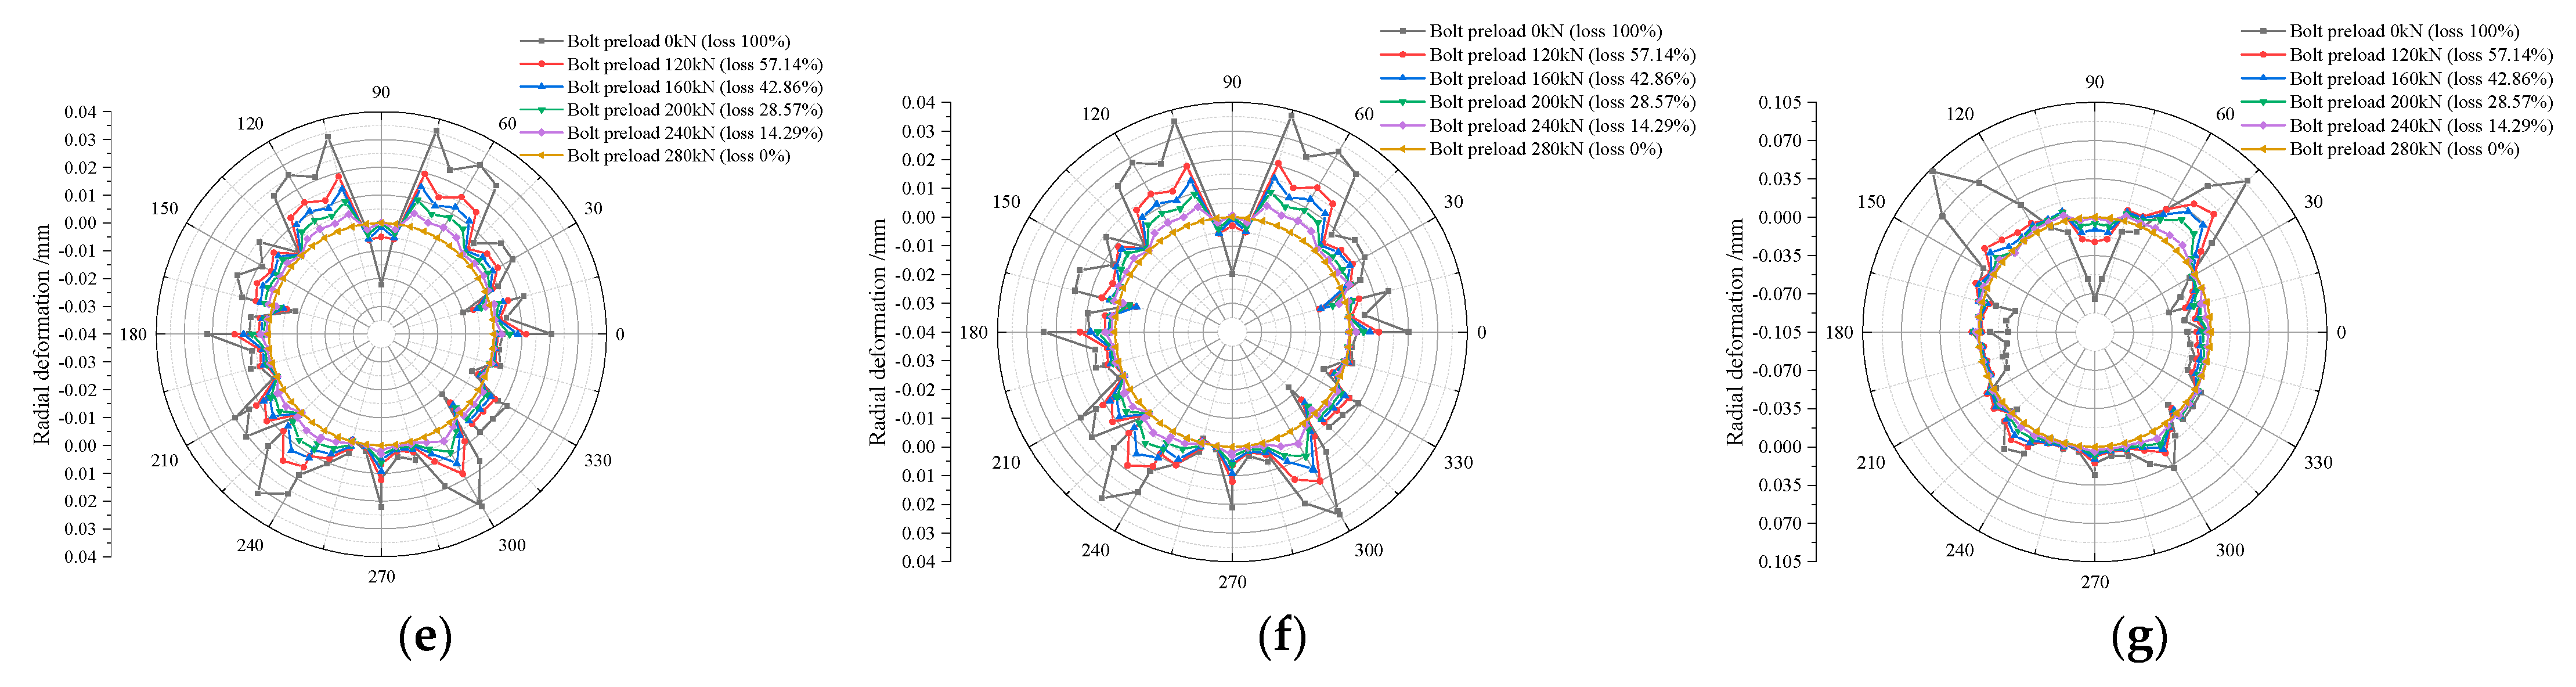
To eliminate the boundary effect, the radial deformation of the middle ring structure of the five-ring shield tunnel is selected for analysis; the results are shown in Figure 9. For the convenience of observation, the radial displacement without loss of preload is set to zero here. Figure 9a shows the radial deformation of the shield tunnel segment before seismic loads, which refers to the impact of varying degrees of performance loss on the radial deformation of the shield tunnel.
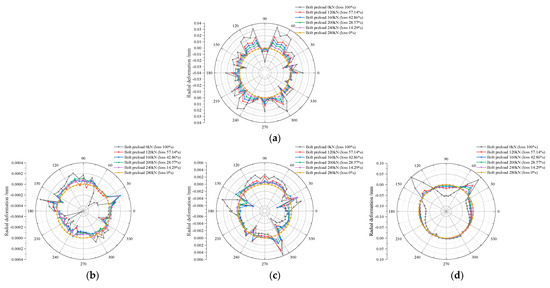
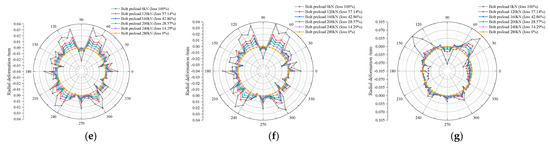
Figure 9.
Radial deformation of the lining structure. (a) Static phase; (b–d) Dynamic phase with PGA = 0.1 g/0.3 g/0.5 g; (e–g) Unrecoverable radial deformation with PGA = 0.1 g/0.3 g/0.5 g.
It can be observed from Figure 9a that the loss of preload leads to initial radial deformation in the shield tunnel before the earthquake, and the radial deformation increases with the increasing degree of preload loss. It can be seen from Figure 9b–d that the variation in radial deformation caused by the initial radial deformation due to preload is not significant under the action of seismic waves with accelerations of 0.1 g and 0.3 g. This implies that under relatively small seismic wave actions, most of the tunnel’s radial deformation can be restored to the state before seismic loading. However, it can be seen from Figure 9e–g that there is residual deformation after the seismic action when the seismic wave is 0.5 g, especially when there is a significant loss of preload. The residual deformation becomes more pronounced with an increasing degree of preload loss.
5. Evolution of Tunnel Seismic Resilience
5.1. Performance of Tunnel Lining
- (A)
- Ellipticity
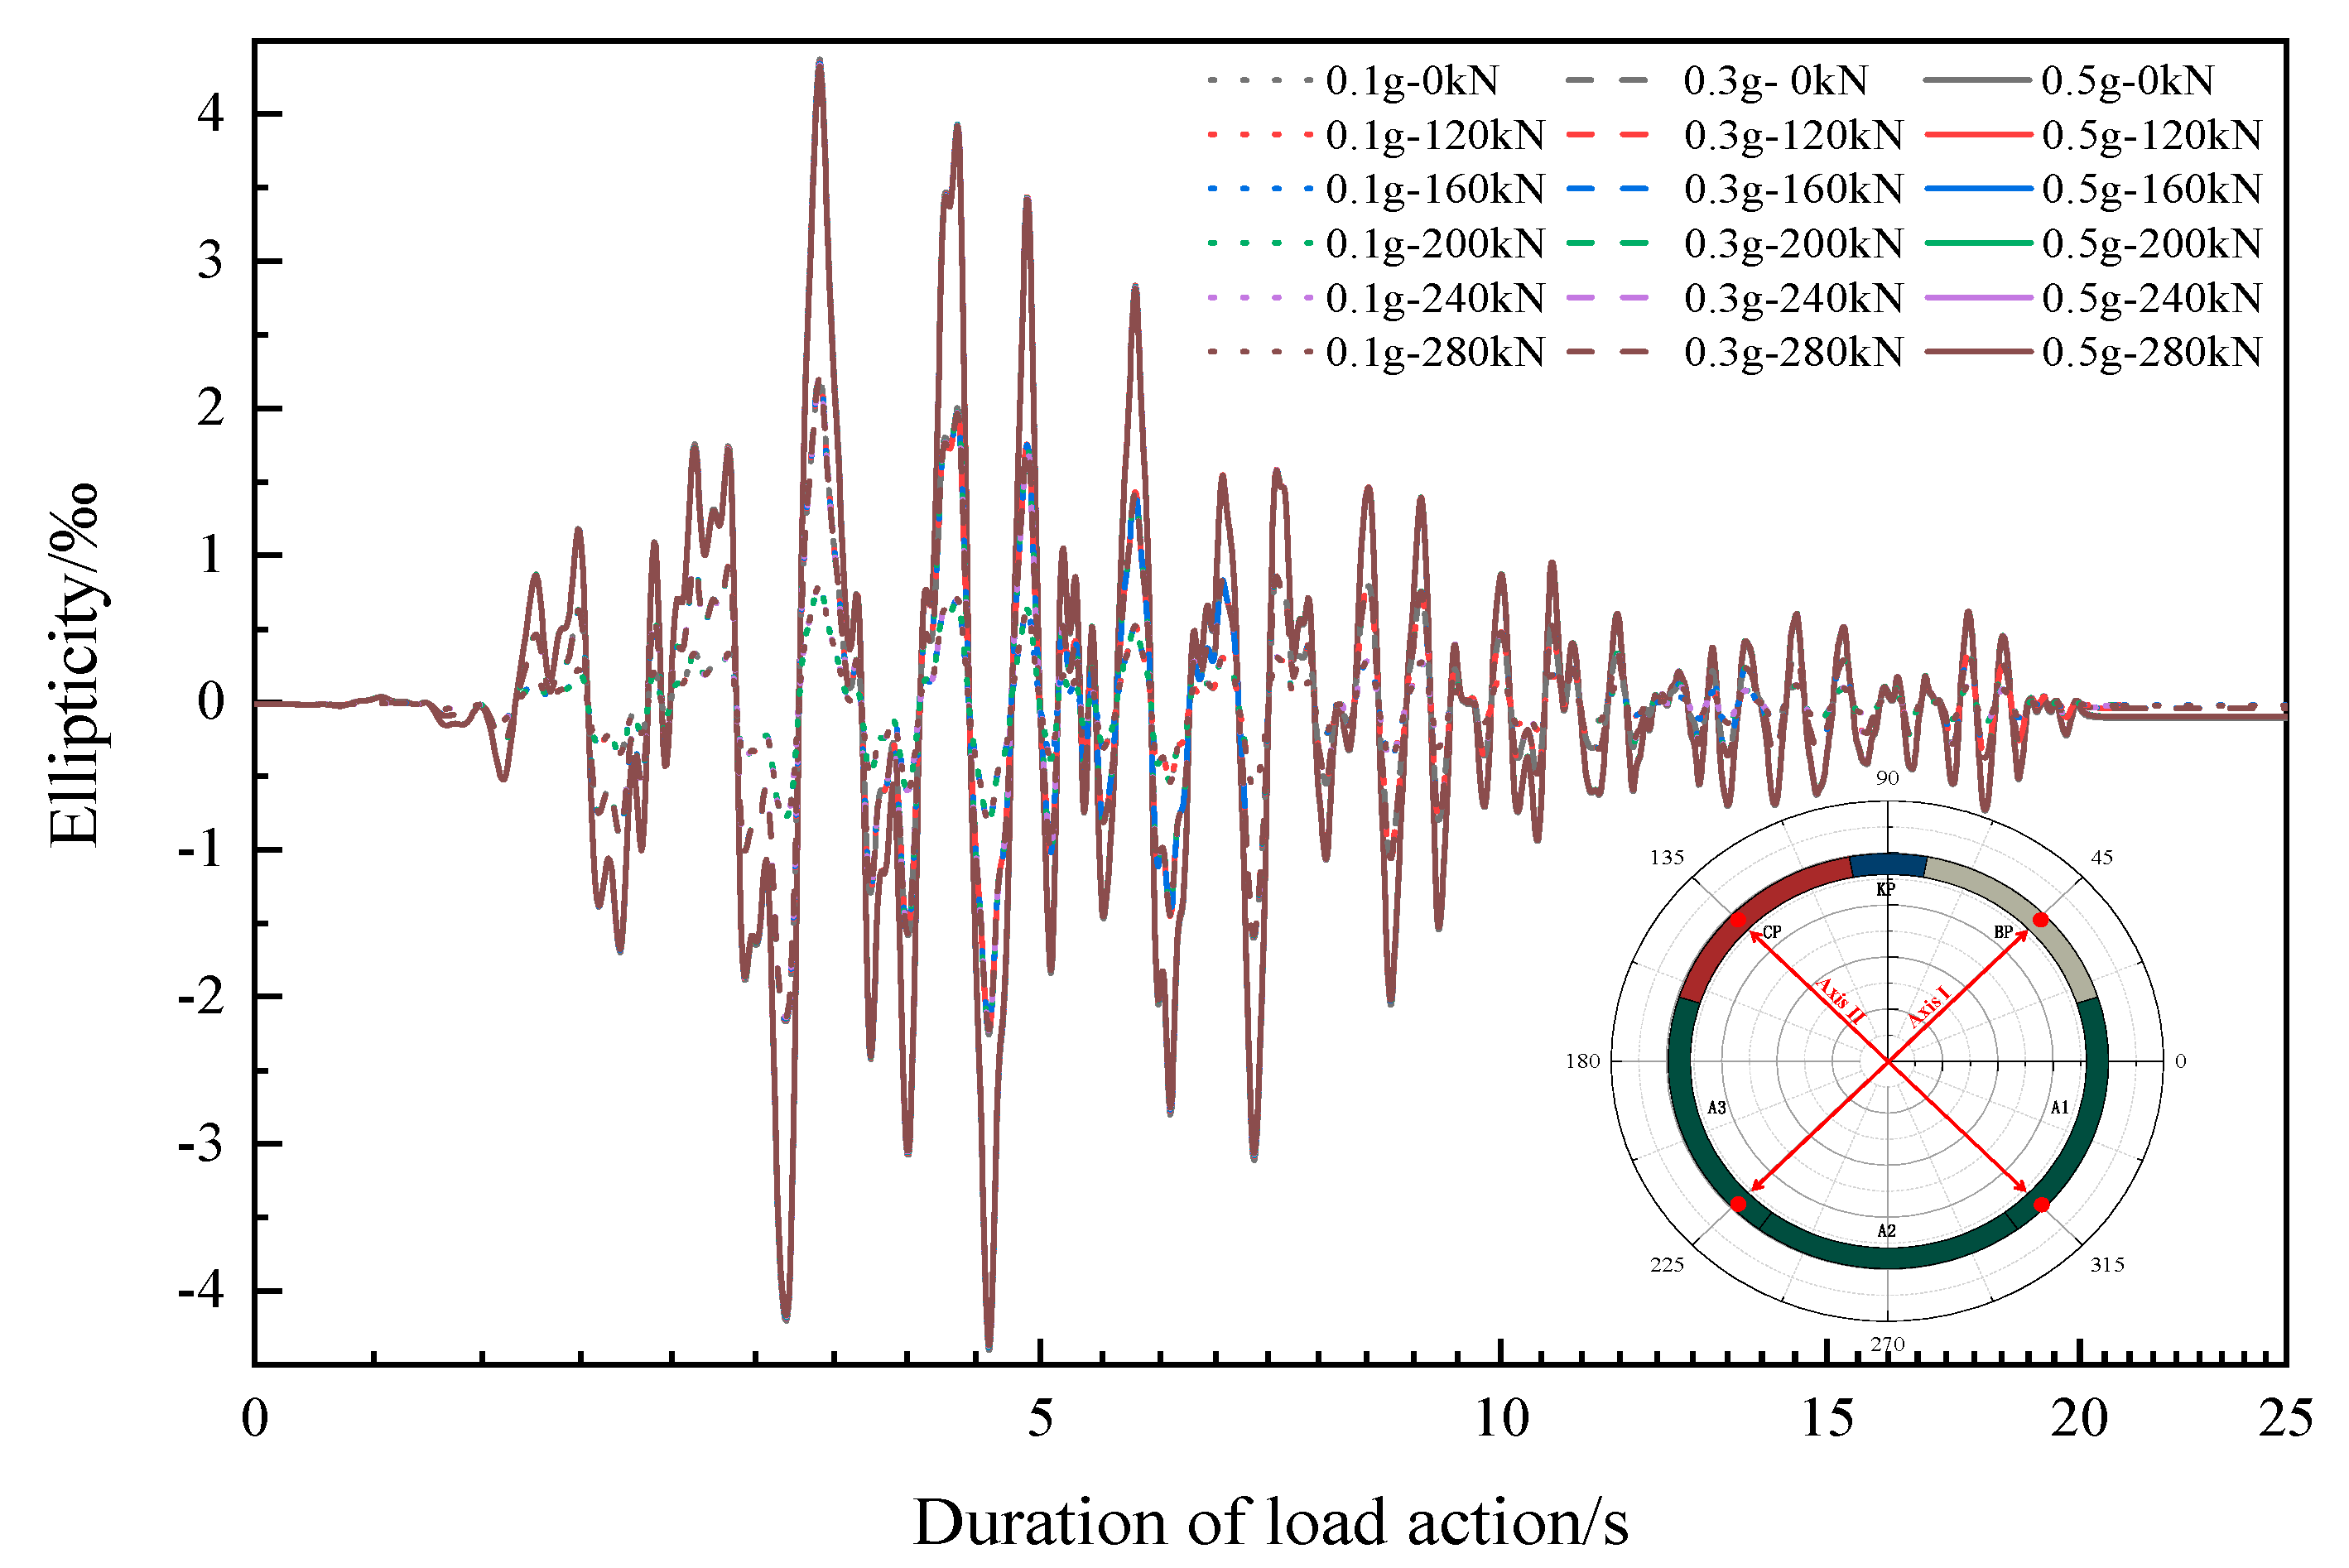
The overall deformation of the structure adopts ellipticity as the primary measure during the seismic loading. Due to the variability of the radial deformation axes during dynamic loading, it has been observed that the compression deformation of the shield tunnel structure is more significant in the 45° or 135° directions under seismic loading. Therefore, it is assumed that the axes along the diameters in the counterclockwise 45° and 135° directions from the center of the shield tunnel are designated as Axis I and Axis II, respectively. As shown in Figure 10a, the radial displacement time–history relationships of four reference points are extracted, namely, the left and right shoulders and the springing points of the middle ring. The variation of ellipticity during the seismic loading is obtained based on the following formula:
where represents the radial deformation variation with time along Axis I; represents the radial deformation variation with time along Axis II; represents the outer diameter of tunnel structures before deformation. Axis I is the major axis when the ellipticity is a positive value, which is shown in Figure 10b. Axis II is the major axis when the ellipticity is a negative value, which is shown in Figure 10c.
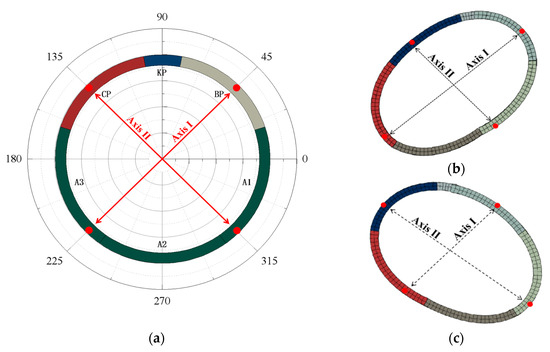
Figure 10.
Ellipticity detection point and the deformation type. (a) Layout of the axis for ellipticity detection; (b) Axis I is the major axis; (c) Axis II is the major axis.
Figure 11 depicts the time–history curves of structural ellipticity under the seismic waves with peak accelerations for various loading conditions. As the seismic load is applied, the ellipticity shows an overall fluctuation. The results under 0.5 g acceleration are taken as an example. Under a seismic wave peak acceleration of 0.5 g, when the preload is 280 kN, the ellipticity reaches a maximum of 4.325‰, a minimum of −4.367‰, with an amplitude of 8.692‰. When the preload is 240 kN, the ellipticity reaches a maximum of 4.332‰, and a minimum of −4.371‰, with an amplitude of 8.703‰. It is shown that the deformation amplitude increases by 0.127% when the preload loss is 40 kN. And when the preload is 0 kN, the ellipticity reaches a maximum of 4.372‰, and a minimum of −4.401‰, with an amplitude of 8.773‰. It is shown that the deformation amplitude increases by 0.932% when the preload loss is 280 kN. The elliptical deformation of the tunnel structure keeps increasing as the preload continues to increase. At the same time, when the preload is 280 kN, the irreversible ellipticity is −0.095‰, while for a preload of 0 kN, this value is −0.105‰. This indicates the constraining effect of preload on the overall deformation of the tunnel structure.
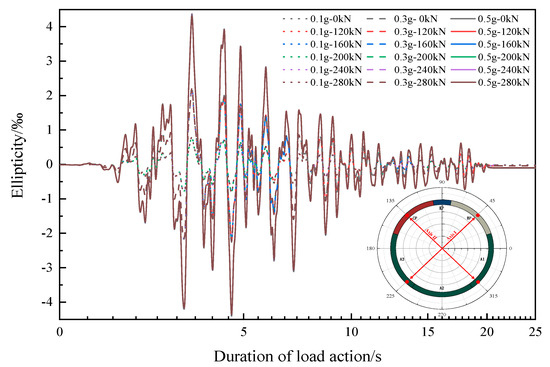
Figure 11.
Time–history of changes in ellipticity.
Additionally, under seismic waves peak accelerations of 0.3 g and 0.1 g, the deformations of the tunnel structure with complete preload are 4.994‰ and 1.610‰, respectively. The greater the peak value of the earthquake, the more pronounced the impact of seismic loading on the overall deformation of the tunnel structure. At the same time, it can be observed from the figure that there is a certain degree of recovery in the tunnel structure after the seismic wave ends. But, the complete recovery of the tunnel structure is not achieved. There is some residual deformation on the tunnel structure. When the peak acceleration is 0.1 g, 0.3 g, and 0.5 g, the residual deformations of the tunnel structure are −0.018‰, −0.0363‰, and −0.096‰, respectively. It can be observed that the residual deformation of the tunnel structure increases with the increase in peak acceleration of the seismic wave. Residual deformation can be considered as structural plastic deformation caused by tunnel segments, joint plasticity, and internal force redistribution in the tunnel structure.
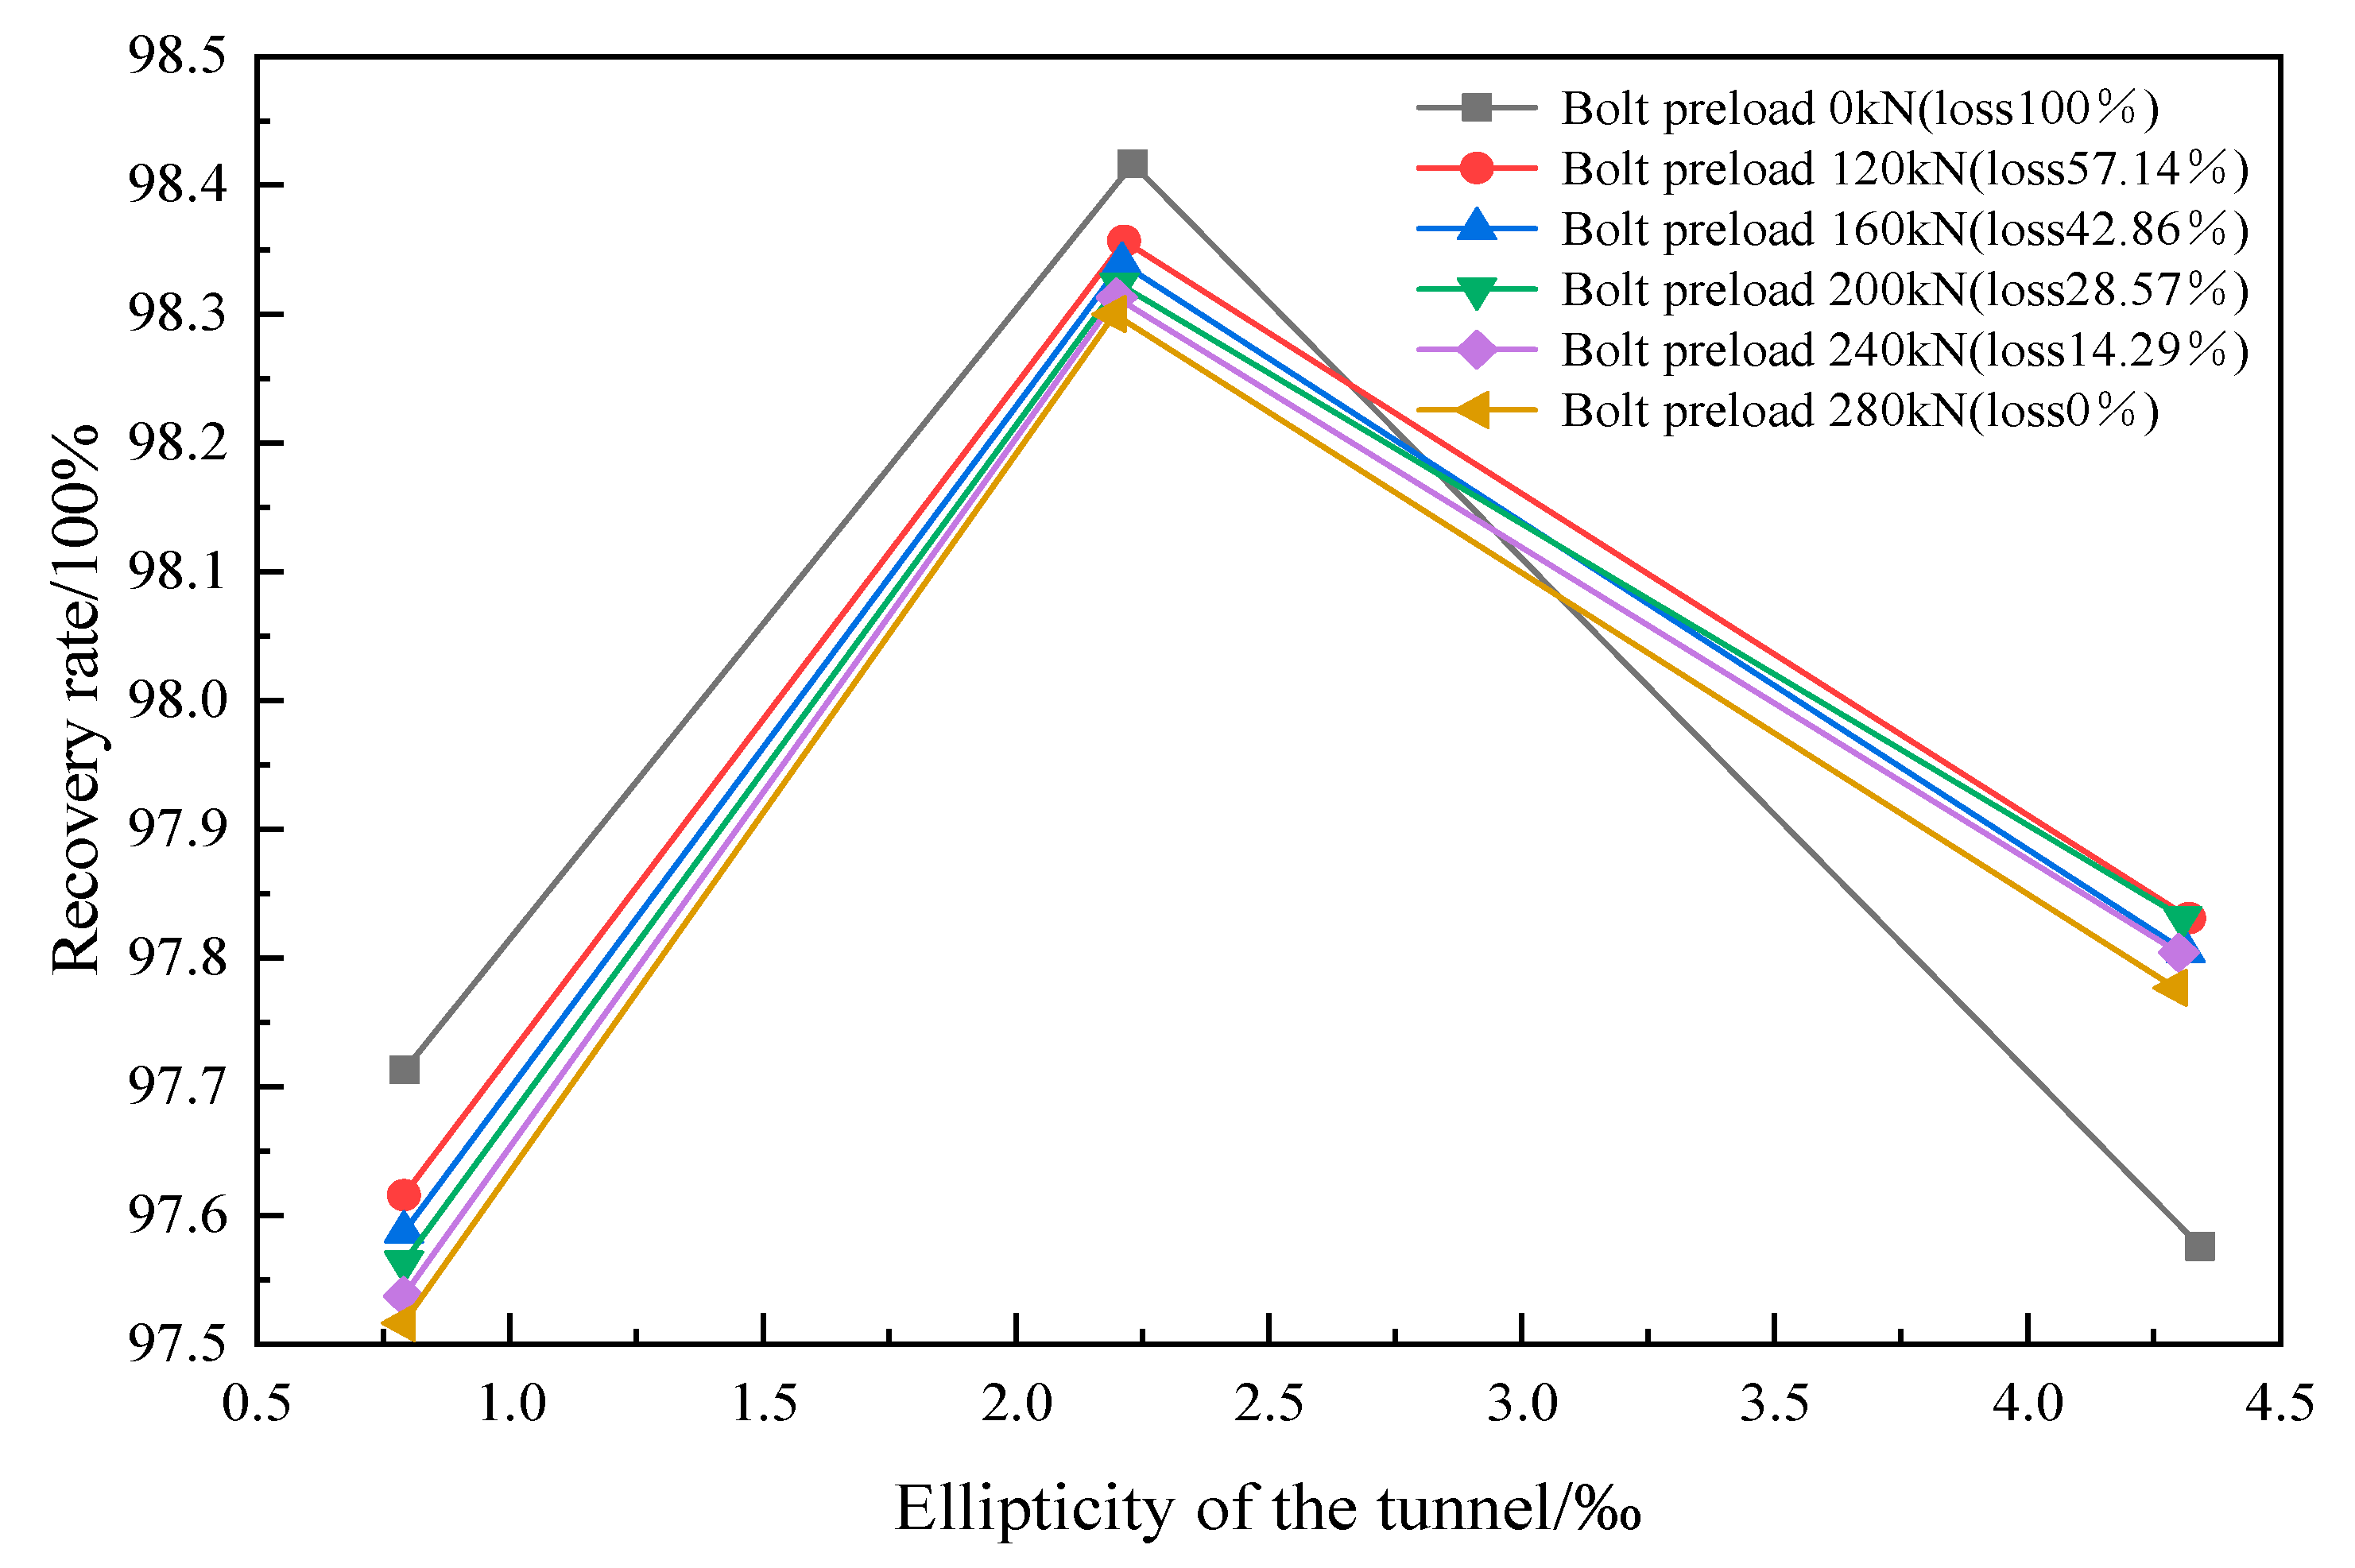
Figure 12 shows the recovery rate of tunnel ellipticity caused by the recovery phase after the shield tunnel ellipticity reaches its peak during the seismic load process. As the peak acceleration of the earthquake increases, the recovery rate here is not only related to the stability value at the end of the recovery period but also closely related to the overall deformation of the structure during the loading process. Specifically, when the peak acceleration changes from 0.1 g to 0.3 g, the structure undergoes greater deformation under larger loads, resulting in a larger proportion of its recovery value during the recovery phase. When the seismic acceleration changes from 0.3 g to 0.5 g, the recovery rate decreases. The reason is that as the peak acceleration of the applied seismic load increases, the structure undergoes a certain degree of plastic irreversible deformation. And when a certain limit of plastic deformation is reached, the proportion of irreparable deformation in the overall deformation of the structure is increasing. It was found from Figure 12 that the difference in recovery rates between different degrees of loss gradually decreased during the change of peak acceleration from 0.1 g to 0.3 g. The recovery rate decreased more significantly at 0.5 g when the preload was completely lost compared to other situations. Therefore, it can be concluded that the preload not only has a significant constraint effect on the overall deformation of the structure but also has a significant optimization effect on increasing the structural resilience and reducing the proportion of plastic deformation in the overall deformation during the recovery stage.
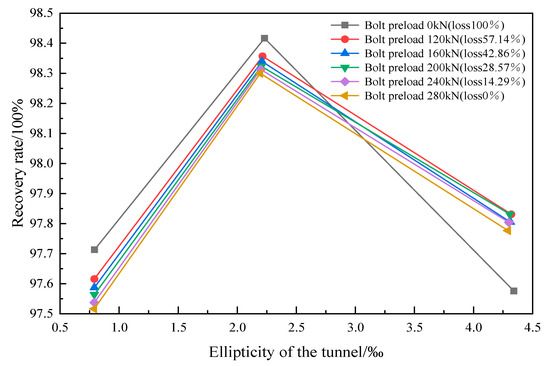
Figure 12.
Recovery rate of ellipticity with the loss of preload.
- (B)
- Deformation on Segment Joints
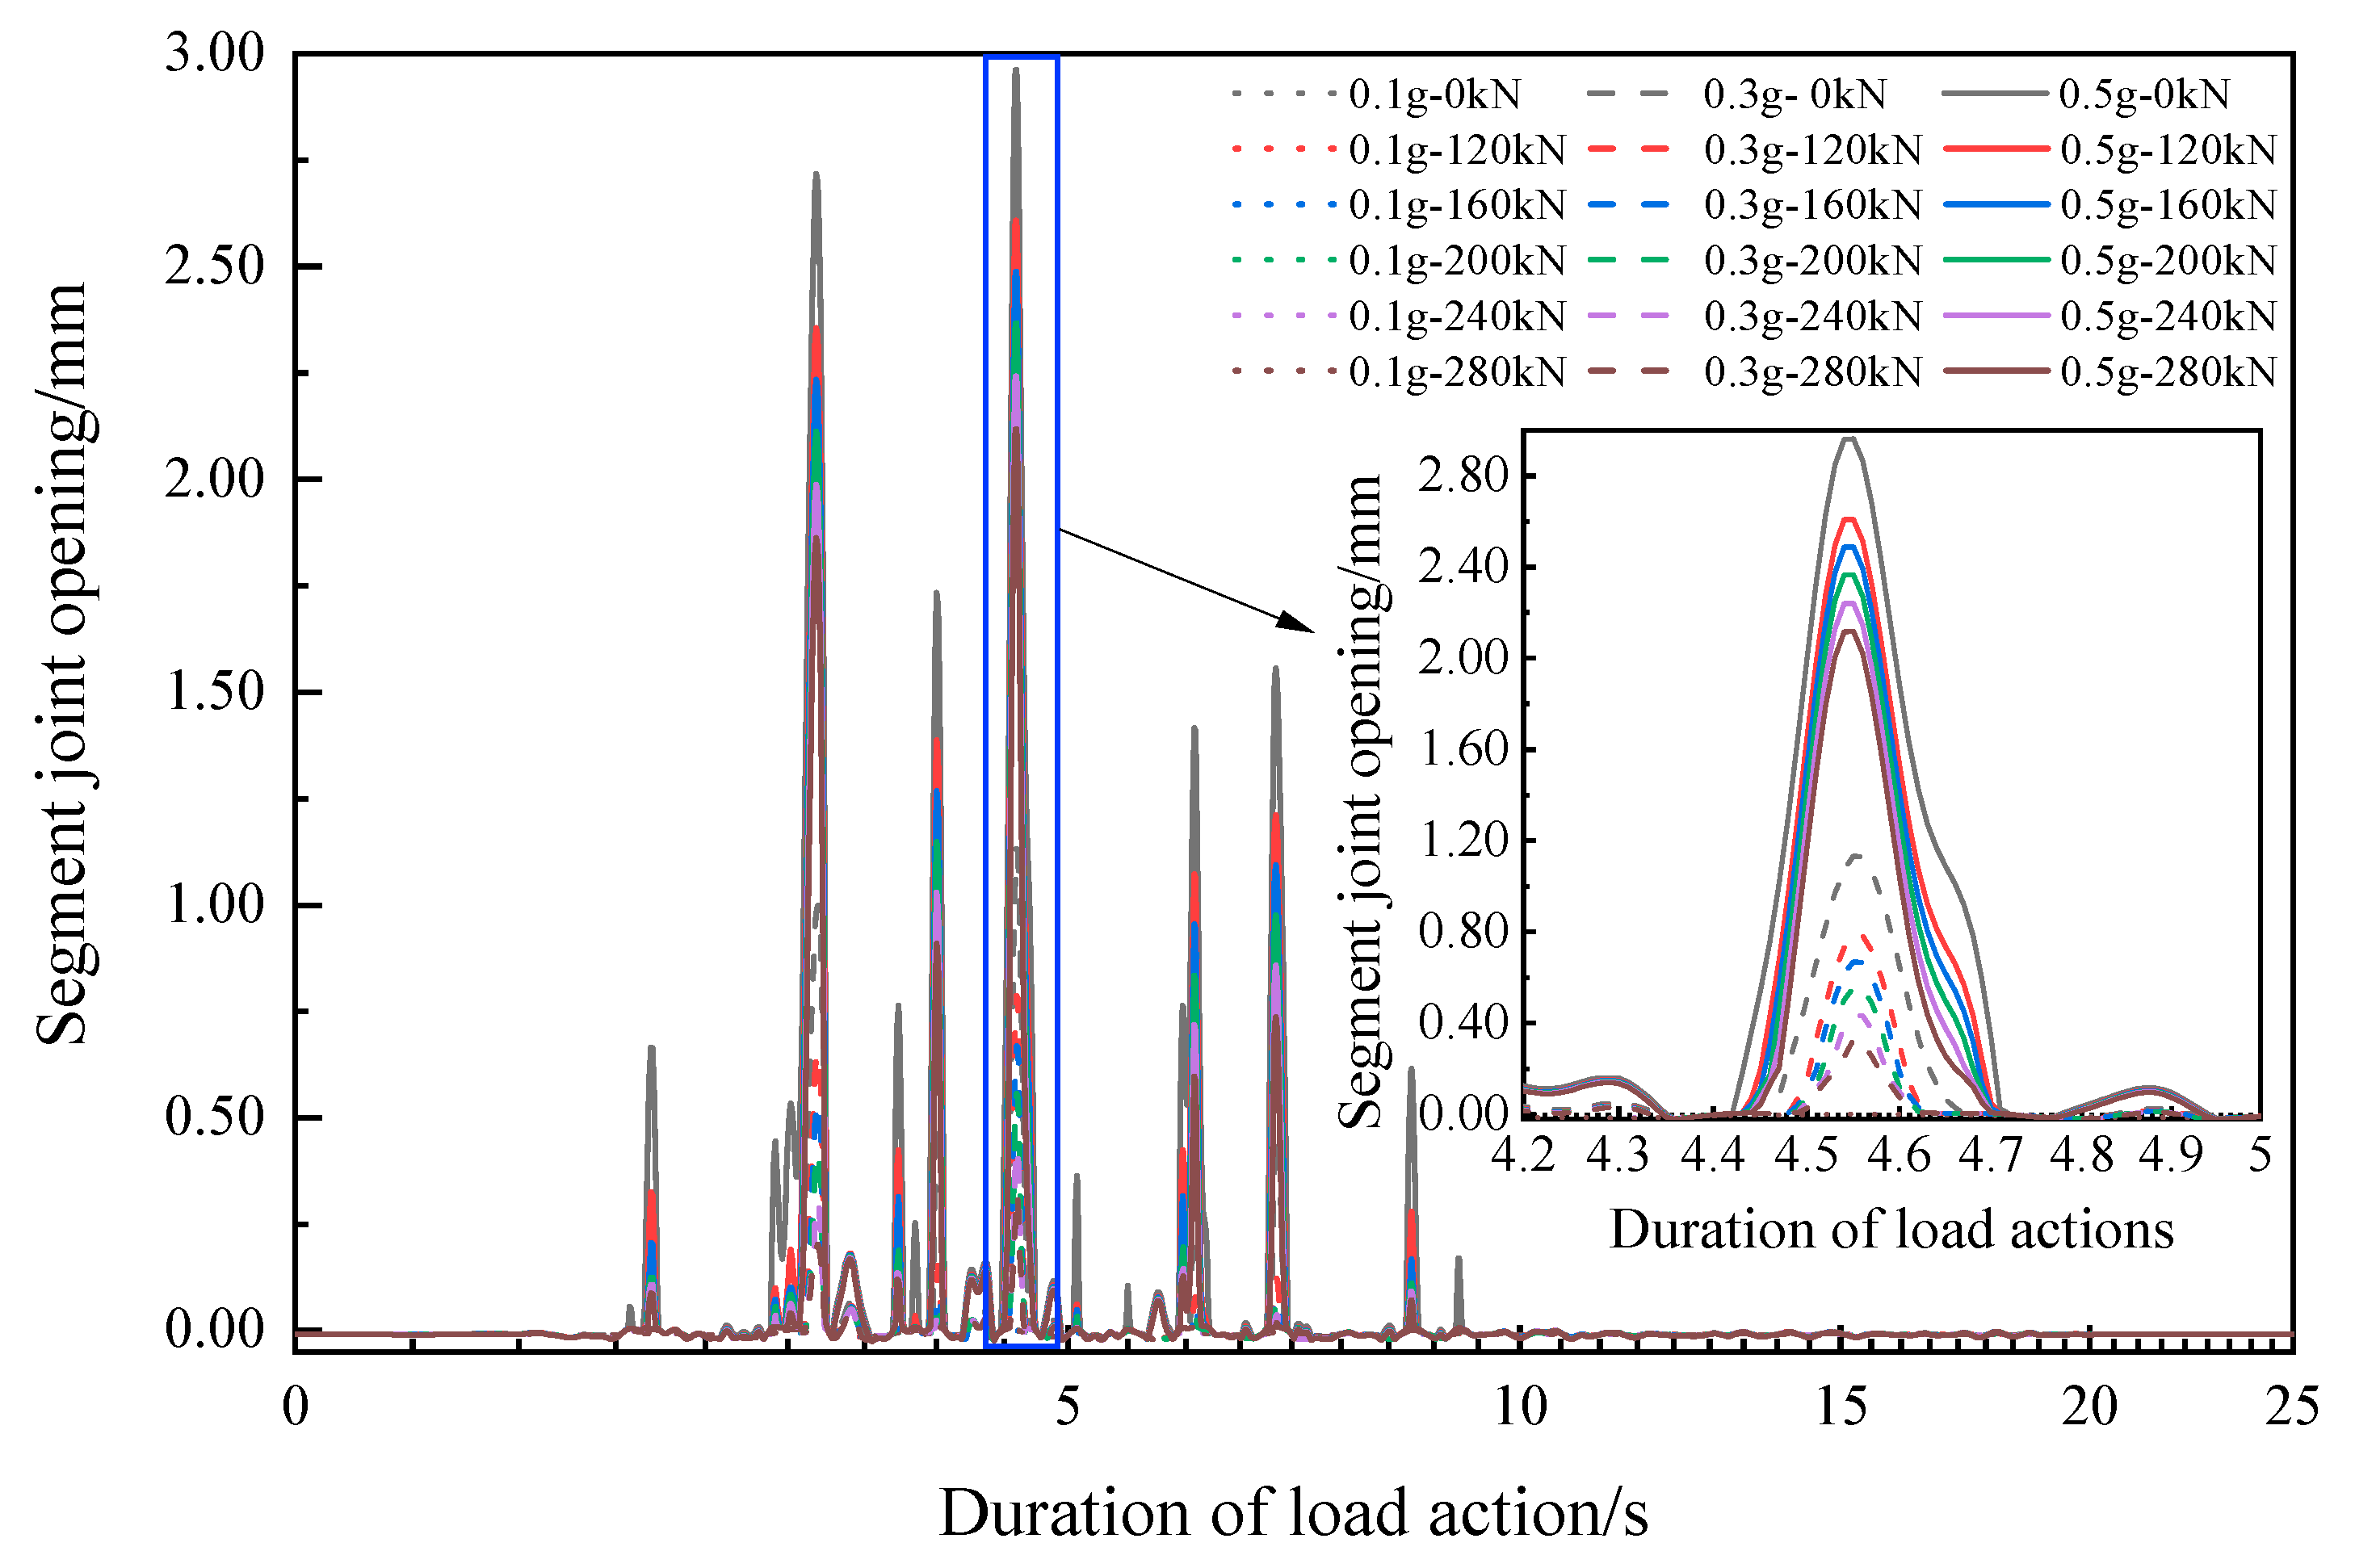
The radial displacement of the observation points at the adjacent segment joints on the S4 outer arc surface of the segment joint at the arch bottom is selected to obtain the segment joint opening time curve under the seismic load, as shown in Figure 13. The fluctuation trend of segment opening under various working conditions is basically consistent with the application of seismic loads. But, as the peak acceleration increases, the amplitude of the fluctuation significantly increases. When there is no loss of preload, the maximum opening amount at a peak acceleration of 0.1 g is 1.5 × 10⁻⁴ mm, 0.309 mm at 0.3 g, and 2.118 mm at 0.5 g. When the preload is completely lost, the maximum opening amount under the action of 0.1 g peak acceleration is 5.5 × 10⁻⁴ mm, 1.128 mm at 0.3 g, 2.963 mm at 0.5 g.
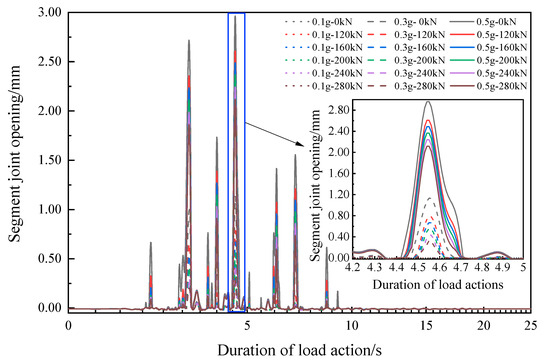
Figure 13.
Segment joint opening time curve under seismic load.
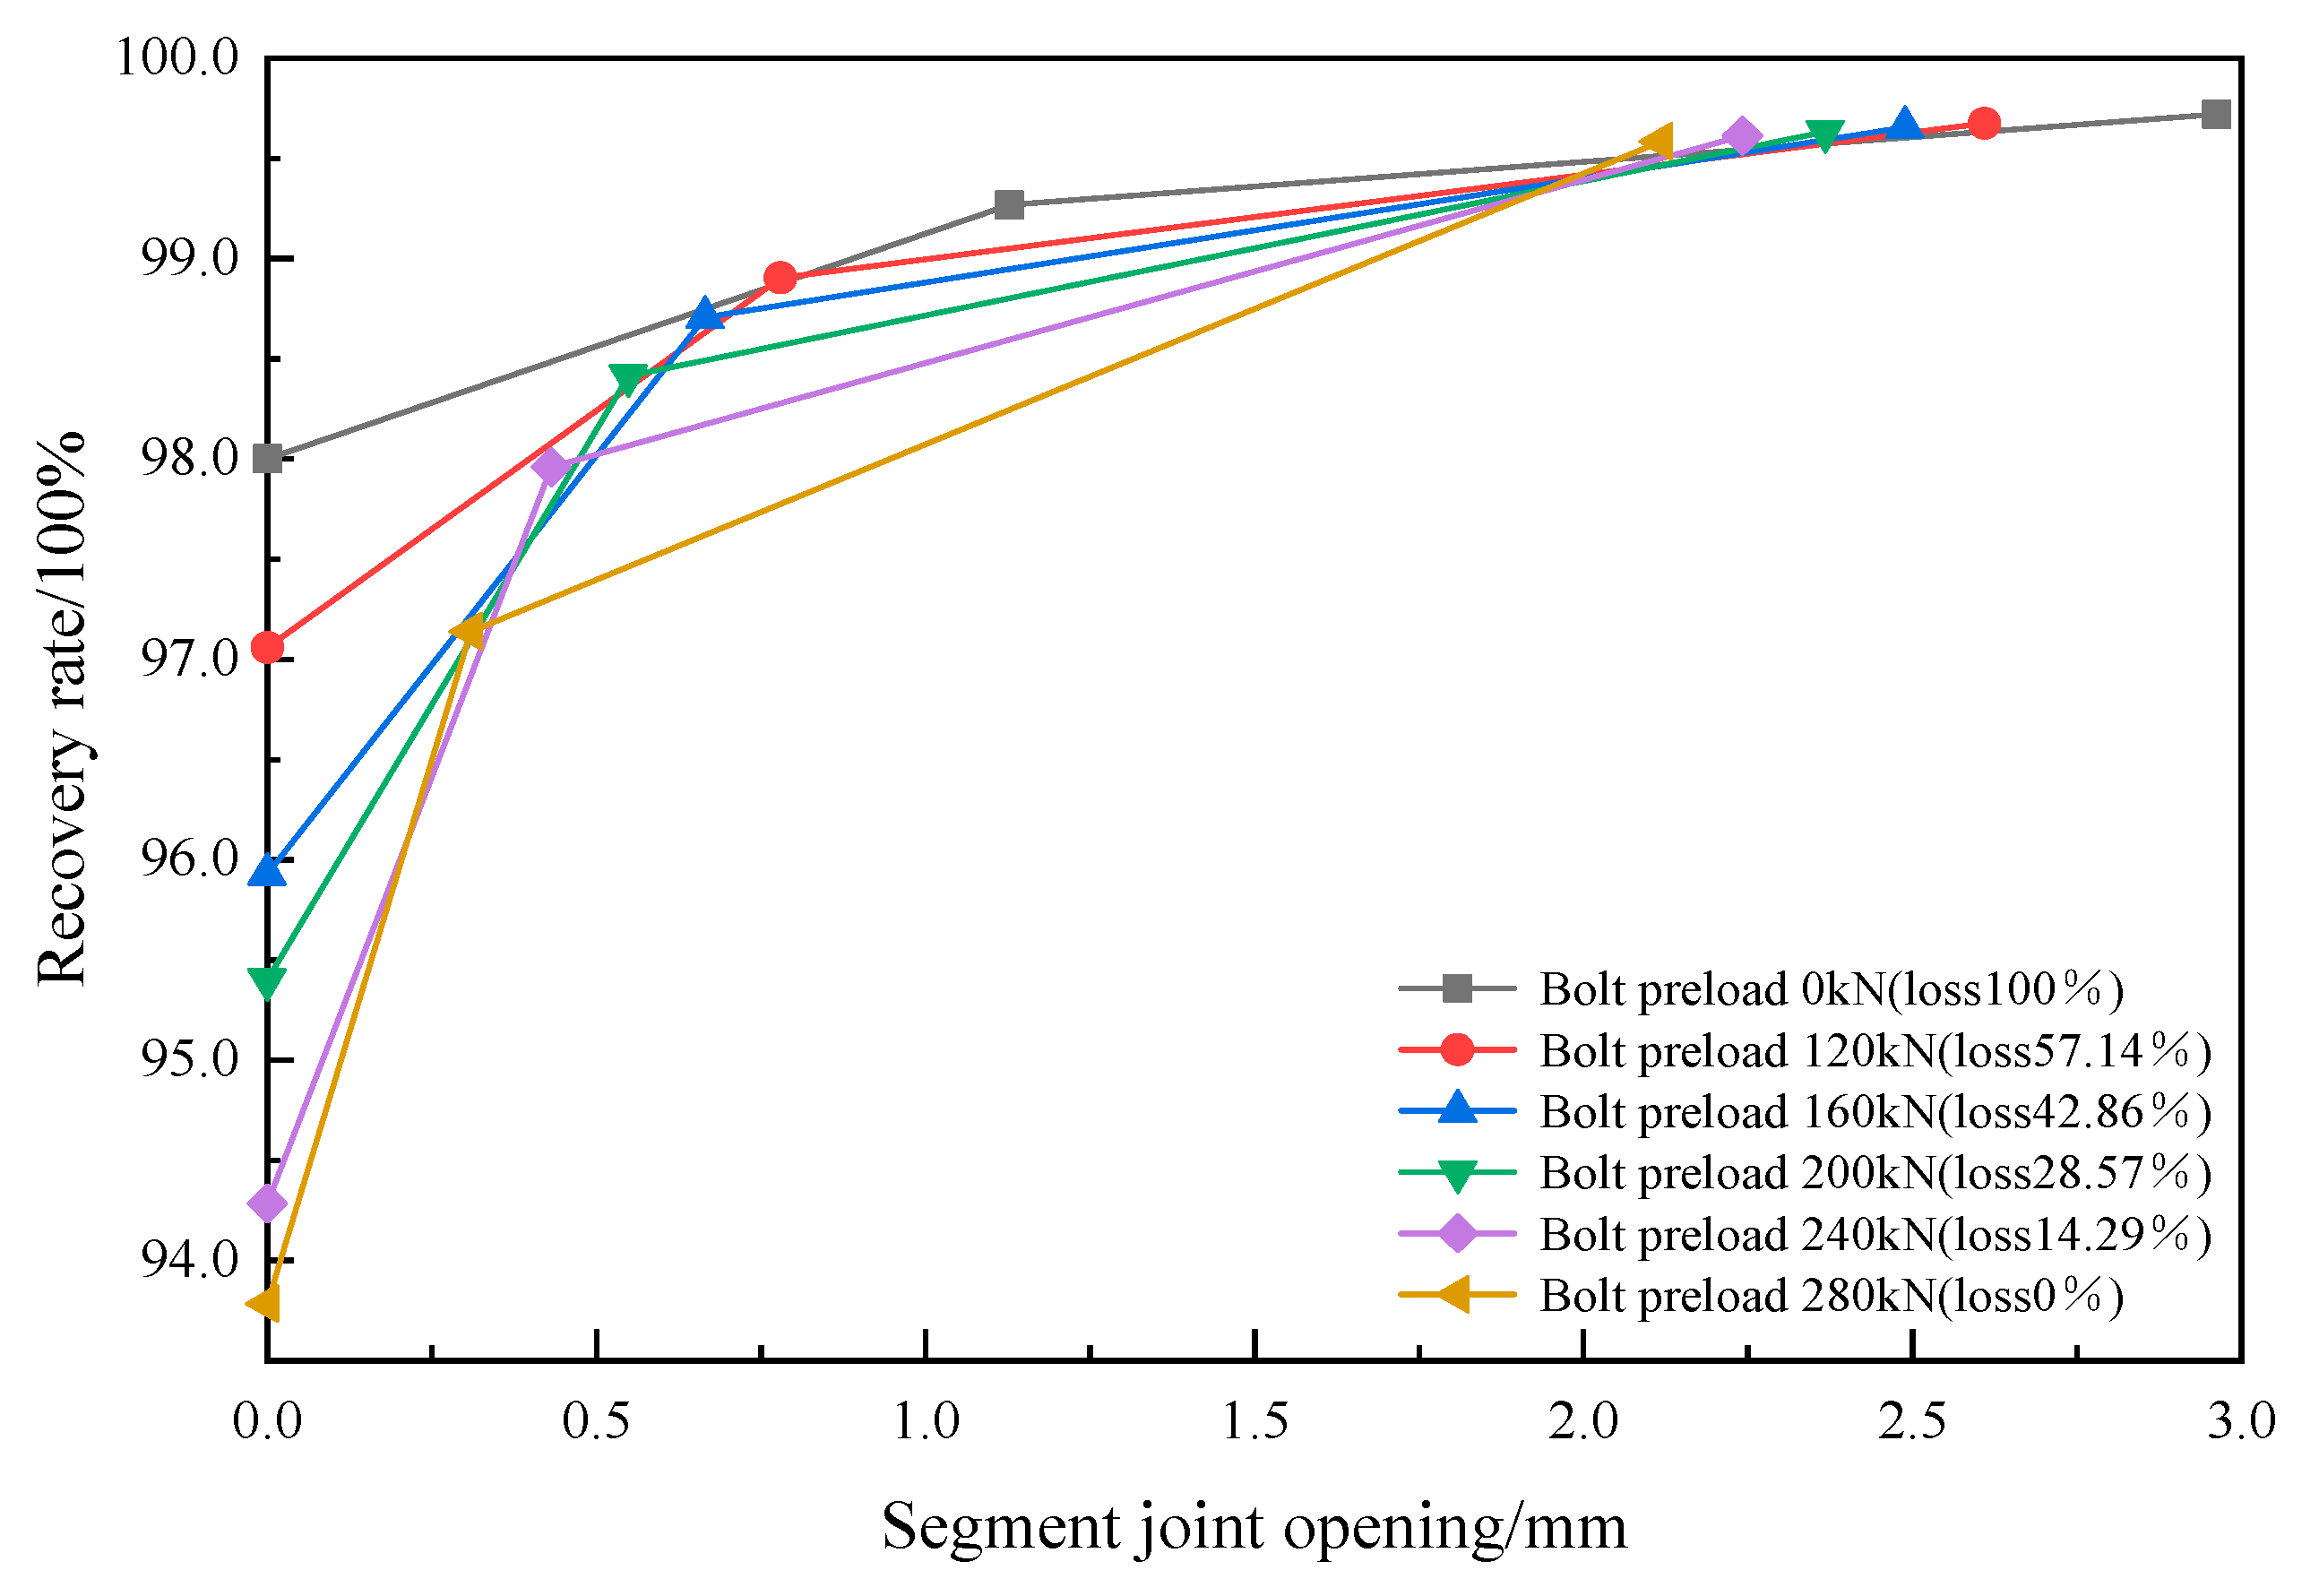
The recovery rate of the segment joint opening under different degrees of lining performance loss under different peak acceleration seismic loads is shown in Figure 14. It can be seen from the figure that the difference in recovery rates between different degrees of loss gradually decreases as the peak acceleration of seismic load changes from 0.1 g to 0.5 g. And the difference in segment joint opening under different degrees of preload loss gradually increases with the peak acceleration increases.
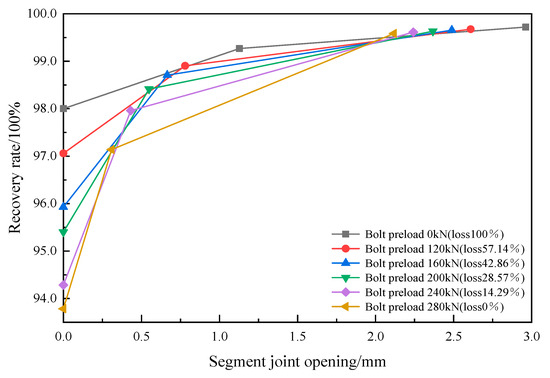
Figure 14.
Recovery rate of segment joint opening with different conditions.
5.2. The Impact of Preload Loss on Resilience
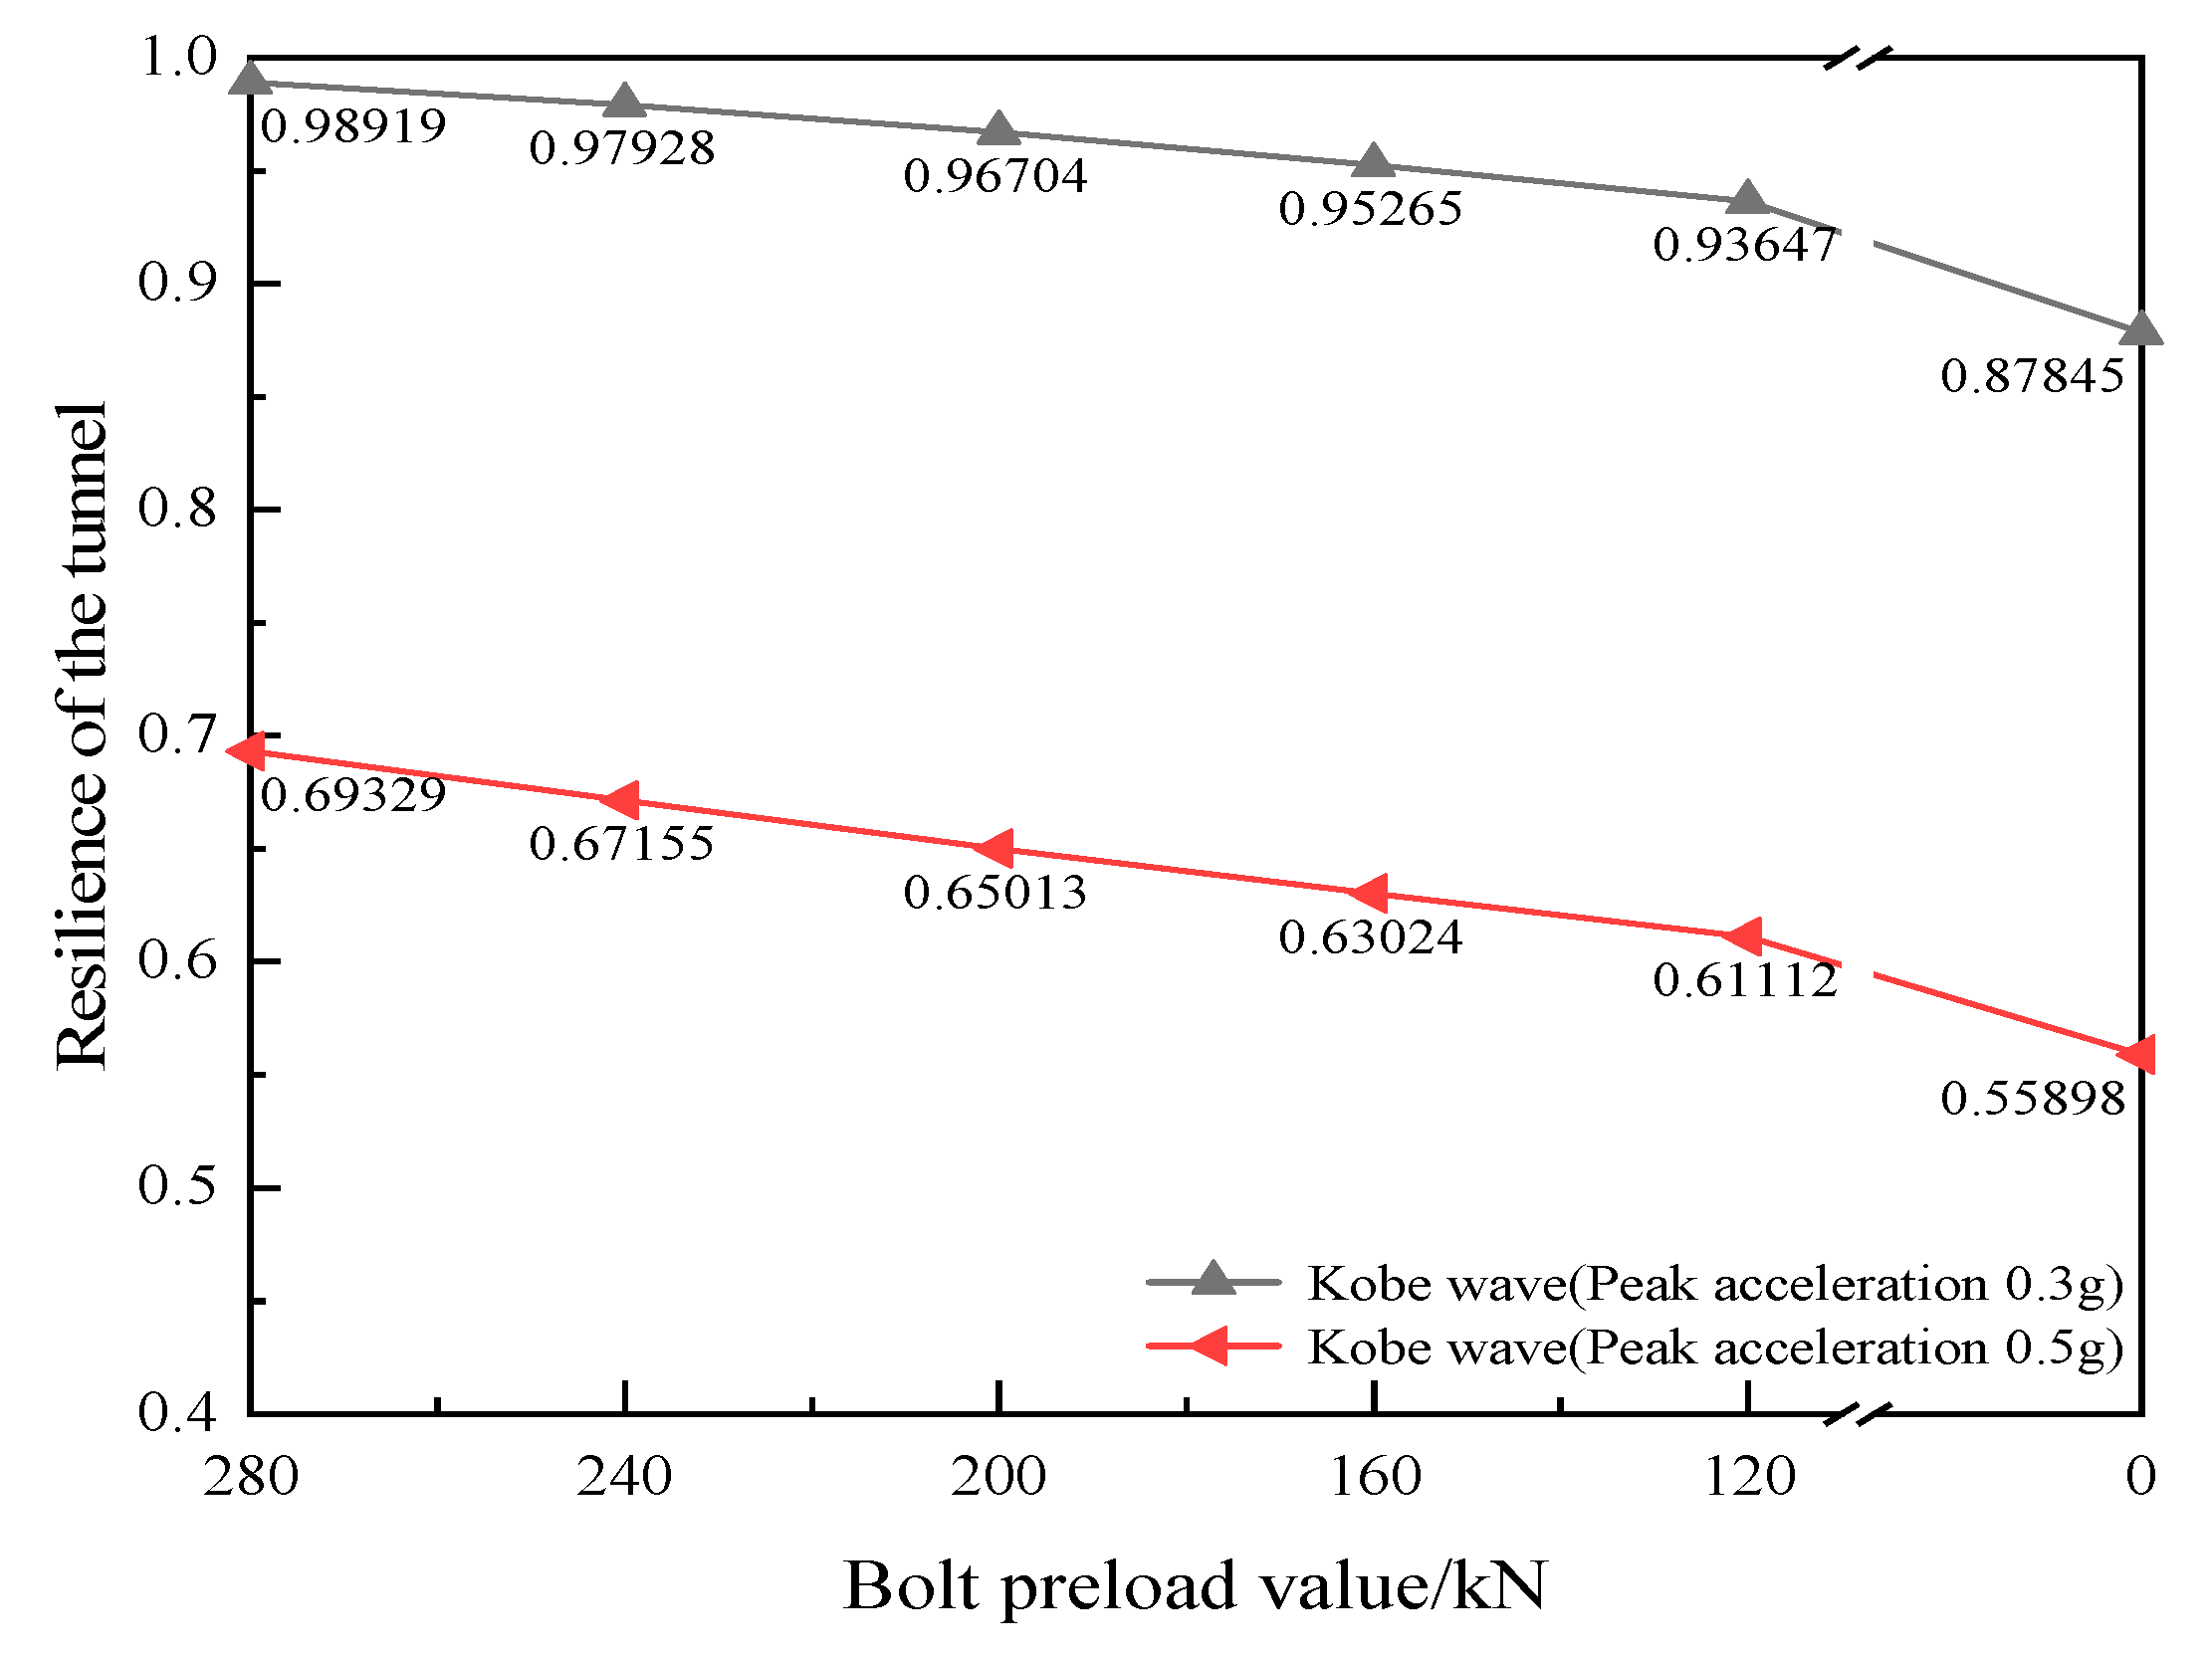
Figure 15 shows the impact curve of the degree of initial lining performance degradation (degree of preload loss) on the resilience of the tunnel structure. It can be seen from the figure that as the degree of degradation of lining performance increases at the time of seismic load application (the degree of loss of bolt pre-tightening force increases), the tunnel resilience significantly decreases. Moreover, as the peak acceleration of seismic load increases, the impact of initial lining performance loss on structural resilience becomes more significant. Therefore, it can be concluded that the greater the degree of damage to the initial lining performance, the lower the structural recovery ability and the worse the structural resilience. Moreover, as the seismic peak increases, the structural damage becomes more severe, and this initial lining performance loss has a greater impact on structural resilience.
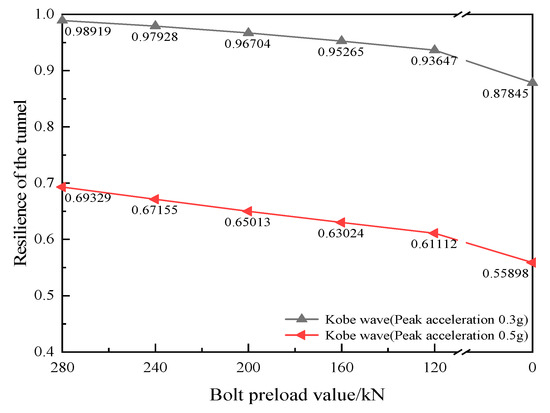
Figure 15.
The influence of the attenuation of the lining performance on the tunnel resilience.
5.3. Classification of Resilience
The resilience of shield tunnel structures under seismic loading is classified into four levels based on the high-, medium-, and low-performance cut-off points of the resilience index. When the ellipticity is used as the resilience index, the lining performance of 0–3‰, 3–6‰, 6–12‰, and greater than 12‰ is divided into four grades: high performance, medium performance, low performance, and very low performance. Similarly, when the opening amount is taken as the resilience index, the opening amounts 0–1 mm, 1–2 mm, 2–4 mm, and greater than 4 are divided. However, due to the particularity of seismic load, there is no linear relationship between load and action time. Therefore, the structural performance curve under the influence of seismic load needs to be calculated by different types of seismic waves. However, the resilience index threshold generally needs to be determined based on the structural performance curve, so the threshold value of each performance grade in this study cannot be determined. In order to understand better, 0.9, 0.8, 0.6 are used as thresholds to divide each resilience and described [1,14,15,16] as below:
(1) High Resilience (Re ≥ 0.9): The structural deformation does not exceed the specified warning value. The lining performance is overall within the high-performance range. The structural recovery performance is good, and the structure is in a safe state.
(2) Medium Resilience (0.8 ≤ Re < 0.9): The structural deformation has not exceeded the specified control value. The overall lining performance is within the high to medium performance range under seismic load, resulting in low structural safety risk. And generally, there is no need for structural reinforcement.
(3) Low Resilience (0.6 ≤ Re < 0.8): The structural deformation exceeds the specified control value. The overall lining performance is within the medium to low-performance range under seismic load. The recovery performance deteriorates, the ductility index decreases rapidly, and there is a high structural safety risk. Necessary measures for ground and structural reinforcement should be implemented as soon as possible.
(4) None Resilience (Re < 0.6): The structural deformation significantly exceeds the specified control value, and the deformation rapidly progresses. The lining performance is in an extremely low-performance range under seismic load, with a substantial reduction, or even loss, of recovery capability. At this time, it is imperative to promptly implement reasonable comprehensive reinforcement and restoration measures considering the geological conditions and structural status.
It is worth noting that the resilience index threshold used in this study is obtained through finite element calculations for various conditions based on structural performance curves. A more reasonable threshold value would require further refinement through extensive theoretical calculations and engineering case studies.
6. Conclusions
This study proposes performance indicators for shield tunnel lining under seismic loads. The structural response and resilience evolution under different initial performance losses and peak acceleration seismic loads were analyzed using a three-dimensional refined finite element model. The main conclusions obtained are as follows:
(1) Lining performance indicators were established considering the maximum deformation in history, including ellipticity performance indicators that consider the overall deformation of the lining structure and opening quantity indicators that mainly consider the performance of segment joints.
(2) The structural recovery ability after seismic load is related to the structural lining performance at the initial moment of load action and the lining loss. The smaller the degree of lining loss, the recovery ability is stronger during the recovery stage.
(3) The deformation of the tunnel structure cannot be fully restored after seismic load. The residual deformation increases with the increase in the initial lining performance loss at the time of seismic load and also increases with the increase in peak acceleration of seismic load.
This study mainly focuses on the influence of the degree of different initial performance loss degrees of lining on the seismic resilience of shield tunnels. Different degrees of preload loss are used as characterization methods for different degrees of lining loss. As is well known, resilience is a very broad concept in engineering [38,39,40]. This study uses two parameters, structural and mechanical performance as well as structural deformation, during seismic loading to reflect the changes in structural performance level during the loading process and then evaluates the resilience of the structure. However, the influence of groundwater was not considered in this study, so formation liquefaction will also be a part of our future research [41,42,43,44]. Overall, this study can provide valuable insights for the early seismic design and later operation and maintenance of shield tunnels, improve the understanding of engineering professionals about the pre-tension in the operation of shield tunnels, and provide a reference for the evaluation of the seismic resilience of shield tunnels [44,45,46].
Author Contributions
Conceptualization, H.C., X.B. and X.C.; methodology, H.C., J.S. and R.T.; validation, X.B., Z.H. and T.Q.; formal analysis, X.W. and R.T.; investigation, R.T., T.Q. and Z.H.; data curation, R.T. and X.W.; writing—original draft preparation, R.T. and X.W.; writing—review and editing, J.S. and X.B.; supervision, H.C.; project administration, X.C. and Z.H.; funding acquisition, H.C. and X.C. All authors have read and agreed to the published version of the manuscript.
Funding
This research is fully supported by the National Natural Science Foundation of China (No. 52022060 & 52090084); the National Natural Science Foundation of China (No. 51925804 & 52090084) and the Shenzhen Science and Technology Program (Grant No. KQTD20200909113951005).
Institutional Review Board Statement
Not applicable.
Informed Consent Statement
Not applicable.
Data Availability Statement
Data are contained within the article.
Conflicts of Interest
Author Zhen Han is employed by the China Railway 22nd Bureau Group Shenzhen Construction Co., Ltd. The remaining authors declare that the research was conducted in the absence of any commercial or financial relationships that could be construed as a potential conflict of interest.
References
- Zhu, M.; Chen, X.; Wang, X. Analysis and thinking on structural performance evolution of shield tunnel ling. Eng. Mech. 2022, 39, 33–50. (In Chinese) [Google Scholar]
- Shao, H.; Huang, H.; Zhang, D.; Wang, R. Case study on repair work for excessively deformed shield tunnel under accidental surface surcharge in soft clay. Chin. J. Geotech. Eng. 2016, 38, 1036–1043. [Google Scholar]
- Liang, R.; Cao, S.; Xiang, L.; Kang, C.; Chen, F.; Li, Z.; Ke, Z.; Cuo, Y. Experimental investigation on longitudinal mechanical mechanism of shield tunnels subjected to ground surface surcharge. Chin. J. Rock Mech. Eng. 2023, 42, 736–747. [Google Scholar]
- Wang, R.; Zhang, D. Mechanism of transverse deformation and assessment index for shield tunnels in soft clay under surface surcharge. Chin. J. Geotech. Eng. 2013, 35, 1092–1101. [Google Scholar]
- Li, F.; Gou, C.; Xu, D. Study on Structure Inner Forces Affected by Shield Tunnel Segment Joint Bending Stiffness. J. Wuhan Univ. Technol. 2013, 35, 73–78. [Google Scholar] [CrossRef]
- Xie, Y.; Yang, J.; Zhang, C.; Qu, T.; Fu, J.; Wang, S. Linking shear strength to granular skeleton state of continuously graded coarse-grained soils: Insights from discrete element modelling. Comput. Geotech. 2022, 146, 104750. [Google Scholar] [CrossRef]
- Zheng, G.; Zhang, X.; Zhang, T.; Sun, J.; Qiu, H.; Diao, Y. Numerical study on mechanical behavior and ultimate bearing capacity of shield segment joints under difffferent load conditions. Tunn. Undergr. Space Technol. Inc. Trenchless Technol. Res. 2023, 139, 105204. [Google Scholar] [CrossRef]
- Zuo, L.; Li, G.; Feng, K.; Ma, X.; Zhang, L.; Qiu, Y.; Cao, S.; Feng, L. Experimental analysis of mechanical behavior of segmental joint for gas pipeline shield tunnel under unfavorable compression-bending loads. Tunn. Undergr. Space Technol. 2018, 77, 227–236. [Google Scholar] [CrossRef]
- Chen, X.; Shen, J.; Bao, X.; Wu, X.; Tang, W.; Cui, H. A review of seismic resilience of shield tunnels. Tunn. Undergr. Space Technol. 2023, 136, 105075. [Google Scholar] [CrossRef]
- Shen, J.; Bao, X.; Chen, X.; Wu, X.; Cui, H. Prediction of Tunnel Earthquake Damage Based on a Combination Weighting Analysis Method. Symmetry 2022, 14, 1922. [Google Scholar] [CrossRef]
- Li, X.; Lin, X.; Zhu, H.; Wang, X.; Liu, Z. Condition assessment of shield tunnel using a new indicator: The tunnel serviceability index. Tunn. Undergr. Space Technol. 2017, 67, 98–106. [Google Scholar] [CrossRef]
- Chen, X.; Li, X.; Zhu, H. Condition evaluation of urban metro shield tunnels in Shanghai through multiple indicators multiple causes model combined with multiple regression method. Tunn. Undergr. Space Technol. 2019, 85, 170–181. [Google Scholar] [CrossRef]
- Shadabfar, M.; Mahsuli, M.; Zhang, Y.; Xue, Y.; Ayyub, B.M.; Huang, H.; Medina, R.A. Resilience-Based Design of Infrastructure: Review of Models, Methodologies, and Computational Tools. Asce-Asme J. Risk Uncertain. Eng. Syst. Part A-Civ. Eng. 2022, 8, 03121004. [Google Scholar] [CrossRef]
- Huang, H.; Zhang, D. Resilience analysis of shield tunnel lining under extreme surcharge: Characterization and field application. Tunn. Undergr. Space Technol. 2016, 51, 301–312. [Google Scholar] [CrossRef]
- Lin, X.; Chen, X.; Su, D.; Zhu, M.; Han, K.; Chen, R. Evaluation method for resilience of shield tunnel linings considering multiple disturbances and its application. Chin. J. Geotech. Eng. 2022, 44, 591–601. [Google Scholar]
- Lin, X.; Chen, X.; Su, D.; Han, K.; Zhu, M. An analytical model to evaluate the resilience of shield tunnel linings considering multistage disturbances and recoveries. Tunn. Undergr. Space Technol. 2022, 127, 104581. [Google Scholar] [CrossRef]
- Xu, H.; Li, T.; Xia, L.; Zhao, J.X.; Wang, D. Shaking table tests on seismic measures of a model mountain tunnel. Tunn. Undergr. Space Technol. 2016, 60, 197–209. [Google Scholar] [CrossRef]
- Dong, F.; Zhang, D.; Fang, Q.; Zhu, W.; Chen, L.; Tai, Q. Seismic Response Analysis of Large-Diameter Shield Tunnels Considering the Segment Joint Effect. Mod. Tunn. Technol. 2015, 52, 111–120. [Google Scholar] [CrossRef]
- Xu, H.; Li, T.; Xu, J.; Wang, Y. Dynamic Response of Underground Circular Lining Tunnels Subjected to Incident P Waves. Math. Probl. Eng. 2014, 2014, 1350026. [Google Scholar] [CrossRef]
- Liu, N.; Men, Y.; Peng, J.; Chu, C.; Liu, Y. Dynamic response of shield metro tunnel in earthquake load. Hydrogeol. Eng. Geol. 2010, 37, 58–62. [Google Scholar] [CrossRef]
- Wang, Q.; Geng, P.; Chen, C.; Chen, J.; He, C. Determination of seismic response of reinforced tunnel portal slope using shaking table tests. Tunn. Undergr. Space Technol. 2023, 136, 105072. [Google Scholar] [CrossRef]
- Zhu, M.; Chen, X.; Xia, C.; Wang, C.; Bao, X. Resilience evolution of shield tunnel structure under ground surcharge. Chin. J. Geotech. Eng. 2023, 15, 1547–1564. [Google Scholar]
- Zhang, Y.; Saadat, Y.; Huang, H.; Zhang, D.; Ayyub, B.M. Experimental study on deformational resilience of longitudinal joint in shield tunnel lining. Struct. Infrastruct. Eng. 2022, 2022, 1–12. [Google Scholar] [CrossRef]
- Ayyub, B.M. Systems Resilience for Multihazard Environments: Definition, Metrics, and Valuation for Decision Making. Risk Anal. 2014, 34, 340–355. [Google Scholar] [CrossRef] [PubMed]
- CJJ/T202-2013[S]; Technical Code for the Protection Structures of Urban Rail Transit. ChineseStandard GB/T: Beijing, China, 2014. (In Chinese)
- GB50446-2017; Code for Construction and Acceptance of Shield Tunnel. ChineseStandard GB/T: Beijing, China, 2008.
- Zhang, W.; Zhang, Q.; Cao, W. Study on Stress and Deformation of Bolt Joints of Shield Tunnel under Static and Seismic Action. Ksce J. Civ. Eng. 2021, 25, 3146–3159. [Google Scholar] [CrossRef]
- JGJ 82-20112011; Technical Pecification for High Strength Bolt Connections of Steel Structures. State Standard of the People’s Republic of China: Shanghai, China, 2011; p. 78.
- GB 50909-20142014; Code for Seismic Design of Urban Rail Transit Structures. State Standard of the People’s Republic of China: Shanghai, China, 2014; p. 185.
- GB50010-2010; Code for Design of Concrete Structures. State Standard of the People’s Republic of China: Shanghai, China, 2011; p. 133.
- Miao, Y.; Yao, E.L.; Ruan, B.; Zhuang, H.Y. Seismic response of shield tunnel subjected to spatially varying earthquake ground motions. Tunn. Undergr. Space Technol. 2018, 77, 216–226. [Google Scholar] [CrossRef]
- Shen, Y.Y.; Zhong, Z.L.; Li, L.Y.; Du, X.L.; El Naggar, M.H. Seismic response of soil-shield tunnel systems in sandwiched liquefiable soil deposits. Tunn. Undergr. Space Technol. 2023, 140, 105322. [Google Scholar] [CrossRef]
- Gao, F.; Zhao, F. Study on transformation method for artificial boundaries in static-dynamic analysis of underground structure. J. Vib. Shock. 2011, 30, 165–170. [Google Scholar]
- Liu, J.; Wang, Z.; Zhang, K.; Pei, Y. 3d finite element analysis of large dynamic machine foundation considering soil-structure interaction. Eng. Mech. 2002, 19, 34–38, 49. [Google Scholar]
- Liu, J.; Gu, Y.; Du, Y. Consistent viscous-spring artificial boundaries and viscous-spring boundary elements. Chin. J. Geotech. Eng. 2006, 28, 1070–1075. [Google Scholar]
- Gu, Y.; Liu, J.; Du, Y. 3D consistent viscous-spring artificial boundary and viscous-spring boundary elemen. Eng. Mech. 2007, 24, 31–37. (In Chinese) [Google Scholar]
- He, J.; Ma, H.; Zhang, B.; Chen, H. Method and realization of seismic motion input of viscous-spring boundary. J. Hydraul. Eng. 2010, 41, 960–969. [Google Scholar]
- Lu, Z.; Zhang, L.; Jiang, J.; You, C.; Zhong, X.; Feng, D.; Chen, S. Characteristic evaluation of passive seismic ellipticity method in urban shield tunnel. J. Appl. Geophys. 2023, 216, 105134. [Google Scholar] [CrossRef]
- Bao, X.; Li, P.; Cui, H.; Zhu, H. Dynamic Response of Complex Soft Clay due to Mero Tunnel Operation. Mod. Tunn. Technol. 2018, 55, 53–60. [Google Scholar]
- He, C.; Geng, P. Research on Practical Seismic Analysis Methods of Shield Tunnel. China J. Highw. Transp. 2020, 33, 15–25. [Google Scholar]
- He, C.; Li, L.; Zhang, J.; Geng, P.; Yan, Q. Seismic damage mechanism of tunnels through fault zones. Chin. J. Geotech. Eng. 2014, 36, 427–434. [Google Scholar]
- Zhou, Y.M.; Wang, J.W.; Yang, H. Resilience of Transportation Systems: Concepts and Comprehensive Review. IEEE Trans. Intell. Transp. Syst. 2019, 20, 4262–4276. [Google Scholar] [CrossRef]
- Amekudzi-Kennedy, A.; Singh, P.; Williams, E.; Cuadra, M.; Ashuri, B.; Woodall, B.; Garrett, A.; Tennakoon, M.; Clark, R.; Dheeraj, A. Developing Transportation Resilience Adaptively to Climate Change. Transp. Res. Rec. 2023, 2023, 03611981231186989. [Google Scholar] [CrossRef]
- Wang, N.X.; Wu, M.; Yuen, K.F. Assessment of port resilience using Bayesian network: A study of strategies to enhance readiness and response capacities. Reliab. Eng. Syst. Saf. 2023, 237, 109394. [Google Scholar] [CrossRef]
- Ren, H.; Rong, C.; Tian, Q.H.; Zhang, W.C.; Shao, D. Evaluation Model for Seismic Resilience of Urban Building Groups. Buildings 2023, 13, 2502. [Google Scholar] [CrossRef]
- Xu, H.; Li, T.; Li, L. Research on Dynamic Response of Underground Circular Lining Tunnel under the Action of P waves. Appl. Mech. Mater. 2011, 99–100, 181. [Google Scholar] [CrossRef]

Disclaimer/Publisher’s Note: The statements, opinions and data contained in all publications are solely those of the individual author(s) and contributor(s) and not of MDPI and/or the editor(s). MDPI and/or the editor(s) disclaim responsibility for any injury to people or property resulting from any ideas, methods, instructions or products referred to in the content. |
© 2023 by the authors. Licensee MDPI, Basel, Switzerland. This article is an open access article distributed under the terms and conditions of the Creative Commons Attribution (CC BY) license (https://creativecommons.org/licenses/by/4.0/).