Article

Climate Change Impact on Corrosion of Reinforced Concrete Bridges and Their Seismic Performance

1
Department of Civil, Environmental Engineering and Architecture, University of Cagliari, Via Marengo 2, 09123 Cagliari, Italy
2
Department of Civil and Industrial Engineering, Structural Division, University of Pisa, Largo Lucio Lazzarino, 56122 Pisa, Italy
*
Author to whom correspondence should be addressed.
Appl. Sci. 2024, 14(1), 60; https://doi.org/10.3390/app14010060
Submission received: 20 November 2023 / Revised: 14 December 2023 / Accepted: 15 December 2023 / Published: 20 December 2023
(This article belongs to the Special Issue Existing Bridges: From Inspection to Structural Rehabilitation)

Abstract

:
As a consequence of climate change impact, a significant variation in terms of temperature, atmospheric humidity, and carbon dioxide concentration levels is happening. This condition leads to several negative effects on the safety and the life cycle of existing concrete structures, such as the increase in the rate of material degradation, due to corrosion phenomena. In fact, the presence of carbonation and corrosion phenomena significantly influence the load-bearing capacity of existing reinforced concrete (RC) structures, under both static and dynamic loads. Among the wide range of existing RC constructions, bridges stand out for their importance. Furthermore, as structures directly exposed to the weather effects, they are more susceptible to these phenomena. In this paper, the influence of corrosion on existing RC motorway viaducts’ seismic behavior, considering the impact of climate change, is investigated, by means of an efficient procedure based on the implementation of 3D simplified finite element models and the use of analytical relations to obtain the amount of reduction in the steel reinforcement area as a function of the age of the bridge and of the different corrosion scenarios analyzed. Several scenarios for the expected variations in CO2 concentrations, temperature, and relative humidity are evaluated, considering that most of the viaducts present in the Italian motorway network were built between the 1960s and the 1970s. The results obtained using the projection of climate change impacts are compared with those calculated considering the corrosion scenarios resulting from the DuraCrete research project, to understand if the evolution of climate change leads to worse scenarios than those previously assessed.

1. Introduction

During the last few years, the attention paid to safety assessments of existing reinforced concrete (RC) viaducts has grown significantly, especially due to several collapses that involved this kind of structure [1,2,3,4,5]. One of the major causes that affects the load-bearing capacity of existing RC motorway viaducts, both in serviceability conditions and under extreme action, is the corrosion of the piers’ steel reinforcement, which can be due to carbonation or the presence of chlorides [6,7,8]. In fact, among the different types of degradation of RC constructions, corrosion of the steel rebar is the most usual one, considering that all the main structural elements of RC bridges are subjected to the same environmental conditions at the construction site. Moreover, the intensification of environmental pollution and the impacts of climate change have influenced the continuous evolution of corrosion phenomena, as demonstrated by several research works developed in recent years [9,10,11,12,13]. In particular, the effects of climate change are currently considered and studied in an international context, using several models. It is well-known how rainstorms or tropical cyclones significantly influence the structural stability of motorway bridges and viaducts, especially if these are characterized by reduced spans, due to possible erosion phenomena or the presence of additional actions [14,15].
Considering that the above-described corrosion effects act on the steel reinforcement of the concrete structural elements of existing RC bridges and viaducts, it is possible to highlight that the carbonation effects mainly affect the piers, while the presence of chlorides mainly affects the deck, particularly if de-icing salts are used. Therefore, the safety level and the related structural behavior of existing RC viaducts are strictly influenced by the possible presence of corrosion phenomena, under both static and dynamic loads.
Focusing the attention on the Italian motorway networks, it is important to note that most of the RC bridges were designed and built between the 1960s and the 1970s, without considering seismic actions. Consequently, taking into account the ageing issues and the actual seismic loads defined by the Italian Building Code [16], a correct scheduling of appropriate maintenance interventions is required. For this reason, maintenance and visual inspections are the key actions, in order to prevent bridge collapses [17,18,19]. Moreover, the growing use of structural health monitoring (SHM) techniques is fundamental, to be able to evaluate the maintenance states of existing RC bridges over time [20,21,22].
According to the development of the recent international design codes, different methods have been proposed to assess the seismic performance of existing RC structures. One of the most widely used approaches is the pushover analysis [23,24], considering the increase in the use of non-linear techniques. However, the application of this method is quite limited for constructions whose dynamic behavior is defined by a predominant translational vibration mode. Another approach used in recent decades is the non-linear time history analysis (NTHA), but it is characterized by different critical aspects, especially if applied to structures that are very developed in length and which cross different geomorphological conditions. Furthermore, this type of analysis is characterized by high levels of computational effort, and, for these reasons, this approach is not commonly used by designers. In recent years, different research groups have developed several types of fragility curves to obtain results regarding the seismic behavior of existing RC viaducts [25,26,27,28,29]. Another method, widely used in recent decades, is incremental dynamic analysis (IDA), as presented in [30].
In the first decades of the 2000s, refs. [31,32] extended the application of modal pushover analysis (MPA) to the assessment of the seismic vulnerability of reinforced concrete bridges. This approach, developed in [33,34], was initially applied to the determination of the seismic behavior of unsymmetrical-plan constructions. Basically, this approach is a development of response spectrum analysis (RSA), which is used to evaluate the seismic behavior of irregular buildings characterized by a dynamic behavior not governed by one vibration mode with a high participating mass, and, consequently, the contribution of the higher modes is not negligible.
As described in [35,36,37,38], the RC viaducts present in the Italian motorway network are also characterized by a dynamic behavior which cannot be defined by one vibration mode. Therefore, the evaluation of their correct dynamic behavior still represents an important civil engineering issue, as in the case of long or multi span viaducts with cantilever or frame piers and elastomeric bearings. In the presence of this type of structure, the standard pushover analysis is not a suitable approach. Moreover, corrosion effects significantly influence the dynamic behavior of existing RC bridges, due to the piers’ stiffness and strength reductions.
The present paper analyzes the impacts of climate change (in terms of the increase in temperature and the variation in relative humidity), which influence the development of corrosion phenomena due to carbonation, on the seismic performance of existing RC viaducts. A method of investigation for RC bridges is proposed, based on the literature models that relate the variation in climate parameters to corrosion processes induced by carbonation, taking as a benchmark a real case study: an existing RC viaduct of the Italian motorway network, built around the 1970s and located in the province of Massa-Carrara.
The paper is organized as follows: in Section 2, the climate model projections are described in detail, highlighting the relation with the development of the corrosion effects due to carbonation. In Section 3, the proposed structural modelling approach is explained, also considering the evaluation of the carbonation phenomenon, expressed as the reduction in pier steel reinforcements. Section 4 reports the use of the proposed method on the chosen viaduct, where its seismic performance is defined through appropriate risk indices, obtained as the ratio between the peak ground acceleration, which leads to the collapse of the first monitored structural element (PGAC), and the design peak ground acceleration (PGAD), evaluated as reported in [16], as well as the related return periods (RPC and RPD). Finally, in Section 5, some concluding remarks are drawn.

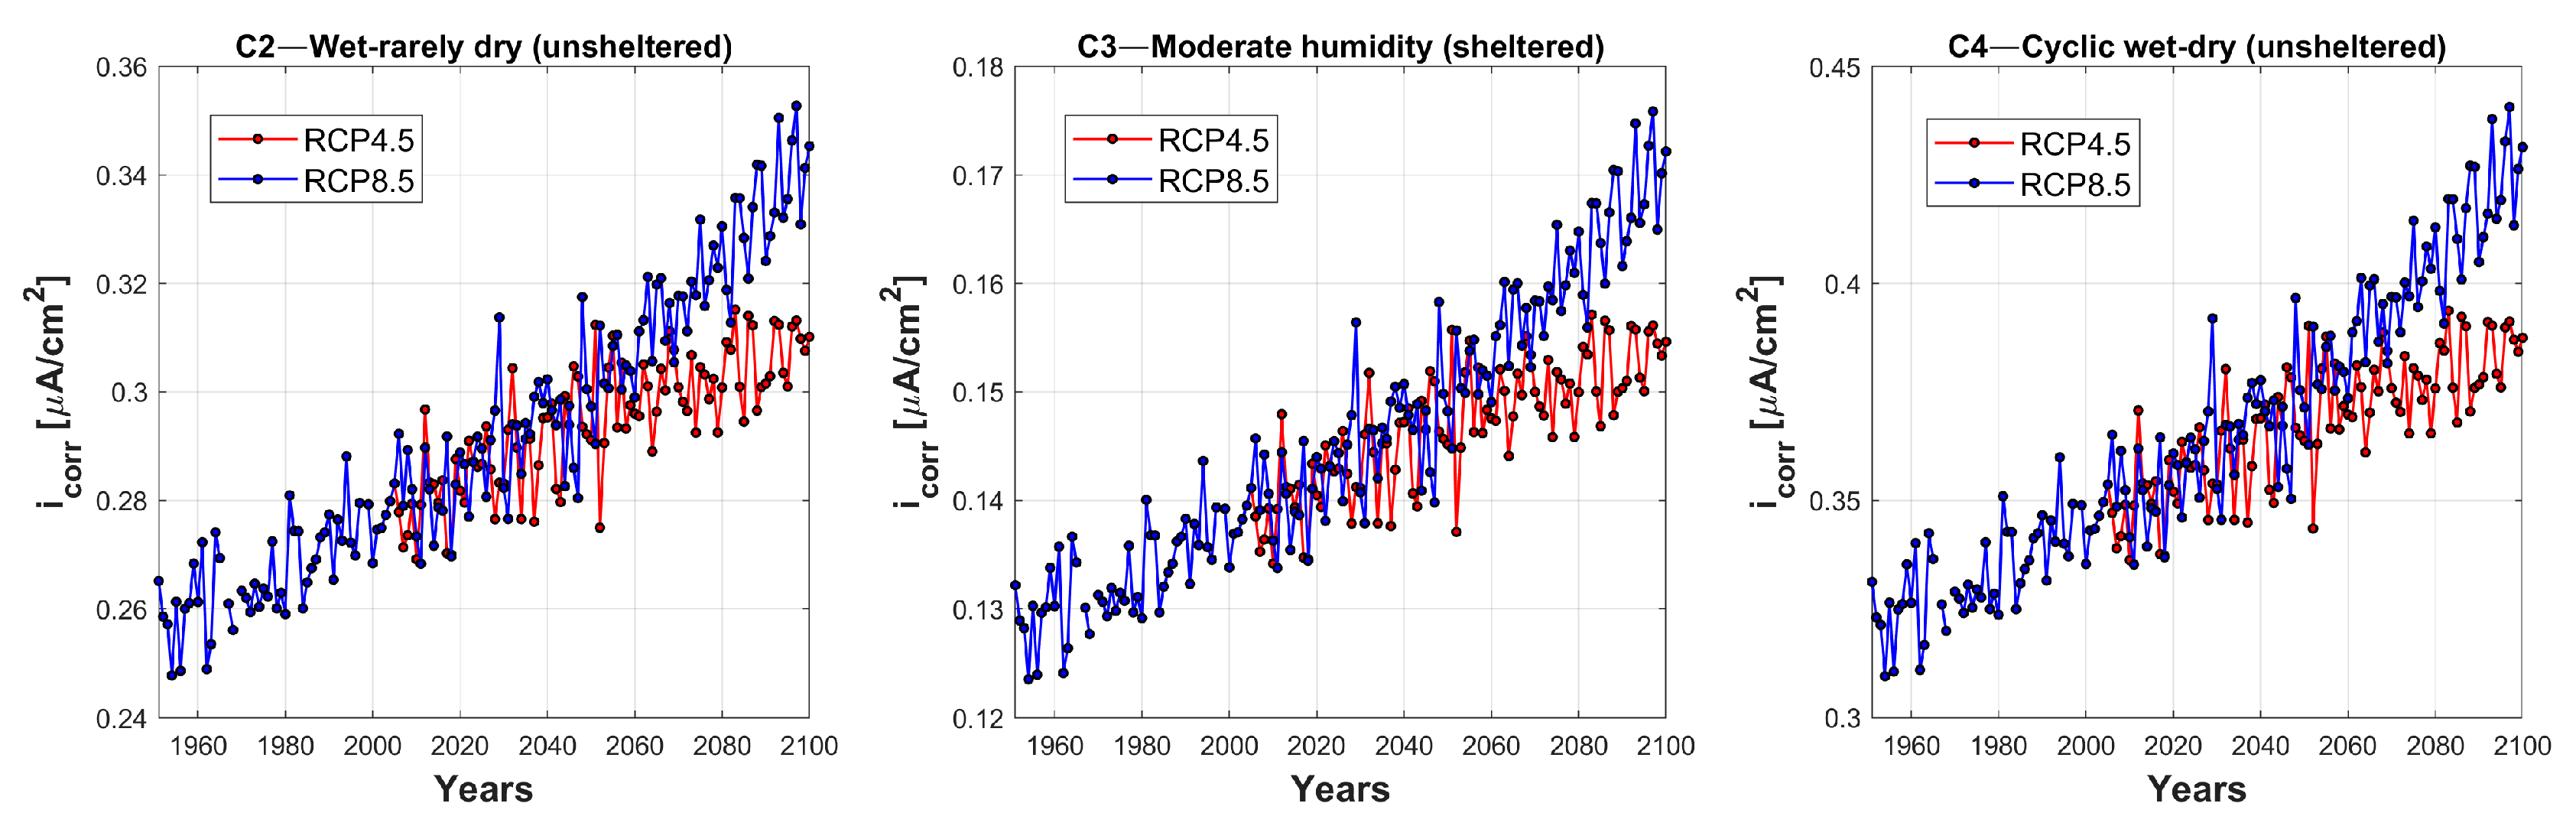
2. Climate Change’s Impact on the Corrosion Rate

As highlighted in [39,40,41], the durability and reliability of RC bridges are significantly affected by climate change, which involves variations in three fundamental environmental parameters: (i) temperature, (ii) relative humidity, and (iii) CO2 (carbon dioxide) concentration levels. In this research work, the attention is focused on the variation in temperature due to climate change and its influence on the evolution of the mean corrosion current density icorr [42].
The evaluation of future climate evolution is based on several assumptions regarding future trends in socio-economic dynamics, future concentrations of greenhouse gasses, and variations in land use and land cover, which determine an increase in radiative forcing, as the variation in the energy flux in the year 2100 will be equal to 2.6, 4.5, 6.0, and 8.5 W/m2, in comparison with the values of the pre-industrial era. From this, we can define the representative concentration pathways (RCP), as reported in [43]. Two main scenarios are considered in climate risk studies [44,45,46,47]: (i) RCP4.5 and (ii) RCP8.5. According to the last IPCC (Intergovernmental Panel on Climate Change) report [48], an average increase in global mean surface air temperature of 2.7 °C and 4.4 °C is expected at the end of the century (in the period of 2081–2100) for RCP4.5 and RCP8.5 scenarios, respectively. In fact, for these two scenarios, several climate projections can be found in current literature and, for this reason, have been adopted in this research work, considering that they correspond to medium and maximum pathways. The expected variation in the climate parameters is evaluated through the analysis of obtained climate projections, considering high-resolution regional climate models run according to RCP4.5 and RCP8.5, provided by the EURO-CORDEX project [47]. It is important to notice that only a limited number of climate projections are available, and, for this reason, it is useful to evaluate the increase in temperature over time using a probabilistic approach based on weather generation techniques, such as suggested in [49].
As mentioned in Section 1, the temperature variation over the years due to climate change is strictly linked to the increase in the corrosion rate of steel reinforcements, following the model developed by [43]:
i c o r r t = i c o r r , 20 1 + 0.025 ( T t 20 )   f o r   T t < 20 ° C i c o r r t = i c o r r , 20 1 + 0.073 ( T t 20 )   f o r   T t > 20 ° C
where icorr,20 represents the value of the mean corrosion current density at 20 °C, which is strictly related to environmental exposure. Focusing attention on the location of the investigated RC bridge, i.e., Massa-Carrara (longitude: 10.141; latitude: 44.025), an ensemble of climate projections of daily temperatures is extracted from the Copernicus Data Store and combined with the available observations at the closest weather station. In fact, climate models provide gridded data, which are always characterized by a different resolution from point observations, and there is a need to bridge this scale gap to use these data in engineering applications [50]. Among the different calibration strategies [51], the delta change approach is adopted, and the time series of future temperatures are evaluated by adding, to the observed time series at the weather station, the climate change signal derived from the analysis of climate projections [52].
Figure 1a shows the resulting trend of yearly average temperatures at the investigated location, while in Figure 1b the related percentage increase in corrosion rate is reported. The variation in corrosion rate up to 14% is expected at the end of the century, when taking into account only yearly variation, but even higher changes are expected when daily variations are considered in the analysis [42].
The reference values of icorr,20 is reported in [53,54], depending on the exposure of the structural elements. The corrosion rate icorr,20 values, equal to 0.172, 0.345, and 0.431 μA/cm2, are given in [53] for the following exposure classes: C2—wet/rarely dry (unsheltered); C3—moderate humidity (sheltered); and C4—cyclically wet–dry (unsheltered), respectively. Starting from these values, the variation in icorr as a function of time is evaluated and illustrated in Figure 2.
Different outcomes are obtained when considering the icorr,20 reference values reported in [54] for low, moderate, and high corrosion scenarios (0.1, 1, and 5 μA/cm2) as highlighted by the variations illustrated in Figure 3.
Another widely used model used to evaluate the effect of temperature variation on corrosion rate is obtained by starting from the well-known Arrhenius law [9], defined by the following Equation (2):
i c o r r t = i c o r r , 20 exp E R 1 293 1 273 + T t ,
where E indicates the activation energy of the diffusion process equal to 40 kJ/mol and R represents the gas constant (8.314 × 10⁻³ kJ/mol K). Considering this approach, which is also adopted in the model code for service life design [55], the obtained percentage of variation is greater than the previous one, showing an increase of up to 30% at the end of the century when yearly variations are considered (Figure 4). The associated icorr values and their variation over time, which can be compared with those given in Figure 2 and Figure 3, are shown in Figure 5 and Figure 6.
For this reason, only the variation in mean corrosion current density (icorr) with time evaluated, taking into account the same reference value, icorr,20, given in [53,54], is considered in this work.

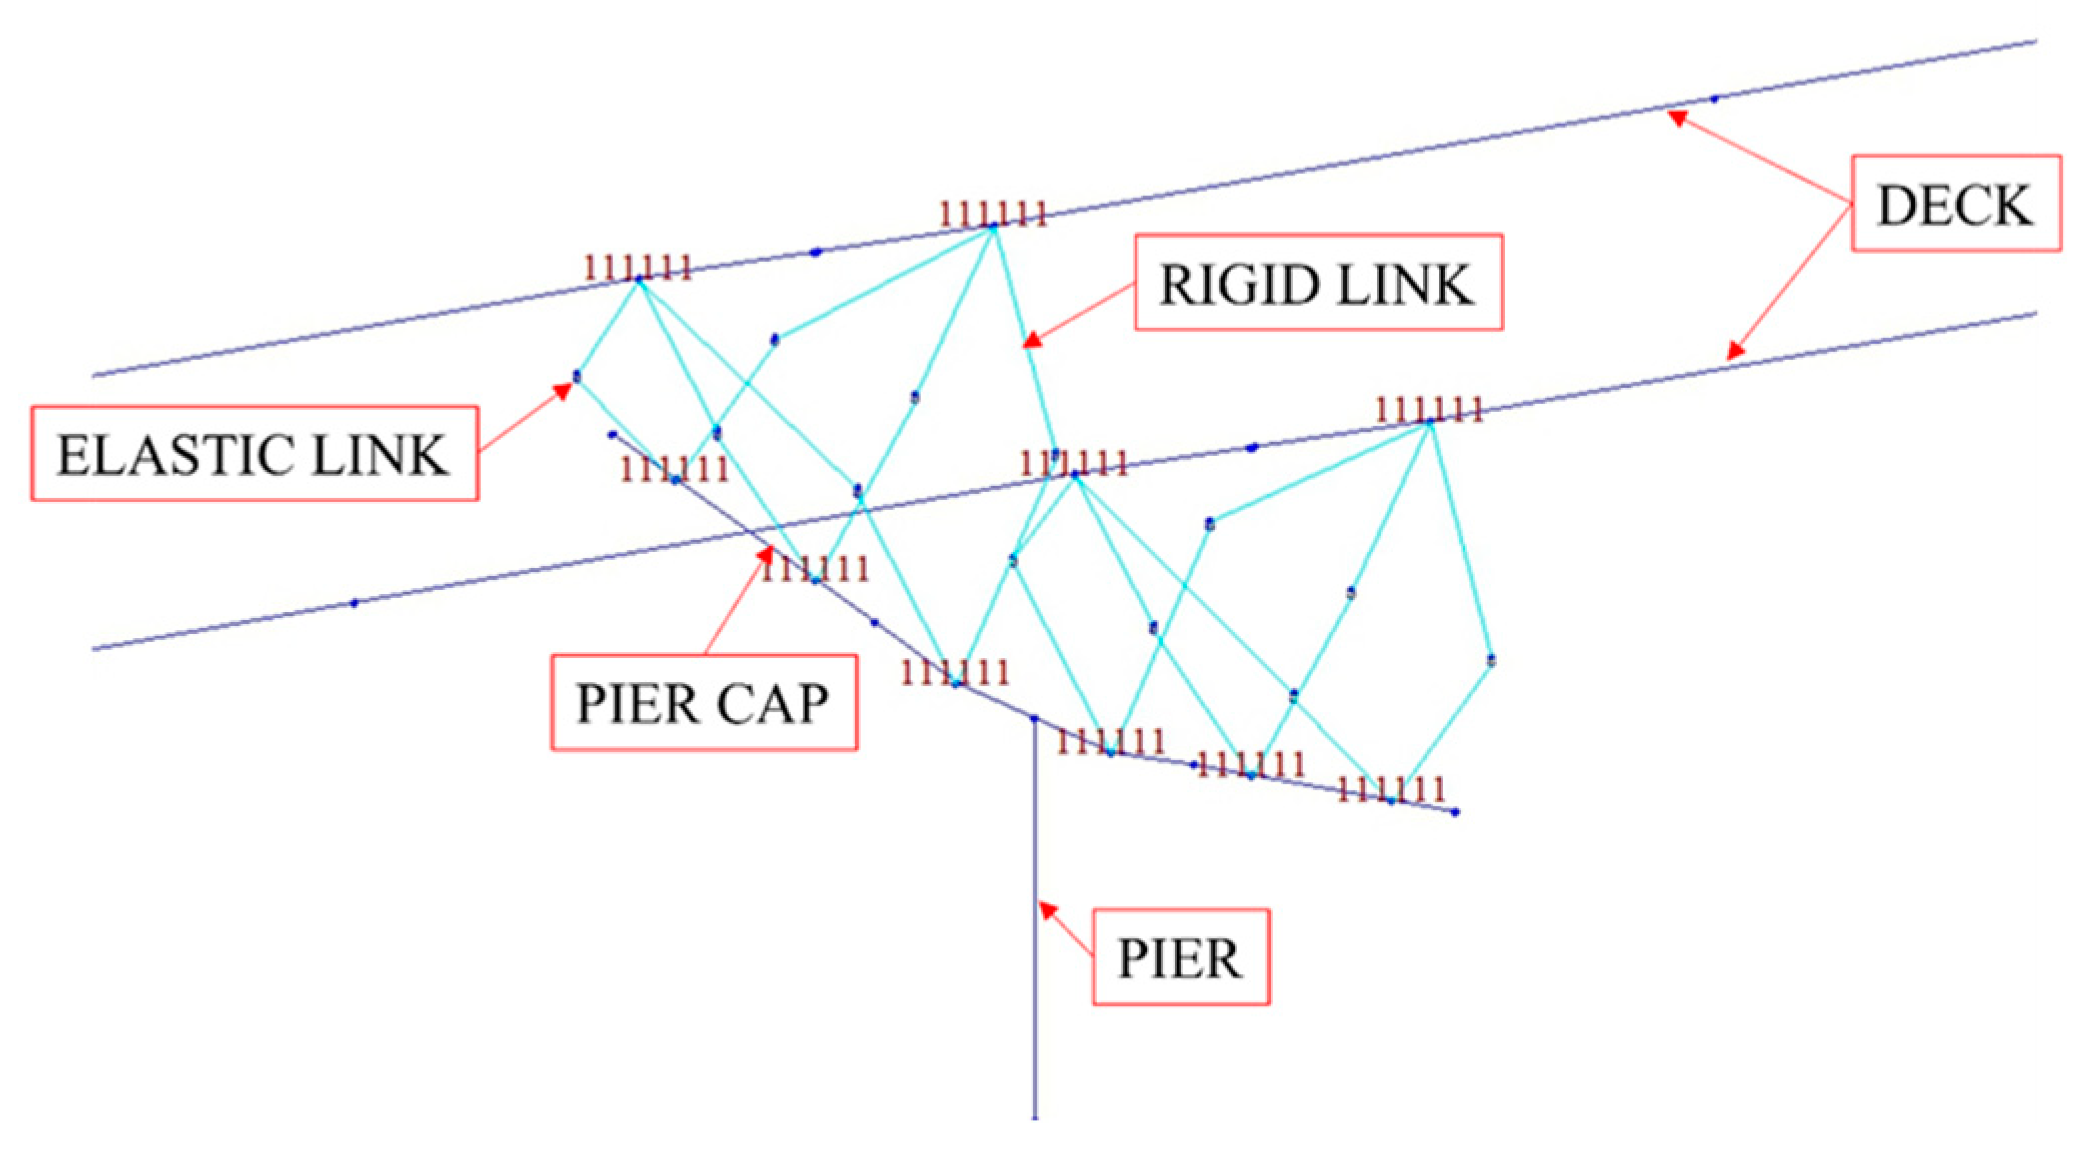
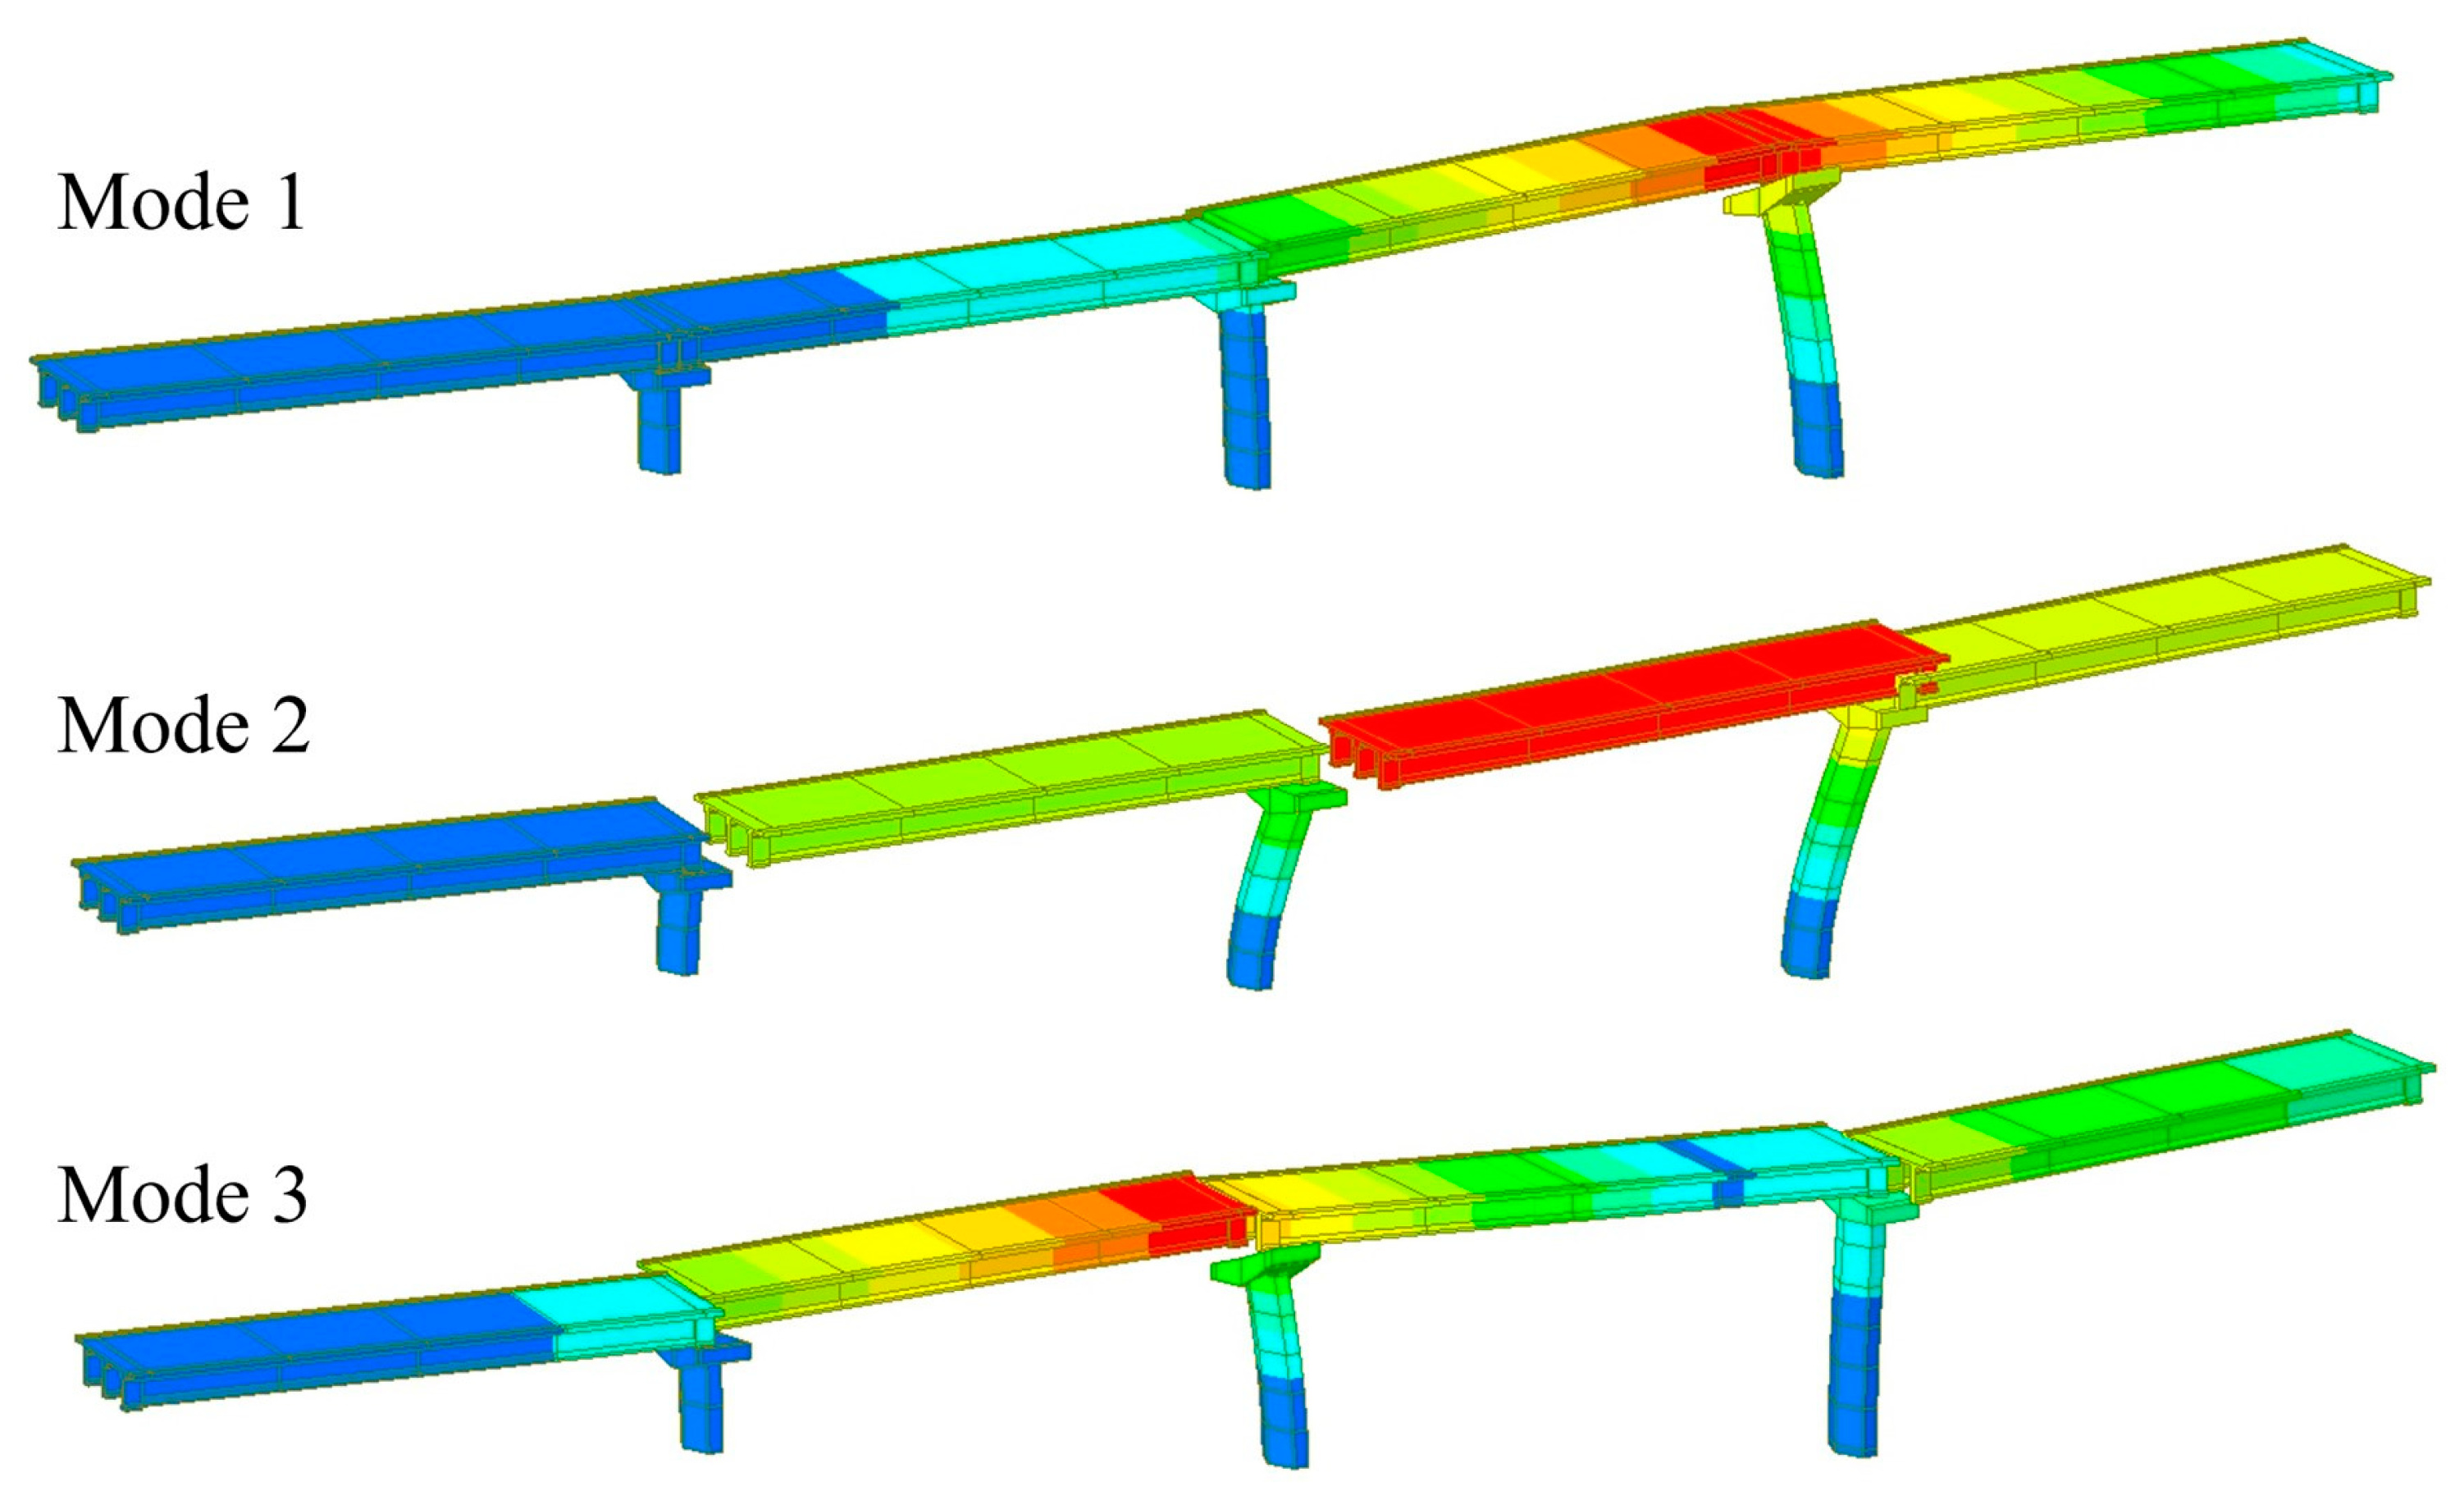
3. Structural Modelling and Analysis Method

To assess the seismic vulnerability of existing RC viaducts in the presence of corrosion of the steel reinforcement due to carbonation, the structural modelling approach described in [56] is used. This method starts with the realization of simplified 3D FEMs (finite element models) by means of the MIDAS Civil 2023 commercial software [57], using only Timoshenko beam elements to implement the main structural elements, such as the deck, the pier caps, and the piers, in order to optimize the computational effort, while the elastomeric bearings are modelled using elastic links characterized by rotational and translational stiffnesses, evaluated as reported in [58]. The connection between the previously mentioned elastic links and the beam elements of the deck and the pier caps is realized by means of rigid links (Figure 7). In order to obtain the correct dynamic behavior of this type of structure, a reduction in the piers’ bending stiffness is introduced by means of appropriate scale factors, considering the main points which define the moment–curvature (M–χ) diagram of the piers’ gross-sections, applied to the concrete cross-section elastic stiffness, which characterizes the piers of the viaduct, using the relation reported in [59]. The stiffness which characterizes the deck, instead, is not reduced, as this remains within the elastic range when the viaduct is subjected to a seismic event [60,61].
The pier foundations and the abutment are not implemented in the FEM but are modelled as perfect restraints, applied at the node located at the bottom end of the pier and at the nodes representing the base of the elastomeric bearings present in the abutment–deck interface, respectively.
The presence of the deck pavement and guard rails (non-structural elements) is introduced in the FEM by means of uniform distributed loads applied, in correspondence with the beam elements representing the deck. Also, the presence of the deck cross beams is added through the application of nodal loads to the beam elements representing the deck, in correspondence with their position along the deck’s longitudinal axis. The traffic load is not considered in this work, according to the method reported in [16].
For each pier, two collapse mechanisms are evaluated: (i) the ductile and (ii) the brittle collapse mechanism. In particular, the first failure mechanism is governed by the trend of the M–χ diagram, which characterizes the pier gross-section and presents a large strain-hardening plastic behavior, which follows an initial elastic branch; the second failure mechanism is defined by a load–displacement diagram having a linear behavior, until the ultimate shear strength of the monitored structural element is reached. It is important to highlight that the first failure mechanism is governed by the rotational capacity of the monitored plastic hinge. The development of the second failure mechanism depends on the pier shear strength.
To introduce the non-linear behavior of the materials, two different constitutive laws are adopted: the Kent and Park model [62] and Park strain hardening [63] model, for concrete and steel reinforcement, respectively.
Considering the first ductile failure mechanism, the verification criteria adopted is the achievement of ¾ of the ultimate rotation, θu, while the brittle collapse mechanism is the overcoming of the shear strength of the considered pier, evaluated using the cyclic shear resistance method proposed by [64].
The corrosion effects are implemented in the FEM using an analytical model that describes the evolution of the reduction of the steel reinforcement diameter. Basically, in this approach, the corrosion penetration in a generic concrete volume is described by a parabolic law, as follows:
s = k · t 1 n ,
where s is the carbonated concrete layer thickness, k represents the penetration rate coefficient, and t indicates the time. Considering that the analyzed viaduct was built in the 1970s, n = 2 can be fixed, considering that it was built using normal compacted concrete [65]. The steel reinforcement reduction diameter and area are calculated using Equations (4) and (5), respectively:
d t = d 0 2 P t = d 0 2 i c o r r k ( t t i ) ,
A s t = π d 0 2 i c o r r k ( t t i ) 2 / 4 ,
where d0 is the initial diameter of the steel reinforcement and ti is the time of corrosion initiation.
Equation (4) explains the variation over time of the steel reinforcement diameter d, which depends on the corrosion penetration P(t). Equation (5), instead, regulates the related variation over time of the cross-section area of the steel rebar.
In this work, three different corrosion levels are considered, following the indications reported in [53,54] and discussed in the previous Section: (i) slight, (ii) moderate, and (iii) high. For each analyzed corrosion level, two different assumptions were made, to obtain the icorr,20 value. The first assumption is based on [53], where icorr,20 values equal to 0.172 μA/cm2, 0.345 μA/cm2, and 0.431 μA/cm2 represent slight, moderate, and high corrosion scenarios, respectively. In the second assumption, the icorr,20 values are estimated considering the indications reported in [54]. In this case, icorr,20 values equal to 0.1 μA/cm2, 1 μA/cm2, and 5 μA/cm2 represent slight, moderate, and high corrosion levels.
The variation over time of the steel reinforcement diameter is evaluated by considering the difference between d0, which represents the initial diameter, and d(t), which indicates the diameter calculated at the time t, which is obtained using the corrosion effects. It can be highlighted that the variation of the steel reinforcement diameter depends on the initiation time (ti), considered to be a random variable, and on the mean corrosion current density (icorr) value, which is evaluated, in this work, by considering the previously discussed different assumptions reported in [53,54]. With an initial value of concrete cover thickness equal to 25 cm, the procedure is repeated iteratively using different values of concrete cover thickness. The other parameters considered constant are illustrated in Table 1, where fck is the concrete compressive strength, k is the penetration rate coefficient, εu,0 is the steel ultimate deformation, w/c is water/cement ratio, and ti is the initiation time.
The effects of corrosion processes over time are calculated with the following time steps: when the bridge was built, and 13.5 years, 50 years, 75 years, and 100 years after its construction. To obtain the seismic performance of the viaduct considering the above-mentioned time steps, a multi-modal pushover analysis is performed, using the capacity spectrum method (CSM) to determine the performance point [66,67]. For each vibration mode, with a participating mass at least equal to 1%, a capacity curve is calculated using the related modal load profile. The performance point defined by each curve is obtained using the seismic demand spectrum. Consequently, the internal actions acting on each pier of the viaduct are calculated, with regard to the performance point evaluated by means of the intersection between the above-mentioned demand spectrum and the capacity curve in the ADRS plane. The obtained internal actions are combined by means of the CQC (complete quadratic combination) rule, in order to perform the structural checks.

4. Case Study

As mentioned before, the approach illustrated in detail in Section 3 is applied to a viaduct built in Northern Italy in the 1970s in the Massa-Carrara province. The fundamental seismic hazard parameters of the site where the viaduct is located are the following: soil type C and a PGA equal to 0.156 g.
The viaduct is made by two adjacent carriageways, which are independent due to the presence of a continuous longitudinal joint, and it is characterized by the presence of four simply supported spans, measuring 40.40 m in length. The planimetric and altimetric layout is rectilinear, as shown in Figure 8. The roadway presents an overall width equal to 9.86 m, and the spans are made of a precast concrete girder, composed of three longitudinal pre-stressed I beams with five transverse beams. The structure of the deck is a concrete slab with a thickness equal to 20 cm. The span is characterized by the presence of 3 × 2 elastomeric bearings placed in the pier cap. The deck is supported by three hexagonal hollow RC piers, whose main characteristics are reported in Table 2.
Table 3 reports the most important characteristics of the viaduct.
The first three fundamental natural periods which characterize the dynamic behavior of the viaduct are: T1 = 2.73 s, T2 = 2.56 s, and T3 = 2.41 s. Figure 9 reports the vibration mode shapes related to the above-mentioned first three natural periods.
In Table 4 and Table 5, the results of the corrosion effects are expressed in terms of longitudinal rebars, and the stirrups’ diameters and area variations are reported, considering the icorr,20 values calculated using the assumptions presented in [53,54], for the different time steps mentioned in Section 3. The variation in the steel ultimate deformation (εu,0) is calculated by means of the relation proposed by [68].
Considering the results reported in Table 4 and Table 5, it is important to recall that the corrosion effects begin to develop 13.5 years after the bridge is built and, consequently, before this point, no steel reinforcement reduction diameter is present. Taking into account the results obtained using the assumptions reported in [53] related to the evaluation of icorr values, the variation of the steel reinforcement diameter leads to the values of area reduction always being less than 9%, even considering the time step of 100 years after the building of the viaduct.
Instead, considering the results obtained for the icorr values suggested by [54] for the three analyzed corrosion scenarios, a significant reduction in steel reinforcement area occurs 50 years after the construction of the viaduct, in the high corrosion scenario. Focusing on the stirrups, these appear to be completely corroded after 100 years of the viaduct’s service life, with a high corrosion level.
Moreover, the presence of corrosion effects influences the dynamic behavior of the viaduct, due to the reduction in the pier stiffness as a function of the age of the viaduct. In fact, considering the icorr values proposed by [54], it is possible to observe a slight increase in the first fundamental natural periods, which characterize the dynamic behavior of the viaduct. On the contrary, due to the limited values of steel reinforcement diameter obtained for each corrosion scenario analyzed 100 years after the viaduct was built, this fact does not occur when using the icorr values proposed by [53].
As mentioned in Section 3, to investigate the seismic performance of the viaduct, several multi-modal analyses were carried out, through an iterative process based on an increasing demand spectrum until the required limit state is reached, to evaluate the peak ground acceleration, which leads to the failure of the first monitored structural element (PGAC) and its related return period (RPC). Starting from these values, the assessment of the seismic performance of the viaduct is defined by means of appropriate indicators, called risk indices, calculated as the ratio between PGAC and the design peak ground acceleration (PGAD), which is obtained as reported in [16], and as the ratio between the associated return periods:
R I P G A = P G A C P G A D ,
R I R P = R P C R P D ,
Risk index values close to or greater than one indicate a structure characterized by an adequate safety level. On the contrary, risk indices less than one define structures that are not adequate for the seismic loads defined by [16]. The results obtained, expressed in terms of the above-defined risk indices, are reported in Table 6 and Table 7, considering again the icorr values suggested by [53,54], respectively, both for ductile and brittle collapse mechanisms and where X indicated the direction along the longitudinal axis of the viaduct and Y the transverse one.
According to the considerations about the longitudinal steel reinforcement and stirrups area reduction, the decrease in the risk index values is more significant for the moderate and high corrosion levels, considering the icorr values proposed by [54]. It is possible to highlight that, 100 years after the construction of the viaduct, the variation of the risk indices reaches values equal to 90%, in terms of reduction (as is possible to observe for the brittle failure mechanism considering the Y direction), with respect to the initial value (0–13.5 years). Also, considering the results obtained for the moderate corrosion scenario after 100 years of the viaduct’s service life, it is possible to observe an important reduction (greater than 75%) of the risk index value calculated for the brittle collapse mechanism in the Y direction. Another significant reduction, in terms of risk index values, can be observed after 75 years of the viaduct’s service life for the moderate and high corrosion levels.
The results presented above consider the constant reference values of icorr = icorr,20 and can be used to assess the impact of global warming on seismic risk when higher corrosion rates are expected (see Section 2).
The range of values of icorr for the location of the bridge in Section 2, as predicted for moderate and high exposure, are 0.12–0.18 μA/cm2 and 0.31–0.45 μA/cm2, when the reference values are taken from [53] and 0.75–1 μA/cm2 and 3.8–5 μA/cm2 when the reference values are taken from [54].
Focusing attention on the risk index for the brittle mechanism in the Y direction, RIPGA, these expected changes in corrosion rates could lead to significant variations in seismic risk indices, as shown by the shaded colored areas in Figure 10, when reference values from [53] are considered.

5. Conclusions

In this paper a procedure for the assessment of the seismic performance of an existing RC viaduct located in the Massa-Carrara province, when subjected to different corrosion scenarios and considering the age of the structure. In particular, the impact of global warming on the evolution of corrosion phenomena due to carbonation is discussed, considering available climate projections and future emission scenarios. Three different corrosion levels were investigated: (i) slight, (ii) moderate, and (iii) high; these were characterized by different values of mean corrosion current density (icorr). Moreover, the values of icorr obtained from the DuraCrete research work were considered, in order to evaluate the difference between these values and those obtained using the climate change impact model prediction. To assess the seismic vulnerability of the viaduct, an efficient methodology, based on the implementation of simplified 3D finite element models, was used, taking into account ductile and brittle failure mechanisms. The analyses were carried out using different time steps: at the time of construction of the viaduct and after 13.5, 50, 75 and 100 years of its service life. This was undertaken in order to look at the evolution of the effects of corrosion as a function of the age of the structure, expressed in terms of the reduction in longitudinal and transverse steel reinforcement area by means of an analytical model.
The results obtained are reported using appropriate risk indices, defined as the ratio between the peak ground acceleration, which leads to the collapse of the first monitored pier (PGAC), and the design peak ground acceleration (PGAD), calculated as reported in the Italian Design Code, and as the ratio of the related return periods (RPC and RPD).
The following points can be observed from the obtained results:
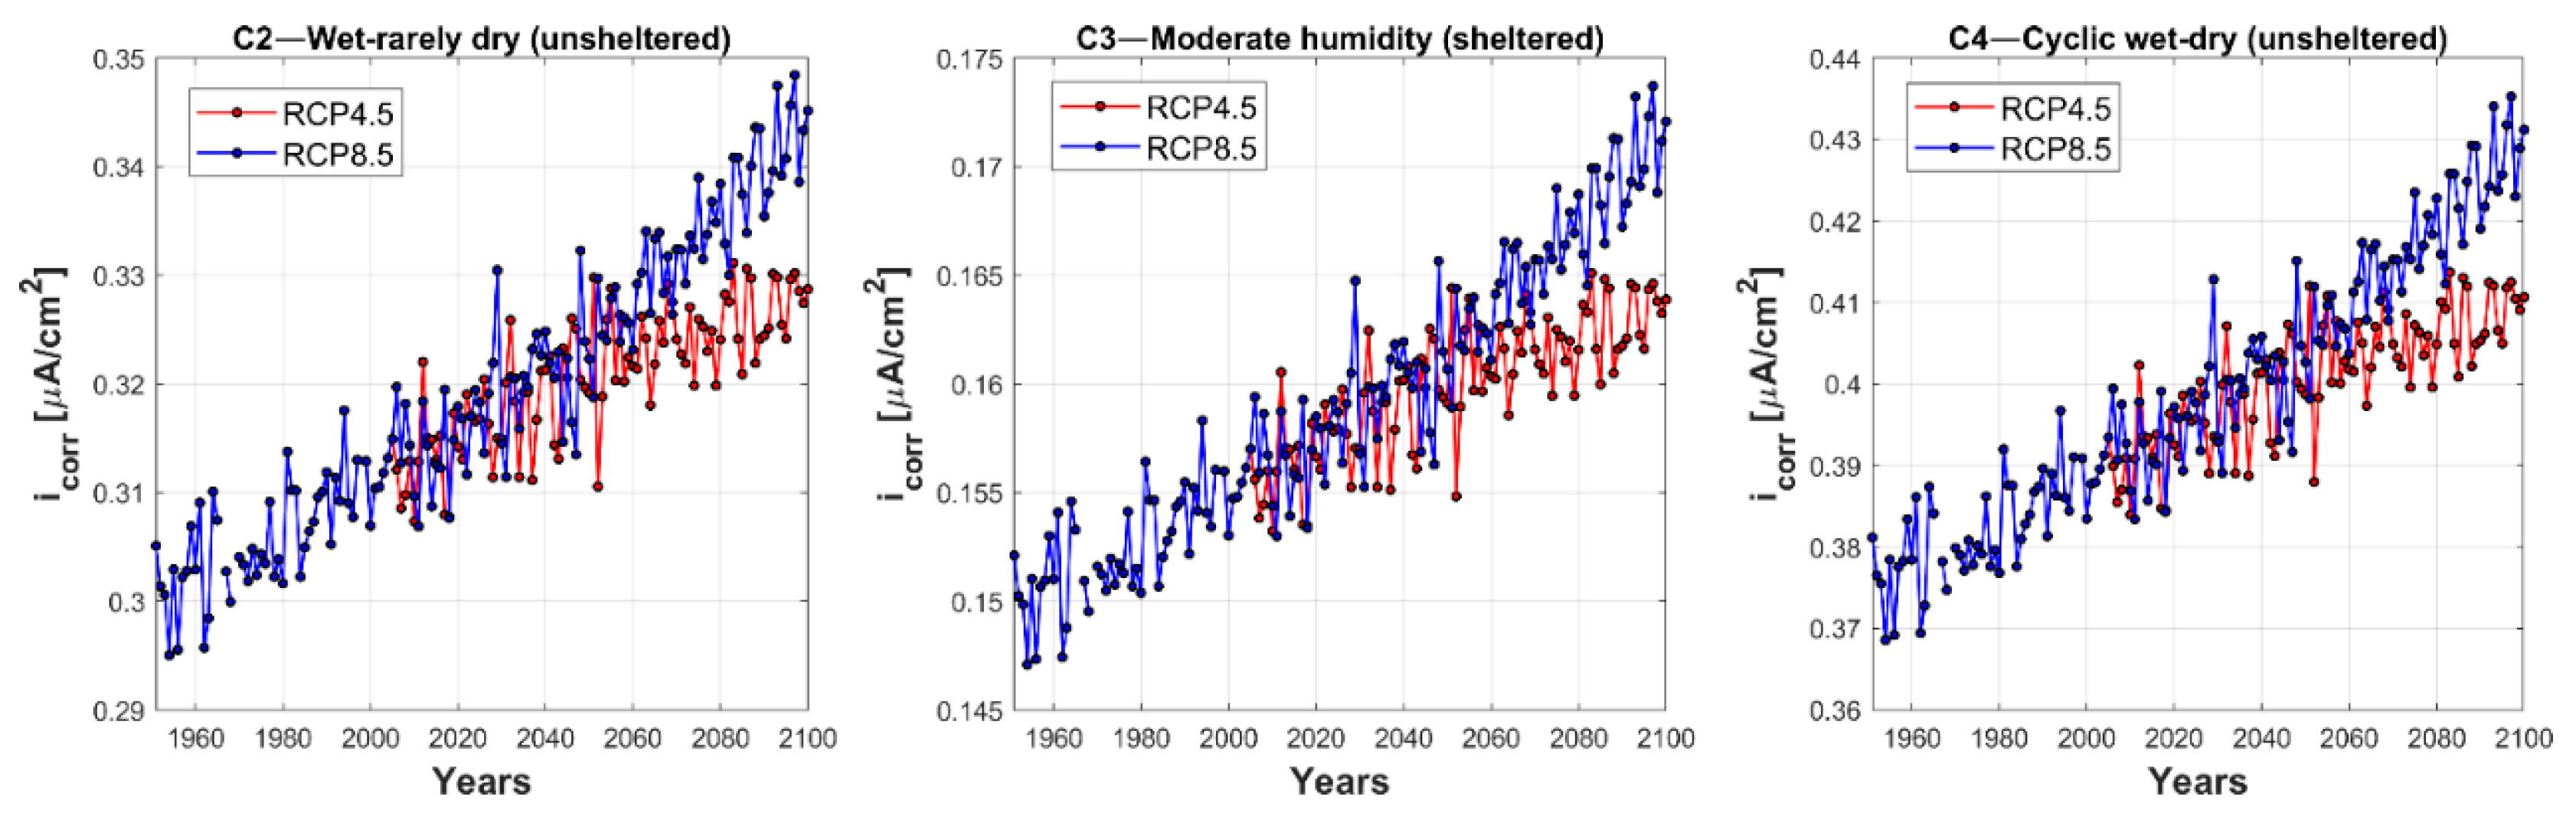
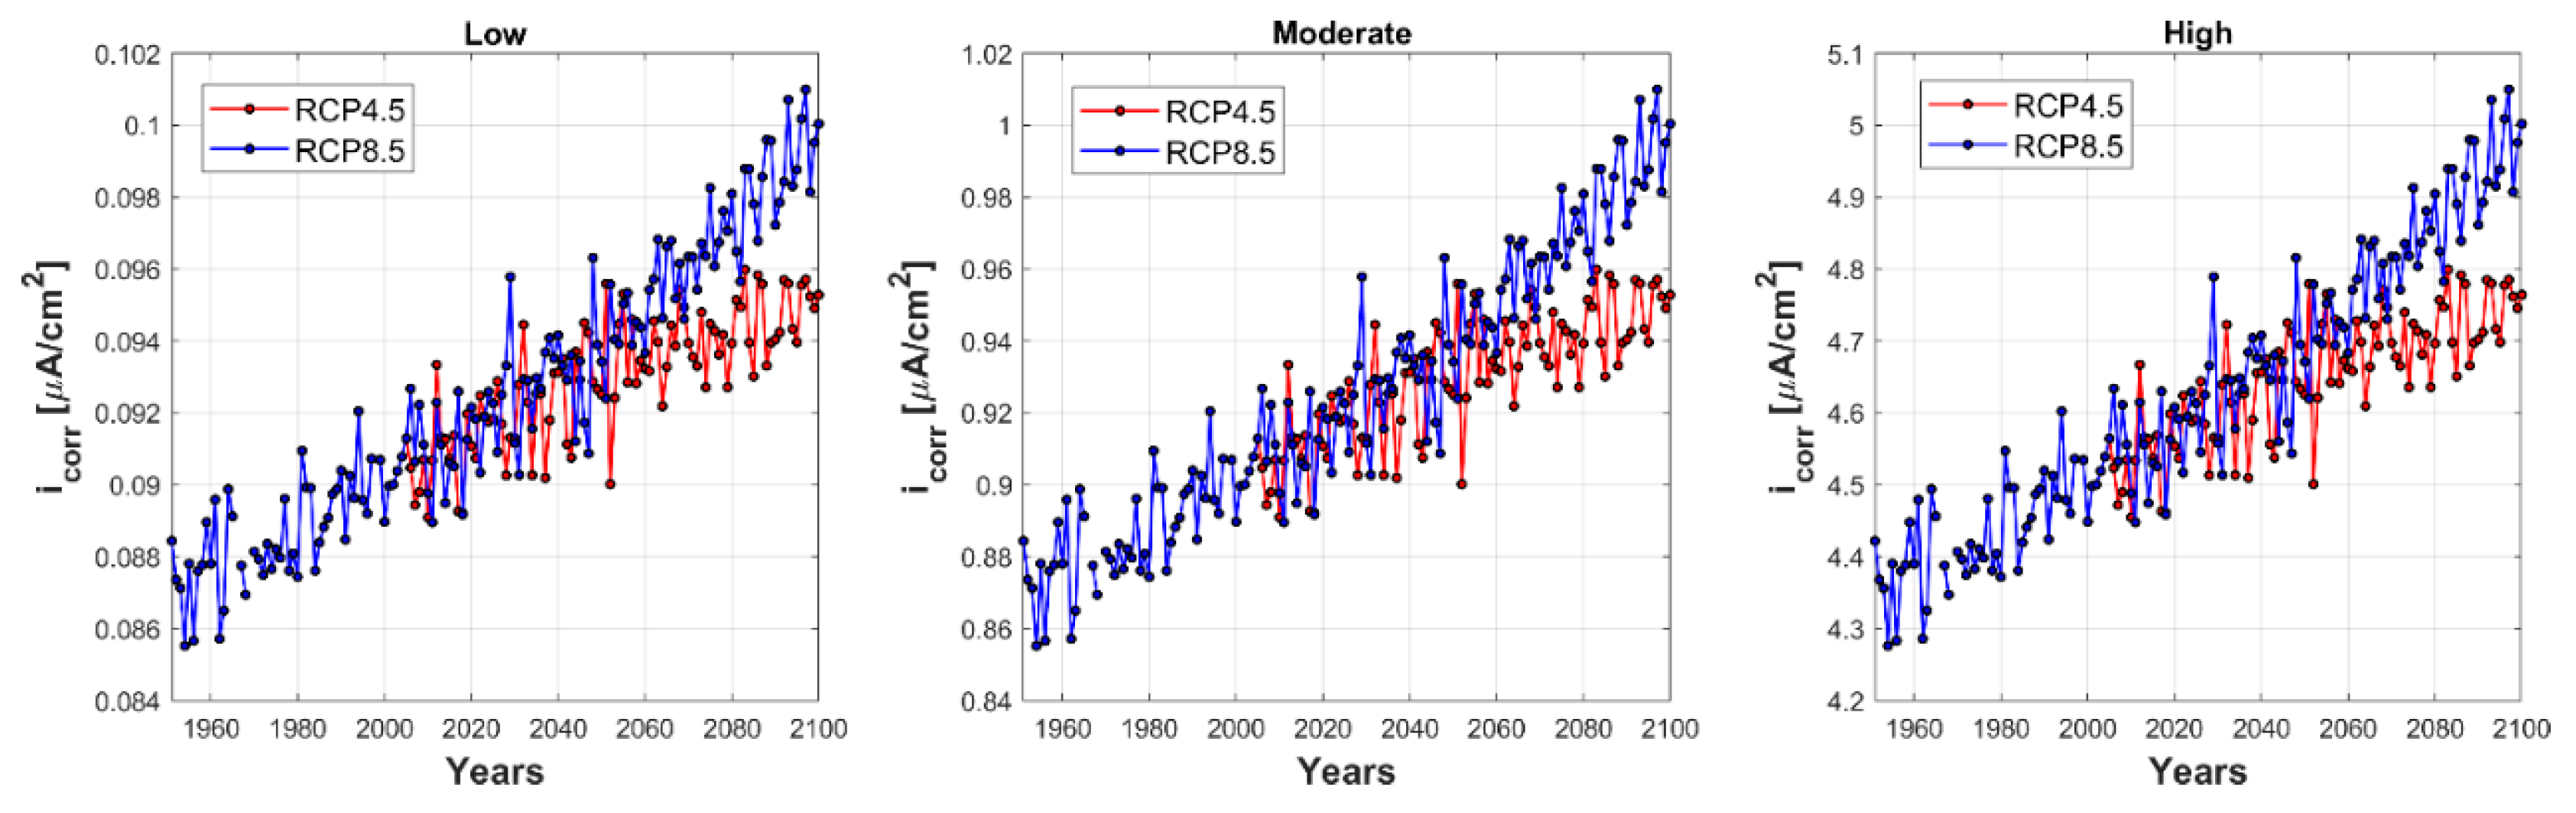
  • The values of icorr calculated considering the climate change impact through the indications suggested by Stewart et al. are lower than those obtained considering the results reported in DuraCrete, except for the slight corrosion scenario, which does not significantly influence the seismic performance of the viaduct;
  • The corrosion effects, expressed in terms of the reduction in steel reinforcement, influence the brittle failure mechanism more significantly than the ductile one;
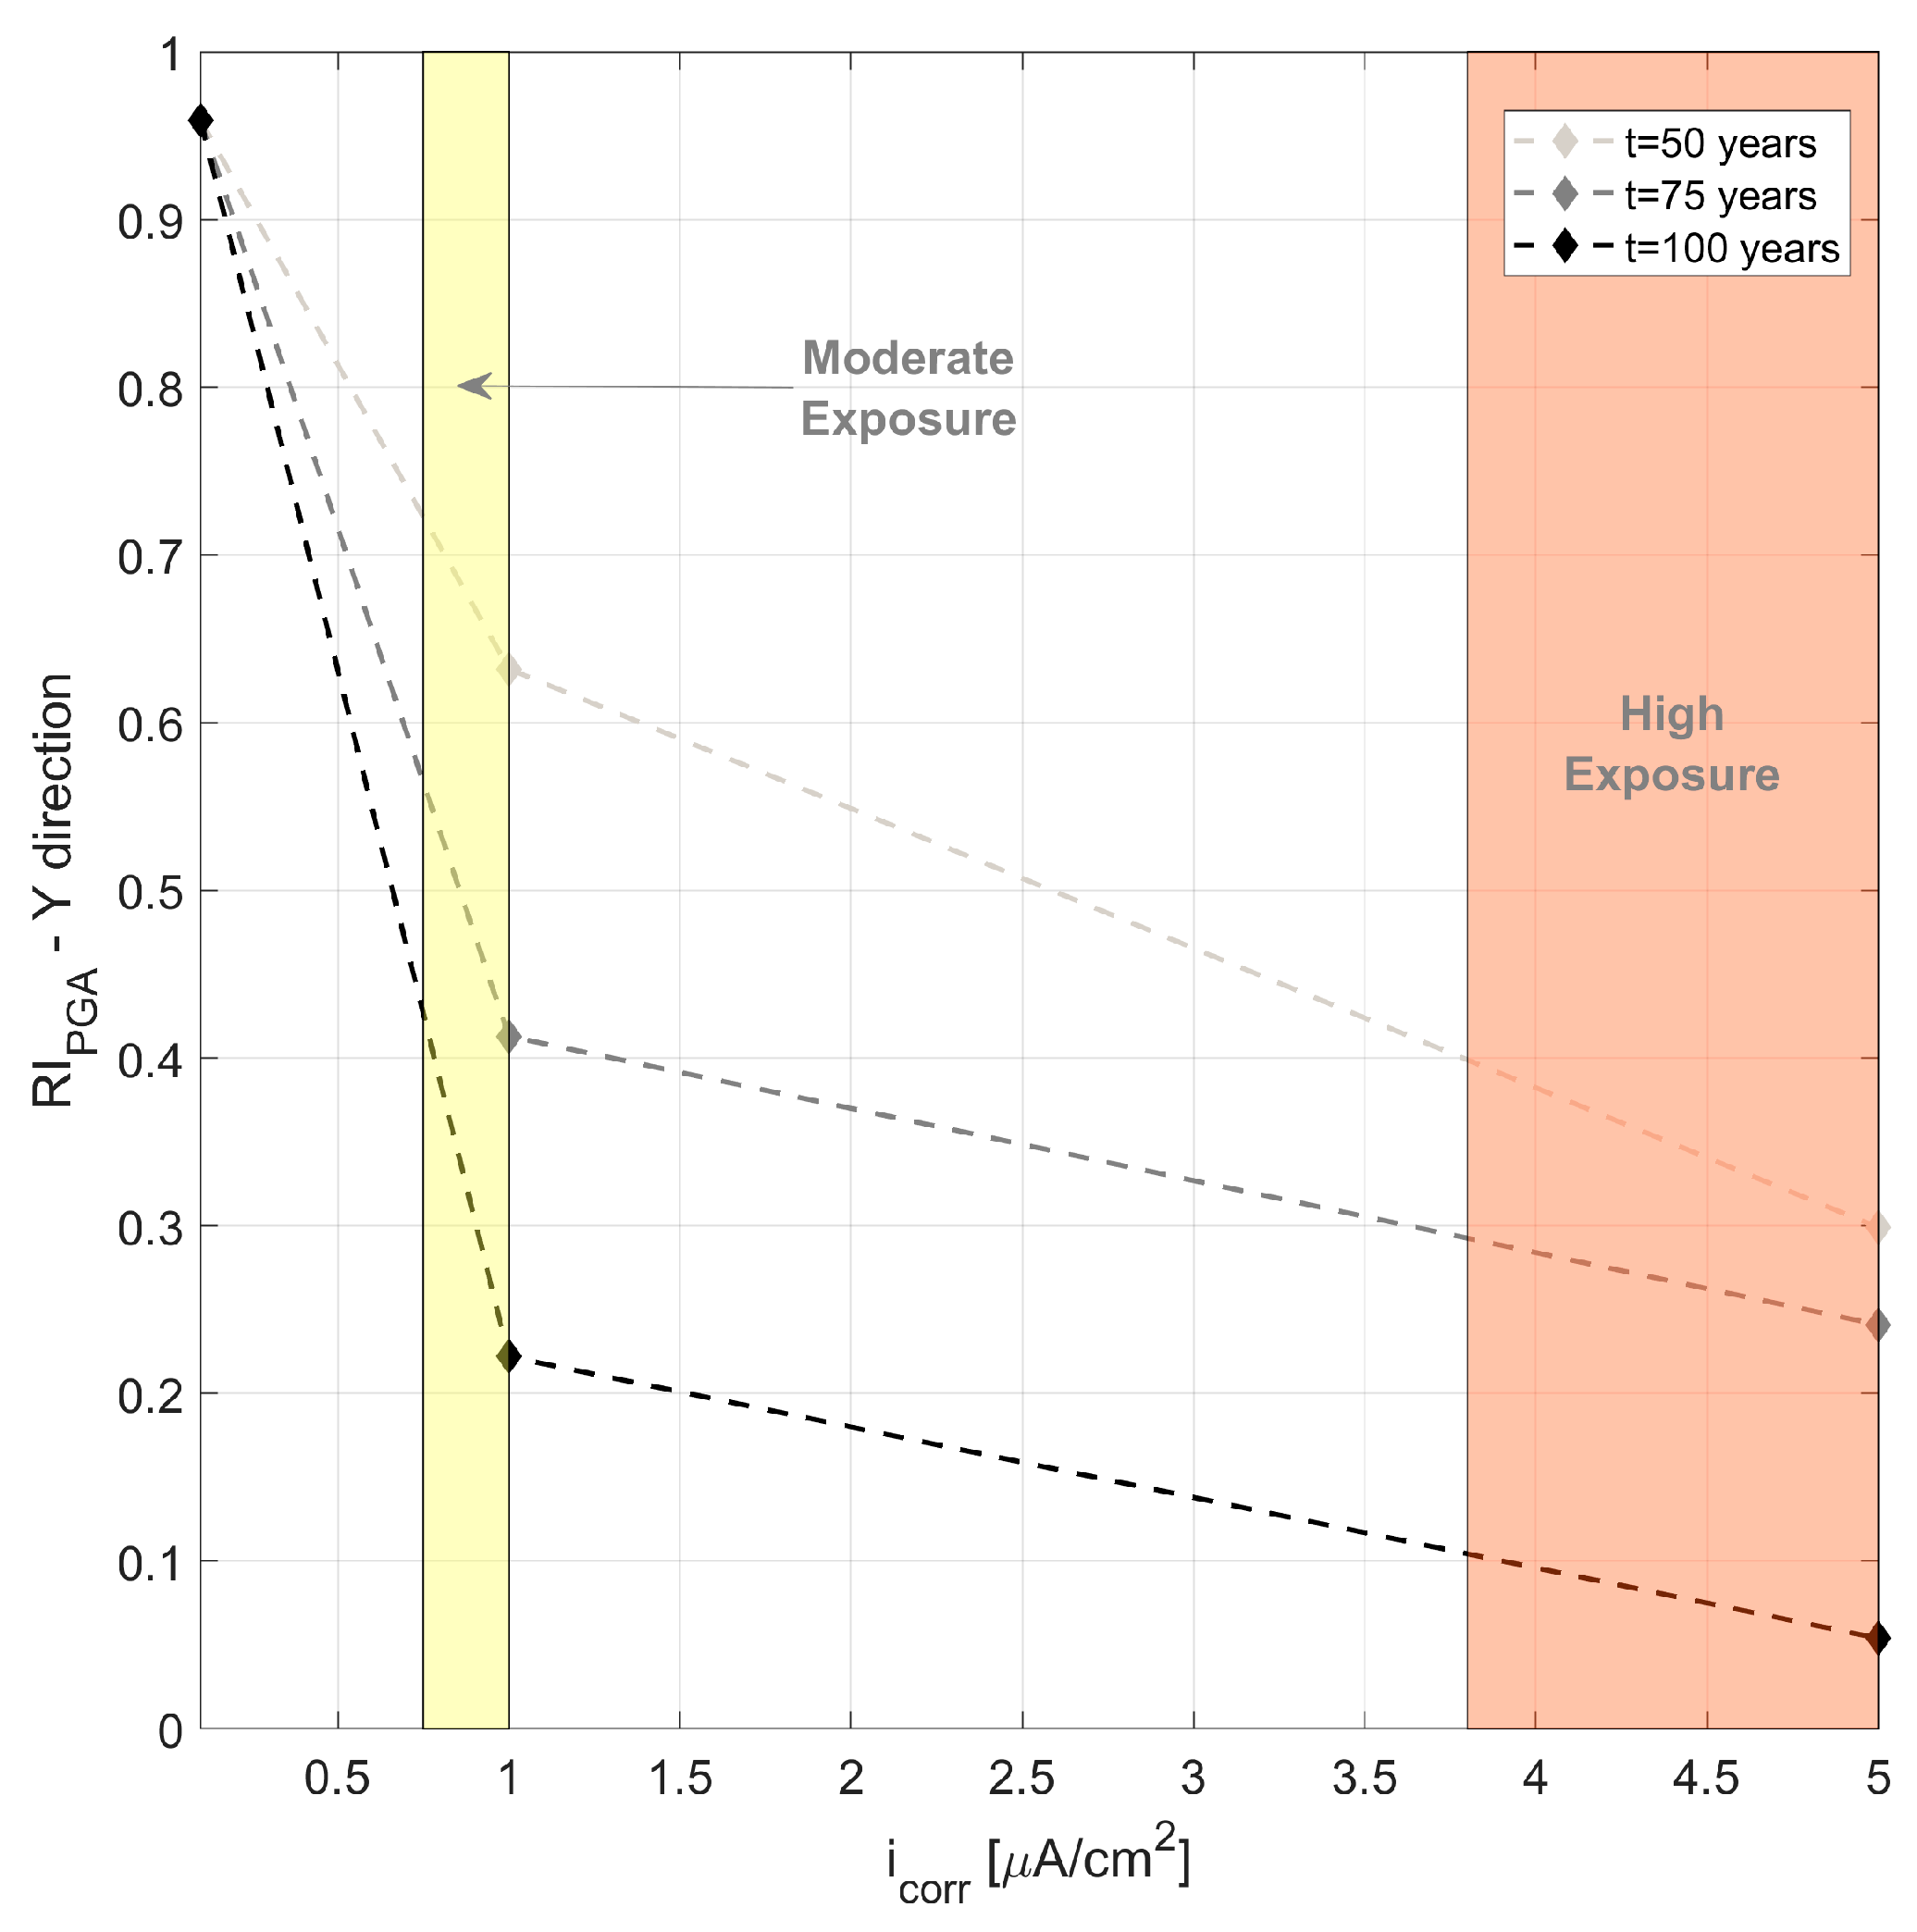
  • Considering the corrosion scenarios obtained from the above-mentioned climate change impact prediction model, a significant reduction in the risk indices, which characterize the seismic vulnerability of the viaduct, are observed only for the high corrosion level (icorr = 0.431 μA/cm2) with the brittle collapse mechanism;
  • Different conclusions can be observed when considering the icorr values proposed by DuraCrete, where an important decrease in risk index values is obtained for the moderate and high corrosion scenarios. Focusing on the high corrosion level, the reduction in the risk index values exceeds 90% for the brittle collapse mechanism and 80% for the ductile collapse mechanism;
  • The corrosion levels obtained from DuraCrete lead to more critical scenarios compared to those obtained from climate change projections for the area where the analyzed viaduct was built, when the corrosion rates proposed by Stewart et al. are considered.
Finally, it is important to highlight that the comparison of the results obtained, considering the different scenarios analyzed, is useful to improve the maintenance and management of these strategic structures, in order to always guarantee an adequate safety level. Potential future developments of this research work are related to the generalization of the results obtained, by considering other viaducts built in different years and located in different seismic zones.

Author Contributions

Conceptualization, M.Z. and F.L.; methodology, M.Z., M.L.P., F.L., F.M., P.F. and P.C.; validation, F.M., P.F. and P.C.; formal analysis, M.Z. and M.L.P.; investigation, F.L.; editing, F.L., F.M., P.F. and P.C.; supervision, F.M., P.F. and P.C. All authors have read and agreed to the published version of the manuscript.

Funding

This research received no external funding.

Institutional Review Board Statement

Not applicable.

Informed Consent Statement

Not applicable.

Data Availability Statement

The data presented in this study are available in article.

Conflicts of Interest

The authors declare no conflict of interest.

Abbreviations

icorrMean corrosion current density
icorr,20Mean corrosion current density at 20 °C
KEnvironmental exposure factor
EActivation energy of the diffusion process (40 kJ/mol)
RGas constant (8.314 × 10⁻³ kJ/mol K)
sCarbonated layer thickness
kPenetration rate coefficient
nParameters related to the concrete characteristics
d0Initial diameter of the steel reinforcement
P(t) Corroded thickness
tiInitiation time of the corrosion process
fckConcrete compressive strength
εu,0Steel ultimate deformation
cConcrete cover thickness
w/cWater/cement ratio

References

  1. Xiong, W.; Cai, C.S.; Zhang, R.; Shi, H.; Xu, C. Review of Hydraulic Bridge Failures: Historical Statistic Analysis, Failure Modes, and Prediction Methods. J. Bridge Eng. 2023, 28, 4. [Google Scholar] [CrossRef]
  2. Menga, A.; Kenstad, K.; Cantero, D.; Bathen, L.; Hornbostel, K.; Klausen, A. Corrosion-induced damages and failures of posttensioned bridges: A literature review. Struct. Concr. 2023, 24, 84–99. [Google Scholar] [CrossRef]
  3. Zucca, M.; Crespi, P.; Stochino, F.; Puppio, M.L.; Coni, M. Maintenance interventions period of existing RC motorway viaducts located in moderate/high seismicity zones. Structures 2023, 47, 976–990. [Google Scholar] [CrossRef]
  4. Santarsiero, G.; Picciano, V.; Masi, A. Structural rehabilitation of half-joints in RC bridges: A state-of-the-art review. Struct. Infrastruct. Eng. 2023. [Google Scholar] [CrossRef]
  5. Fan, Y.; Zhu, J.; Pei, J.; Li, Z.; Wu, Y. Analysis for Yangmingtan bridge collapse. Eng. Fail. Anal. 2015, 56, 20–27. [Google Scholar] [CrossRef]
  6. Biondini, F.; Camnasio, E.; Palermo, A. Lifetime seismic performance of concrete bridges exposed to corrosion. Struct. Infrastruct. Eng. 2014, 10, 880–900. [Google Scholar] [CrossRef]
  7. Berto, L.; Saetta, A.V.; Simioni, P. Structural risk assessment of corroding RC structures under seismic excitation. Constr. Build. Mater. 2012, 30, 803–813. [Google Scholar] [CrossRef]
  8. Kassir, M.K.; Ghosn, M. Chloride-induced corrosion of reinforced concrete bridge decks. Cem. Concr. Res. 2002, 32, 139–143. [Google Scholar] [CrossRef]
  9. Pour-Ghaz, M.; Burkan Isgor, O.; Ghods, P. The effect of temperature on the corrosion of steel in concrete. Part 1: Simulated polarization resistance tests and model development. Corros. Sci. 2009, 51, 415–425. [Google Scholar] [CrossRef]
  10. Bastidas-Arteaga, E.; Schoefs, F.; Stewart, M.G.; Wang, X. Influence of global warming on durability of corroding RC structures: A probabilistic approach. Eng. Struct. 2013, 51, 259–266. [Google Scholar] [CrossRef]
  11. Sousa, M.L.; Dimova, A.; Athanasopoulou, A.; Rianna, G.; Mercogliano, P.; Villani, V.; Nogal, M.; Gervasio, H.; Neves, L.; Bastidas-Arteaga, E.; et al. Expected Implications of Climate Change on the Corrosion of Structures; EUR 30303 EN; Publications Office of the European Union: Luxembourg, 2020; ISBN 978-92-76-20782-5. [Google Scholar]
  12. Nasr, A.; Honfi, D.; Larsson Ivanov, O. Probabilistic analysis of climate change impact on chloride-induced deterioration of reinforced concrete considering Nordic climate. J. Infrastruct. Preserv. Resil. 2022, 3, 8. [Google Scholar] [CrossRef]
  13. Landi, F.; Croce, P.; Marsili, F.; Kessler, S. Prediction of RC bridge deterioration under changing environmental conditions. In Life-Cycle of Structures and Infrastructure Systems; Biondini, F., Frangopol, D.M., Eds.; CRC Press: Boca Raton, FL, USA, 2023. [Google Scholar] [CrossRef]
  14. Sassu, M.; Giresini, L.; Puppio, M.L. Failure scenarios of small bridges in case of extreme rainstorms. Sustain. Resilient Infrastruct. 2017, 2, 108–116. [Google Scholar] [CrossRef]
  15. Pucci, A.; Hélder, S.; Giresini, L.; Matos, J.C.; Castelli, F. Fragility of bridge decks exposed to hydraulic and driftwood actions. Struct. Infrastruct. Eng. 2023. [Google Scholar] [CrossRef]
  16. Decreto Ministeriale 17/01/2018, Ministero delle Infrastrutture e dei Trasporti, G.U. Serie Generale n.42 del 20/02/2018—S.O.8.
  17. Estes, A.C.; Frangopol, D.M. Updating Bridge Reliability Based on Bridge Management Systems Visual Inspection Results. J. Bridge Eng. 2003, 8, 6. [Google Scholar] [CrossRef]
  18. Quirk, L.; Matos, J.; Murphy, J.; Pakrashi, K. Visual inspection and bridge management. Struct. Infrastruct. Eng. 2018, 14, 320–332. [Google Scholar] [CrossRef]
  19. Bertola, N.J.; Brühwiler, E. Risk-based methodology to assess bridge condition based on visual inspection. Struct. Infrastruct. Eng. 2023, 19, 575–588. [Google Scholar] [CrossRef]
  20. Deng, Z.; Huang, M.; Wan, N.; Zhang, J. The Current Development of Structural Health Monitoring for Bridges: A Review. Buildings 2023, 13, 1360. [Google Scholar] [CrossRef]
  21. Luo, J.; Huang, M.; Lei, Y. Temperature Effect on Vibration Properties and Vibration-Based Damage Identification of Bridge Structures: A Literature Review. Buildings 2022, 12, 1209. [Google Scholar] [CrossRef]
  22. Gul, M.; Necati Catbas, F. Statistical pattern recognition for Structural Health Monitoring using time series modelling: Theory and experimental verifications. Mech. Syst. Signal Process. 2009, 23, 2194–2204. [Google Scholar] [CrossRef]
  23. Valente, M.; Milani, G. Alternative retrofitting strategies to prevent the failure of an under-designed RC frame. Eng. Fail. Anal. 2018, 89, 271–285. [Google Scholar] [CrossRef]
  24. Adhikari, G.; Pinho, R. Development and Application of Nonlinear Static Procedures for Plan-Asymmetric Buildings; Research Report No. ROSE-2010/01; ROSE School, IUSS Pavia: Pavia, Italy, 2010. [Google Scholar]
  25. Stefanidou, S.; Kappos, A. Methodology for the development of bridge-specific fragility curves. Earthq. Eng. Struct. Dyn. 2017, 46, 73–93. [Google Scholar] [CrossRef]
  26. Contiguglia, C.P.; Pelle, A.; Briseghella, B.; Nuti, C. IMPA versus Cloud Analysis and IDA: Different Methods to Evaluate Structural Seismic Fragility. Appl. Sci. 2022, 12, 3687. [Google Scholar] [CrossRef]
  27. Karimi-Moridani, K.; Zarfam, P.; Ghafory-Ashtiany, M. A Novel and Efficient Hybrid Method to Develop the Fragility Curves of Horizontally Curved Bridges. KSCE J. Civ. Eng. 2020, 24, 508–524. [Google Scholar] [CrossRef]
  28. Bernuzzi, C.; Rodigari, D.; Simoncelli, M. Incremental dynamic analysis for assessing the seismic performance of moment resisting steel frames. Ing. Sismica 2020, 4, 23–44. [Google Scholar]
  29. Concu, G.; Deligia, M.; Sassu, M. Seismic Analysis of Historical Urban Walls: Application to the Volterra Case Study. Infrastructures 2023, 8, 18. [Google Scholar] [CrossRef]
  30. Vamvatsikos, D.; Cornell, C.A. Incremental dynamic analysis. Earthq. Eng. Struct. Dyn. 2002, 31, 491–514. [Google Scholar] [CrossRef]
  31. Paraskeva, T.S.; Kappos, A.J.; Sextos, A.G. Extension of modal pushover analysis to seismic assessment of bridges. Earthq. Eng. Struct. Dyn. 2006, 35, 1269–1293. [Google Scholar] [CrossRef]
  32. Paraskeva, T.S.; Kappos, A.J. Further development of a multimodal pushover procedure for seismic assessment of bridges. Earthq. Eng. Struct. Dyn. 2010, 39, 211–222. [Google Scholar] [CrossRef]
  33. Chopra, A.K.; Goel, R.K. A modal pushover analysis procedure for estimating seismic demands for buildings. Earthq. Eng. Struct. Dyn. 2002, 31, 561–582. [Google Scholar] [CrossRef]
  34. Chopra, A.K.; Goel, R.K. A modal pushover analysis procedure to estimate seismic demands for unsymmetric-plan buildings. Earthq. Eng. Struct. Dyn. 2004, 33, 903–927. [Google Scholar] [CrossRef]
  35. De Domenico, D.; Messina, D.; Recupero, A. Seismic vulnerability assessment of reinforced concrete bridge piers with corroded bars. Struct. Concr. 2023, 24, 56–83. [Google Scholar] [CrossRef]
  36. Dizaj, E.A.; Salami, M.R.; Kashani, M.M. Seismic vulnerability analysis of irregular multi-span concrete bridges with different corrosion damage scenarios. Soil Dyn. Earthq. Eng. 2023, 165, 107678. [Google Scholar] [CrossRef]
  37. Ge, B.; Yang, Y.; Kim, S. Time-dependent multi-hazard seismic vulnerability and risk assessment of deteriorating reinforced concrete bridges considering climate change. Structures 2023, 55, 995–1010. [Google Scholar] [CrossRef]
  38. Zhong, J.; Mao, Y.; Yuan, X. Lifetime seismic risk assessment of bridges with construction and aging considerations. Structures 2023, 47, 2259–2272. [Google Scholar] [CrossRef]
  39. Nasr, A.; Björnsson, I.; Honfi, D.; Larsson Ivanov, O.; Johansson, J.; Kjellström, E. A review of the potential impacts of climate change on the safety and performance of bridges. Sustain. Resilient Infrastruct. 2021, 6, 1–21. [Google Scholar] [CrossRef]
  40. Mondoro, A.; Frangopol, D.M.; Liu, L. Multi-criteria robust optimization framework for bridge adaptation under climate change. Struct. Saf. 2018, 74, 14–23. [Google Scholar] [CrossRef]
  41. Kaewunruen, S.; AbdelHadi, M.; Kongpuang, M.; Pansuk, W.; Remennikov, A.M. Digital Twins for Managing Railway Bridge Maintenance, Resilience, and Climate Change Adaptation. Sensors 2023, 23, 252. [Google Scholar] [CrossRef]
  42. Moro, F.; Kessler, S.; Landi, F. Prediction of corrosion rates in view of climate change with rising temperatures. Ce/Pap. 2023, 6, 1044–1047. [Google Scholar] [CrossRef]
  43. van Vuuren, D.P.; Edmonds, J.; Kainuma, M.; Riahi, K.; Thomson, A.; Hibbard, K.; Hurtt, G.C.; Kram, T.; Krey, V.; Lamarque, G.F.; et al. The representative concentration pathways: An overview. Clim. Chang. 2011, 109, 5–31. [Google Scholar] [CrossRef]
  44. O’Neill, B.C.; Carter, T.R.; Ebi, K.; Harrison, P.A.; Kemp-Benedict, E.; Kok, K.; Kriegler, E.; Preston, B.L.; Riahi, K.; Sillmann, J.; et al. Achievements and needs for the climate change scenario framework. Nat. Clim. Chang. 2020, 10, 1074–1084. [Google Scholar] [CrossRef]
  45. Schwalm, C.R.; Glendon, S.; Duffy, P.B. RCP8.5 tracks cumulative CO2 emissions. Proc. Natl. Acad. Sci. USA 2020, 117, 19656–19657. [Google Scholar] [CrossRef]
  46. Li, S.H. Effect of nonstationary extreme wind speeds and ground snow loads on the structural reliability in a future Canadian changing climate. Struct. Saf. 2023, 101, 102296. [Google Scholar] [CrossRef]
  47. Jacob, D.; Petersen, J.; Eggert, B.; Alias, A.; Christensen, O.B.; Bouwer, L.M.; Braun, A.; Colette, A.; Déqué, M.; Georgievski, G.; et al. EURO-CORDEX: New high-resolution climate change projections for European impact research. Reg. Environ. Chang. 2014, 14, 563–578. [Google Scholar] [CrossRef]
  48. Masson-Delmotte, V.; Zhai, P.; Pirani, A.; Connors, S.L.; Péan, C.; Berger, S.; Caud, N.; Chen, Y.; Goldfarb, L.; Gomis, M.I.; et al. IPCC, 2021: Summary for Policymakers. In Climate Change 2021: The Physical Science Basis. Contribution of Working Group I to the Sixth Assessment Report of the Intergovernmental Panel on Climate Change; Cambridge University Press: Cambridge, UK; New York, NY, USA, 2021; pp. 3–32. [Google Scholar]
  49. Croce, P.; Formichi, P.; Landi, F. Enhancing the Output of Climate Models: A Weather Generator for Climate Change Impact Studies. Atmosphere 2021, 12, 1074. [Google Scholar] [CrossRef]
  50. Maraun, D.; Wetterhall, F.; Ireson, A.M.; Chandler, R.E.; Kendon, E.J.; Widmann, M.; Brienen, S.; Rust, H.W.; Sauter, T.; Themeßl, M.; et al. Precipitation downscaling under climate change: Recent developments to bridge the gap between dynamical models and the end user. Rev. Geophys. 2010, 48, RG3003. [Google Scholar] [CrossRef]
  51. Ho, C.K.; Stephenson, D.B.; Collins, M.; Ferro, C.A.T.; Brown, S.J. Calibration Strategies: A Source of Additional Uncertainty in Climate Change Projections. Bull. Am. Meteorol. Soc. 2012, 93, 21–26. [Google Scholar] [CrossRef]
  52. Maraun, D. Bias Correcting Climate Change Simulations—A Critical Review. Curr. Clim. Chang. Rep. 2016, 2, 211–220. [Google Scholar] [CrossRef]
  53. Stewart, G.M.; Wang, X.; Nguyen, M.N. Climate change impact and risks of concrete infrastructure deterioration. Eng. Struct. 2011, 33, 1326–1337. [Google Scholar] [CrossRef]
  54. DuraCrete. Statistical quantification of the variables in the limit state functions. Dura-Crete-Probabilistic performance-based durability design of concrete structures. EU-brite EuRam III. Contract BRPR-CT95-0132. Project BE95-1347/R9. January 2000.
  55. fib Bullettin 34. Model Code for Service Life Design; FIB: Lausanne, Switzerland, 2006. [Google Scholar]
  56. Crespi, P.; Zucca, M.; Valente, M.; Longarini, N. Influence of corrosion effects on the seismic capacity of existing RC bridges. Eng. Fail. Anal. 2022, 140, 106546. [Google Scholar] [CrossRef]
  57. MIDAS Civil. Analysis Reference. 2023. Available online: https://www.midasoft.com/bridge-library/civil/products/midascivil (accessed on 5 October 2023).
  58. EN 1337-3:2005; Structural Bearings—Part 3: Elastomeric Bearings. British Standards: London, UK, 2005.
  59. EN 1998-3:2005; Eurocode 8: Design of Structures for Earthquake Resistance—Part 3: Assessment and Retrofitting Buildings. CEN (European Committee for Standardization), Management Centre: Brussels, Belgium, 2005.
  60. Chen, W.F.; Duan, L. Bridge Engineering—Seismic Design, 1st ed.; CRC Press: Boca Raton, FL, USA, 2000. [Google Scholar]
  61. Miluccio, G.; Losanno, D.; Parisi, F.; Cosenza, E. Traffic-load fragility models for prestressed concrete girder decks of existing Italian highway bridges. Eng. Struct. 2021, 249, 113367. [Google Scholar] [CrossRef]
  62. Kent, D.C.; Park, R. Flexural members with confined concrete. ASCE-J. Struct. Div. 1971, 97, 1969–1990. [Google Scholar] [CrossRef]
  63. Park, R.; Paulay, T. Reinforced Concrete Structures, 1st ed.; John Wiley and Sons: New York, NY, USA, 1975. [Google Scholar]
  64. EN 1998-2:2005; Eurocode 8: Design of Structures for Earthquake Resistance—Part 2: Bridges. CEN (European Committee for Standardization), Management Centre: Brussels, Belgium, 2005.
  65. Saetta, A.V.; Vitaliani, R. Experimental investigation and numerical modeling of carbonation process in reinforced concrete structures: Part I: Theoretical formulation. Cem. Concr. Res. 2004, 34, 571–579. [Google Scholar] [CrossRef]
  66. ATC-40:1996; Seismic Evaluation and Retrofitting of Concrete Buildings. Applied Technology Council, 8.1–8.66: Redwood City, CA, USA, 1996.
  67. Causevic, M.; Mitrovic, S. Comparison between non-linear dynamic and static seismic analysis of structures according to European and US provisions. Bull. Earthq. Eng. 2011, 9, 467–489. [Google Scholar] [CrossRef]
  68. Lee, H.S.; Cho, Y.S. Evaluation of the mechanical properties of steel reinforcement embedded in concrete specimen as a function of the degree of reinforcement corrosion. Int. J. Fract. 2009, 157, 81–88. [Google Scholar] [CrossRef]
Figure 1. (a) Temperature evolution trend and (b) percentage variation in corrosion rate for the province of Massa-Carrara.
Applsci 14 00060 g001
Figure 2. Evaluation of icorr variations over time for C2—wet/rarely dry (unsheltered), C3—moderate humidity (sheltered), and C4—cyclically wet–dry (unsheltered) exposure (icorr,20 = 0.172, 0.345, and 0.431 μA/cm2, respectively).
Applsci 14 00060 g002
Figure 3. Evaluation of icorr variations over time for low, moderate, and high corrosion scenarios (icorr,20 = 0.1, 1, and 5 μA/cm2).
Applsci 14 00060 g003
Figure 4. (a) Temperature evolution trend and (b) percentage variation in corrosion rate.
Applsci 14 00060 g004
Figure 5. Evaluation of icorr variations over time for C2—wet/rarely dry (unsheltered), C3—moderate humidity (sheltered), and C4—cyclically wet–dry (unsheltered) exposure (icorr,20 = 0.172, 0.345, and 0.431 μA/cm2).
Applsci 14 00060 g005
Figure 6. Evaluation of icorr variations over time for low, moderate, and high corrosion scenarios (icorr,20 = 0.1, 1, and 5 μA/cm2).
Applsci 14 00060 g006
Figure 7. Connections between the elastomeric bearings and the pier cap.
Applsci 14 00060 g007
Figure 8. The FEM of the viaduct.
Applsci 14 00060 g008
Figure 9. Vibration mode shapes of the first three natural periods of the viaduct.
Applsci 14 00060 g009
Figure 10. Variation in seismic risk index RIPGA for the brittle mechanism in the Y direction, for different exposure and climate scenarios at the bridge location.
Applsci 14 00060 g010
Table 1. Constant parameters.
fckkεu,0w/cti
[MPa][-][%][-][year]
280.011690.613.5
Table 2. Pier properties.
PiersCross-SectionHeightLongitudinal Steel RebarStirrups
[n°][m][m][-][-]
14.0 × 2.55.06148Φ14Φ10/20
24.0 × 2.510.84148Φ14Φ10/20
34.0 × 2.515.51148Φ14Φ10/20
Table 3. Viaduct main properties.
SpanLengthBearingsPierPier ShapePier
Thickness
[n°][m][-][n°][-][m]
42002 × 33Hexagonal hollow0.35
Table 4. Steel reinforcement diameter and area variation calculated considering the assumptions reported in [53].
tCorrosion Scenario
SlightModerateHigh
icorr = 0.172 [μA/cm2]icorr = 0.345 [μA/cm2]icorr = 0.431 [μA/cm2]
d0dΔAsεud0dΔAsεud0dΔAsεu
[Years][mm][mm][%][%][mm][mm][%][%][mm][mm][%][%]
0–13.510.0010.000.009.0010.0010.000.009.0010.0010.000.009.00
14.0014.000.009.0014.0014.000.009.0014.0014.000.009.00
5010.009.851.468.7910.009.712.928.5910.009.643.658.36
14.0013.851.048.8514.0013.712.098.7014.0013.642.618.54
7510.009.752.458.5710.009.514.928.1410.009.396.157.92
14.0013.751.758.6914.0013.513.528.3814.0013.394.398.23
10010.009.653.458.3910.009.316.927.7810.009.148.657.48
14.0013.652.478.5714.0013.314.958.1314.0013.146.187.92
Table 5. Steel reinforcement diameter and area variation calculated considering the assumptions reported in [54].
tCorrosion Scenario
SlightModerateHigh
icorr = 0.1 [μA/cm2]icorr = 1 [μA/cm2]icorr = 5 [μA/cm2]
d0dΔAsεud0dΔAsεud0dΔAsεu
[Years][mm][mm][%][%][mm][mm][%][%][mm][mm][%][%]
0–13.510.0010.000.009.0010.0010.000.009.0010.0010.000.009.00
14.0014.000.009.0014.0014.000.009.0014.0014.000.009.00
5010.009.920.858.8810.009.158.477.8010.005.7742.341.57
14.0013.920.608.9114.0013.156.058.1514.009.7730.243.69
7510.009.861.438.7510.008.5714.276.5010.002.8771.341.17
14.0013.861.028.8214.0012.5710.197.2114.006.8750.962.33
10010.009.802.018.6510.007.9920.075.4810.000.00100.000.00
14.0013.801.438.7514.0011.9914.336.4814.003.9771.671.01
Table 6. Risk indices obtained considering the icorr values suggested by [53].
Corrosion LevelDuctile Failure Mechanism
50 Years75 Years100 Years
XYXYXY
RIPGASlight5.342
(0.00%)
3.936
(0.00%)
5.342
(0.00%)
3.936
(0.00%)
5.231
(−2.08%)
3.851
(−2.16%)
Moderate5.262
(−1.50%)
3.888
(−1.22%)
5.201
(−2.64%)
3.866
(−1.79%)
5.171
(−3.20%)
3.815
(−3.07%)
High5.231
(−2.08%)
3.851
(−2.16%)
5.171
(−3.20%)
3.815
(−3.07%)
5.100
(−4.20%)
3.799
(−4.14%)
RIRPSlight9.804
(0.00%)
6.464
(0.00%)
9.804
(0.00%)
6.464
(0.00%)
9.597
(−2.11%)
6.303
(−2.49%)
Moderate9.686
(−1.20%)
6.387
(−1.19%)
9.583
(−2.25%)
6.356
(−1.67%)
9.502
(−3.08%)
6.288
(−2.72%)
High9.597
(−2.11%)
6.303
(−2.49%)
9.502
(−3.08%)
6.288
(−2.72%)
9.480
(−3.30%)
6.200
(−4.08%)
Brittle failure mechanism
RIPGASlight1.379
(0.00%)
0.959
(0.00%)
1.379
(0.00%)
0.959
(0.00%)
1.257
(−8.46%)
0.889
(−7.30%)
Moderate1.313
(−4.79%)
0.913
(−4.80%)
1.297
(−5.94%)
0.901
(−6.04%)
1.221
(−11.45%)
0.836
(−12.82%)
High1.257
(−8.46%)
0.889
(−7.30%)
1.221
(−11.45%)
0.836
(−12.82%)
1.144
(−17.04%)
0.632
(−34.09%)
RIRPSlight1.547
(0.00%)
0.949
(0.00%)
1.547
(0.00%)
0.949
(0.00%)
1.421
(−8.15%)
0.882
(−7.06%)
Moderate1.478
(−4.46%)
0.906
(−4.53%)
1.459
(−5.68%)
0.893
(−5.90)
1.398
(−9.63%)
0.855
(−9.90%)
High1.421
(−8.15%)
0.882
(−7.06%)
1.398
(−9.63%)
0.855
(−9.90%)
1.200
(−22.43%)
0.627
(−33.93%)
Table 7. Risk indices obtained considering the icorr values suggested by [54].
Corrosion LevelDuctile Failure Mechanism
50 Years75 Years100 Years
XYXYXY
RIPGASlight5.342
(0.00%)
3.936
(0.00%)
5.342
(0.00%)
3.936
(0.00%)
5.342
(0.00%)
3.936
(0.00%)
Moderate5.100
(−4.20%)
3.799
(−4.14%)
5.083
(−4.84%)
3.801
(−3.43%)
4.537
(−15.01%)
3.004
(−23.68%)
High4.968
(−7.00%)
3.782
(−4.56%)
3.194
(−40.21%)
2.348
(−40.35%)
1.114
(−79.15%)
0.876
(−77.74%)
RIRPSlight9.804
(0.00%)
6.464
(0.00%)
9.804
(0.00%)
6.464
(0.00%)
9.804
(0.00%)
6.464
(0.00%)
Moderate9.480
(−3.30%)
6.200
(−4.08%)
9.322
(−4.92%)
6.208
(−3.96%)
8.374
(−14.58%)
5.233
(−19.04%)
High8.879
(−9.34%)
6.122
(−5.29%)
4.862
(−50.41%)
3.198
(−50.53%)
2.256
(−76.99%)
1.635
(−74.70)
Brittle failure mechanism
RIPGASlight1.379
(0.00%)
0.959
(0.00%)
1.379
(0.00%)
0.959
(0.00%)
1.379
(0.00%)
0.959
(0.00%)
Moderate1.144
(−17.04%)
0.632
(−34.09%)
1.003
(−27.26%)
0.413
(−56.93%)
0.829
(−39.88%)
0.222
(−76.85%)
High0.937
(−32.05%)
0.299
(−68.82%)
0.442
(−67.95%)
0.241
(−74.87%)
0.123
(−91.08%)
0.054
(−94.37%)
RIRPSlight1.547
(0.00%)
0.949
(0.00%)
1.547
(0.00%)
0.949
(0.00%)
1.547
(0.00%)
0.949
(0.00%)
Moderate1.200
(−22.43%)
0.627
(−33.93%)
1.102
(−28.76%)
0.389
(−59.01)
0.966
(−37.56)
0.237
(−75.03%)
High0.984
(−36.39%)
0.267
(−71.87%)
0.503
(−67.49%)
0.230
(−75.76%)
0.159
(−89.72%)
0.062
(−93.46%)
Disclaimer/Publisher’s Note: The statements, opinions and data contained in all publications are solely those of the individual author(s) and contributor(s) and not of MDPI and/or the editor(s). MDPI and/or the editor(s) disclaim responsibility for any injury to people or property resulting from any ideas, methods, instructions or products referred to in the content.

