Abstract
In response to stringent rules inhibiting the implementation of refrigerants with high global warming impact, alternative candidates should undergo assessments to prove their viability. The mixtures R450A and R454B, being the center of the current focus, underwent experimentation for flow condensation inside a mini-scale micro-finned tube of 5 mm outer diameter. The operating conditions were set to be in the range of 0.1 to 0.95 for vapor quality, 75 to 400 kg m−2 s−1 for mass flux, and recorded at saturation temperatures of 30 and 40 °C. Having concluded the evaluations of thermal and hydraulic properties of heat transfer coefficient (HTC) and frictional pressure drop (FPD), a comparison was drawn between the two candidates, where R450A possessed superior HTC and higher FPD per unit length at higher vapor qualities due to lower vapor density. Ultimately, empirical models pertinent to flow condensation were compared with the acquired experimental results.
1. Introduction
Due to novel regulations aiming to attenuate the greenhouse effect [1], implementation of refrigerants with low GWP is imminent. For instance, regarding new air conditioning systems, European F-gas regulation [1] sets a GWP limit of 750 for refrigerants placed on the market. The European Union also aims to accomplish an 80% reduction in HFCs placed on the market compared to a baseline period. Nair [2], exploring the feasibility of the usage of HydroFluoroOlefins (HFOs) as a substitute for its contemporary counterpart HydroFluoroCarbons (HFCs), expressed that recent accruing scientific endeavors encourage the use of HFO-1234ze(E) and HFO-1234yf as replacements for vastly utilized HFC-134a. Such a statement is a commonality in the literature as other authors [3,4] claim similar plausibility. Despite a fair potential, the shortcomings of HFOs [5], which are their light flammability and slightly inferior thermal and hydraulic performances compared to HFCs, are a matter of indispensable concern. One solution to such drawback is regarding the utilization of HFO/HFC mixtures that not only boost the thermal performance [6] but rectify the flammability concern. An analysis [7] committed to foreseeing the feature demand of refrigerant emphasizes the use of such mixtures in the transitional phase.
R450A has been designed to serve as a not-flammable solution to the widely used HFC-134a with a 60% reduced GWP. Among its practical applications, it is worth citing the use for heat pumps, air-cooled and water-cooled chillers, district heating and cooling, vending machines and beverage dispensers, high-stage CO2 cascade systems, high-stage cascade CO2 systems, and direct expansion medium temperature refrigeration systems [8]. R454B is a replacement candidate for the HFC-410A, with a 78% lower GWP. Thanks to its higher critical temperature and broader operating envelope in low evaporating temperatures, R454B could outperform other solutions such as R32 in reversible chillers and heat pump applications [9]. After a brief survey of the literature, there is a limited diversity of test sections dedicated to the experimental investigation of the two promising zeotropic mixtures of R450A and R454B for flow condensation as opposed to the other candidates. The two refrigerants possess similar global warming potential categorizations, which are equal to 547 and 467 for R450A and R454B, respectively.
Concerning R454B (31.1% HFO-1234yf—68.9% HFC-32 by mass), the attempts are confined to works of [10,11,12] for 9.52 mm and 7.2 mm cooper/aluminum smooth tubes of 4.7 mm inner diameter. The abovementioned investigations culminated in new correlations regarding the heat transfer coefficient (HTC) of HFC/HFO mixtures, a comparison against previous HTC and frictional pressure drop (FPD) models, and an inference regarding the dependency of the model’s accuracies on tube material. Regarding R450A (58% HFO-1234ze(E)-42% HFC-134a by mass), the literature is perhaps more enriched in terms of the geometrical diversity of the test sections. For instance, experimental campaigns [13,14] on channels having diameters in the range of 0.9 to 3.3 mm and micro-finned tubes of 7 mm outer diameter (OD) by Diani et al. [15] can be noted. It is important to note that the work of Azzolin et al. [14] also visualized the flow patterns of R450A during condensation, aside from their thermal analysis. Overall, it is quite evident that neither refrigerant was tested inside the microscale (between 1 and 6 mm according to the definition of [16,17]) micro-finned tubes. Most of the papers appearing in the literature are focused on the overall assessment of the vapor compression systems [18,19,20,21,22,23].
Considering the absence of such research, it remains unclear whether the contemporary correlations for micro-finned tubes such as the model by Cavallini et al. [24] could offer fairly accurate predictions. Moreover, it also remains unknown whether the suggested corrections for binary mixtures such as Bell and Ghaly [25] could augment the accuracy of the model. Furthermore, the evaluation of FPD is more intricate inside microscale micro-finned tubes compared to other geometries, rendering their prediction throughout empirical correlations more challenging.
Current experimental work is based on the condensation of both refrigerants inside micro-finned tubes of 4.28 mm inner diameter, possessing a helix angle and fin height of 30° and 0.15 mm. Two saturation temperatures of 30 °C and 40 °C are set for investigation while the mass fluxes and vapor qualities range from 75 to 600 kg m−2 s−1 and 0.1 to 0.95. Initially, the trends of HTC and FPD are explored for various operational conditions; consequently, the acquired experimental results are compared to predictive HTC and FPD models to assess their accuracy. Since R450A and R454B possess different temperature glides, 0.64 K and 1.33 K, respectively, which are classified as low-temperature glides, it was investigated whether the models developed for pure fluid alone could offer fair predictions.
2. Methodology
The overall outlook of the thermodynamic cycle is presented in Figure 1. Pressure and temperature for both water and refrigerant cycles are duly recorded throughout the means of acquisition devices whose detailed information is provided in Table 1. The mass flux of the refrigerant cycle at the test section is simply set by modifying the variable-speed pump. After reaching the super-heated state by passing the evaporator that operates using an electrically heated hot water supply, the refrigerant proceeds to enter the pre-condenser, where saturated conditions are acquired. The process through which the vapor quality is set at the inlet of the test section can be grasped in the upcoming section of the methodology. The refrigerant then proceeds to be subcooled in a post-condenser whose water supply is obtained using a chiller. Refer to Figure 1 for a clear grasp of the positioning of the measurement devices, and to Mancin et al. [26] for a more detailed description of the experimental apparatus.
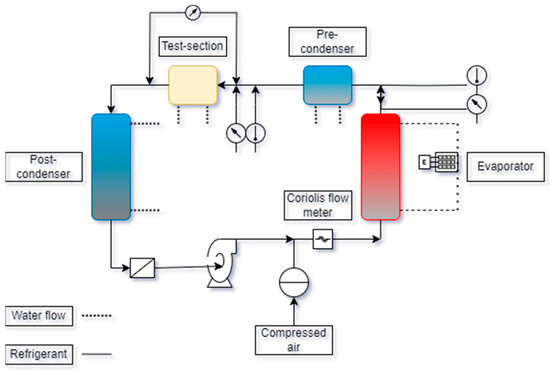
Figure 1.
Outlook of the facility.

Table 1.
Accuracy of measurement devices.
The test section is comprised of the aforementioned micro-finned tube that exchanges heat with a helically wrapped smooth tube with water flowing at temperatures below saturation temperature. To guarantee optimal thermal contact, the space between the helical tube and the test section is filled with an alloy, and the entire test section is enshrouded by an aluminum case. It is important to note that the entire test section is covered by insulating material to avoid the exchange of heat with the surroundings. Figure 2 illustrates the abovementioned remarks, where “REF” stands for “refrigerant”. Furthermore, to better grasp the geometrical parameters of the micro-finned tube, a circumferential pictorial demonstration of the tube is displayed in Figure 3. The inner diameter at the fin tip for the tested micro-finned tube is 4.28 mm, with an outer diameter of 5.0 mm. There are 54 fins, each one is 0.15 mm high. The helix angle is 30°. The micro-finned tube is made of copper, which is a common material for tubes implemented in heat exchangers involved in air conditioning and refrigeration equipment, and suitable for a large variety of refrigerants.
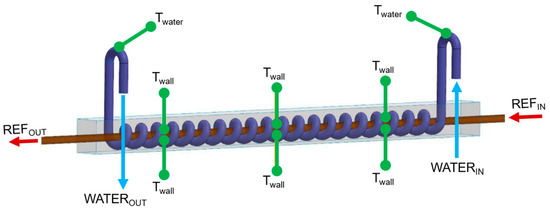
Figure 2.
Test section.
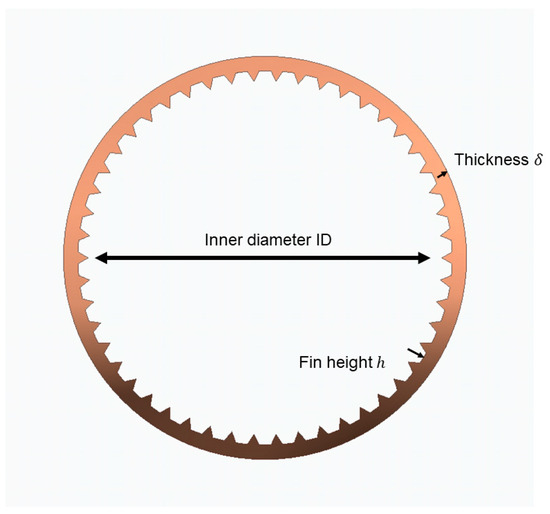
Figure 3.
Circumferential view of the micro-finned tube.
Two pressure ports are devised for the test section at the upper and lower stream. A differential pressure transducer is implemented for the purpose of recording pressure drops. Six T-type (copper/constantan) thermocouples are installed at the tube wall to capture the mean wall temperature (Twall,mean). These thermocouples have been previously calibrated in the temperature range of 10–50 °C, which is suitable for the present experimental tests. A thermo-resistance Pt100 is used as a reference temperature during the calibration procedure. The length of the test section in which heat exchange takes place is around 0.217 m and the distance between pressure drop ports is around 0.5 m.
The data analysis in the test section for both HTC and FPD is delineated by expressing the evaluation steps as follows:
- Evaluation of inlet vapor quality:
- 2.
- Evaluation of output vapor quality:
- 3.
- Evaluation of HTC:
Having inlet and outlet vapor qualities, the measured HTC values are associated with a mean value xmean. For a more intricate elucidation of the methodology, refer to the paper [28] where the same facility and approaches were utilized for flow boiling.
- 4.
- Evaluation of FPD:
The gravitational component is null due to horizontal orientation and the component due to acceleration being calculated by considering the void fraction () expression of [29].
G is the mass flux, which can be acquired by the following formula:
3. Results and Discussions
3.1. Preliminary Examination
To further bolster the legitimacy of experimental measurements, a single-phase validation has been adopted. These tests were run during R1234ze(E) liquid forced convection. The objective of such tests is twofold: to check the energy balance between the waterside and the refrigerant side, and to check the accuracy of the instrumented test section by comparing the experimental heat transfer coefficients against the values estimated by empirical correlations collected from the literature.
Single-phase tests were carried out with mass fluxes ranging from 200 to 600 kg m−2 s−1, at a mean pressure of about 8.3 bar, and with a mean inlet subcooling of approximately 15 K to ensure fully subcooled conditions at the inlet. The heat flow rate on the waterside can be calculated as previously explained, whereas, on the refrigerant side, it is evaluated as the product between the mass flow rate and the specific enthalpy difference between the inlet and outlet, each one evaluated with REFPROP10 [27] from the knowledge of the corresponding temperature and pressure.
Considering the tested working conditions, the deviation between the heat flow rate evaluated on the waterside and the one on the refrigerant side is within ±4.5%. This deviation is calculated as the difference in heat flow rate on the refrigerant side minus the value on the waterside divided by the heat flow rate on the waterside. The single-phase measurements also allow obtaining liquid forced convection heat transfer coefficients. According to Rossetto and Diani [30], the single-phase heat transfer coefficient in the case of a micro-finned tube can be evaluated as the one proposed by Gnielinski [31] for a smooth tube with the same inner diameter multiplied by the area enhancement ratio of the micro-finned tube. By adopting this procedure, the single-phase experimental heat transfer coefficients can be estimated with a mean relative deviation of 2.4% and a mean absolute deviation of 22.1%. Therefore, as both the energy balance and the single-phase heat transfer coefficients were successfully checked, the new instrumented test section is deemed suitable for the condensation tests.
Furthermore, an analysis is required to take into account the uncertainty of experimental acquisitions. In this case, the methodology of [32] where the uncertainty of the calculated parameter is assigned based on the independent parameters and their assigned uncertainties as
After concluding the analysis, the mean uncertainty of vapor quality and HTC are 0.03 and 3.6%, respectively.
Experimental condensation tests were carried out by varying the inlet vapor quality (from low to high values) at fixed mass velocities (G = 75, 100, 150, 200, 400, and 600 kg m−2 s−1) for saturation temperatures of 30 and 40 °C for R450A and 30 °C in the case of R454B. The mean vapor quality difference between the outlet and inlet section of the test module was 0.15 in the case of R450A and 0.10 in the case of R454B. This means that the collected heat transfer coefficients are averaged values representing a short vapor quality difference, and it was possible to catch their trend over the vapor quality interval of 0.1–0.95 by changing the inlet vapor quality.
3.2. Effect of Vapor Quality and Mass Flux
A preface is provided before the assessment of experimental results in the current and upcoming sections. To state the pellucid reasoning behind the discrepancies between the results of two refrigerants, five factual points concerning their thermophysical properties are hereby listed and will be cited in the upcoming sections (a complete list of such properties can be found in Table 2):
Table 2.
Thermophysical properties.
- Vapor density of 450A is 41% lower than R454B (average increment between 30 and 40 °C as saturation temperature).
- Surface tension of 450A is 52% higher than R454B (average increment between 30 and 40 °C as saturation temperature).
- Liquid viscosity of R450A is considerably higher than R454B.
- Higher saturation temperature implies higher vapor density.
- Higher saturation temperature implies lower liquid viscosity.
- Higher temperature glide of R454B.
The measured values of HTC are reported in Figure 4 as a function of vapor quality for different mass fluxes. The overall trend of the HTC values is identical for both refrigerants as the HTC elevates for higher vapor qualities. Regarding different mass fluxes, however, there is a large discrepancy in terms of the slope by which the trend varies at different vapor qualities. For instance, at low mass fluxes, the trend of HTC does not demonstrate a significant slope, while the trend at high mass fluxes conspicuously displays a large slope. The causality for this occurrence is quite deductive from the identification of a two-phase flow pattern whose role in deciding thermal performance is salient. It is noteworthy to refer to the flow pattern map of Doretti et al. [33] that is constructed for condensation inside micro-finned tubes based on a dimensionless Martinelli parameter (Xtt) and non-dimensional gas velocity (JV), whose expressions are provided in Equations (11) and (12).
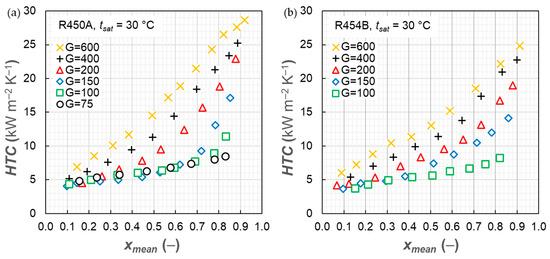
Figure 4.
Heat transfer coefficient versus vapor quality for various mass fluxes. (a) R450A and (b) R454B. G is expressed in [kg m−2 s−1].
Based on flow visualizations and experimentally collected HTCs, authors suggested a transition line that was given the name of critical non-dimensional gas velocity (J*V), whose expression can be found in Equation (13).
The transition line clearly demarcates the gravitationally controlled flow patterns (stratified and intermittent) from the ones controlled by shear stress (annular flow). Plotting the current data points on the abovementioned map (Figure 5) further ascertained that the slope of the HTC trend is directly related to the flow patterns. For the cases under study, the annular flow patterns are never observed below a mass flux of 100 kg m−2 s−1. Since there exists a large discrepancy between wall liquid thickness at gravitationally controlled regimes as opposed to annular flow regimes, the HTC values never undergo a large alteration at low mass fluxes, regardless of the changes in vapor quality. It is imperative to note that the legitimacy of the map suggested by Doretti et al. [33] has been further validated by [34] for the same test section in the current study.
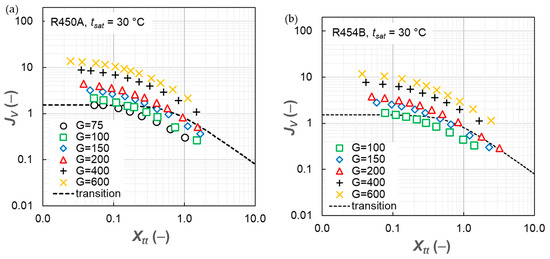
Figure 5.
Plotted data points on the flow pattern map of Doretti et al. [33]. (a) R450A and (b) R454B. G is expressed in [kg m−2 s−1].
Furthermore, in the observation of values for HTC, a more robust thermal performance of R450A compared to R454B, which becomes further differentiated at high vapor qualities, can be noticed. The aspect, in this case, stems from the previously categorized point number 1 by taking into account that the larger vapor density of R454B begets lower vapor velocity, insinuating lower shear stress forces inhibiting a transition to an annular flow pattern. In addition, referring to point number 2, it can be argued that the higher surface tension force of R450A, even at stratified regimes, assists the dragging of the liquid phase to the upper side of the wall and is ascribed to the swirling effect of the helical trend of fins, which ultimately improves liquid distribution at the wall.
Figure 6 illustrates the trend of FPD per unit length as a function of vapor quality for various mass fluxes. As evident, frictional losses increase with vapor quality and reach an acme before a sharp reduction in the driest conditions (vapor quality > 0.8), the causality for which can be related to the entrainment effect at very high vapor qualities. Similar to the trend of HTC, the slope by which the FPD increases is highly a function of mass flux for the same reasoning that was ascribed to flow patterns. Moreover, larger losses per unit length for R450A should be noted. This occurrence is attributable to points number 1 and 3, where the combination of predominant shear stress force and higher liquid viscosity considerably elevates the frictional losses.
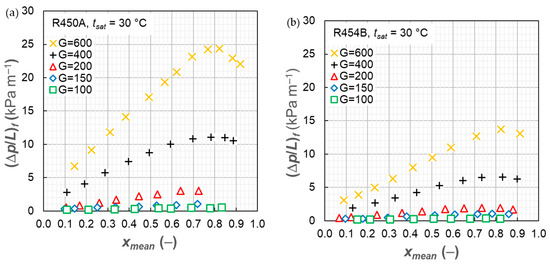
Figure 6.
Frictional pressure drop per unit length versus vapor quality for various mass fluxes. (a) R450A and (b) R454B. G is expressed in [kg m−2 s−1].
3.3. Effect of Saturation Temperature
To vividly depict the differences present for the two saturation temperatures, Figure 7, which depicts HTC and FPD (per unit length) as a function of vapor quality for various mass fluxes and two saturation temperatures, is constructed. Noticing point number 4, which results in lower shear stress force, explains the reasoning behind lower HTC values for higher saturation temperature. A combination of points 4 and 5 also provides the reasoning behind the lower measured FPD per unit length.
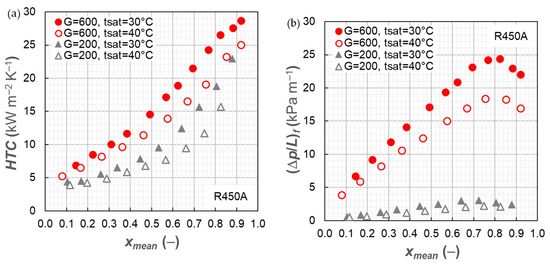
Figure 7.
Heat transfer coefficient and frictional pressure drop per unit length versus vapor quality for various mass fluxes and two saturation temperatures of 30° and 40°C (a) HTC and (b) FPD (per unit length). G is expressed in [kg m−2 s−1].
3.4. Empirical Models
Owing to their geometrical complexity compared to conventional tubes, micro-finned empirical models for the prediction of two-phase heat transfer coefficients should account for geometrical parameters beyond mere tube diameter. Cavallini et al. [24] developed a model based on a database of experimental heat transfer coefficients for micro-finned tubes ranging from 5.95 to 14.18 mm inner diameter and included the geometrical complexities by implementing two terms, namely Rx and C. While the former is merely a ratio of heat transfer areas in the case of the micro-finned tube to the smooth one, the latter is a coefficient that is based on whether the optimal number of fins have been implanted on the tube, a condition which is not met in the 5 mm OD tube under study. The optimum number of fins suggested by Cavallini et al. [24] is presented in Equation (14), and the procedure to calculate the coefficient in the case of incompatibility is given in Equation (15).
Furthermore, the correction of Bell and Ghaly [25] for mass transfer resistance in the mixture can be considered as well. In the current case, it has been explored whether such correction for mass transfer resistance and the optimal number of fins could ameliorate the accuracy of the predictions made. It should be noted that the vapor heat transfer coefficient required by the model of Bell and Ghaly’s correction [25] is acquired using the correlation of Gnielinski [31]. Figure 8 represents the deviation of predictions for different considerations made regarding the mass resistance correction and coefficient C equal to 1. Considering Table 3—which provides detailed information by stating the average relative deviation and average absolute deviation, whose expressions are given in Equations (16) and (17)—on average, the correlation benefits from the correction introduced by Bell and Ghaly [25].
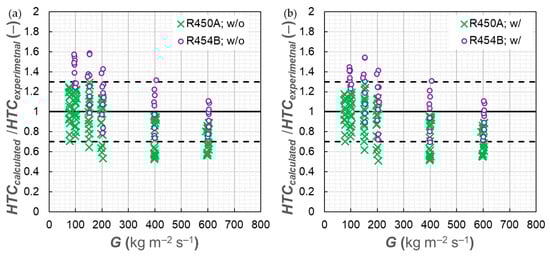
Figure 8.
Deviation of correlation of Cavallini et al. [24], considering the coefficient C equal to 1, without (w/o) (a) and with (w/) (b) the correction of Bell and Ghaly [25].
Table 3.
Average relative and absolute deviations for HTC.
Regarding frictional pressure drop predictions, two models, namely Rollman and Spindler [35] and Diani et al. [36], are taken into consideration. Both models developed for micro-finned tubes are expected to be suitable for the case under study. Figure 9 demonstrates the deviations for both models based on experimental data excluding values of FPD per unit of length below 0.4 kPa m−1 as a result of high experimental uncertainty. It is clear that both models provide fair predictions that are mainly underestimations, which, in the worst case, are, on average, as high as 20%. Considering a more detailed analysis of the deviations in Table 4, we could state that the models perform similarly for both refrigerants, as the deviations are comparable.
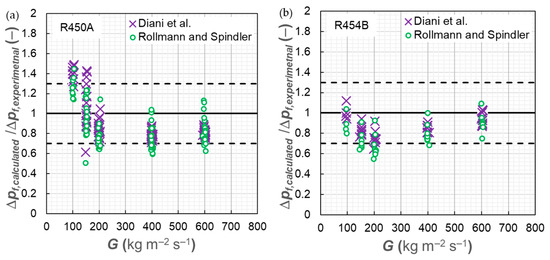
Figure 9.
Deviation of correlations of Rollman and Spindler [35] and Diani et al. [36]. (a) 450A (b) R454B.
Table 4.
Average relative and absolute deviations for FPD per unit length.
4. Conclusions
Amid current and prospective regulations mandating the use of low-GWP refrigerants, it is posited that mixtures of HFC/HFO could prove effective in short-term transition. Since solid information was not established on the flow condensation of micro-finned tubes for two zeotropic mixtures of R450A and R454B, the following paper conducted an experimental campaign to explore their heat transfer coefficient (HTC) and frictional pressure drop (FPD). The accuracy of previously constructed empirical models was also assessed with the help of experimental results. The new experimental measurements allowed for the enlargement of the worldwide database of heat transfer coefficients and frictional pressure gradients during condensation of new lower-GWP refrigerants inside enhanced tubes. These new data play a fundamental role in the validation and, eventually, in the update, of empirical models for the design of the next generation of condensers for HVAC&R equipment with lower carbon emissions. Furthermore, new techniques such as machine or deep learning models are in great demand of new data for their training and validation.
Overall, the outcome of the research is recapitulated and given as the following:
- The higher the mass flux, the higher the slope by which the values of HTC and FPD per unit length increase. This occurrence is related to prevailing flow patterns.
- R450A possesses higher HTC and FPD values as a result of inherent thermophysical properties that cause the vapor velocity to be considerably higher. The higher surface tension also plays a role in higher values of HTC for R450A.
- Higher saturation temperature entails higher vapor densities, which attenuates the vapor velocity and, consequently, the shear stress forces, therefore causing lower HTC values.
- The correction of Bell and Ghaly [25] can result in the amelioration of the HTC model developed by Cavallini et al. [24], especially for R454B due to its higher temperature glide. The coefficient C, implemented by Cavallini et al. [24] for an optimal number of fins, does not necessarily offer improved accuracies. Overall, the model of Cavallini et al. [24] offered fair predictions of HTC values.
- Both the FPD models of Rollman and Spindler [35] and Diani et al. [36] offer fair predictions for both refrigerants.
Author Contributions
Conceptualization, A.D.; validation, N.I. and A.D.; investigation, N.I. and A.D.; writing—original draft preparation, N.I.; writing—review and editing, L.R. and A.D.; supervision, L.R. and A.D.; funding acquisition, L.R. All authors have read and agreed to the published version of the manuscript.
Funding
This research was funded by the Italian Ministry of Education, Universities and Research-MUR, PRIN Project number 2017F7KZWS.
Institutional Review Board Statement
Not applicable.
Informed Consent Statement
Not applicable.
Data Availability Statement
Data are available in the figures. If readers want more information, more data will be available on request.
Acknowledgments
The support of Wieland-Werke AG and Michael Schuster, from Wieland-Werke AG, for this research activity is also gratefully acknowledged.
Conflicts of Interest
The authors declare no conflict of interest. The funders had no role in the design of the study; in the collection, analyses, or interpretation of data; in the writing of the manuscript; or in the decision to publish the results.
Nomenclature
| A | Inner area at the fin tip [m2] |
| dev | Deviation |
| g | Gravity acceleration [m s−2] |
| G | Mass velocity [kg m−2 s−1] |
| h | Fin height [m], specific enthalpy [J kg−1] |
| HTC | Heat transfer coefficient [W m−2 K−1] |
| i | Uncertainty |
| ID | Inner diameter at the fin tip [m] |
| J | Dimensionless velocity [–] |
| J* | Dimensionless velocity [–] |
| L | Length [m] |
| Mess flow rate [kg s−1] | |
| n | Number of fins [–] |
| P | Pressure [Pa] |
| q | Heat flow rate [W] |
| T | Temperature [°C] |
| x | Vapor quality [kg kg−1] |
| Xtt | Martinelli parameter [–] |
| z | Coordinate [m] |
| Greek symbols | |
| α | Void fraction [–] |
| δ | Wall thickness [m] |
| Δ | Difference [–] |
| λ | Thermal conductivity [W m−1 K−1] |
| μ | Dynamic viscosity [Pa s] |
| ρ | Density [kg m−3] |
| σ | Surface tension [N m−1] |
| Subscripts | |
| a | Momentum |
| abs | absolute |
| exp | Experimental |
| f | Frictional |
| HT | Heat transfer |
| i | i-th component |
| L | Liquid phase |
| opt | Optimal |
| REF | Refrigerant |
| rel | Relative |
| V | Vapor/gas phase |
References
- Schulz, M.; Kourkoulas, D. Regulation (EU) No 517/2014 of the European Parliament and of the Council of 16 April 2014 on fluorinated greenhouse gases and repealing Regulation (EC) No 842/2006. J. Eur. Union. 2014, 2014, L150. [Google Scholar]
- Nair, V. HFO refrigerants: A review of present status and future prospects. Int. J. Refrig. 2021, 122, 156–170. [Google Scholar] [CrossRef]
- McLinden, M.O.; Kazakov, A.F.; Brown, J.S.; Domanski, P.A. A thermodynamic analysis of refrigerants: Possibilities and tradeoffs for Low-GWP refrigerants. Int. J. Refrig. 2014, 38, 80–92. [Google Scholar] [CrossRef]
- Minor, B.; Fluoroproducts, D. HFO-1234yf low GWP refrigerant for MAC applications. In Proceedings of the Mobile AC Climate Protection Partnership Meeting, US EPA, Washington, DC, USA, 9 December 2008. [Google Scholar]
- Mota-Babiloni, A.; Navarro-Esbrí, J.; Molés, F.; Cervera, A.B.; Peris, B.; Verdú, G. A review of refrigerant R1234ze(E) recent investigations. Appl. Therm. Eng. 2016, 95, 211–222. [Google Scholar] [CrossRef]
- Mota-Babiloni, A.; Navarro-Esbrí, J.; Barragán-Cervera, A.; Molés, F.; Peris, B. Experimental study of an R1234ze(E)/R134a mixture (R450A) as R134a replacement. Int. J. Refrig. 2015, 51, 52–58. [Google Scholar] [CrossRef]
- Mota-Babiloni, A.; Makhnatch, P. Predictions of European refrigerants place on the market following F-gas regulation restrictions. Int. J. Refrig. 2021, 127, 101–110. [Google Scholar] [CrossRef]
- Honeywell International Inc. Available online: https://www.honeywell-refrigerants.com/europe/product/solstice-n13/ (accessed on 13 December 2023).
- Honeywell International Inc. Available online: https://www.honeywell-refrigerants.com/europe/product/solstice-454b-r-454b/ (accessed on 13 December 2023).
- Jajja, S.A.; Nawaz, K.; Fricke, B.A. In tube condensation heat transfer and pressure drop for R454B and R32—Potential replacements for R410A. Int. J. Refrig. 2022, 144, 238–253. [Google Scholar] [CrossRef]
- Jajja, S.A.; Fricke, B.A.; Nawaz, K. Condensation heat transfer and pressure drop of low-global warming potential refrigerants in smooth aluminum tubes. Appl. Therm. Eng. 2024, 237, 121774. [Google Scholar] [CrossRef]
- Jacob, T.A.; Fronk, B.M. A heat transfer model to predict superheated and saturated condensation of HFC/HFO refrigerant mixtures. Int. J. Heat Mass Transf. 2021, 170, 120947. [Google Scholar] [CrossRef]
- Morrow, J.A.; Derby, M.M. Flow condensation heat transfer and pressure drop of R134a alternative refrigerants R513A and R450A in 0.95-mm diameter minichannels. Int. J. Heat Mass Tran. 2022, 192, 122894. [Google Scholar] [CrossRef]
- Azzolin, M.; Berto, A.; Bortolin, S.; Del Col, D. Condensation heat transfer of R1234ze(E) and its A1 mixtures in small diameter channels. Int. J. Refrig. 2022, 137, 153–165. [Google Scholar] [CrossRef]
- Diani, A.; Liu, Y.; Wen, J.; Rossetto, L. Experimental investigation on the flow condensation of R450A, R515B, and R1234ze (E) in a 7.0 mm OD micro-fin tube. Int. J. Heat Mass Transf. 2022, 196, 123260. [Google Scholar] [CrossRef]
- Mehendale, S.S.; Jacobi, A.M.; Shah, R.K. Fluid flow and heat transfer at micro-and meso-scales with application to heat exchanger design. Appl. Mech. Rev. 2000, 2000, 175–193. [Google Scholar] [CrossRef]
- Shah, R.K.; Sekulic, D.P. Fundamentals of Heat Exchanger Design; John Wiley & Sons: Hoboken, NJ, USA, 2003. [Google Scholar]
- Molinaroli, L.; Lucchini, A.; Colombo, L.P.M. Drop-in analysis of R450A and R513A as low-GWP alternatives to R134a in a water-to-water heat pump. Int. J. Refrig. 2022, 135, 139–147. [Google Scholar] [CrossRef]
- Gataric, P.; Lorbek, L. Evaluating R450A as a drop-in replacement for R134a in household heat pump tumble dryers. Int. J. Refrig. 2012, 128, 22–33. [Google Scholar] [CrossRef]
- Panato, V.H.; Marcucci Pico, D.F.; Bandarra Filho, E.P. Experimental evaluation of R32, R452B and R454B as alternative refrigerants for R410A in a refrigeration system. Int. J. Refrig. 2022, 135, 221–230. [Google Scholar] [CrossRef]
- Makhnatch, P.; Mota-Babiloni, A.; Khobadandeh, R. Experimental study of R450A drop-in performance in an R134a small-capacity refrigeration unit. Int. J. Refrig. 2017, 84, 26–35. [Google Scholar] [CrossRef]
- Zaki, O.M.; Abdelaziz, O. Critical assessment of R410A alternatives for mini-split air conditioners in the Egyptian market. Energy Built Environ. 2024, 5, 426–445. [Google Scholar] [CrossRef]
- Sieres, J.; Ortega, I.; Cerdeira, F.; Alvarez, E. Drop-in performance of the low-GWP alternative refrigerants R452B and R454B in an R410A liquid-to-water heat pump. Appl. Therm. Eng. 2021, 182, 116049. [Google Scholar] [CrossRef]
- Cavallini, A.; Del Col, D.; Mancin, S.; Rossetto, L. Condensation of pure and near-azeotropic refrigerants in microfin tubes: A new computational procedure. Int. J. Refrig. 2009, 32, 162–174. [Google Scholar] [CrossRef]
- Bell, K.J.; Ghaly, M.A. An approximate generalized design method for multicomponent/partial condensers. AIChE Symp. Ser. 1972, 1972, 72–79. [Google Scholar]
- Mancin, S.; Diani, A.; Rossetto, L. Flow boiling heat transfer, dewetting-rewetting, and dryout visualization of HFOs in an asymmetrically heated rectangular plain channel. Appl. Therm. Eng. 2015, 107, 960–974. [Google Scholar] [CrossRef]
- Lemmon, E.W.; Huber, M.L.; McLinden, M.O. NIST Standard Reference Database 23, NIST Reference Fluid Thermodynamic and Transport Properties, REFPROP, version 10.0; Standard Reference Data Program, National Institute of Standards and Technology: Gaithersburg, MD, USA, 2018. [Google Scholar]
- Liu, Y.; Rossetto, L.; Diani, A. Flow Boiling of R450A, R515B, and R1234ze(E) Inside a 7.0 mm OD Microfin Tube: Experimental Comparison and Analysis of Boiling Mechanisms. Appl. Sci. 2022, 12, 12450. [Google Scholar] [CrossRef]
- Rouhani, S.Z.; Axelsson, E. Calculation of void volume fraction in the subcooled and quality boiling regions. Int. J. Heat Mass Transf. 1970, 13, 383–393. [Google Scholar] [CrossRef]
- Rossetto, L.; Diani, A. Prediction of Friction Factor and Heat Transfer Coefficient for Single-Phase Forced Convection Inside Microfin Tubes. Energies 2023, 16, 4053. [Google Scholar] [CrossRef]
- Gnielinski, V. On heat transfer in tubes. Int. J. Heat Mass Transf. 2013, 63, 134–140. [Google Scholar] [CrossRef]
- Kline, S.J.; McClintock, F.A. Describing the uncertainties in single-sample experiments. Mech. Eng. 1953, 75, 3–8. [Google Scholar]
- Doretti, L.; Zilio, C.; Mancin, S.; Cavallini, A. Condensation flow patterns inside plain and microfin tubes: A review. Int. J. Refrig. 2013, 36, 567–587. [Google Scholar] [CrossRef]
- Irannezhad, N.; Rossetto, L.; Diani, A. A comprehensive study with high-speed camera assisted visualizations of HFO- 1234ze(E) condensation inside an enhanced tube. accepted to Int. Comm. Heat Mass Tran. 2024, 150, 107203. [Google Scholar] [CrossRef]
- Rollmann, P.; Spindler, K. New models for heat transfer and pressure drop during flow boiling of R407C and R410A in a horizontal microfin tube. Int. J. Therm. Sci. 2016, 103, 57–66. [Google Scholar] [CrossRef]
- Diani, A.; Mancin, S.; Rossetto, L. R1234ze (E) flow boiling inside a 3.4 mm ID microfin tube. Int. J. Refrig. 2014, 47, 105–119. [Google Scholar] [CrossRef]
Disclaimer/Publisher’s Note: The statements, opinions and data contained in all publications are solely those of the individual author(s) and contributor(s) and not of MDPI and/or the editor(s). MDPI and/or the editor(s) disclaim responsibility for any injury to people or property resulting from any ideas, methods, instructions or products referred to in the content. |
© 2023 by the authors. Licensee MDPI, Basel, Switzerland. This article is an open access article distributed under the terms and conditions of the Creative Commons Attribution (CC BY) license (https://creativecommons.org/licenses/by/4.0/).