Abstract
Permeability is a key transport property of porous materials, and its accurate evaluation is relevant when studying applied tasks, such as CO2 injection into reservoirs and investigating groundwater quality. This study examines the dependence of permeability on total and connected porosity, hydraulic tortuosity, specific surface area, and mean pore radius based on the data of 408 cubic sub-volumes extracted from heterogeneous and naturally fractured cylindrical carbonate samples, before and after injection of HCl solutions. These parameters were computed using pore-scale modeling of fluid flow. Our results show that permeability correlates well with porosity and mean pore radius, with correlation coefficients of for heterogeneous samples. It was found that the presence of natural fractures significantly influenced the relationship between permeability and other parameters. The relationship between permeability , tortuosity , and specific surface area is described by the power laws and , with coefficients and substantially exceeding those in the Kozeny–Carman equation. It was also found that there is a parabolic relationship between connected and total porosities, both before and after rock dissolution with . This allowed for an estimation of percolation threshold porosity in accordance with the literature data.
1. Introduction
Absolute permeability plays a crucial role when studying fluid flow in a porous medium during the development of oil and gas reservoirs, the injection of CO2 into reservoirs for further storage, the migration of contaminants in underground aquifers, and the flow of gases in catalytic systems. It presents the macroscopic characteristics of a porous medium, which depend on its microscopic and macroscopic properties. Absolute permeability is usually measured under laboratory conditions on a limited number of rock samples. In practical applications, specific relationships between and other properties of the porous medium are necessary. The Kozeny–Carman (K–C) equation is a widely used relationship which relates to the porosity , specific surface area, and tortuosity of a porous medium [1,2,3,4]. However, the K–C equation predicts incorrect values for many porous materials [2,5,6] and, consequently, various modifications have been developed [3,4,6,7,8,9,10].
The most widely used equations describe the relationship between and () [11,12,13,14,15], connected porosity (), and percolation threshold porosity () [4,6,8,16,17,18,19,20,21]. In the abovementioned equations, is the power exponent. In addition, an equation is used to describe the relationship between and , where is the characteristic length of the porous medium [22,23,24,25,26].
The equation is often used to describe the evolution of the relationship between permeability and porosity during rock dissolution [11,12,13,14,15,27,28] to predict the increase in as changes. Several experimental studies on carbonate dissolution indicated that the fitting of experimental data using the equation led to significantly higher values of compared to obtained in the K–C equation [12,13,15,27]. High values of are explained by the formation of wormholes in rock samples as acid solutions interact with carbonate rocks. Moreover, many authors noted that the values of change as the rock dissolves [13,14,15,28,29]. Nogues et al. presented the dependence of the exponent on porosity during rock dissolution [29].
Bernabe et al. first mentioned the idea of using the percolation threshold porosity to describe the dependence of permeability on porosity while studying the hot pressing of calcite [7]. Later, this idea was implemented to describe the relationship between permeability and porosity using the equation to study fluid flow in spherical packing [4] and the hot pressing of calcite aggregates [6]. This equation better describes the dependence of permeability on porosity at .
The percolation threshold porosity —is the value of porosity below which the pore network becomes disconnected, and therefore its permeability vanishes. It can be determined from the dependencies and . Zhang et al. found values of and , correspondingly, equal to 4% and for calcite aggregates [6], while N. S. Martys et al. amounted to these values to be 3–9% and , respectively, for spherical packing [4]. Different authors have obtained values of for limestone samples [17], young sea ice [18], natural microgranite [19], Fontainebleau sandstone [20], fused glass packing, hot-pressed calcite and , respectively [8], and porous media with randomly placed identical squares [16].
There is also a study in the literature of the relationship between and the characteristic length of a porous medium [18,24,25,26,30]. A critical pore radius is often used, which is determined during the injection of a nonwetting liquid into rock samples under laboratory conditions [24,25,26]. Katz and Thompson considered as the size corresponding to the percolation threshold of the electrical conductivity of porous media [30]. Nishiyama and Yokoyama studied 17 sandstone samples and 1 limestone sample, which were subjected to air displacement of water to determine [25]. As a result of this, relationships were built between , , transport porosity , and factor. Their results indicated that the permeability of the studied samples correlated better with than with porosity . This relationship was expressed as , where means transport porosity, defined as the total porosity without dead-end pores [25]. They examined the applicability of this relationship to describe the permeability of other porous media, and found that this relationship works well for these media as well. They also found that by fitting the hydraulic tortuosity from the K–C equation, a better correlation can be achieved, which is described with the equation .
A review of the previous studies on the subject of this article proved the following: (1) the relationship between and requires comprehensive study; (2) most studies available have been conducted using sandstone, volcanic rock, or artificial or ideal porous materials; (3) each study was conducted on a small number of samples; and (4) the effect of rock dissolution on the relationships between permeability, porosity, tortuosity, and specific surface area has been little studied.
This paper studies the relationship between permeability, total and connected porosity, hydraulic tortuosity, specific surface area, and mean pore radius based on data from 408 cubic sub-volumes selected from heterogeneous and naturally fractured cylindrical carbonate samples, before and after injection of hydrochloric acid (HCl) solutions. In addition, the percolation threshold porosity for all samples was determined based on the relationship between the connected and total porosity. The microscopic and macroscopic characteristics of the sub-volumes were obtained through pore-scale modeling.
2. Materials and Methods
2.1. Sample Characterization
Four cylindrical samples (#1–#4) were extracted from the core of one of the carbonate oilfields of the Republic of Tatarstan. The diameter and length of the samples are about 3 and 5 cm, respectively. The study of the mineral composition using a Bruker D2 Phaser X-ray diffractometer (Bruker, Billerica, MA, USA) [31] showed that all samples were limestones almost completely composed of calcite, and the quartz content did not exceed 1% (see Table 1). This allowed us to exclude the influence of the mineral heterogeneity of the samples on rock dissolution.

Table 1.
The main characteristics of the studied samples.
The samples were cleaned of oil and bitumen on a Soxhlet apparatus using an alcohol–benzene mixture, after which they were kept in distilled water to remove water-soluble salts. Next, the samples were dried at a temperature of 104 °C until the change in their mass did not exceed 0.01 g.
Table 1 shows the porosity and permeability of the samples. The porosity was determined by the liquid saturation method, and the permeability was calculated using Darcy’s law [32].
2.2. Experimental Methods
The experimental procedure involved cleaning each sample from oil, bitumen, and water-soluble salts, saturating it with a 2% NaCl solution, and maintaining it for 12 h at a temperature of 20 °C and a pressure of 3 MPa (reservoir conditions) [31]. Then, each sample was scanned using an X-ray microcomputed tomography General Electric V|tome|X S240 (Baker Hughes, Houston, TX, USA) at a resolution of about 18 µm before injecting HCl solution.
Flow-through experiments involving the injection of 2% sodium chloride (NaCl) and hydrochloric acid (HCl) solutions were conducted using the electronic rock testing unit Wille Geotechnik Y1000 (Wille Geotechnik, Rosdorf, Germany). This unit facilitates the measurement of sample permeability before and after dissolution with HCl solutions under reservoir conditions. The experimental setup is illustrated in Figure 1. The sample was installed in the Hassler cell, valves V3 and V4 were opened to inject a 2% NaCl solution through the sample, and the drop in pressure at the ends of the sample was measured at three constant injection rates after stabilization. Subsequently, valves V3 and V4 were closed, and valves V1 and V2 were opened for the injection of HCl solution until the breakthrough. Following the injection of the HCl solution, a 2% NaCl solution was reinjected into the sample, and the drop in pressure at the ends of the sample was measured at three constant injection rates after stabilization. All experimental data were recorded on a computer. After each experiment, the pressure was released, the sample was removed from the core holder unit, and the injection lines were flushed. Then, the sample was scanned with X-ray microcomputed tomography after dissolution with HCl solution.
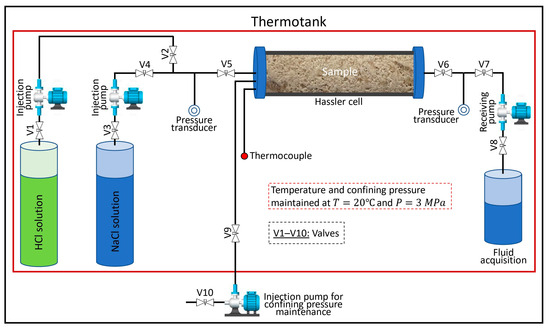
Figure 1.
Schematic of the experimental setup.
The water permeability of the samples was calculated using Darcy’s law. A constant temperature of 20 °C and a confining pressure of 3 MPa were maintained throughout the experiment. Table 2 contains the permeability data of the samples before and after their dissolution with HCl solutions, and the data on the injection rate and mass concentration of HCl in the solution.
Table 2.
Flow conditions of HCl through the samples and permeability of samples after injection.
2.3. Pore Network Modeling
To increase the number of samples, we extracted sub-volumes from each sample before (Figure 2a) and after (Figure 2b) their dissolution, as illustrated in Figure 2. The extraction of sub-volumes was performed using Avizo® Software 2019.1 [33]. The physical volume of each sub-volume equals ~83 mm3, and this exceeds the representative elementary volume (REV) for each sample (Figure 3). Most importantly, the identity of each sub-volume and location of extraction from 3D digital sample models was ensured, corresponding to its state before and after the injection of HCl solutions, so that it was possible to compare the characteristics of sub-volumes before and after rock dissolution. The ejected sub-volumes were either impermeable or coincident/intersected with wormholes. Thus, 408 sub-volumes were completely extracted from all considered samples (see Table 3).
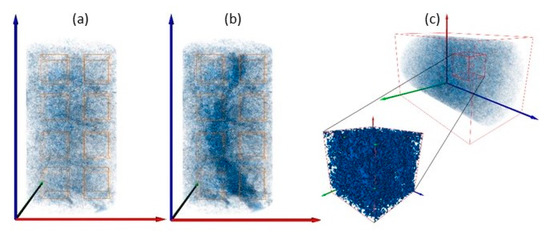
Figure 2.
Schematic illustration of the extraction process of sub-volumes from a cylindrical sample: (a) before injection; (b) after injection; (c) enlarged sub-volume.

Figure 3.
Selection of volumes (left) and porosity of the volumes (right) for samples #1–#4 before injection of HCl solutions.
Table 3.
Number of sub-volumes extracted from cylindrical samples.
Once the sub-volumes from all cylindrical samples were extracted, pore network modeling (PNM) was carried out using Avizo® [33]. Avizo® is a powerful software that allows users to process X-ray microcomputed tomography images and build 3D digital models of samples, as well as to perform PNM of the fluid flow to determine the microscopic and macroscopic properties of samples [34,35]. As a consequence of PNM, the total and connected porosity, specific surface area, radius of all and only connected pores, hydraulic tortuosity, and absolute permeability were computed. Avizo® automatically computes the absolute permeability using Darcy’s law, the applicability of which was confirmed by calculations on several randomly chosen sub-volumes (Figure 4). All computations were conducted on the following boundary conditions: the inlet pressure was 1.3 atm and the outlet pressure was 1.0 atm, and at the other boundaries of the sub-volume, the no-flow condition was set. Water was used as the working fluid, the viscosity of which is 1 mPa·s at room temperature.

Figure 4.
Simulations of liquid flow at different pressure drops for randomly selected sub-volumes of each sample before (left) and after (right) the injection of HCl solutions.
3. Results and Discussion
3.1. Change in Pore Space Due to Rock Dissolution
Before building a 3D model of the samples, images of their slices were analyzed for the presence of any features (Figure 5 and Figure 6). Figure 5 shows the original and segmented images of the inlet, middle, and outlet slices of sample #2 before (Figure 5a) and after (Figure 5b) the injection of HCl solutions. As shown in Figure 5, sample #2 has three natural vertical fractures, which are indicated by red lines. As can be seen from Figure 5a, there is only one fracture present on each slice of the sample, which indicates their short length along the length of the sample.
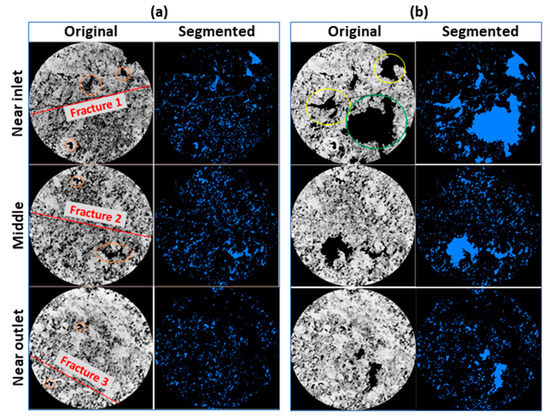
Figure 5.
Original and segmented images of the inlet (upper), middle (middle), and outlet (lower) slices of sample #2 before (a) and after (b) injection of HCl solution. Red and orange lines indicate natural fractures and vugs, respectively. Yellow and green lines indicate secondary and main wormholes, respectively.

Figure 6.
Original and segmented images of inlet slices of samples #1 (a), #3 (b), and #4 (c) before (upper) and after (lower) injection of HCl solution.
To remove noises from the original images obtained using X-ray microcomputed tomography, a median filter was used [36]. It can be seen from Figure 5 and Figure 6 that there is a good visual match of the processed images with the original images of sample slices.
Figure 5 also indicates that, unlike the other samples (Figure 6), sample #2 also has vugs of different sizes (Figure 5a), which are marked with orange lines. Note that the pore spaces on the original and segmented images are marked in black and blue, respectively. The presence of fractures and vugs in the inlet slice of sample #2 caused the formation of secondary wormholes (yellow lines, Figure 5b), along with a main wormhole (green line, Figure 5b) that broke through in the outlet slice of the sample (Figure 7). Due to the presence of natural fractures in sample #2, it will be considered separately from the other samples. Thus, samples #1, #3, and #4 will be considered as heterogeneous samples, and sample #2 will be considered as naturally fractured.

Figure 7.
Three-dimensional digital models of samples #1–#4 before and after injection of HCl solutions.
The built 3D models of the samples before and after the injection of HCl solutions are shown in Figure 7. The injection of solutions was carried out from the bottom up. As shown in Figure 7, as a result of the dissolution of the carbonate rock, conical wormholes were formed, which led to a several-times increase in the permeability of the samples over the initial values (see Table 3). Samples #1 and #4 show face dissolution near the inlet slice at low injection rates. Pore volumes of HCl solutions of 2.4 to 4.4 were required for breakthrough (see Table 3). The largest increases in permeability (8.81 and 9.11 times) were observed in samples #2 and #4 at solution injection rates of 8 and 4 mL/min, respectively.
As shown above, a total of 408 sub-volumes were extracted from all the considered cylindrical samples. To provide a more detailed visual evaluation of the effect of rock dissolution on the pore structure, Figure 8 illustrates the pore space of three randomly selected sub-volumes extracted from each cylindrical sample before and after HCl solutions were injected. Note that Figure 8 shows only interconnected pores, which play a key role in fluid flow and the formation of permeability. As shown in Figure 8, noticeable changes in the pore space due to rock dissolution occurred in samples #2–#4, which led to relatively large increases in their permeability (see Table 3). From Figure 8, we also note that in the sub-volumes extracted from samples #2 and #3, a significant increase in the number of interconnected pores is observed as a result of the injection of HCl solutions. In addition, if before the injection of solutions the connected pore space occupied only a certain part of the sub-volumes, then after the rock dissolution, it already occupies almost the entire part. This contributes to a significant increase in the conductance of sub-volumes and a decrease in the tortuosity of the flow path.

Figure 8.
Connected pore space of randomly selected sub-volumes extracted from samples #1 (a), #2 (b), #3 (c) and #4 (d) before and after injection of HCl solutions.
3.2. Connected vs. Total Porosity
Porosity is one of the important properties of a porous medium, and is defined as the ratio of pore volume to the total sample volume. Connected porosity is defined by the ratio of the volume of interconnected pores to the total sample volume, and, as a rule, . Some studies have shown that there is a relationship between and [16,18,37], which allows the percolation threshold porosity to be found [37]. The is the porosity at which the fluid begins to flow [21]. The porous medium becomes impermeable below . Percolation threshold porosity is usually determined based on the relationship , where is the power exponent [4,6,8,19,20,21]. This relationship is often used as sufficient data on total porosity and absolute permeability are collected during the numerous laboratory studies carried out on cores. The percolation threshold porosity can also be determined if the relationship between connected and total porosity is available [16,18,37]. In this study, is defined as the positive root of the equation , the value of which is given in Table 4.
Table 4.
Percolation threshold porosity of different porous materials.
The study of the pore structure of young sea ice [18] and basaltic clasts [37] using microcomputed tomography showed that the dependence of the connected porosity on the total porosity obeys a power law according to the percolation theory , where is the power exponent. Koponen et al. approximated the relationship between the connected and total porosities using a cubic polynomial , where [16]. Figure 9 shows the dependence of connected porosity on total porosity for sub-volumes from heterogeneous and naturally fractured samples. Blue circles and orange squares correspond to sub-volumes before and after their dissolution. The colored solid lines indicate the best-fitting curves of the relationship between the connected and total porosity, with a correlation coefficient . The fitting equation has the following form: where , and are the fitting coefficients, the values of which are given in Figure 9.

Figure 9.
Connected and total porosities of sub-volumes extracted from heterogeneous (a) and naturally fractured (b) samples before and after rock dissolution.
As can be seen from Table 4, the values of for heterogeneous and fractured carbonate samples before and after their dissolution are close to 5.9%, which is determined during an experimental study of the dissolution of carbonate samples [17]. There is a decrease in after dissolution, except for a slight increase for the fractured sample, indicating that pore connectivity is increased due to the formation of new channels during rock dissolution. The largest change, ~60%, was observed for a heterogeneous sample.
3.3. Permeability vs. Porosities
Figure 10 demonstrates the distribution of absolute permeability of sub-volumes on total and connected porosities. In this figure, round and square symbols indicate the permeability of sub-volumes before and after their dissolution for heterogeneous (Figure 10a–c) and naturally fractured (Figure 10d–f) samples, respectively. To establish relationships between permeability and porosity, our data were fitted using the equations , , and (Figure 10, solid lines). The values of for heterogeneous and naturally fractured samples have been taken from Table 4.

Figure 10.
Permeability vs. total (a,d), percolation threshold (b,e), and connected (c,f) porosities.
Figure 10 indicates that, due to rock dissolution, not only did porosity and permeability increase, but the coefficients and also changed. For example, for a heterogeneous sample, before its dissolution, if the relationship between permeability and total porosity (Figure 10a) is described by the equation , then after dissolution this equation takes the form of . A similar trend is observed for fractured samples and equations and (Figure 10b–f). Therefore, this means that due to rock dissolution, the properties of the samples changed. In other words, the change due to rock dissolution must be considered when modeling fluid flow at larger scales. We also note that the values of the power exponent obtained in this study are significantly larger than the exponent in the K–C equation, in which . High values of for the carbonate samples considered may be due to the natural rock samples having a more complex pore structure compared to the ideal porous materials, for which the K–C equation works well. Other studies have also shown higher values of [11,13,15]. For example, Noiriel obtained for the dissolution of a cylindrical limestone sample during the injection of CO2 [13]. Voltolini and Ajo-Franklin fitted permeability and porosity data during the dissolution of a limestone sample by CO2 with the equation , for which [15].
Figure 10 demonstrates that there is a large scattering of the permeability distribution of sub-volumes extracted from the naturally fractured sample (Figure 10d–f) compared to the distributions for heterogeneous samples (Figure 10a–c), indicating that the relationship between permeability and porosity is weak in the case of naturally fractured samples. Consequently, for such samples, the permeability should be evaluated considering other properties of the rock. However, the scattering of data in the permeability distribution for naturally fractured sample decreased after rock dissolution, which can be seen from the improvement in the correlation coefficient (Figure 10d–f). This means that as the rock dissolves, the relationship between permeability and porosity becomes stronger. The correlation coefficients of all types of equations used for heterogeneous samples range from 0.64 to 0.78 (Figure 10a–c), while for a fractured sample this coefficient has significantly low values of 0.14–0.36 (Figure 10d–f).
The sub-volumes extracted from naturally fractured samples have higher permeabilities (Figure 10d–f) compared to heterogeneous samples (Figure 10a–c) at relatively low porosities. Figure 10 also demonstrates that, for heterogeneous samples, the equations and can better describe the sharp decrease in absolute permeability at low porosities (Figure 10a,c,e, solid lines) compared to the equation .
3.4. Permeability vs. Tortuosity and Specific Surface Area
According to the K–C equation, permeability is not only a function of porosity, but also of hydraulic tortuosity and specific surface area [1,3,5,38]. Permeability is inversely proportional to the square of and . The K–C equation was employed for an ideal porous medium, and many studies have shown that permeabilities calculated using this equation do not agree with the measured permeability of various rocks. Therefore, some modifications have been proposed in the literature [3,5,9,39,40].
Figure 11 demonstrates the dependence of the permeability of sub-volumes on (Figure 11a,c) and (Figure 11b,d) for heterogeneous and naturally fractured samples before and after their dissolution. As shown in Figure 11, there is a clear relationship between permeability and and . These relationships can be best described by power laws and , where and are the power exponents for and , respectively.

Figure 11.
Permeability vs. (a,c) and (b,d).
The values of and are much higher than those in the K–C equation: varies from 8.5 to 40.1 (Figure 11a,c), and from 5.1 to 17.1 (Figure 11b,d). Li et al. also showed that there is a good power law relationship between and , with the power exponent varying between 3.46 and 8.24 for sub-samples of anisotropic and heterogeneous tight sandstone [41]. Nishiyama and Yokoyama also obtained a power law relationship between permeability and tortuosity [25] for various granular porous materials. Values of and much greater than 2 indicate that the K–C equation is not an effective tool for predicting the absolute permeability of natural rock samples. Figure 11 also indicates the larger scattering in the distribution of for the naturally fractured sample.
3.5. Permeability vs. Mean Pore Radius
We also computed the mean pore radius for each sub-volume extracted from heterogeneous and fractured samples to study its relationship with absolute permeability. Along with other properties, the pore radius plays a key role in the evaluation of the permeability of porous media. For example, if we assume that a porous medium consists of many capillary tubes (pores) with a radius , then the permeability of this porous medium can be calculated by following the relationship Obviously, the permeability is sensitive to the pore radius. In the literature, the equation is used to describe the relationship between and for various porous media, where is the characteristic length of a porous medium [22,23,24,25,26]. Nishiyama and Yokoyama presented the equation to describe the relationship between the permeability, porosity, and critical pore radius of various artificial and natural porous materials [25]. It should be stated that below we use the mean radius of interconnected pores, , and all pores, (interconnected + unconnected).
Figure 12 illustrates the permeability of sub-volumes from all samples before and after their dissolution versus (Figure 12a,c) and (Figure 12b,d). Figure 12a,c show that the relationship between permeability and can be described well using the power law, especially for heterogeneous samples, where and are the power exponent and coefficient of proportionality, respectively. As can be seen from Figure 12, varies from 1.87 to 4.77 before and from 2.94 to 4.29 after rock dissolution, respectively. As it turns out, the relationship is stronger compared to the relationship (Figure 12a) for heterogeneous samples, which can be seen from the higher coefficients of correlation of the equation (Figure 12b). Figure 6 demonstrates that the mean pore radius is also one of the important factors that significantly affect the permeability of a porous medium.

Figure 12.
Permeability vs. (a,c) and (b,d).
4. Conclusions
This paper analyzed the main characteristics of 408 cubic sub-volumes extracted from heterogeneous and naturally fractured carbonate samples before and after injecting HCl solutions.
An analysis of X-ray microcomputed tomography images of the sample slices showed the presence of natural fractures and vugs in sample #2, which contributed to the formation of secondary wormholes. The results also showed that the largest increases in permeability occurred in sub-volumes with poor pore connections before the injection of HCl solutions.
It has been shown that the absolute permeability of sub-volumes from heterogeneous samples correlates well with porosities both before and after the injection of HCl solutions. However, the best correlation was observed between and the factors and , with correlation coefficients . This indicates that the mean pore radius, in combination with porosity, significantly influences the permeability of the porous medium. This is advantageous as the mean pore radius and porosity can be determined relatively easily.
As the results indicate, the presence of natural fractures noticeably affected the relationship between and other parameters of the porous medium, resulting in a low value of approximately 0.15. However, an improvement in the correlation can be observed after rock dissolution, with an value of approximately 0.35. The results also highlight that for the considered samples, the relationship between and the other parameters changes shape after rock dissolution; i.e., the coefficient and the power exponent have different values before and after rock dissolution.
The relationship between , , and specific surface area is described by power laws and , where ranges from 8.5 to 40.1 and ranges from 5.1 to 17.1, significantly exceeding the values in the Kozeny–Carman equation ().
The results demonstrate that the relationship between connected and total porosity is described well by the parabolic equation both before and after rock dissolution, giving high correlation coefficients . The percolation threshold porosity values found in this article align well with those reported in [31], and are approximately three times higher than the values for sandstones. It has been shown that, as a result of rock dissolution, the connectivity between pores increases for heterogeneous samples, as evident from the decrease in the percolation threshold porosity.
The results suggest that if the dissolution process has similar effects on pore connectivity in different rock types, this may provide clues about the degree of transferability of the results. This aspect deserves further research.
Author Contributions
Conceptualization, B.K.A. and B.I.; methodology, B.K.A.; software, D.A.B. and K.S.U.; validation, Z.K.A., G.I.I. and K.S.U.; formal analysis, D.A.B.; investigation, Z.K.A.; resources, D.A.B.; data curation, B.K.A.; writing—original draft preparation, Z.K.A. and B.I.; writing—review and editing, Z.K.A.; visualization, K.S.U.; supervision, B.K.A.; project administration, G.I.I.; funding acquisition, B.K.A. All authors have read and agreed to the published version of the manuscript.
Funding
This research was funded by the Science Committee of the Ministry of Science and Higher Education of the Republic of Kazakhstan (grant no. AP09058419). The authors also thank Satbayev University for supporting Z.K.A. Akasheva’s dissertation under the Ph.D. program.
Institutional Review Board Statement
Not applicable.
Informed Consent Statement
Not applicable.
Data Availability Statement
All data used in this study can be downloaded at https://github.com/BakhytzhanAssilbekov/Pore-network-modeling (accessed on 5 August 2023).
Conflicts of Interest
The authors declare that there are no conflict of interest regarding the publication of this paper.
References
- Carman, P.C. Fluid flow through granular beds. Chem. Eng. Res. Des. 1997, 75, S32–S48. [Google Scholar] [CrossRef]
- Eichheimer, P.; Thielmann, M.; Fujita, W.; Golabek, G.J.; Nakamura, M.; Okumura, S.; Nakatani, T.; Kottwitz, M.O. Combined numerical and experimental study of microstructure and permeability in porous granular media. Solid Earth 2020, 11, 1079–1095. [Google Scholar] [CrossRef]
- Latief, F.D.E.; Fauzi, U. Kozeny–Carman and empirical formula for the permeability of computer rock models. Int. J. Rock Mech. Min. Sci. 2012, 50, 117–123. [Google Scholar] [CrossRef]
- Martys, N.S.; Torquato, S.; Bentz, D.P. Universal scaling of fluid permeability for sphere packings. Phys. Rev. E 1994, 50, 403–408. [Google Scholar] [CrossRef] [PubMed]
- Blunt, M.J.; Bijeljic, B.; Dong, H.; Gharbi, O.; Iglauer, S.; Mostaghimi, P.; Paluszny, A.; Pentland, C. Pore-scale imaging and modelling. Adv. Water Resour. 2013, 51, 197–216. [Google Scholar] [CrossRef]
- Zhang, S.; Paterson, M.S.; Cox, S.F. Porosity and permeability evolution during hot isostatic pressing of calcite aggregates. J. Geophys. Res. 1994, 99, 15741. [Google Scholar] [CrossRef]
- Bernabe, Y.; Brace, W.F.; Evans, B. Permeability, porosity and pore geometry of hot-pressed calcite. Mech. Mater. 1982, 1, 173–183. [Google Scholar] [CrossRef]
- Mavko, G.; Nur, A. The effect of a percolation threshold in the Kozeny-Carman relation. Geophysics 1997, 62, 1480–1482. [Google Scholar] [CrossRef]
- Rodriguez, E.; Giacomelli, F.; Vazquez, A. Permeability-Porosity Relationship in RTM for Different Fiberglass and Natural Reinforcements. J. Compos. Mater. 2004, 38, 259–268. [Google Scholar] [CrossRef]
- Xu, P.; Yu, B. Developing a new form of permeability and Kozeny–Carman constant for homogeneous porous media by means of fractal geometry. Adv. Water. Resour. 2008, 31, 74–81. [Google Scholar] [CrossRef]
- Luquot, L.; Rodriguez, O.; Gouze, P. Experimental Characterization of Porosity Structure and Transport Property Changes in Limestone Undergoing Different Dissolution Regimes. Transp. Porous. Media 2014, 101, 507–532. [Google Scholar] [CrossRef]
- Menke, H.P.; Bijeljic, B.; Blunt, M.J. Dynamic reservoir-condition microtomography of reactive transport in complex carbonates: Effect of initial pore structure and initial brine pH. Geochim. Cosmochim. Acta 2017, 204, 267–285. [Google Scholar] [CrossRef]
- Noiriel, C. Investigation of porosity and permeability effects from microstructure changes during limestone dissolution. Geophys. Res. Lett. 2004, 31, L24603. [Google Scholar] [CrossRef]
- Smith, M.M.; Sholokhova, Y.; Hao, Y.; Carroll, S.A. CO2-induced dissolution of low permeability carbonates. Part I: Characterization and experiments. Adv. Water. Resour. 2013, 62, 370–387. [Google Scholar] [CrossRef]
- Voltolini, M.; Ajo-Franklin, J. The effect of CO2-induced dissolution on flow properties in Indiana Limestone: An in situ synchrotron X-ray micro-tomography study. Int. J. Greenh. Gas. Control 2019, 82, 38–47. [Google Scholar] [CrossRef]
- Koponen, A.; Kataja, M.; Timonen, J. Permeability and effective porosity of porous media. Phys. Rev. E 1997, 56, 3319–3325. [Google Scholar] [CrossRef]
- Luquot, L.; Gouze, P. Experimental determination of porosity and permeability changes induced by injection of CO2 into carbonate rocks. Chem. Geol. 2009, 265, 148–159. [Google Scholar] [CrossRef]
- Maus, S.; Schneebeli, M.; Wiegmann, A. An X-ray micro-tomographic study of the pore space, permeability and percolation threshold of young sea ice. Cryosphere 2021, 15, 4047–4072. [Google Scholar] [CrossRef]
- Meredith, P.G.; Main, I.G.; Clint, O.C.; Li, L. On the threshold of flow in a tight natural rock. Geophys. Res. Lett. 2012, 39, 4307. [Google Scholar] [CrossRef]
- Revil, A.; Kessouri, P.; Torres-Verdín, C. Electrical conductivity, induced polarization, and permeability of the Fontainebleau sandstone. Geophysics 2014, 79, D301–D318. [Google Scholar] [CrossRef]
- Sueyoshi, K.; Yokoyama, T.; Katayama, I. Experimental Measurement of the Transport Flow Path Aperture in Thermally Cracked Granite and the Relationship between Pore Structure and Permeability. Geofluids 2020, 2020, 8818293. [Google Scholar] [CrossRef]
- Arns, C.; Knackstedt, M.; Martys, N. Cross-property correlations and permeability estimation in sandstone. Phys. Rev. E 2005, 72, 046304. [Google Scholar] [CrossRef] [PubMed]
- Bernabé, Y. The transport properties of networks of cracks and pores. J. Geophys. Res. Solid Earth 1995, 100, 4231–4241. [Google Scholar] [CrossRef]
- Martys, N.; Garboczi, E.J. Length scales relating the fluid permeability and electrical conductivity in random two-dimensional model porous media. Phys. Rev. B 1992, 46, 6080–6090. [Google Scholar] [CrossRef] [PubMed]
- Nishiyama, N.; Yokoyama, T. Permeability of porous media: Role of the critical pore size. J. Geophys. Res. Solid Earth 2017, 122, 6955–6971. [Google Scholar] [CrossRef]
- Schwartz, L.M.; Martys, N.; Bentz, D.P.; Garboczi, E.J.; Torquato, S. Cross-property relations and permeability estimation in model porous media. Phys. Rev. E 1993, 48, 4584–4591. [Google Scholar] [CrossRef] [PubMed]
- Lamy-Chappuis, B.; Angus, D.; Fisher, Q.; Grattoni, C.; Yardley, B.W.D. Rapid porosity and permeability changes of calcareous sandstone due to CO2-enriched brine injection. Geophys. Res. Lett. 2014, 41, 399–406. [Google Scholar] [CrossRef]
- Rötting, T.S.; Luquot, L.; Carrera, J.; Casalinuovo, D.J. Changes in porosity, permeability, water retention curve and reactive surface area during carbonate rock dissolution. Chem. Geol. 2015, 403, 86–98. [Google Scholar] [CrossRef]
- Nogues, J.P.; Fitts, J.P.; Celia, M.A.; Peters, C.A. Permeability evolution due to dissolution and precipitation of carbonates using reactive transport modeling in pore networks. Water Resour. Res. 2013, 49, 6006–6021. [Google Scholar] [CrossRef]
- Katz, A.J.; Thompson, A.H. Quantitative prediction of permeability in porous rock. Phys. Rev. B 1986, 34, 8179–8181. [Google Scholar] [CrossRef]
- Bolysbek, D.A.; Kuljabekov, A.B.; Uzbekaliyev, K.S.; Assilbekov, B.K. Effect of Rock Dissolution on Two-Phase Relative Permeabilities: Pore-Scale Simulations Based on Experimental Data. Appl. Sci. 2023, 13, 11385. [Google Scholar] [CrossRef]
- Assilbekov, B.; Bolysbek, D.; Akasheva, Z. Pore-Scale Modeling of Fluid Flow in Porous Media; NJSC Kazakh National Research Technical University named after K.I. Satbayev: Almaty, Kazakhstan, 2022; 118p. [Google Scholar]
- Thermo Fisher Scientific. User’s Guide Avizo Software; Thermo Fisher Scientific: Waltham, MA, USA, 2019. [Google Scholar]
- Li, Y.; Chi, Y.; Han, S.; Zhao, C.; Miao, Y. Pore-throat structure characterization of carbon fiber reinforced resin matrix composites: Employing Micro-CT and Avizo technique. PLoS ONE 2021, 16, e0257640. [Google Scholar] [CrossRef] [PubMed]
- Zhao, Y.; Zhu, G.; Zhang, C.; Liu, S.; Elsworth, D.; Zhang, T. Pore-Scale Reconstruction and Simulation of Non-Darcy Flow in Synthetic Porous Rocks. J. Geophys. Res. Solid Earth 2018, 123, 2770–2786. [Google Scholar] [CrossRef]
- Akasheva, Z.; Bolysbek, D.; Assilbekov, B. Study of carbonate rock dissolution using X-ray microcomputed tomography: Impact of acid flow rate. News Natl. Acad. Sci. Repub. Kazakhstan Ser. Geol. Tech. Sci. 2023, 1, 20–32. [Google Scholar] [CrossRef]
- Navarre-Sitchler, A.; Steefel, C.I.; Yang, L.; Tomutsa, L.; Brantley, S.L. Evolution of porosity and diffusivity associated with chemical weathering of a basalt clast. J. Geophys. Res. 2009, 114, F02016. [Google Scholar] [CrossRef]
- Hommel, J.; Coltman, E.; Class, H. Porosity–Permeability Relations for Evolving Pore Space: A Review with a Focus on (Bio-)geochemically Altered Porous Media. Transp. Porous. Media 2018, 124, 589–629. [Google Scholar] [CrossRef]
- Manmath, N.; Panda, L.W.L. Estimation of Single-Phase Permeability from Parameters of Particle-Size Distribution. Am. Assoc. Pet. Geol. Bull. 1994, 78, 1028–1039. [Google Scholar] [CrossRef]
- Yin, P.; Song, H.; Ma, H.; Yang, W.; He, Z.; Zhu, X. The modification of the Kozeny-Carman equation through the lattice Boltzmann simulation and experimental verification. J. Hydrol. 2022, 609, 127738. [Google Scholar] [CrossRef]
- Li, T.; Li, M.; Jing, X.; Xiao, W.; Cui, Q. Influence mechanism of pore-scale anisotropy and pore distribution heterogeneity on permeability of porous media. Pet. Explor. Dev. 2019, 46, 594–604. [Google Scholar] [CrossRef]
Disclaimer/Publisher’s Note: The statements, opinions and data contained in all publications are solely those of the individual author(s) and contributor(s) and not of MDPI and/or the editor(s). MDPI and/or the editor(s) disclaim responsibility for any injury to people or property resulting from any ideas, methods, instructions or products referred to in the content. |
© 2023 by the authors. Licensee MDPI, Basel, Switzerland. This article is an open access article distributed under the terms and conditions of the Creative Commons Attribution (CC BY) license (https://creativecommons.org/licenses/by/4.0/).