Article

Vehicle Activity Dataset: A Multimodal Dataset to Understand Vehicle Emissions with Road Scenes for Eco-Routing

1
ESIGELEC, IRSEEM, UNIROUEN, Normandie University, 76000 Rouen, France
2
CERTAM, 1 Rue Joseph Fourier, 76000 Rouen, France
3
SEGULA Technologies, 13 Bis Avenue Albert Einstein, 69000 Lyon, France
*
Authors to whom correspondence should be addressed.
Appl. Sci. 2024, 14(1), 338; https://doi.org/10.3390/app14010338
Submission received: 21 November 2023 / Revised: 23 December 2023 / Accepted: 26 December 2023 / Published: 29 December 2023
(This article belongs to the Special Issue Future Autonomous Vehicles and Their Systems)

Abstract

:
In the field of smart mobility, Artificial Intelligence (AI) approaches are influential and can make a highly beneficial contribution. Our project aims to develop a real-time ecological map of road traffic. This map will allow electric vehicles (EVs) and thermal vehicles (TVs) to display the cost of energy consumption and CO 2 emissions on different road sections. In urban environments, road traffic emissions are a significant contributor to environmental pollution, with vehicle emissions being a major component. Addressing these impacts requires a thorough understanding of the operational behavior of vehicles on different road infrastructures within the region. This paper presents a novel, comprehensive dataset, the Vehicle Activity Dataset (VAD), designed to assess the emissions and fuel consumption characteristics of vehicles about their actual operating environment. Constructed from a large number of real-world driving scenarios, VAD incorporates emission data collected by an industrial Portable Emission Measurement System (PEMS), road scenes captured by an RGB camera, and the detection of different object classes within these images. The primary objective of VAD is to provide a comprehensive understanding of the relationship between vehicle emissions and the diverse range of objects present on the road. Experimental results in real road traffic environments through different studies demonstrate the robustness of the developed dataset.

1. Introduction

In the era of smart mobility, the integration of technology has revolutionized the way we understand and interact with the road scene, paving the way for eco-friendly transportation solutions [1]. By harnessing the power of data emitted by vehicles, such as speed, gas emissions, and GPS coordinates, we can gain valuable insights into road conditions, optimize traffic flow, and promote sustainable transportation solutions. The concept of road scene understanding encompasses the comprehensive analysis and interpretation of the road environment [2]. It involves extracting meaningful information from various data sources, including vehicle-generated data, to gain a holistic understanding of the road scene. This understanding empowers cities and transportation authorities to make informed decisions, implement effective traffic management strategies, and enhance the overall efficiency and safety of the transportation network [3].
One crucial aspect of road scene understanding is the data emitted by the vehicles themselves [4]. Modern vehicles are equipped with a wide range of sensors that continuously collect real-time information about their surroundings. For example, GPS systems provide precise location data, enabling the tracking and mapping of vehicle routes. This information can be used to monitor traffic congestion, identify accident-prone areas, and optimize navigation systems to provide drivers with the most efficient routes. Vehicles also emit data about their speed, acceleration, and deceleration patterns. By analyzing these data, traffic engineers can gain insight into traffic flow dynamics, identify bottlenecks, and implement adaptive traffic signal control systems to improve overall traffic efficiency. In addition, these data can be used to develop predictive models that anticipate traffic patterns and provide early warnings of potential congestion or accidents.
Another important aspect of vehicle-generated data is the measurement of gas emissions. As sustainable transport becomes an increasingly important goal, monitoring and reducing greenhouse gas emissions is of paramount importance. By collecting real-time data on gas emissions from individual vehicles, transport authorities can assess the environmental impact of the transport system, identify high-emission zones, and implement targeted measures to promote cleaner and greener mobility options.
The integration of vehicle-generated data into road scene understanding opens up new possibilities for creating a more sustainable and efficient transport ecosystem. By harnessing these data, we can pave the way for eco-friendly mobility solutions, reducing our environmental footprint, and creating a greener future for transport. As technology continues to advance, the potential for data-driven eco-mobility innovations is becoming increasingly promising, offering a transformative shift towards a more sustainable and intelligent transport system.
This paper presents an innovative and comprehensive dataset, Vehicle Activity Dataset (VAD), which combines vehicle data and road scene information, aiming to drive advancements in eco-mobility and sustainable transport solutions. By integrating these two different data sources, we provide a valuable resource for studying the complex relationship between vehicle emissions, road conditions, and smart mobility strategies.
VAD makes a significant contribution to the field of eco-mobility by bridging the gap between vehicle-related data and visual information, paving the way for transformative research opportunities and the development of advanced algorithms. Through this integration, we can accurately estimate emissions, optimize traffic flow, and formulate sustainable transport strategies to reduce the environmental impact of transport systems. The insights derived from this dataset hold immense potential to promote a greener, cleaner, and more efficient mobility landscape, moving us towards a more sustainable transport future.
This paper is organized as follows: Section 1 introduces this paper. In Section 2, we review the related work, the transport sector that reduces energy consumption, CO 2 emission, and eco-driving as a relatively low-cost and immediate measure to significantly reduce fuel consumption and emissions. In Section 3, we present our vehicle activity dataset, where we introduce a new and innovative dataset called the Vehicle Activity Dataset, which combines vehicle data and road scene information, aiming to drive progress in eco-mobility. The data collection, road data extraction, and data synchronization necessary for the development of our vehicle activity dataset are described in Section 4. The experimental results, both qualitative and quantitative, are the subject of Section 4, where we present the results of the dataset. Finally, the conclusions and future directions are outlined in Section 5.

2. Related Work

In recent decades, cities have faced unexpected socioeconomic crises, such as the increase in the world’s population, urban growth, and migration from rural areas to urban centers. More than 50% of the world’s population lives in cities [5]. By 2050, the United Nations (UN) predicts this number to reach 70%. The rapid transition to a highly urbanized population raises the demand for new infrastructures for cities needed to provide essential services for citizens, i.e., healthcare, education, transport, safety, reduction of greenhouse gas emissions, and sustainable energy and water. The significant growth of the population in urbanized cities particularly increases the number of vehicle owners and hence impacts both the environment and the cost of transport. The transport sector is one of the largest contributors to greenhouse gas (GHG) emissions and excessive consumption of energy resources [6]. According to the European Environment Agency [7], GHG emissions from road transport vehicles still account for around 93% of emissions from the transport sector. In addition, the world’s total energy consumption will increase by almost 50% by 2050 according to the IEO2019 Reference case [8]. Energy consumption in the transport system generally accounts for a share of a country’s total energy consumption. It will increase by almost 40% by 2050 [8].
In the pursuit of mitigating energy consumption and CO 2 emissions in the transport sector, specific attention has been directed to this endeavor [9]. Eco-driving emerges as a cost-effective and immediately implementable strategy to significantly curtail both fuel consumption and emissions [10]. Factors such as acceleration/deceleration, driving speed, route selection, and idling, which fall within the control of a driver during operation, play pivotal roles in influencing fuel consumption and emissions [11,12]. Commonly employed methods to instill eco-driving skills encompass training programs and the utilization of in-vehicle feedback devices, and whereas immediate and substantial reductions in fuel consumption and CO 2 emissions have been observed, accompanied by a slight increase in travel time [13], the sustained impact of these methods may diminish over time due to ingrained driving habits developed over the years. This underscores the imperative need to formulate quantifiable eco-driving recommendations and integrate them into vehicle hardware to ensure consistent and uniform improvements.
Vehicle routing problems (VRPs) and their various iterations constitute a distinguished category of network problems that have garnered significance over the years, particularly for their pragmatic approach to addressing logistical challenges [14]. The primary objectives within this domain revolve around minimizing operational time, cost, or both for vehicles en route to their designated destinations. Variations in the problem have been introduced over time through alterations in the formulation of the basic routing problem. Objectives range widely, including the minimization of distance, travel time, fuel consumption, pollution, and others, adapting based on the specific application [15]. Despite offering a direct competitive advantage, these algorithms often operate on generalized methodologies with limited situational awareness. Notably, the expertise, sentiments, and situational adaptability of drivers are frequently excluded from these approaches.
Several strategies have been proposed to look over these problems from different approaches including traffic and energy demand management, improving vehicle technologies, and integrating Information and Communication Technologies (ICT) [16,17,18]. The application of machine learning and Artificial Intelligence (AI) approaches to the transport sector, i.e., ITS, has significantly contributed to enhancing safety, efficiency, comfort, and environmental impacts on this sector. ITS is becoming an area of active research for automotive manufacturers trying to solve both economic and environmental issues such as reducing energy consumption, CO 2 emissions, traffic congestion, noise, and accidents [6,16,17,18]. ITS supports innovative and sustainable transport management systems, and hence, this can lead to the improvement of energy efficiency. For instance, the following reductions were recorded in the road sector: travel time between 15% and 20%, energy consumption by 12%, emissions of pollutants by 10%, and the number of accidents between 10% and 15% [19]. ITS has revolutionized all aspects of urban life from traffic control to reducing resource consumption, especially energy use. Another strategy that may be adopted to achieve energy savings and protect the environment is the electrification of the road transport sector. In particular, replacing diesel and gasoline-powered vehicles with electric vehicles (EVs) could be a solution to move towards green energy. Adopting these vehicles has emerged as a trend to support the reduction of CO 2 emissions and energy efficiency targets [17,18,20,21,22].
Our project is part of innovative ICT solutions designed to reduce EV energy consumption and TV CO 2 emissions to promote smart mobility. These solutions deal with two main services: eco-driving and eco-routing. The innovation consists of:
1. Using AI technologies to elaborate an accurate estimation of EV energy consumption and TV CO 2 emission related to each road section taking into account the whole context (vehicle + driver + environment) of the vehicle. 2. Modeling the EV energy consumption and the TV CO 2 emission using an original hybrid approach based on the cooperation of deterministic and stochastic methods. 3. Using new generation e-ADAS allows the prediction of road user behavior for better safety and eco-driving. 4. Analyzing the road scenes for an energy/CO 2 semantic segmentation. This allows going from ’idea to proof-of-concept’.
The development of an AI-based real-time ecological map of a road traffic network stands out as a crucial priority recognized at all institutional levels. To effectively address this imperative, it becomes evident that the foundational element lies in the creation and utilization of the innovative dataset previously discussed. This dataset, seamlessly integrating vehicle-specific information with road characteristics, becomes the linchpin for achieving an accurate and comprehensive real-time ecological map. It not only improves the accuracy of environmental monitoring but also paves the way for informed decision-making at both individual and institutional levels.

3. Vehicle Activity Dataset

In this part, we present a dataset called Vehicle Activity Dataset (VAD) that combines vehicle data and road scene information, aiming to drive advancements in eco-mobility. By integrating these two distinct sources of data, we provide a valuable resource for studying the intricate relationship between vehicle emissions and road conditions.
Figure 1 shows the entire process of the VAD creation journey. The street scene imagery is first carefully captured along with associated Portable Emission Measurement System (PEMS) data. The PEMS is a pivotal tool for acquiring genuine emissions data from vehicles. Consisting of sensors and specialized equipment, PEMS accurately gauges the pollutants emitted by vehicles in real-world road conditions. The brain behind this innovation is none other than the CERTAM Regional Innovation Center. PEMS not only captures real-world emissions data but also provides comprehensive vehicle information, including GPS coordinates and speed. An important next step is the dataset extraction process, which carefully extracts complex road information from the collected images. These intrinsic street insights formed the basis for subsequent synchronization efforts to establish a harmonious alignment between the extracted images and the corresponding PEMS data. This synchronization seamlessly connects visual context with emissions-related information, resulting in a cohesive and meaningful dataset with enormous potential for transformative insights and actionable results.

4. Experimental Results and Analysis

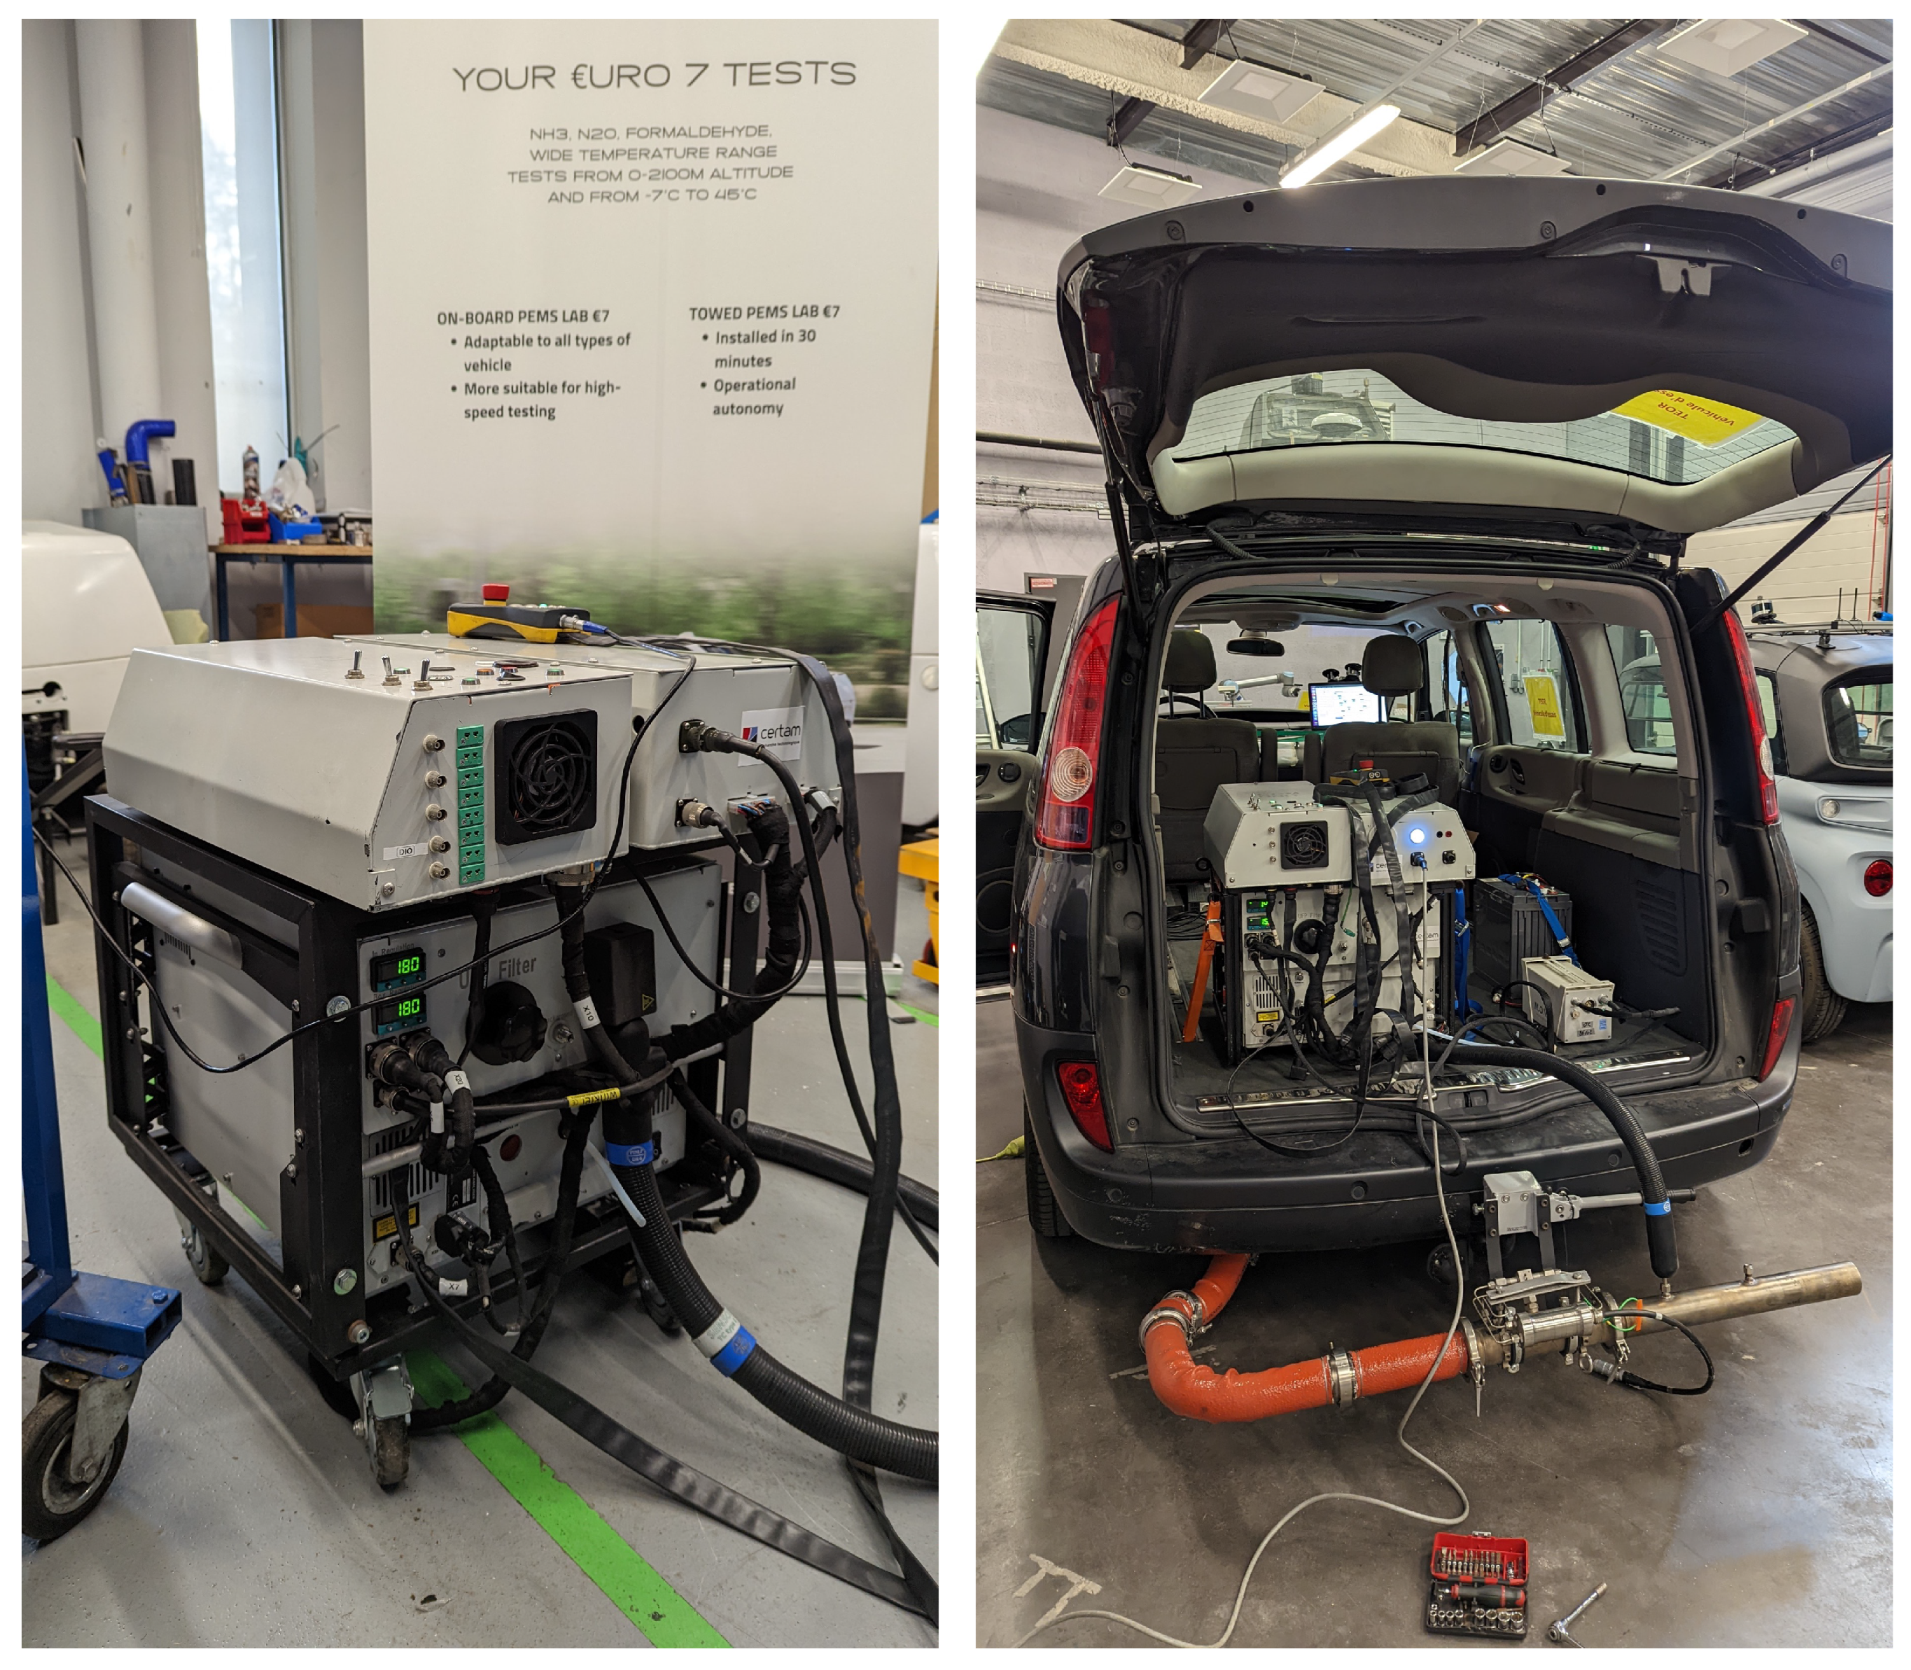
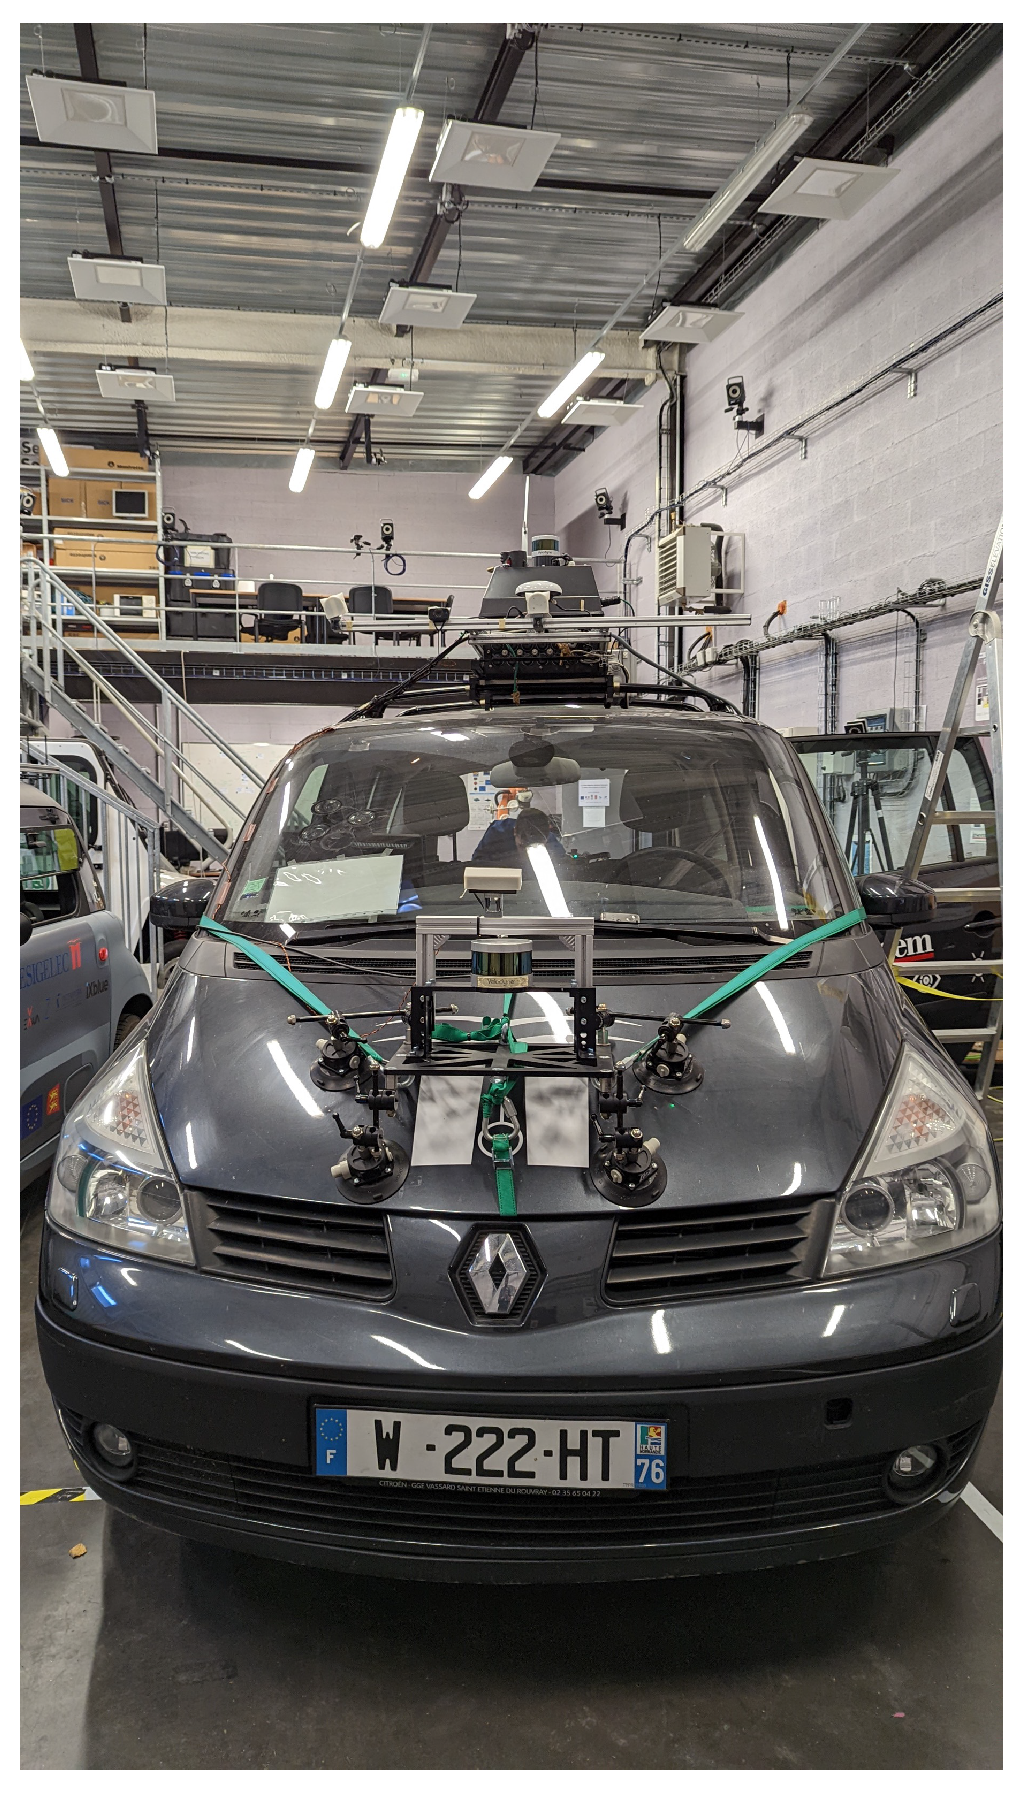
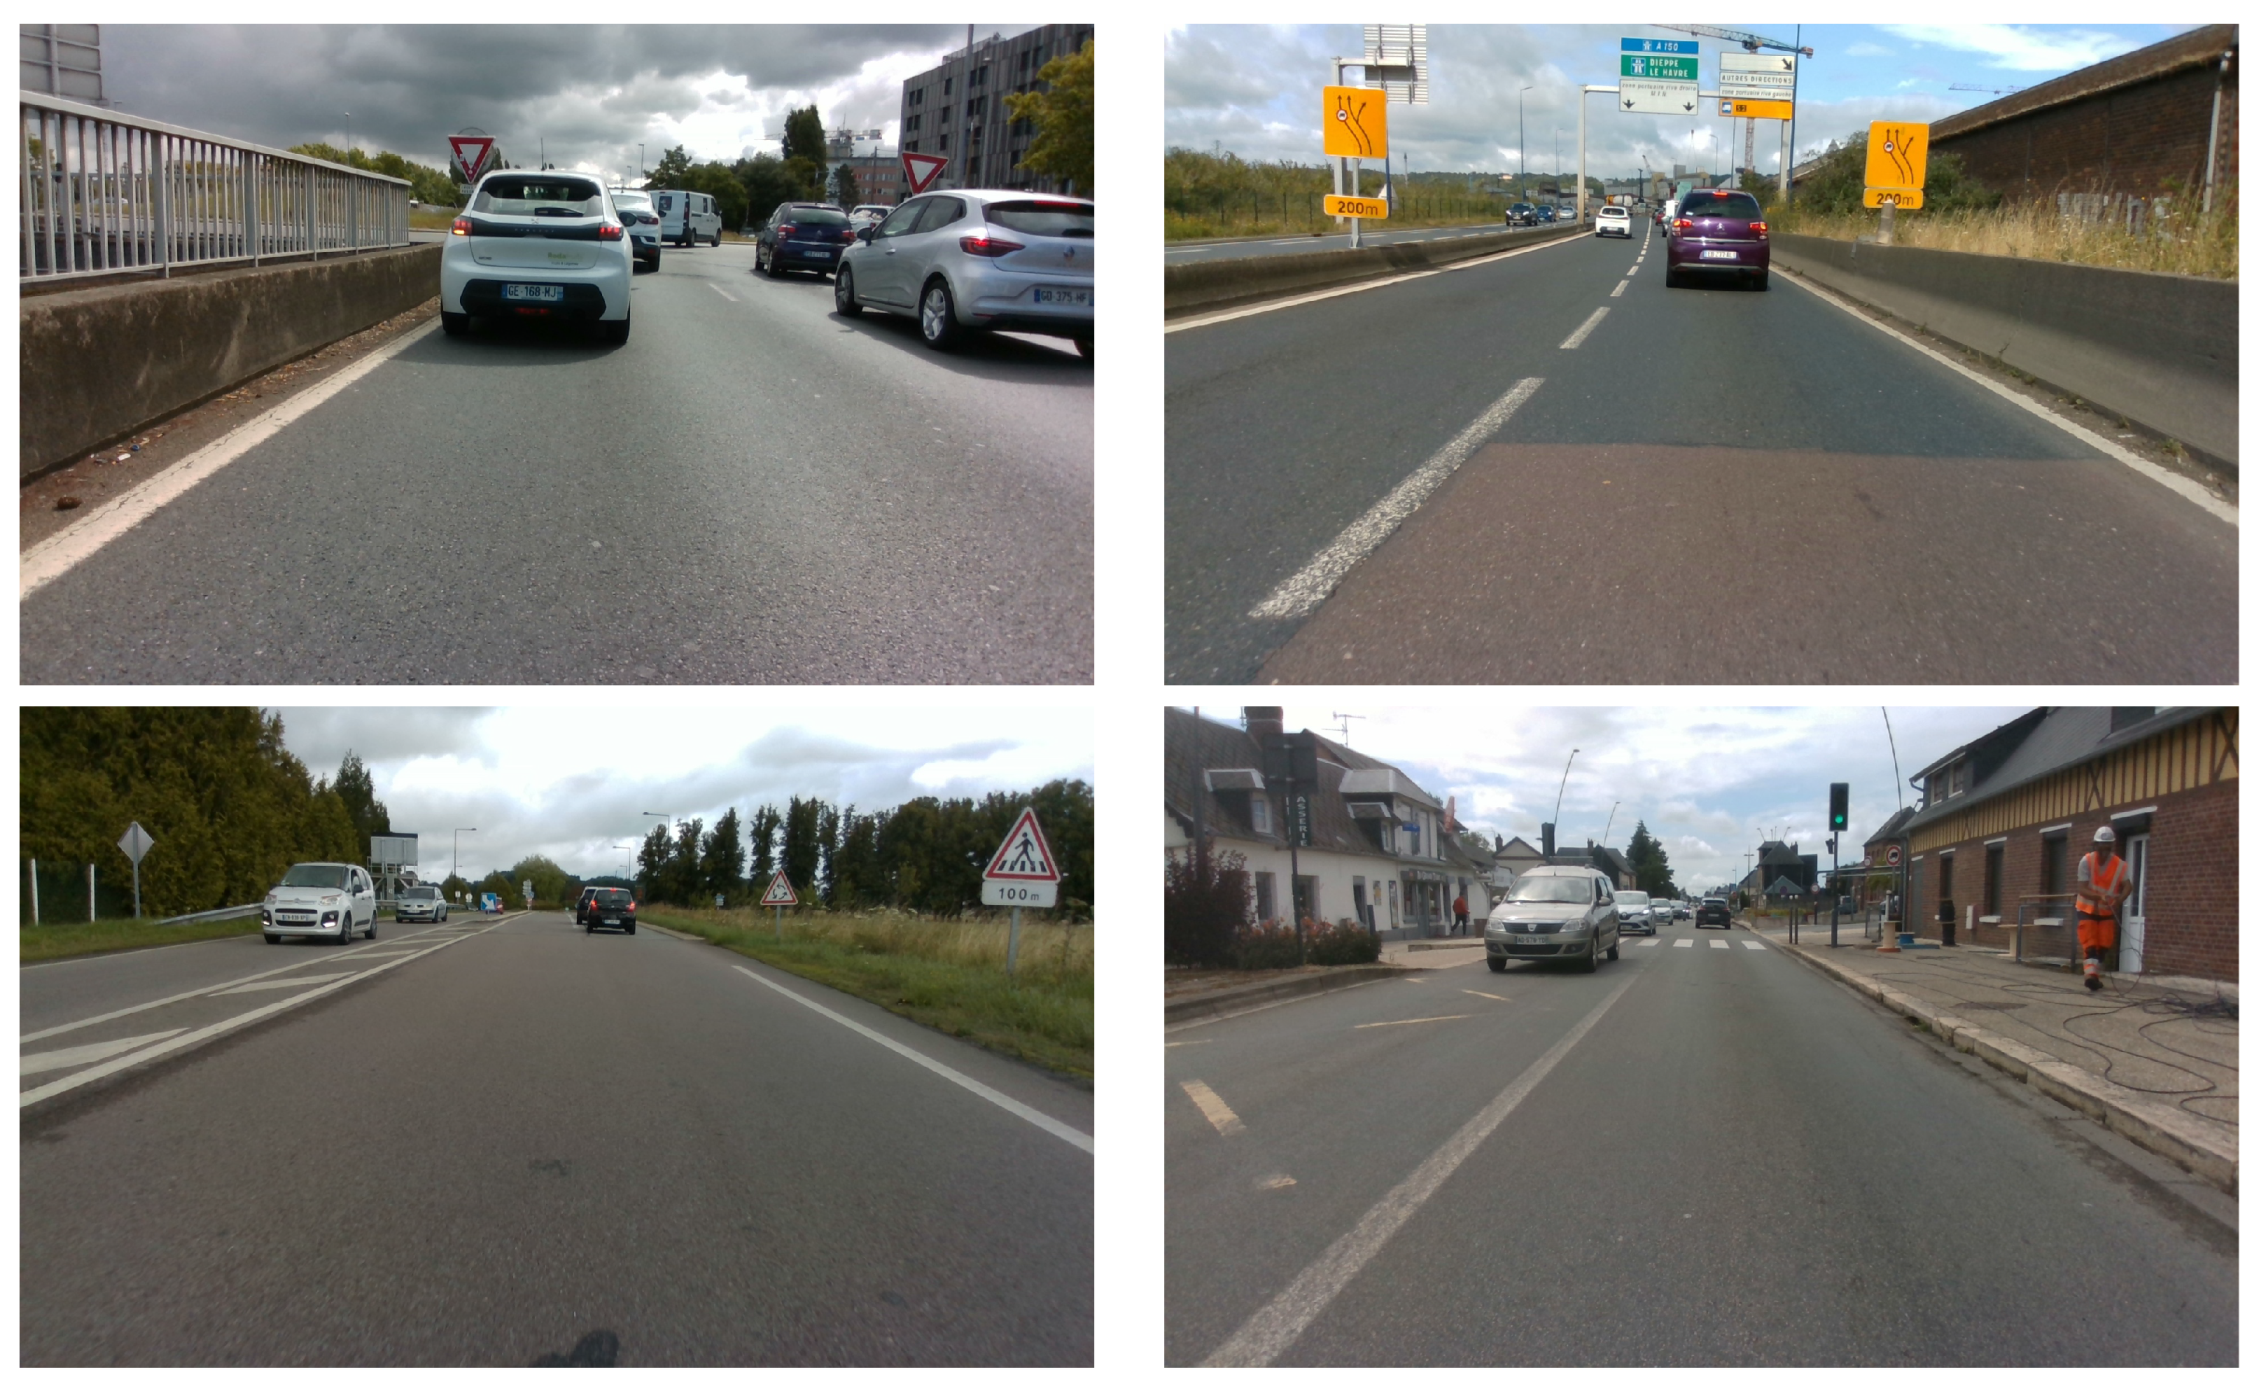
4.1. Data Collection

Data collection is of paramount importance in the context of studying vehicle emissions and road scene analysis. By collecting comprehensive and accurate data, we can gain valuable insights into the environmental impact of vehicles and their relationship with road conditions. The integration of multiple data sources, such as emissions, vehicle speed, and GPS coordinates (altitude, longitude, latitude) allows for a holistic understanding of the factors influencing emissions and their spatial distribution within a road network. In our data collection efforts, we conducted numerous experiments in the city of Rouen, France, with ESIGELEC (Engineering High School located in Rouen) as the primary source location. To ensure the dataset’s robustness and real-world applicability, we selected a Renault diesel car as the vehicle for our experiments, providing a specific vehicle type for analysis, and we selected multiple destinations, including Bosguouet, Brionne, Neubourg, and Yvetot, representing diverse road networks and driving conditions. For each destination, we collected data for both the outbound and return journeys, and to comprehensively assess emissions variations based on different driving scenarios, we focused on two distinct route types: one adhering to Google Maps’ fastest route recommendation and the other aligned with an eco-friendly route suggestion. This approach enabled us to investigate the emissions implications stemming from different route choices, shedding light on the trade-off between speed and environmental impact.
By traversing multiple routes and destinations, we accounted for the heterogeneity of road types, traffic congestion levels, and driving behaviors prevalent in the region. This approach allowed us to capture a wide range of driving scenarios, including urban areas, highways, and rural roads, contributing to a more comprehensive and representative dataset. The diversity of routes ensured that the dataset included different traffic patterns, environmental factors, and road infrastructure characteristics, making it suitable for studying eco-mobility and transport solutions in real-world settings.
The Portable Emission Measurement System played a crucial role in our data collection process. It was installed at the rear of the vehicle as shown in Figure 2. With a frequency of 1 Hz, the PEMS system captured emissions, vehicle speed, and GPS coordinates at a high temporal resolution. This high-frequency data collection allowed us to analyze emission patterns and variations during different driving scenarios, providing detailed insights into the environmental impact of vehicles in real time.
The integration of vehicle speed and GPS coordinates into our dataset further enriched the collected data. The speed data provided valuable information on driving behavior, including acceleration, deceleration, and average speeds. These data allowed for a comprehensive analysis of how speed influences emissions and traffic dynamics. The GPS coordinates provided precise location information, enabling the mapping of emissions to specific road segments and facilitating the identification of emission hotspots and areas with significant environmental concerns. Table 1 presents an overview of the PEMS data in the VAD, highlighting some examples of vehicle gas emissions and other relevant variables.
In addition to collecting vehicle emissions and data, we have also captured images of the road scene. These images provide valuable visual information about the road infrastructure, traffic conditions, and the environment. For image collection, we used the Intel RealSense camera, which was mounted on the front of the vehicle to capture a forward-facing view as shown in Figure 3.
The Intel RealSense camera is a powerful RGB (Red Green Blue) camera that captures high-resolution images with rich color information. By placing it at the front of the vehicle, we obtained a perspective that closely resembles the driver’s view, allowing us to capture the road scenes from a realistic standpoint. This camera provided clear and detailed images that were instrumental in analyzing the road conditions and extracting relevant visual features, some examples of which are shown in Figure 4.
During the data collection process, we captured images at a frequency of 5 images per second, with a frame rate of 5 frames per second (fps = 5), with a shape of 1920 × 1080. This sampling rate provided a balance between capturing sufficient visual data and minimizing storage requirements. The 5 fps frequency allowed us to capture a series of images representing the temporal progression of the road scene during different driving scenarios.
By analyzing these images, we were able to detect and classify road infrastructure elements such as lanes, road signs, and traffic lights. Additionally, the images also provided visual clues about traffic flow, congestion, and environmental factors that could affect vehicle emissions.
Table 2 provides details regarding our cycles and experiments conducted during the data collection process.

4.2. Road Data Extraction

The extraction of road scene information from the meticulously gathered images assumes a pivotal role in the overarching endeavor of dataset creation. This component is crucial because it gives us a complete picture of the current road conditions and traffic density. The core of the process involved the application of three sophisticated You Only Look Once (YOLO) models, strategically chosen to cover different aspects of the street scene. Collectively, these models represent a fusion of advanced computer vision techniques and machine learning algorithms working in tandem to extract meaningful information from the captured visual data.
The first model’s task is to quantify the density of vehicle traffic in a street scene. It can accurately measure the number of vehicles present so that the traffic situation can be quantitatively assessed at different time intervals.
The second model, with a targeted focus, zeroes in on the identification of traffic signals and pedestrian crossings, as well as zebra crossings. This feature-rich identification process is crucial for understanding the interaction points between pedestrians and vehicles and for identifying traffic control mechanisms.
In turn, the resulting model plays a crucial role in recognizing and decoding traffic signs in street scenes. This includes a wide range of regulatory, warning, and information signs and adds a layer of semantic understanding to the dataset.

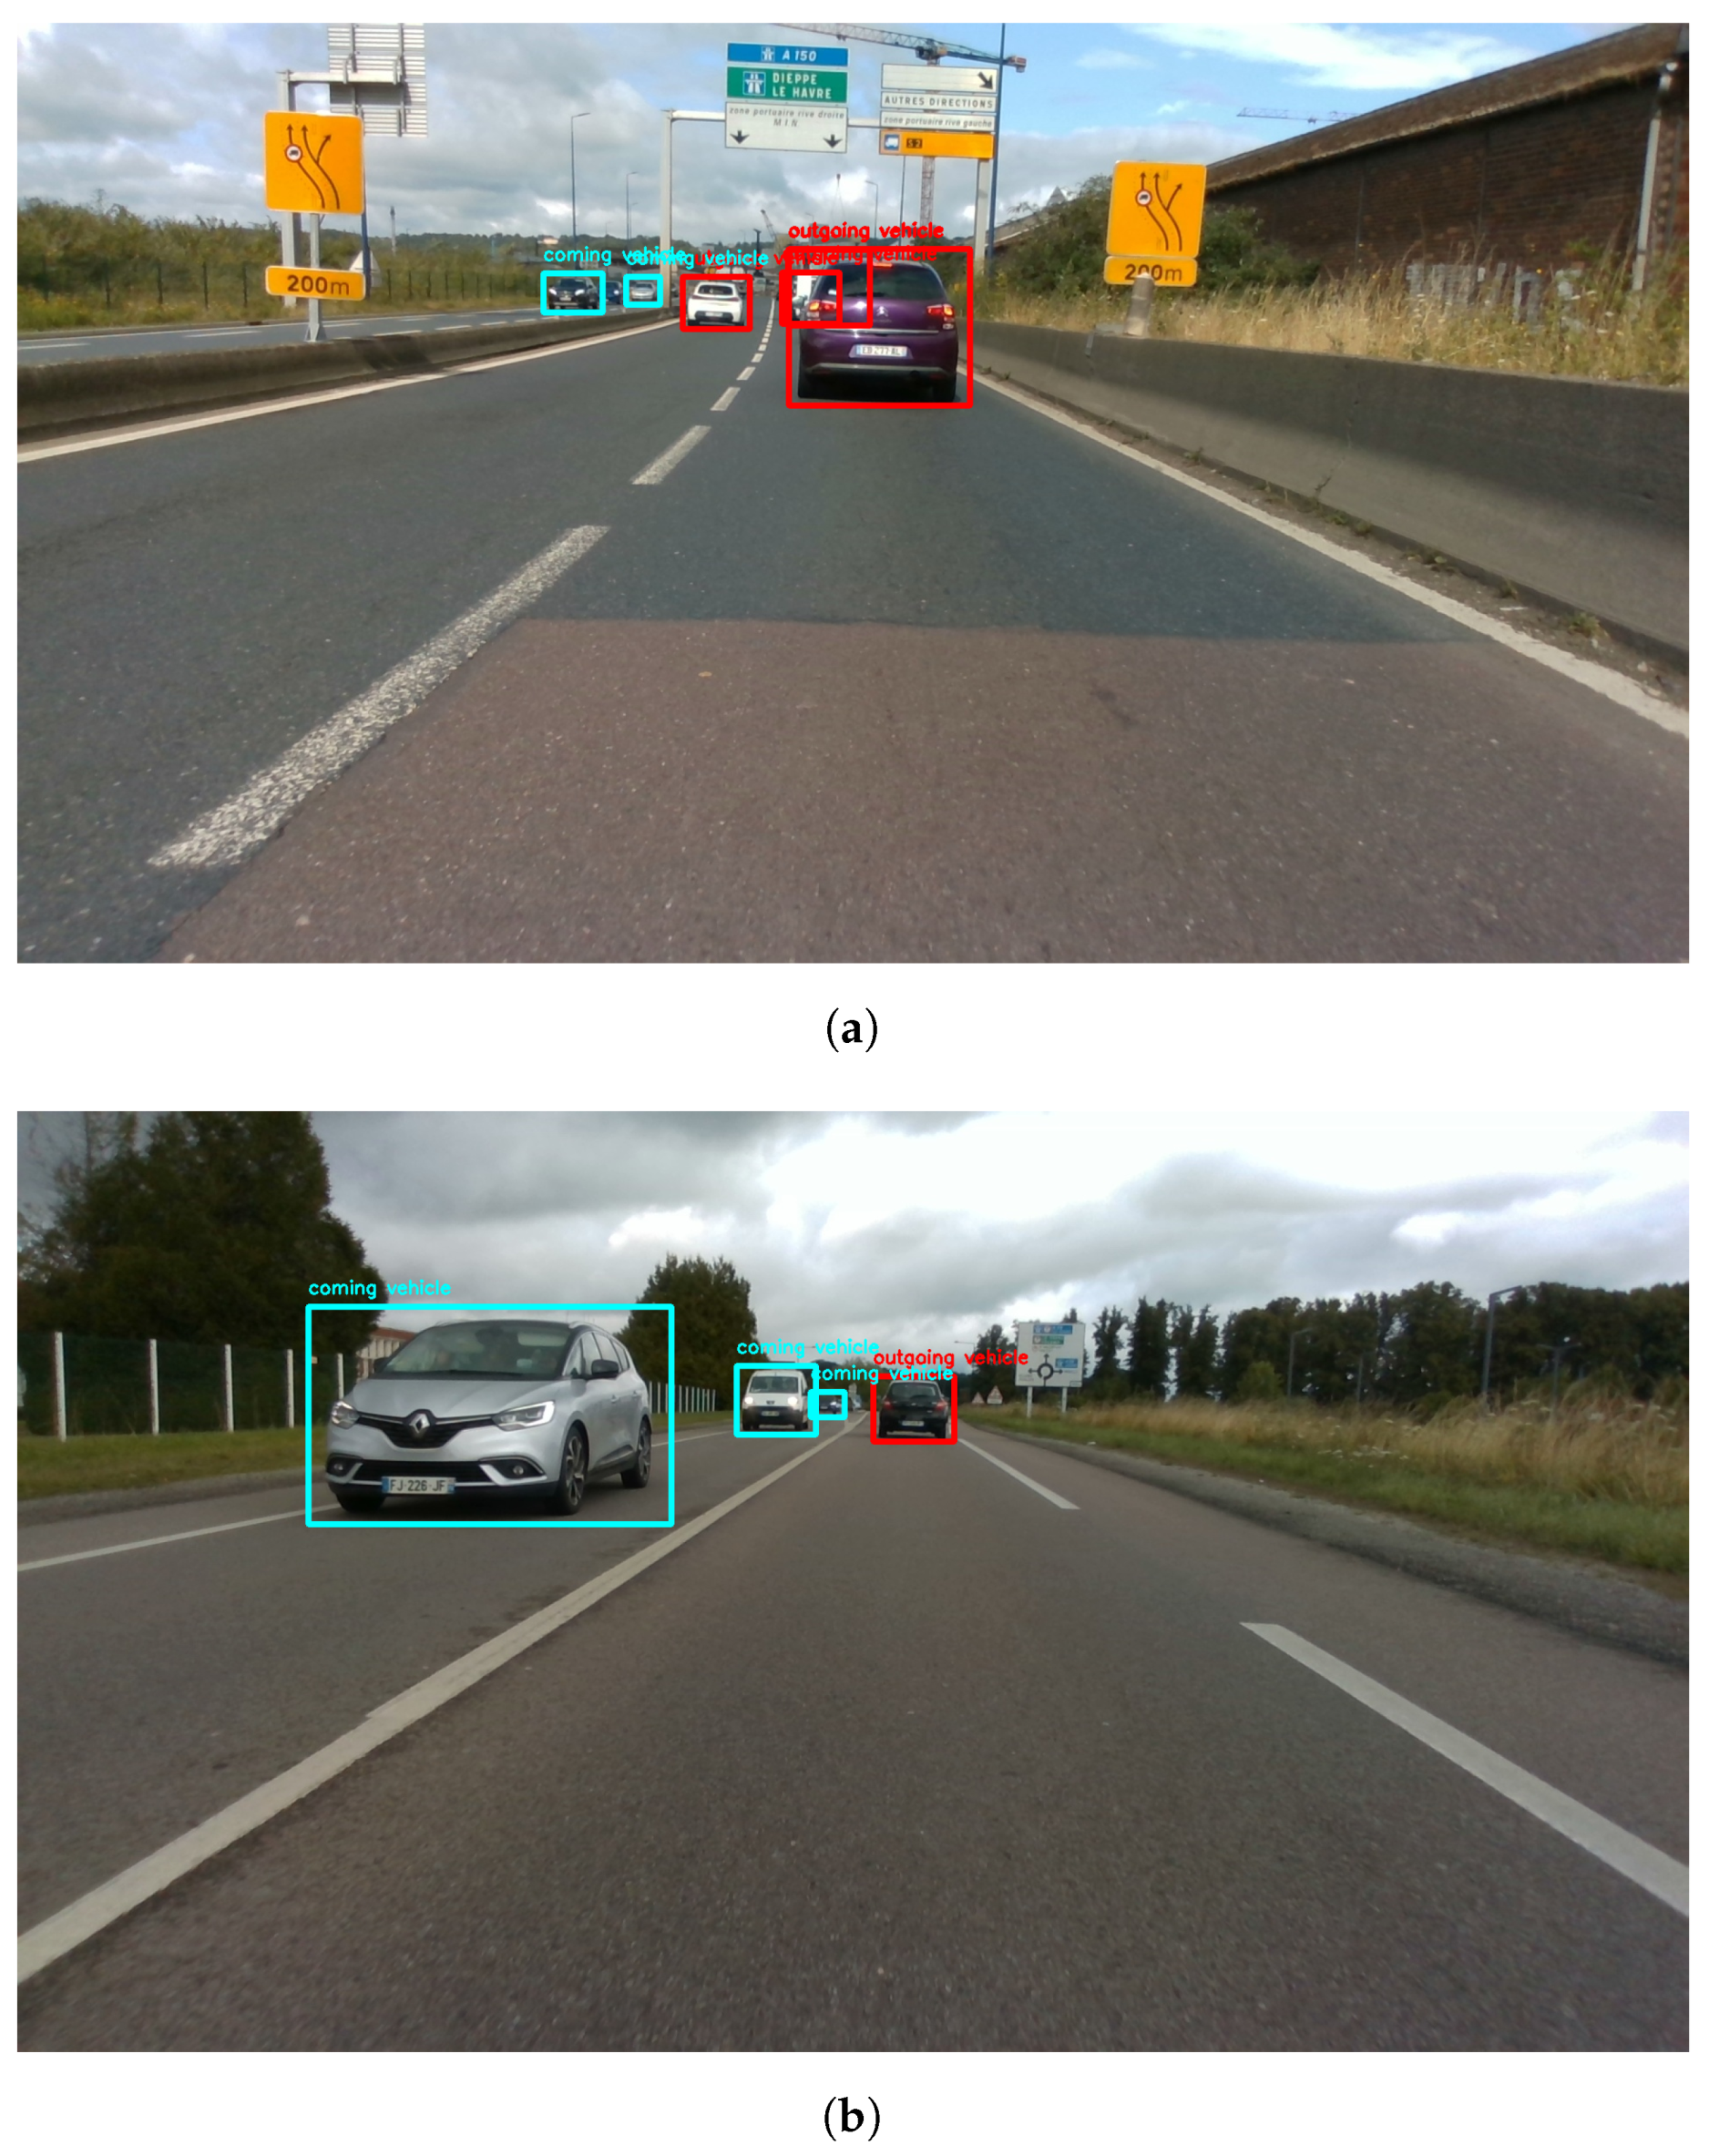
4.2.1. Traffic Density Detection

Delving deeper into the field of traffic density detection, our attention is focused on carefully quantifying the presence of vehicles in observed street scenes. This particular regulation has resonated widely and has a major impact not only on the current state of the road but also on the complex web of CO 2 emissions closely linked to vehicle activity.
The accurate identification of cars with rear orientations relative to the camera’s perspective is important to this quest [23]. This prudent criterion is the result of a thorough understanding of vehicle dynamics and their complex influence on our immediate surroundings. Vehicles traveling in the same direction as us are extremely important because they can shape our trajectory and impact the overall traffic flow.
This selection principle is guided by two rationales. Firstly, cars traveling in the same direction as ours are inherently linked, with their motions firmly intertwined with ours. As a result, their existence has a substantial impact on overall traffic dynamics, necessitating a thorough examination. Secondly, this distinction ensures that our analysis is grounded in a practical perspective. Vehicles with opposing frontal orientations, although essential to the overall traffic ecology, have comparatively less influence on our local operational domain.
In this pursuit, we opt to use a pre-trained YOLOv5 model [24], a well-regarded solution recognized for its proficiency. This model, having already demonstrated commendable performance, has been trained on the comprehensive Vehicle Orientation Dataset [25].
However, our deliberate emphasis remains on a subset of these categories, specifically centered around cars, trucks, and buses. Figure 5 illustrates the successful detection capabilities of our model. we have established two categories termed ‘coming vehicle’, and ‘outgoing vehicle’. This classification groups vehicles into a single class, distinguished by their orientation relative to their trajectory. Specifically, vehicles presenting a back view are grouped as ‘outgoing vehicles’, indicating their departure from the observer’s viewpoint. Conversely, vehicles exhibiting a frontal view indicate their approach and are classified as ’Coming vehicles’. Our primary focus is squarely on ‘outgoing vehicles’, aligning seamlessly with our objectives because they have the potential to impact our traffic density. This discerning approach allows us to delve into vehicular dynamics with enhanced precision, dissecting intricate traffic patterns and their consequential environmental impacts.

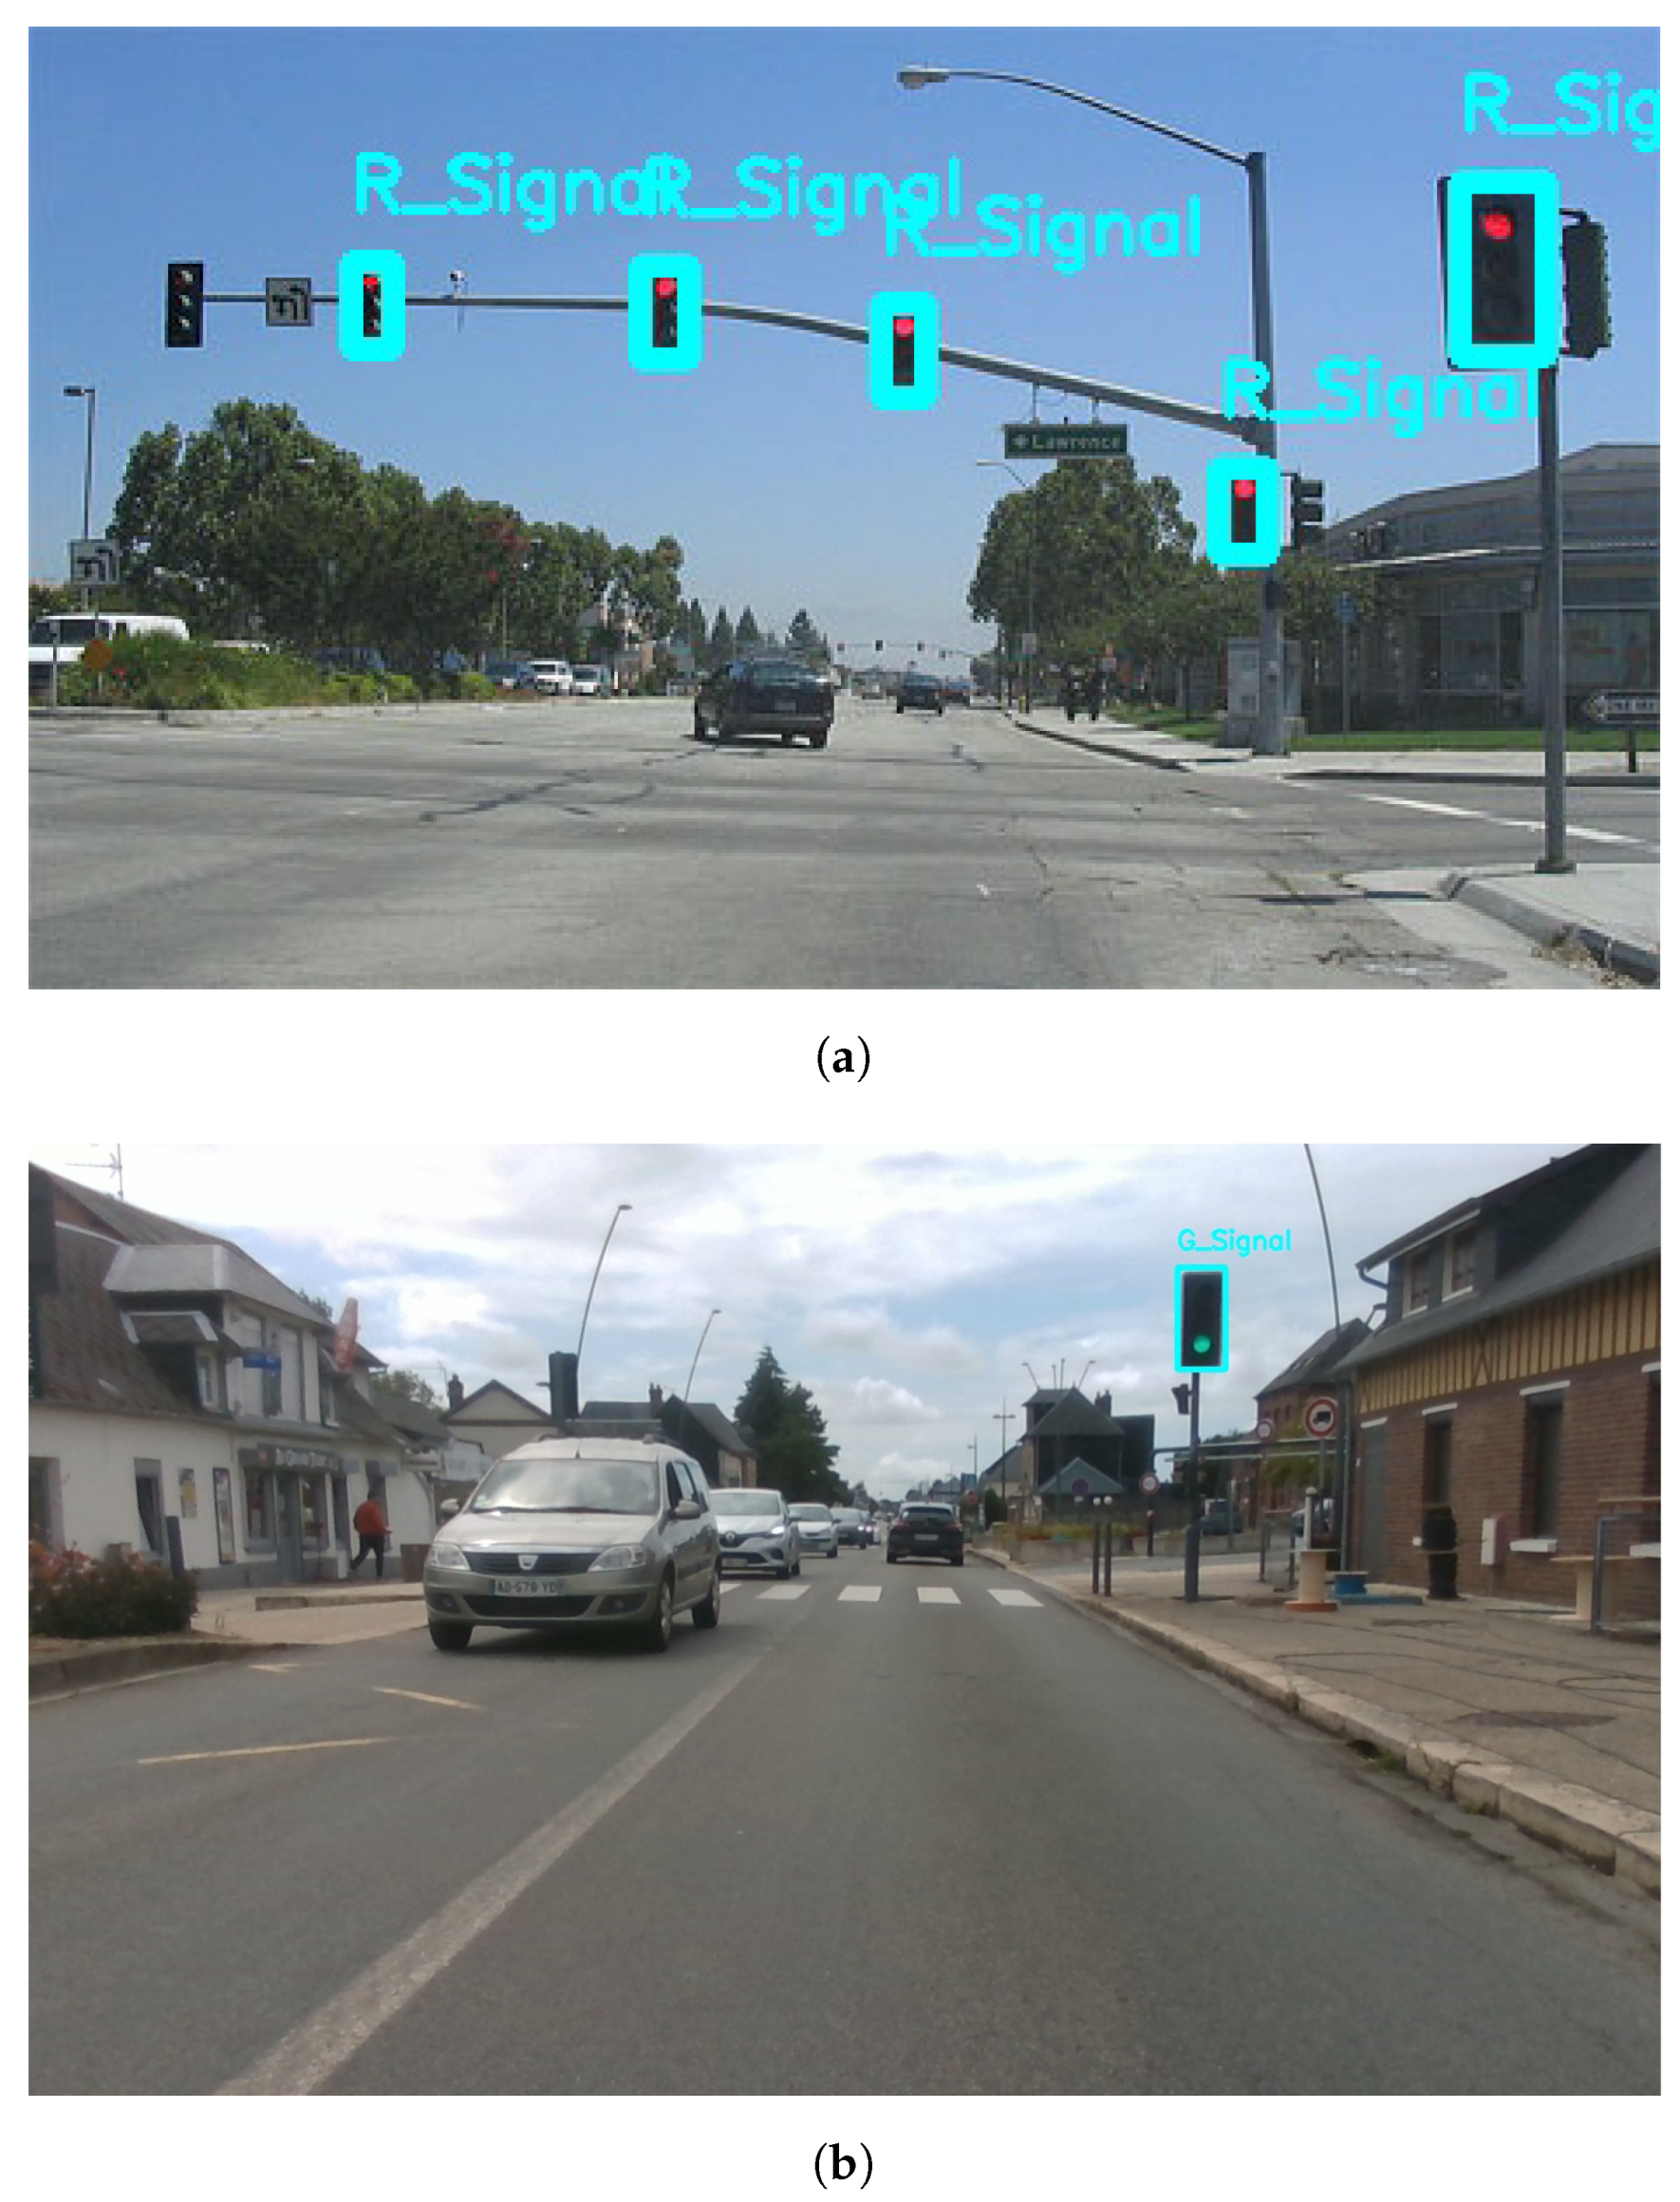
4.2.2. Traffic Light Detection

This section focuses on traffic light detection, pivotal aspects that yield insights into road conditions and pedestrian crossings along our route, employing a pre-trained YOLOv5 model sourced from GitHub [26].The model underwent training on a diverse dataset, encompassing images featuring traffic lights and zebra crossings in various conditions such as rainy days, normal days, and sunny days. The training spanned 50 epochs, yielding commendable results. We harness its proven efficacy in yielding accurate results. The model provides us with invaluable data on the status of traffic lights and the presence of pedestrians crossing the road.
Through this analytical lens, we discern the intersection of traffic dynamics and pedestrian safety, bolstering our comprehensive dataset with reliable information. The YOLOv5 detection model has been configured to recognize and locate three specific classes: Zebra Cross, Green Light, and Red Light. This advanced model excels at accurately detecting these objects within images, enabling the accurate identification of both traffic lights, shown in Figure 6.

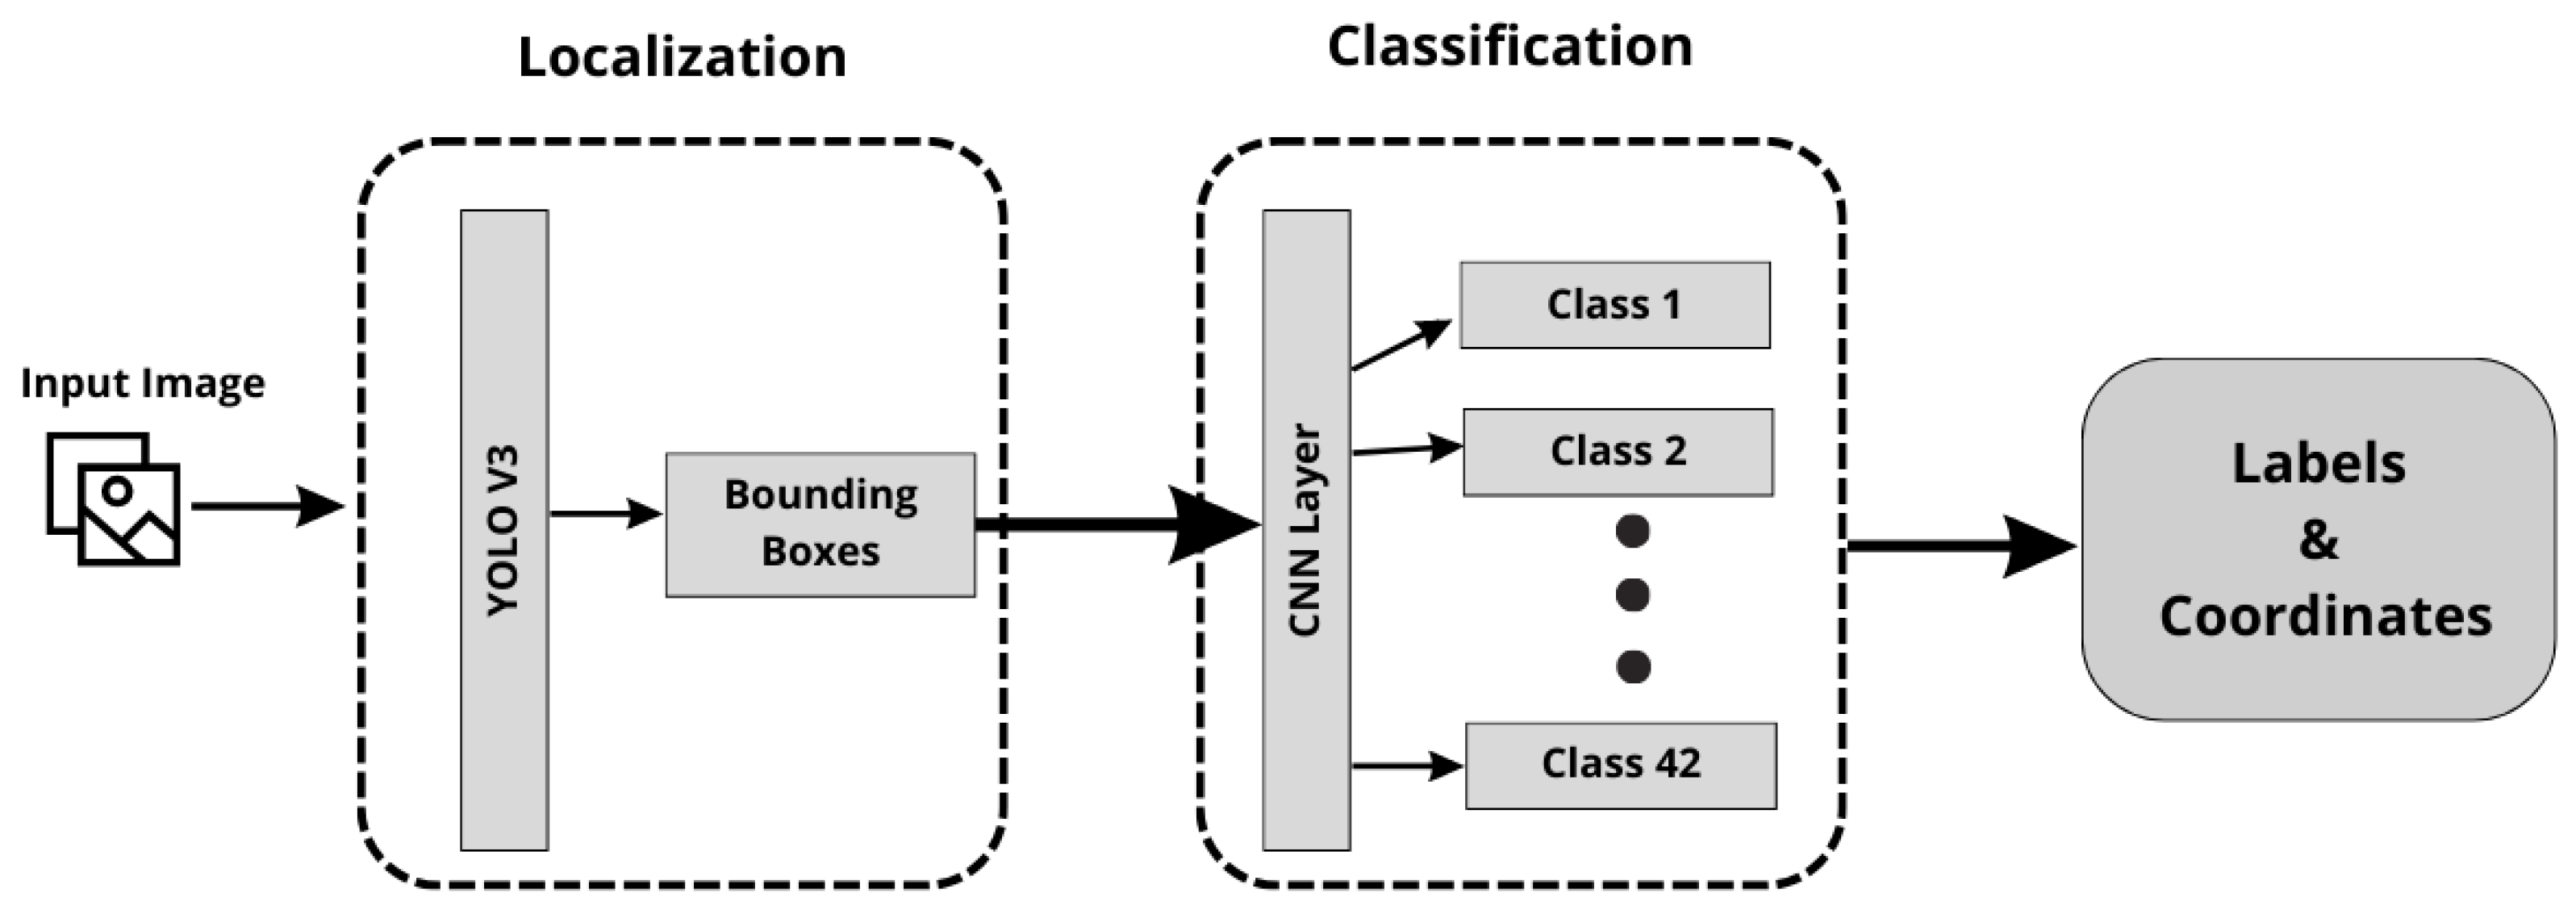
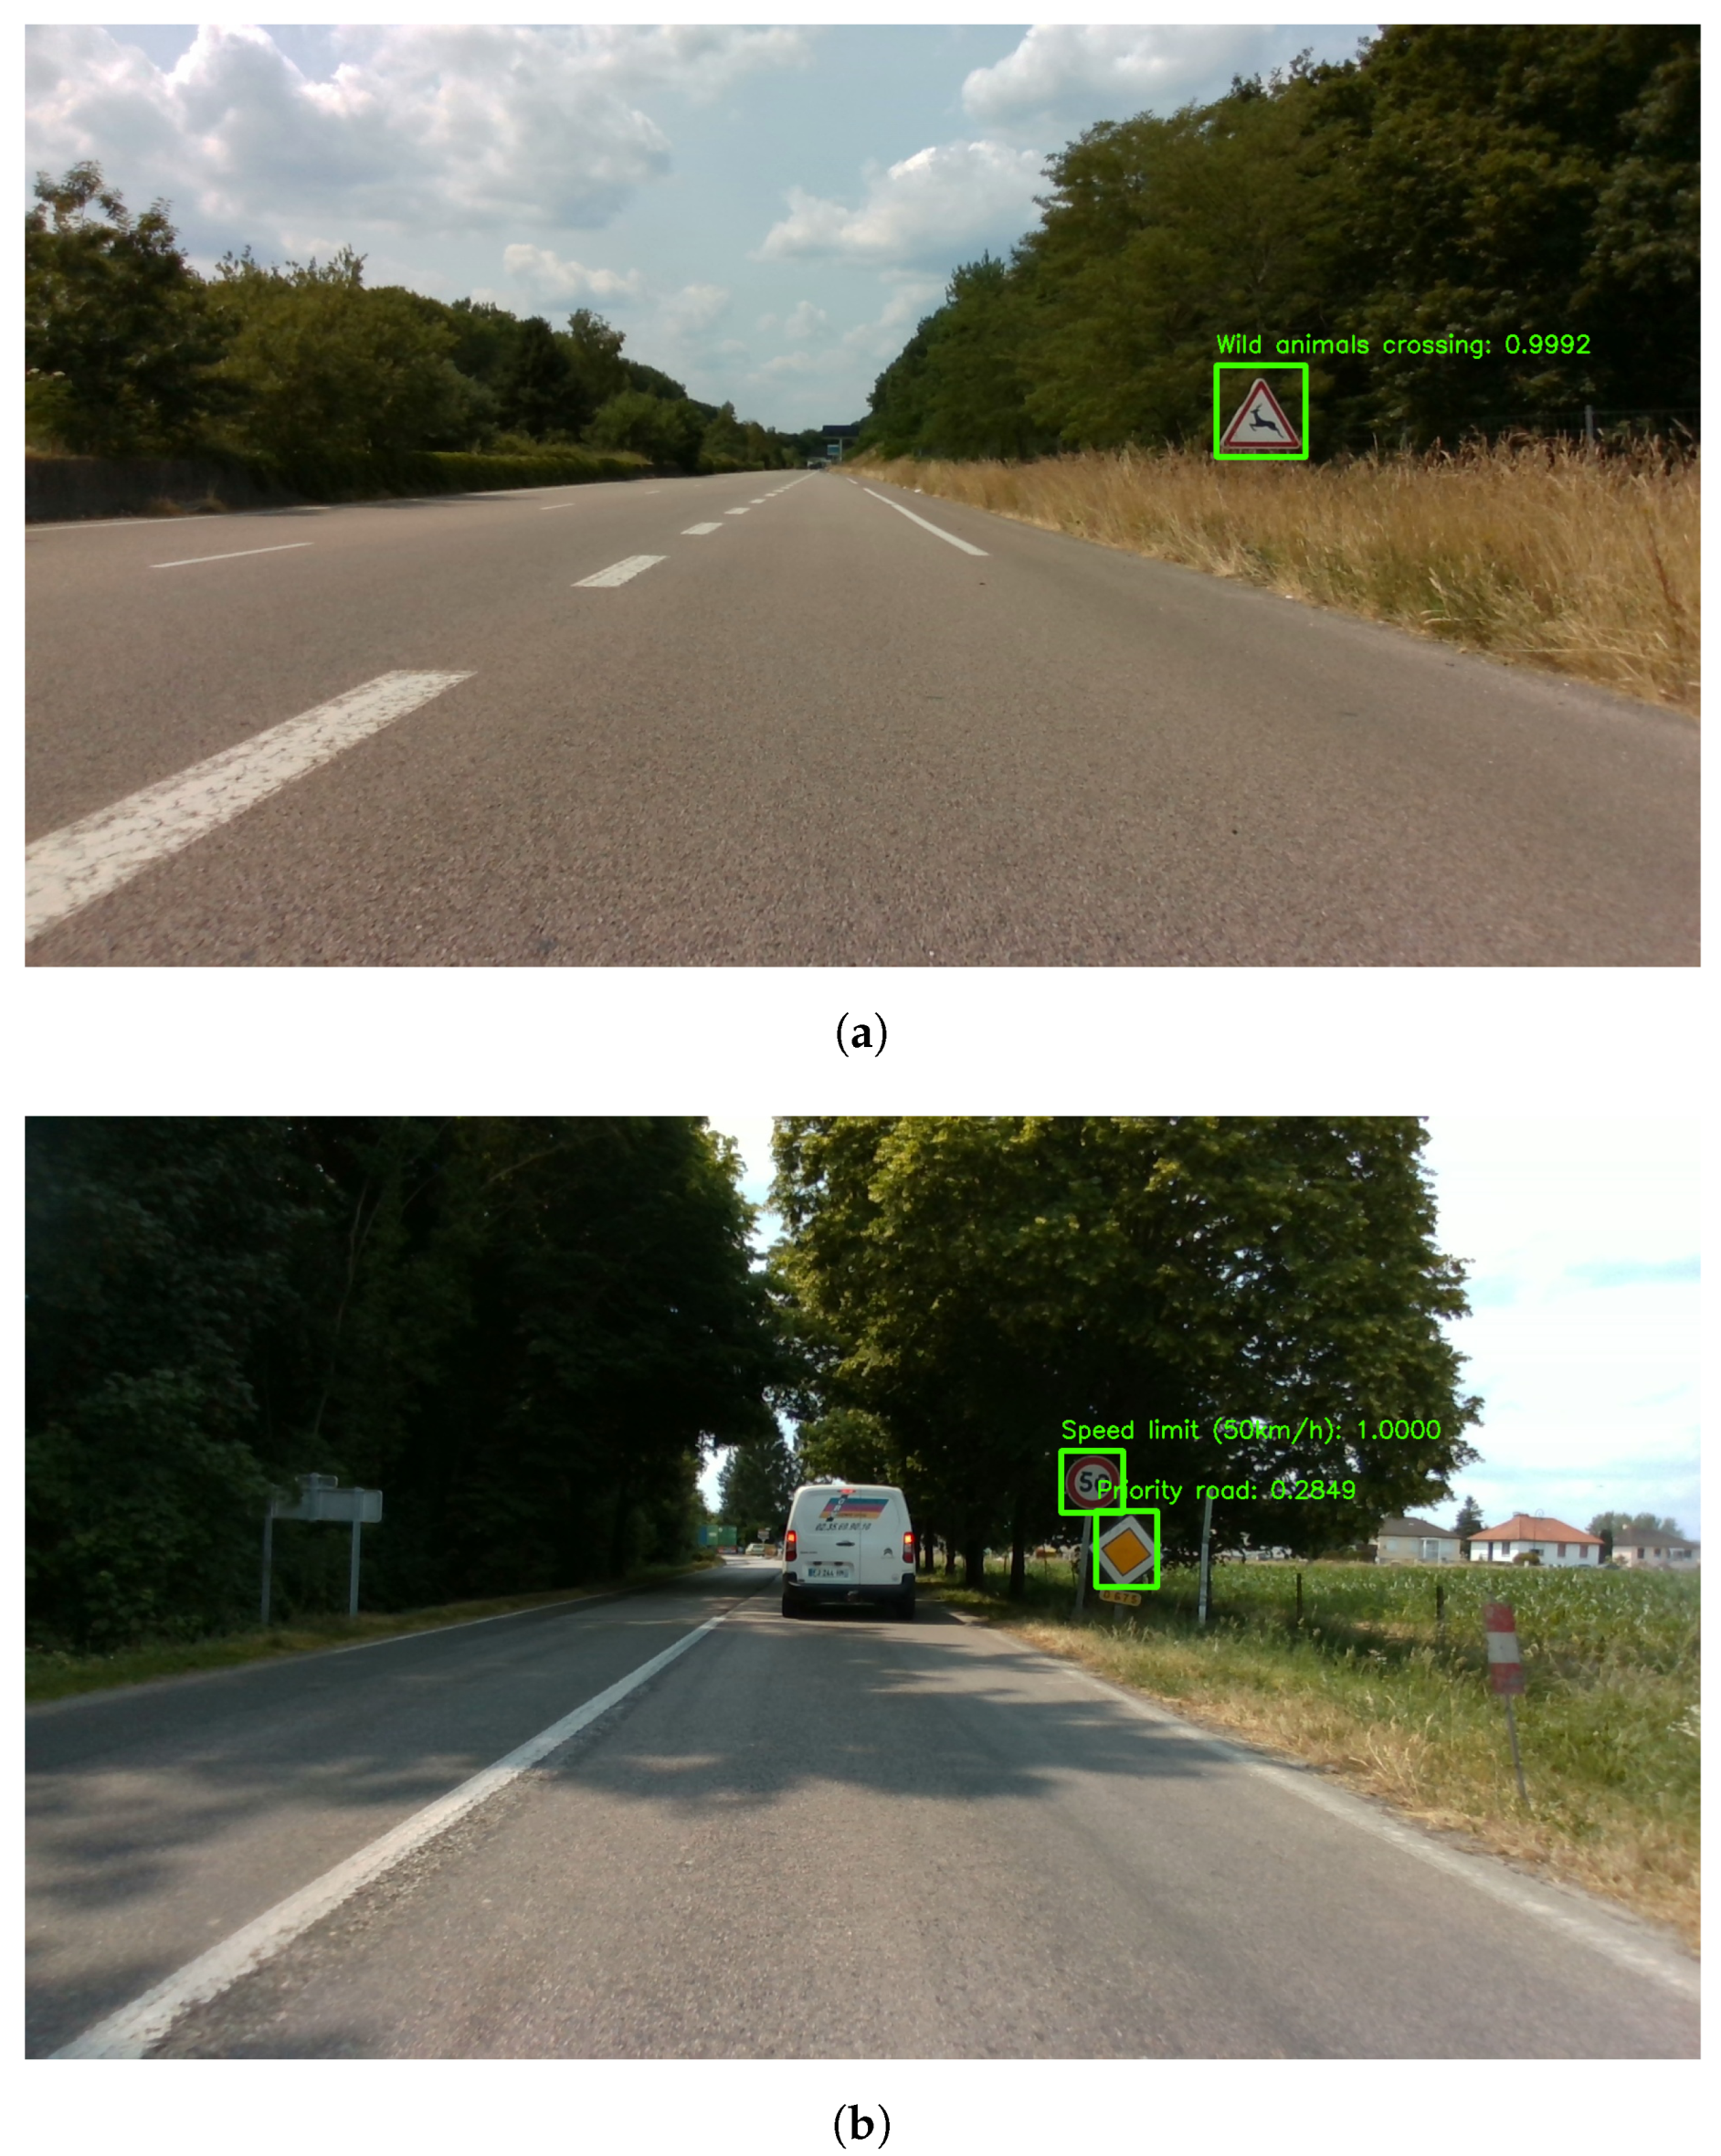
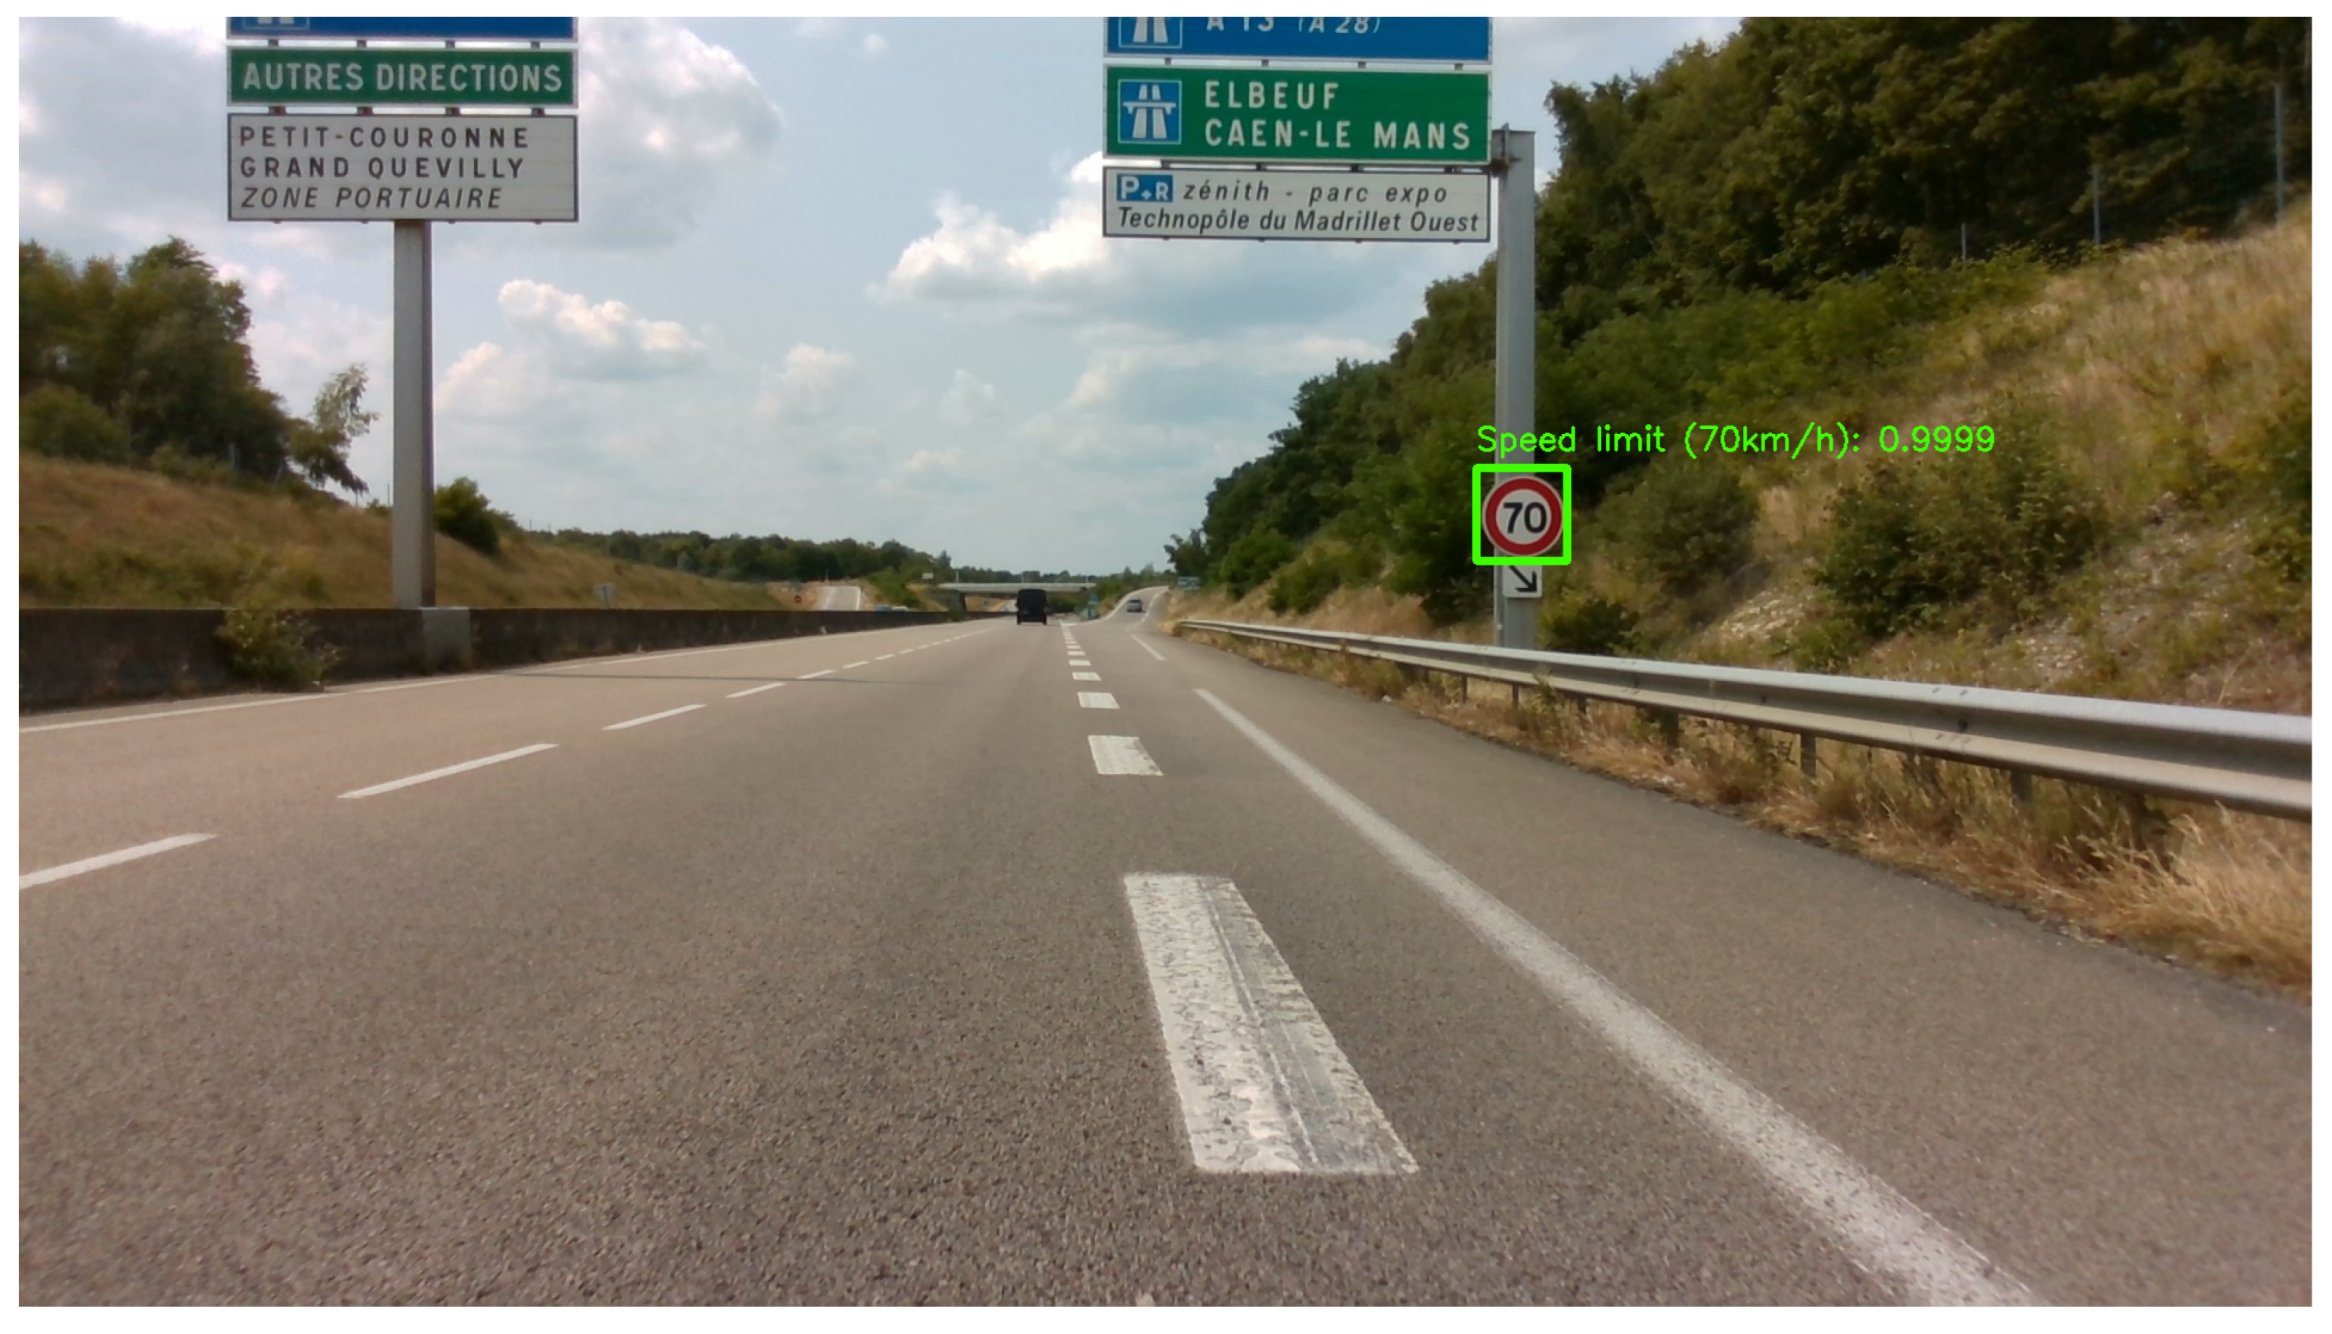
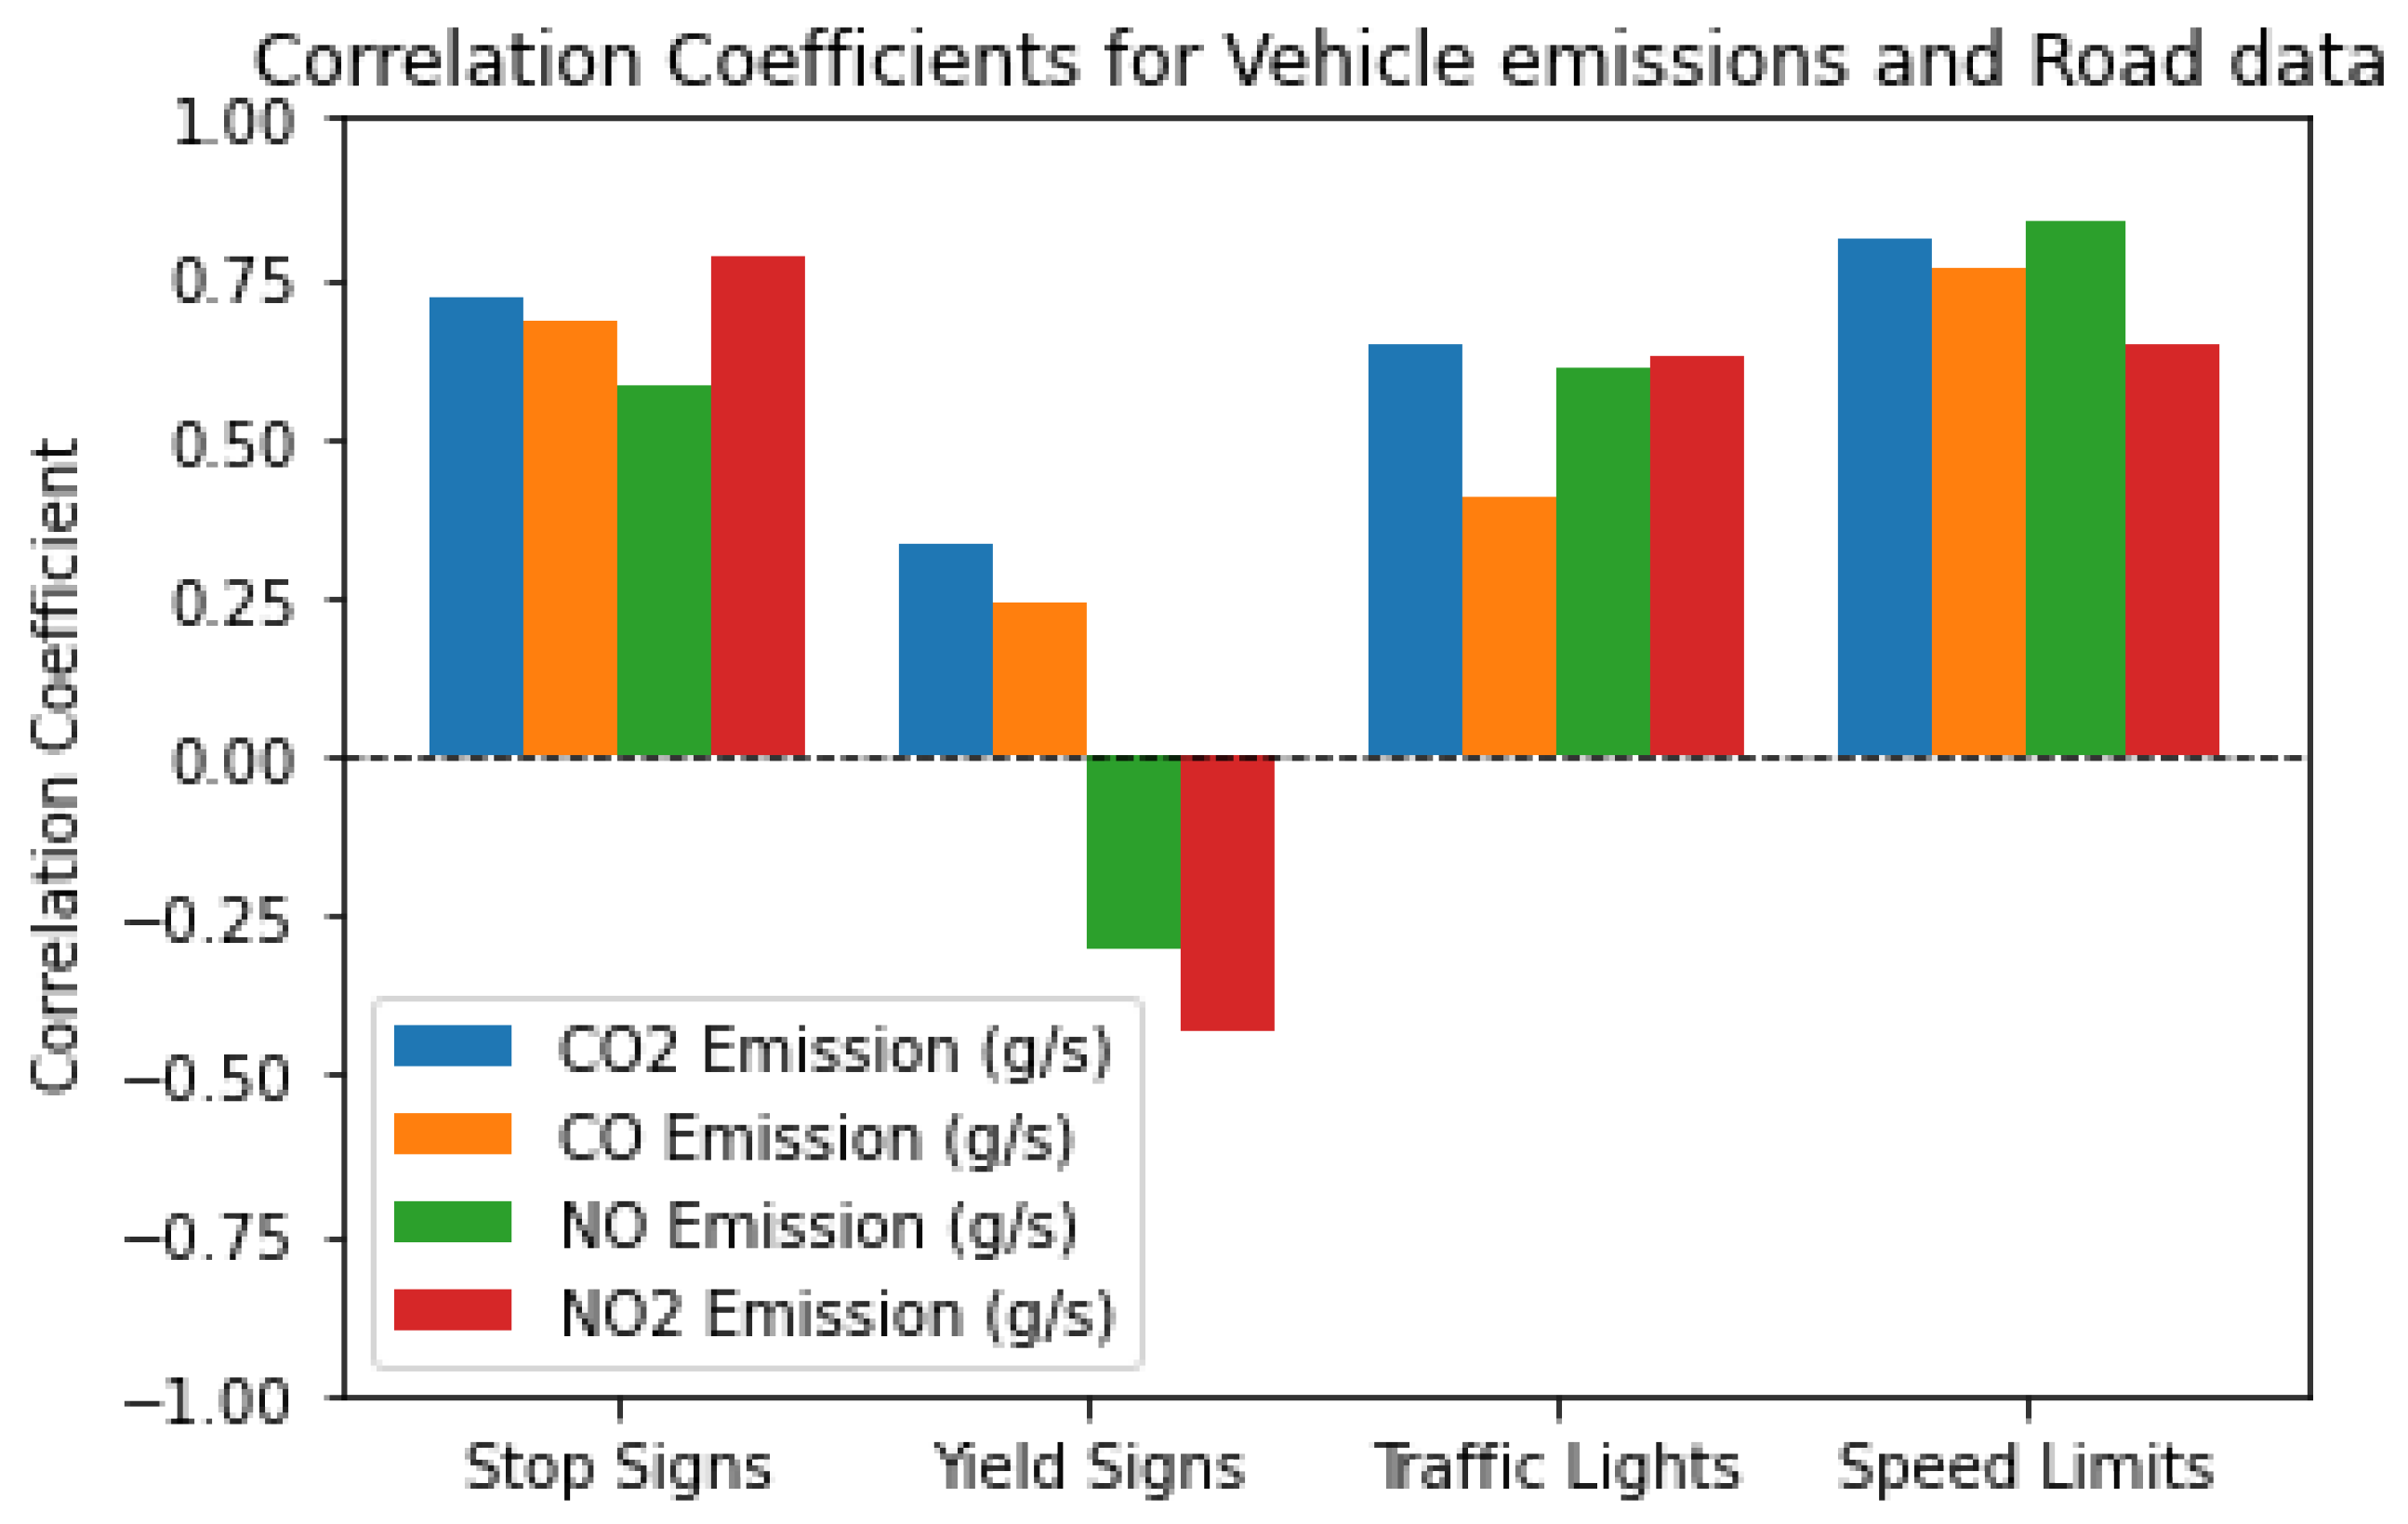
4.2.3. Traffic Signs Detection

This section looks into traffic sign detection. These unassuming markers hold immense significance, shaping both route conditions and vehicle behavior. Their impact extends beyond visual cues, influencing road state and emissions.
Traffic signs act as dynamic regulators, directing motorist behavior and safety. Furthermore, they impact emissions discretely through speed restrictions and operational changes. This is not a monolithic environment; the many signs reflect the intricacies of modern highways. From speed limits to stop signs, each sign contributes to our overall awareness of the road.
Traffic sign detection requires interpreting visual symbols and contextual meanings. This fusion of technology and human dynamics results in safer travel and less environmental effect. We adopted a detection strategy hinging on pre-trained YOLOv3 and CNN models [27]. This approach, introduced in 2020 and documented by two pivotal articles [28,29], has consistently yielded robust outcomes. The architecture of this approach is shown in Figure 7. It commences with YOLOv3, proficient in detecting and identifying traffic signs. Subsequently, a CNN model undertakes the classification of these detected signs, attributing distinct labels to each.
The progression of loss and mAP (Mean Average Precision) throughout the training process, involving a total of 8000 iterations, is noteworthy. These models were trained on the German Traffic Sign Detection Benchmark (GTSDB) dataset. This dataset, replete with authentic road sign images, encompasses 40 different classes and a total of 50,000 images (Stop, Yield, Speed limit, etc.).
The progression of loss and mAP (Mean Average Precision) throughout the training process, involving a total of 8000 iterations, is noteworthy. Notably, Mean Average Precision (mAP) is a crucial metric in object detection tasks, serving as a comprehensive measure of a model’s accuracy in localizing objects within an image and assigning accurate labels to them. It strikes a balance between precision, which assesses the accuracy of positive predictions, and recall, which measures the model’s ability to identify all relevant instances. The mAP score is determined by calculating the Average Precision (AP) for each class and then averaging these values across all classes.
The Average Precision is calculated using Formula (1):
A P = n ( P ( n ) × precision at n ) Total number of positive predictions
where n ranges over the sorted predictions by confidence score, and P ( n ) is an indicator function that equals 1 if the prediction at position n is a true positive, and 0 otherwise.
Therefore, achieving a 97% mAP on the 5700th iteration is a significant milestone. This high mAP value indicates that the model has excelled in both accurately localizing objects and assigning accurate labels, making it an optimal point to capture the parameters of the model.
Subsequently, we applied this model to our gathered images, yielding commendable results and accurate detections, as shown in the figures below. Figure 8 illustrates a subset of the successful detections obtained from our image collection, and Table 3 shows the number of detections gathered from our real-world test cycles.
Our main focus gravitates toward specific categories, notably encompassing speed limits spanning 20 to 120 km/h, stop signs, animal crossings, road working zones, and school zones. These categories assume paramount significance due to their potential to significantly influence road conditions and vehicular emissions. Their selection as distinctive features stems from their capacity to tangibly impact the dynamics of the road environment and the emission levels of vehicles navigating through them.
A notable emphasis is placed on our methodology for speed limit detection. By sequentially processing the image stream, we maintain the continuity of the detected speed limit value across subsequent images. When a speed limit is identified, this numerical value persists until a different speed limit figure is detected. For instance, as shown in Figure 9, the model has successfully identified a speed limit of 70 km/h. This speed limit value is then attributed to subsequent images until an alternative speed limit detection is encountered.
For the remaining detection categories, a straightforward approach is adopted. We assign a value of 1 to indicate presence and 0 to signify absence in each respective image. This streamlined approach uniformly encapsulates the detection outcomes within the dataset.

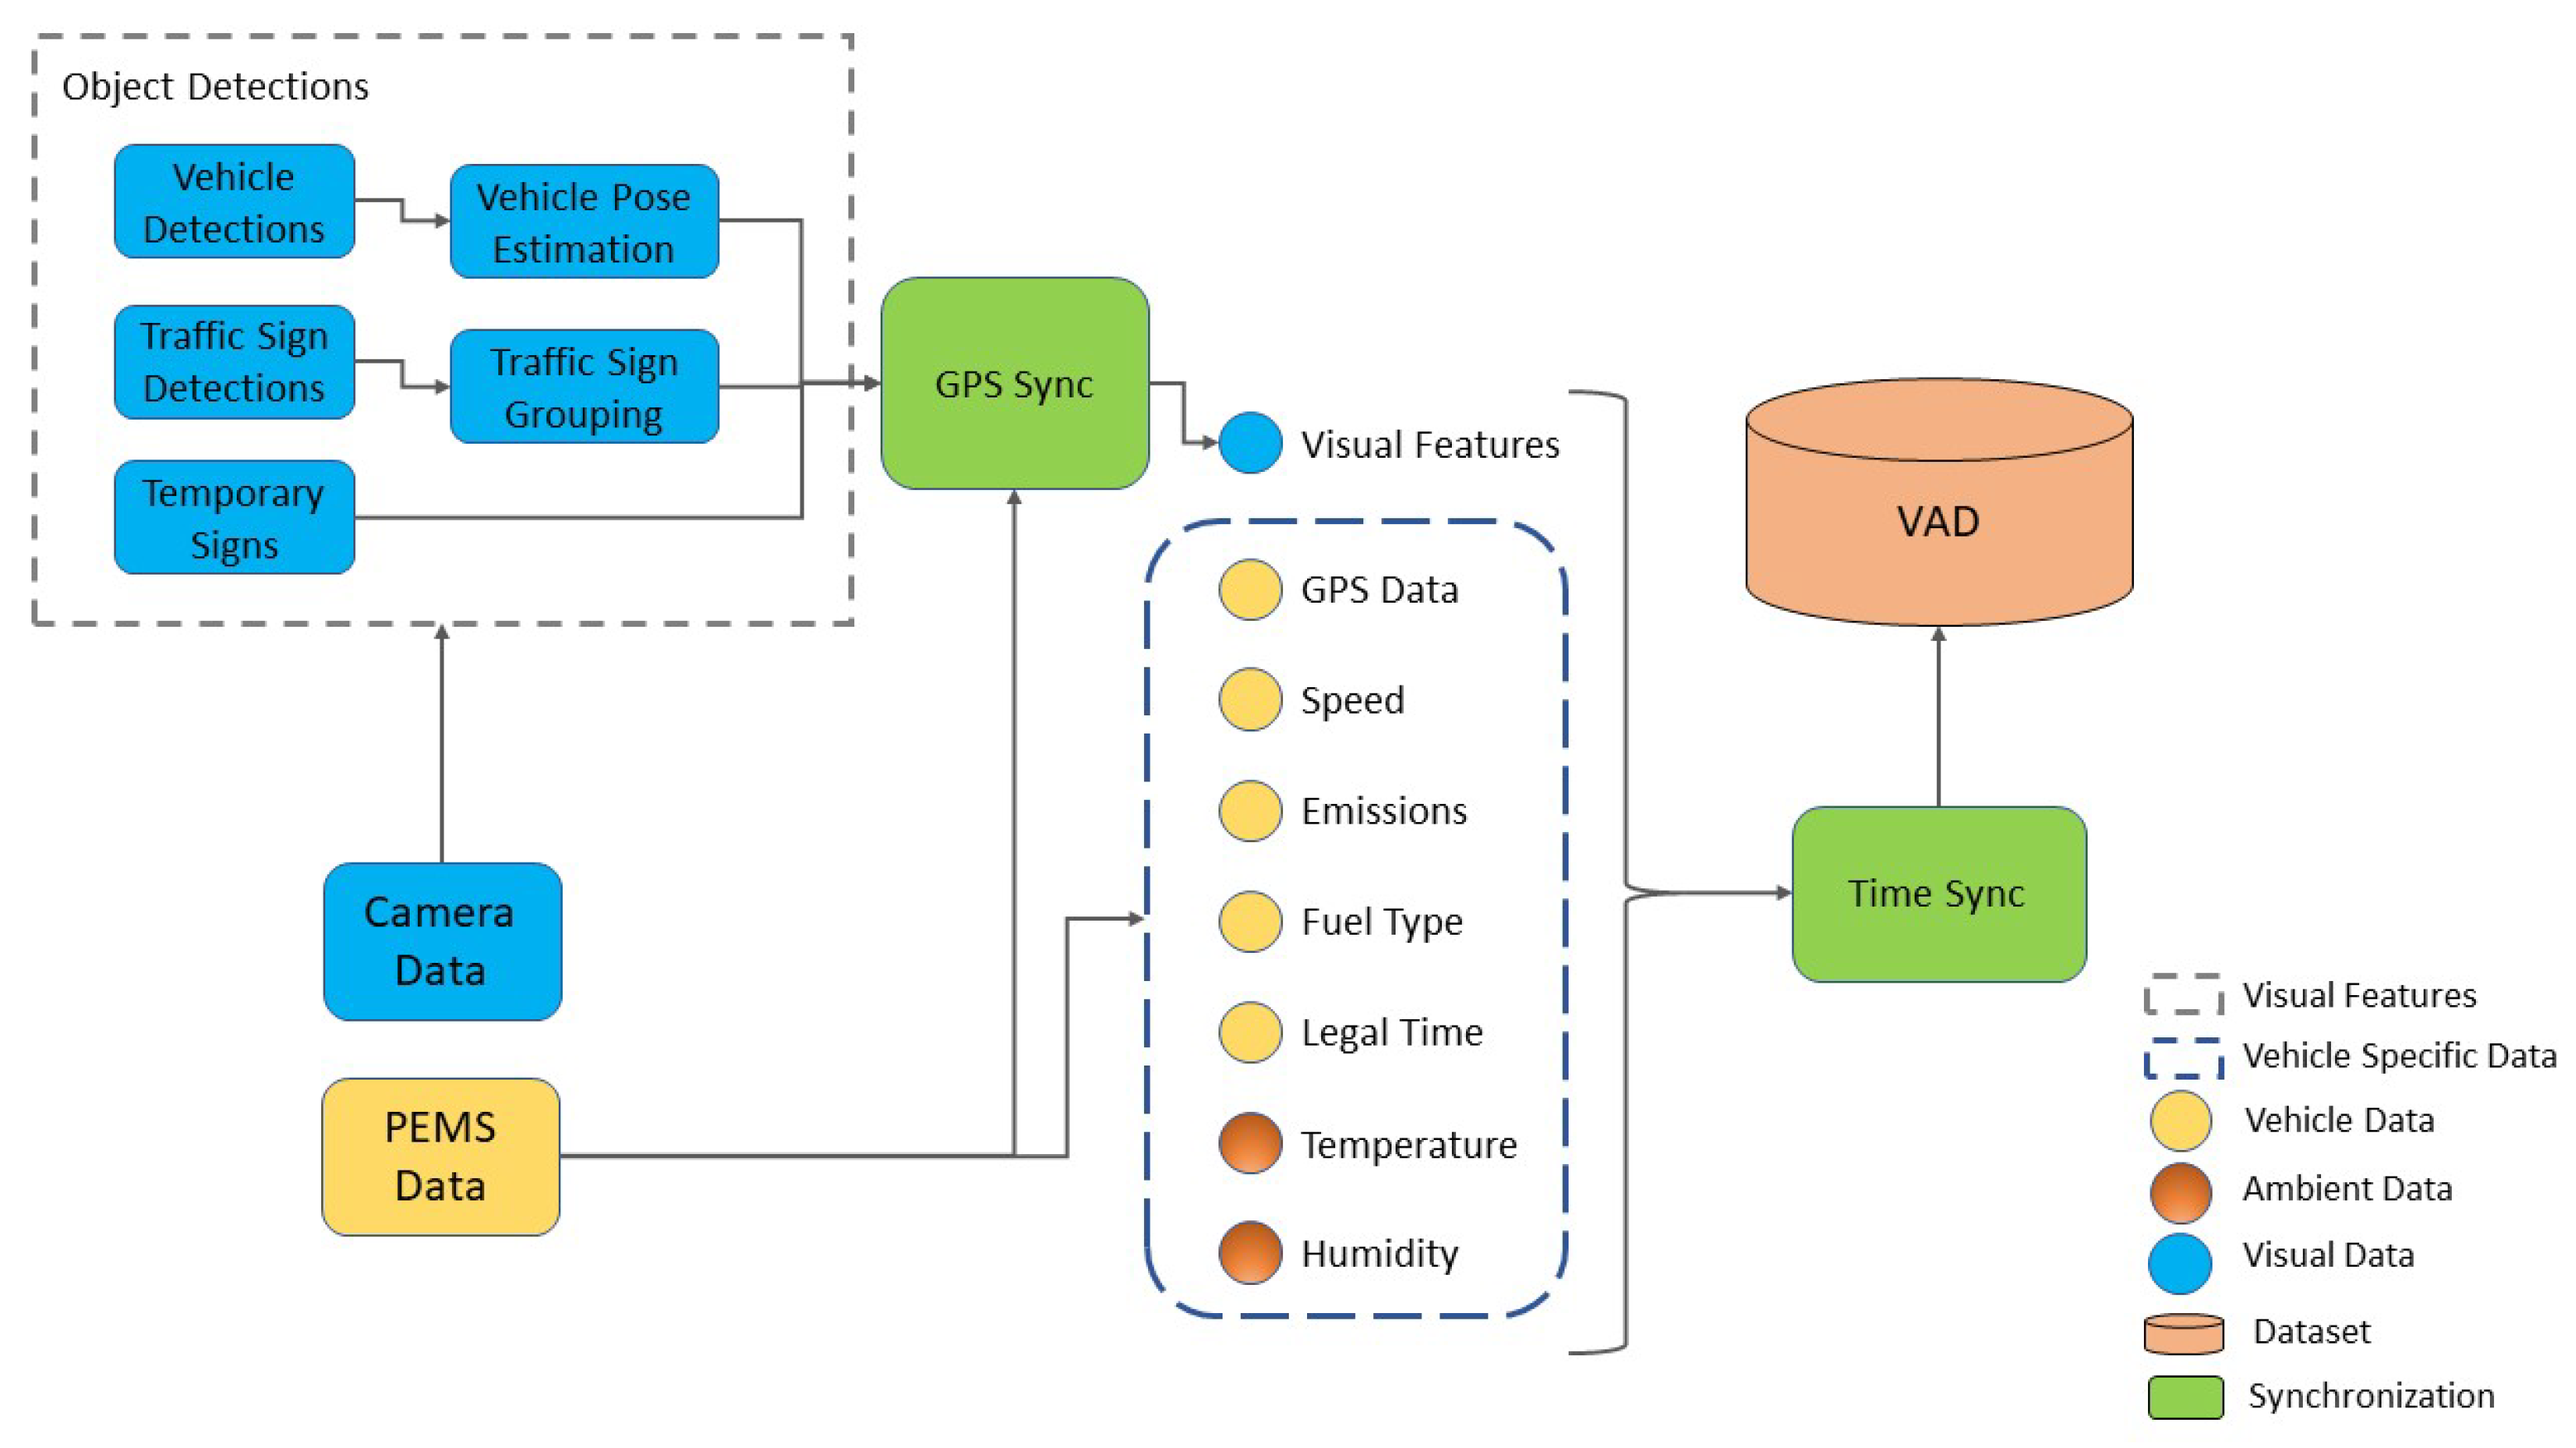
4.3. Data Synchronization

To obtain the final format of the Vehicle Activity Dataset, a crucial step involves the integration of both PEMS data and image data. This amalgamation necessitates a meticulous synchronization process to align these two disparate data sources cohesively. As explained earlier, PEMS and images are acquired at different frequencies—1 Hz for PEMS and 5 frames per second (fps) for images. This proximity in frequency implies an inevitable incongruity in the data counts, with the image count exceeding that of the available PEMS data.
The methodology involves aligning the timestamp of each captured PEMS data entry. With a fixed timestamp for each collected PEMS dataset, we determine the closest corresponding image by examining the temporal proximity between the timestamps. Through this meticulous comparison, we ensure a cohesive alignment between the PEMS data and their corresponding image snapshot.
This synchronization process not only bridges the temporal gap between data sources but also fortifies the integrity of our dataset, facilitating an accurate correlation between the captured road scenes and the concurrent traffic and environmental measurements.
After completing the synchronization process, our dataset attains its ultimate format, comprising 28,972 data rows. The dataset incorporates PEMS data detailed in Table 1, covering emissions, ambient data and vehicle data. Additionally, it includes road data from Table 3, encompassing information about traffic signs, traffic lights, and traffic density. The finalized dataset is structured as a CSV file for ease of accessibility and utilization.
To enhance our understanding of the correlation between vehicle emissions and road data, we employ a statistical measure known as the point-biserial correlation coefficient. This coefficient facilitates the calculation of the correlation between our continuous vehicle gas emissions and categorical road data. The formula for the point-biserial correlation coefficient ( r p b ) is given by:
r p b = X ¯ 1 X ¯ 0 s p
where X ¯ 1 is the mean of the vehicle gas emissions for the group with existing road data (1), X ¯ 0 is the mean for the group with non-existing road data (0), and s p is the pooled standard deviation defined as:
s p = ( n 1 1 ) s 1 2 + ( n 0 1 ) s 0 2 n 1 + n 0 2
Here, n 1 is the number of observations in the group with existing road data, n 0 is the number of observations in the group with non-existing road data, s 1 is the standard deviation of the vehicle gas emissions for the group with existing road data, and s 0 is the standard deviation for the group with non-existing road data. The correlation factor estimates the point-biserial correlation coefficient between certain road data and the emissions of CO, CO 2 , NO, and NO 2 from vehicles, as illustrated in Figure 10. Notably, there is a strong correlation observed between stop signs and speed limits with all types of vehicle gas emissions. Traffic lights exhibit a moderate correlation with CO 2 , NO, and NO 2 , but a weaker one with CO. On the other hand, yield signs show a low correlation with vehicle gas emissions, with a negative correlation specifically noted with NO and NO 2 emissions.

5. Conclusions

In conclusion, the development of the Vehicle Activity Dataset represents a significant step towards creating a versatile and comprehensive resource for understanding and optimizing traffic dynamics. The strategic fusion of vehicle data and road scene information, with a special focus on environmentally friendly routes, reflects the project’s commitment to a niche but crucial aspect of transport. What sets VAD apart is its adaptability, demonstrated by the seamless integration of additional traffic signs and road scene details. This not only meets the needs of the current project but also provides a robust foundation for future initiatives, enhancing the versatility of the dataset. Delving into the conceptual framework reveals a commitment to extracting diverse information that promises to increase the overall richness of the dataset and unlock its full potential for a variety of applications. The results obtained show that our developed dataset could be a good tool for different approaches in the field of eco-mobility and how to reduce and optimize energy consumption. This dataset is now being used to train our AI algorithm for a new open-access real-time Green Map platform dedicated to smart mobility. VAD exhibits promising potential with diverse practical implications, extending its utility to comprehend road environments and analyze vehicle operations. The dataset proves valuable for developing models related to environmentally friendly route planning, investigating the relationship between road infrastructure and vehicle emissions, optimizing traffic management, and informing road development strategies. In essence, VAD not only tackles existing challenges but also sets the foundation for future advancements in the field of intelligent transportation systems.
However, it is imperative to acknowledge the limitations inherent in any dataset, including VAD. Detection models, although powerful, inherently carry a probability of error, leading to potential inaccuracies in the recorded data. It is crucial to recognize that these errors may result in false positives or negatives, impacting the dataset’s reliability in certain scenarios. Additionally, the elimination of certain images during the synchronization phase introduces a potential source of information loss, and although this may be inconsequential at lower vehicle speeds, it becomes a critical concern at higher speeds, where the real-time dynamics of the road environment may be compromised.

Author Contributions

Conceptualization, V.P., B.S. and R.K.; formal analysis, F.J., V.P., R.K., T.B., R.R., B.S. and J.F.; methodology, V.P., R.K. and B.S.; software, F.J., V.P. and R.K.; supervision, V.P., R.K., B.S., T.B., R.R., J.F., A.O. and M.J.; validation, F.J., V.P., R.K., B.S., T.B., R.R., J.F., A.O. and M.J.; implementation, F.J. and V.P.; visualization, F.J., V.P. and R.K.; writing—original draft, F.J., V.P. and R.K.; writing—review and editing, F.J., V.P. and R.K.; project administration, R.K., B.S., T.B., R.R., A.O. and M.J.; funding acquisitions, R.K., B.S., A.O. and M.J. All authors have read and agreed to the published version of the manuscript.

Funding

This research received no external funding.

Institutional Review Board Statement

Not applicable.

Informed Consent Statement

Not applicable.

Data Availability Statement

The data presented in this study are available on request from the corresponding author. At present, the data are not publicly available as they are undergoing consideration for release. We are actively reviewing the feasibility of making the data accessible to the public while ensuring compliance with ethical standards and data protection regulations.

Acknowledgments

We acknowledge the support of SEGULA technology and the role it played in allowing us to conduct this research. We also thank the Carnot ESP CETRIA project for funding all hardware and software of this research. Many thanks to our industrial partner through the Carnot ESP Project, CERTAM laboratory, for their all contributions in the different trials in real traffic conditions. Many thanks to their all trials STAFF (technicians) and specifically, R. Lelord for their significant contribution to the dataset collection and different validation tests. We would like to thank the engineers and technicians (A. Deshais, M. Dehais, C. Allegre, and J. Fourre) of the Autonomous Navigation Laboratory (ANL) of IRSEEM for their support. We thank Firas Jendoubi, Benjamin Sibille, Robin Lelord, and Vishnu Pradeep for their precious help in the development of this work. We also thank ArtISMo (Algorithms for Realtime Intelligent Smart Mobility) and the ANR (Agence National de la Recherche) Project for the help given. In addition, this work was performed, in part, on computing resources provided by CRIANN (Centre Régional Informatique et d’Applications Numériques de Normandie, Normandy, France).

Conflicts of Interest

Authors Avigaël Ohayon and Mohammad Jouni were employed by the company SEGULA Technology. The remaining authors declare that the research was conducted in the absence of any commercial or financial relationships that could be construed as a potential conflict of interest.

Abbreviations

The following abbreviations are used in this manuscript:
VADVehicle Activity Dataset
ICTInformation and Communication Technologies
ITSIntelligent Transportation Systems
EVElectric Vehicle
CNNConvolutional Neural Networks
COCOCommon Objects in Context
CRIANNCentre Régional Informatique et d’Applications Numériques de Normandie
(Regional Center for Computer Science and Digital Applications of Normandy)
UNUnited Nations
GHGGreenHouse Gases
VRPVehicle Routing Problems
AIArtificial Intelligence
PEMSPortable Emissions Measurement Systems
ESRORADEsigelec Engineering High School and Segula technologies ROad and RAilway Dataset
CERTAMCentre Régional d’Innovation et de Transfert Technologique
(Regional Center for Innovation and Technology Transfer)
FPSFrame-Per-Second
GPSGlobal Positioning System
GTAGrand Theft Auto
IMUInertial Measurement Unit
KITTIKarlsruhe Institute of Technology & Toyota Technological Institute at Chicago
vision benchmark suite
RGBRed Green Blue
LIDARLight Detection Furthermore, Ranging
mAPMean Average Precision
APAverage Precision
MOTMulti-Object Tracking
NUScenesNuTonomy Scenes
SORTSimple Online and Realtime Tracking
SOTAState Of The Art
SYNTHIASYNTHetic Collection of Imagery and Annotations
YOLOYou Look Only Once

References

  1. Benítez-López, A.; Alkemade, R.; Verweij, P.A. The impacts of roads and other infrastructure on mammal and bird populations: A meta-analysis. Biol. Conserv. 2010, 143, 1307–1316. [Google Scholar] [CrossRef]
  2. Trabelsi, R.; Khemmar, R.; Decoux, B.; Ertaud, J.Y.; Butteau, R. Recent advances in vision-based on-road behaviors understanding: A critical survey. Sensors 2022, 22, 2654. [Google Scholar] [CrossRef]
  3. Pantangi, S.S.; Ahmed, S.S.; Fountas, G.; Majka, K.; Anastasopoulos, P.C. Do high visibility crosswalks improve pedestrian safety? A correlated grouped random parameters approach using naturalistic driving study data. Anal. Methods Accid. Res. 2021, 30, 100155. [Google Scholar] [CrossRef]
  4. Chen, X.; Jiang, L.; Xia, Y.; Wang, L.; Ye, J.; Hou, T.; Zhang, Y.; Li, M.; Li, Z.; Song, Z.; et al. Quantifying on-road vehicle emissions during traffic congestion using updated emission factors of light-duty gasoline vehicles and real-world traffic monitoring big data. Sci. Total Environ. 2022, 847, 157581. [Google Scholar] [CrossRef] [PubMed]
  5. Negre, E.; Rosenthal-Sabroux, C.; Gascó, M. A knowledge-based conceptual vision of the smart city. In Proceedings of the 2015 48th Hawaii International Conference on System Sciences, Kauai, HI, USA, 5–8 January 2015; pp. 2317–2325. [Google Scholar]
  6. Chai, N.; Abidin, W.; Ibrahim, W.; Ping, K.H. Energy Efficient Approach Through Intelligent Transportation System: A Review. In Proceedings of the 6th International Engineering Conference, Energy and Environment (ENCON 2013), Kuching, Malaysia, 1–4 July 2013; pp. 165–170. [Google Scholar]
  7. Online. World Urbanization Prospects. 2023. Available online: https://www.un.org/en/development/desa/population/theme/urbanization/index.asp (accessed on 23 March 2023).
  8. Online. World Energy Usage by 2050. 2023. Available online: https://www.eia.gov/outlooks/ieo/ (accessed on 6 March 2023).
  9. Liu, L.; Wang, K.; Wang, S.; Zhang, R.; Tang, X. Assessing energy consumption, CO2 and pollutant emissions and health benefits from China’s transport sector through 2050. Energy Policy 2018, 116, 382–396. [Google Scholar] [CrossRef]
  10. Ayyildiz, K.; Cavallaro, F.; Nocera, S.; Willenbrock, R. Reducing fuel consumption and carbon emissions through eco-drive training. Transp. Res. Part F Traffic Psychol. Behav. 2017, 46, 96–110. [Google Scholar] [CrossRef]
  11. Singh, H.; Kathuria, A. Profiling drivers to assess safe and eco-driving behavior—A systematic review of naturalistic driving studies. Accid. Anal. Prev. 2021, 161, 106349. [Google Scholar] [CrossRef] [PubMed]
  12. Muslim, N.H.; Keyvanfar, A.; Shafaghat, A.; Abdullahi, M.M.; Khorami, M. Green driver: Travel behaviors revisited on fuel saving and less emission. Sustainability 2018, 10, 325. [Google Scholar] [CrossRef]
  13. Zhang, S.; Wu, Y.; Liu, H.; Huang, R.; Yang, L.; Li, Z.; Fu, L.; Hao, J. Real-world fuel consumption and CO2 emissions of urban public buses in Beijing. Appl. Energy 2014, 113, 1645–1655. [Google Scholar] [CrossRef]
  14. Srivatsa Srinivas, S.; Gajanand, M. Vehicle routing problem and driver behaviour: A review and framework for analysis. Transp. Rev. 2017, 37, 590–611. [Google Scholar] [CrossRef]
  15. Sheykhfard, A.; Haghighi, F.; Bakhtiari, S.; Moridpour, S.; Xie, K.; Fountas, G. Analysis of traffic conflicts with right-turning vehicles at unsignalized intersections in suburban areas. Int. J. Transp. Sci. Technol. 2023. [Google Scholar] [CrossRef]
  16. Garcia-Castro, A.; Monzon, A. Using floating car data to analyse the effects of its measures and eco-driving. Sensors 2014, 14, 21358–21374. [Google Scholar] [CrossRef] [PubMed]
  17. Cabani, A.; Khemmar, R.; Ertaud, J.Y.; Rossi, R.; Savatier, X. ADAS multi-sensor fusion system-based security and energy optimisation for an electric vehicle. Int. J. Veh. Auton. Syst. 2019, 14, 345–366. [Google Scholar] [CrossRef]
  18. Sagaama, I.; Kchiche, A.; Trojet, W.; Kamoun, F. Evaluation of the energy consumption model performance for electric vehicles in SUMO. In Proceedings of the 2019 IEEE/ACM 23rd International Symposium on Distributed Simulation and Real Time Applications (DS-RT), Cosenza, Italy, 7–9 October 2019; pp. 1–8. [Google Scholar]
  19. Benevolo, C.; Dameri, R.P.; D’auria, B. Smart mobility in smart city: Action taxonomy, ICT intensity and public benefits. In Empowering Organizations: Enabling Platforms and Artefacts; Springer: Cham, Switzerland, 2016; pp. 13–28. [Google Scholar]
  20. Ceylan, R.; Özbakır, A. Increasing Energy Conservation Behavior of Individuals towards Sustainable and Energy-Efficient Communities. Smart Cities 2022, 5, 1611–1634. [Google Scholar] [CrossRef]
  21. Bahn, O.; Marcy, M.; Vaillancourt, K.; Waaub, J.P. Electrification of the Canadian road transportation sector: A 2050 outlook with TIMES-Canada. Energy Policy 2013, 62, 593–606. [Google Scholar] [CrossRef]
  22. Karademir, M.; Ozbakir, B.A. Environmental pollution analysis from urban tranformation and construction and demolition wastes management: Istanbul Kadikoy case study. In Proceedings of the CPUD’18, Istanbul, Türkiye, 11–12 March 2018; p. 108. [Google Scholar]
  23. Kumar, A.; Kashiyama, T.; Maeda, H.; Omata, H.; Sekimoto, Y. Real-time citywide reconstruction of traffic flow from moving cameras on lightweight edge devices. ISPRS J. Photogramm. Remote Sens. 2022, 192, 115–129. [Google Scholar] [CrossRef]
  24. Sekilab. Vehicle Orientation Dataset. 2023. Available online: https://github.com/sekilab/VehicleOrientationDataset/ (accessed on 12 June 2023).
  25. Kumar, A.; Kashiyama, T.; Maeda, H.; Sekimoto, Y. Citywide reconstruction of cross-sectional traffic flow from moving camera videos. In Proceedings of the 2021 IEEE International Conference on Big Data (Big Data), Orlando, FL, USA, 15–18 December 2021; pp. 1670–1678. [Google Scholar]
  26. Kairess. Crosswalk-Traffic-Light-Detection-Yolov5. 2022. Available online: https://github.com/kairess/crosswalk-traffic-light-detection-yolov (accessed on 28 June 2023).
  27. Sichkar, V. Traffic Signs Detection by YOLO v3, OpenCV, Keras. 2021. Available online: https://www.kaggle.com/code/valentynsichkar/traffic-signs-detection-by-yolo-v3-opencv-keras (accessed on 5 July 2023).
  28. Sichkar, V.; Kolyubin, S.A. Real time detection and classification of traffic signs based on YOLO version 3 algorithm. Sci. Tech. J. Inf. Technol. Mech. Opt. 2020, 20, 418–424. [Google Scholar] [CrossRef]
  29. Sichkar, V.; Kolyubin, S.A. Effect of various dimension convolutional layer filters on traffic sign classification accuracy. Sci. Tech. J. Inf. Technol. Mech. Opt. 2019, 19, 546–552. [Google Scholar] [CrossRef]
Figure 1. Overview of VAD construction.
Applsci 14 00338 g001
Figure 2. PEMS installed in our test vehicle.
Applsci 14 00338 g002
Figure 3. Intel RealSense camera mounted on the front of the vehicle.
Applsci 14 00338 g003
Figure 4. Some examples of our collected images.
Applsci 14 00338 g004
Figure 5. Highlighting vehicle detection with orientation: showcasing examples from our dataset. (a) Initial vehicles detection results with outlined bounding boxes and orientation arrows for a comprehensive overview. (b) Detailed analysis of vehicle orientation within bounding boxes.
Applsci 14 00338 g005
Figure 6. Traffic light detection showcasing examples from our dataset. (a) Red light detected. (b) Green light detected.
Applsci 14 00338 g006
Figure 7. Architectural workflow—YOLOv3 detection followed by CNN classification.
Applsci 14 00338 g007
Figure 8. Exemplars of traffic sign detection from our dataset. (a) Detection of animal crossing sign. (b) Detection of speed limit sign and yield sign.
Applsci 14 00338 g008
Figure 9. Identifying 70km/h Speed Limit Signs in Our Dataset.
Applsci 14 00338 g009
Figure 10. Analyzing the correlation between vehicle emissions and road data.
Applsci 14 00338 g010
Table 1. Overview of PEMS data in VAD.
Fuel TypeVariablesData SizeMinimumMaximumMeanSTD
DieselCO 2 (g/s)28,972 (Rows)6.51 × 10 7 16.3593.1023.009
CO (g/s)3.38 × 10 10 0.3681.3 × 10 3 0.01
O 2 (g/s)0.000217.3983.8182.389
NO (g/s)2.74 × 10 8 0.1240.0140.018
NO 2 (g/s)2.01 × 10 8 0.01980.00250.0032
Vehicle Speed (km/h)0136.89962.87639.623
Ambient Pressure (kPa)99410251007.67235.875
Ambient Humidity (%)29.2100.767.91715.910
Ambient Temperature (K)290.75301.85293.9172.471
Table 2. Information collected during experiments on various directions.
Date (DD/MM/YY)SourceDestinationDistance (Km)Time (Min)Number of ImagesPEMS Data
Eco-route16/06/2023ESIGELECBosgouet272867851334
16/06/2023BosgouetESIGELEC262450871125
Fastest route16/06/2023ESIGELECBosgouet242761091278
16/06/2023BosgouetESIGELEC292349551752
Eco-route24/07/2023ESIGELECYvetot444611,2243211
24/07/2023YvetotESIGELEC464311,3792545
Fastest route24/07/2023ESIGELECYvetot434411,1393132
24/07/2023YvetotESIGELEC423910,1442195
Eco-route25/07/2023ESIGELECSaint-Saens425512,6643819
25/07/2023Saint-SaensESIGELEC435212,1623322
Fastest route25/07/2023ESIGELECSaint-Saens394812,0013052
25/07/2023Saint-SaensESIGELEC394611,5862984
Table 3. Overview of detected objects.
GroupClassNumber of Detections
Traffic SignsSpeed Limit757
Stop Sign206
Animal Crossing95
Bicycle Crossing209
Zebra Crossing4846
Yield Sign982
Roundabout Sign664
School Zone21
Temporary SignsRoad work192
Traffic LightsRed and Green1089
Traffic DensityOngoing34,891
Incoming21,058
Disclaimer/Publisher’s Note: The statements, opinions and data contained in all publications are solely those of the individual author(s) and contributor(s) and not of MDPI and/or the editor(s). MDPI and/or the editor(s) disclaim responsibility for any injury to people or property resulting from any ideas, methods, instructions or products referred to in the content.

