Abstract
As the automotive industry transitions towards the era of autonomous vehicles, it is imperative to assess and compare the following distances maintained by vehicles equipped with adaptive cruise control (ACC) systems against those of traditional human-driven vehicles. This study aims to provide insights into the future use of autonomous vehicles by empirically examining the following distances achieved under different driving conditions. Controlled experiments were conducted using three vehicles equipped with various types of ACC sensors, and comparable scenarios were replicated with human drivers. The experiments involved driving at multiple constant speeds to evaluate the efficacy of ACC in maintaining safe following distances. Our findings indicate that ACC systems consistently converge on optimal following distances, demonstrating their ability to regulate spacing between vehicles effectively. However, a notable downside emerged in terms of their adverse impact on road capacities, where the results indicate a mitigation in capacity percentages of 7.6%, 9.3%, and 15.6% for the three types of ACC-equipped vehicles compared to human drivers. This study sheds light on the intricate interplay between ACC systems and human driving behaviors, emphasizing the need to consider both factors when envisioning the future of autonomous vehicles. While ACC systems provide a standardized and reliable approach to following distances, the shorter distances observed in human-driven scenarios suggest a potential trade-off between safety and traffic capacity. These insights contribute to a comprehensive understanding of the dynamics involved in autonomous driving, facilitating informed decision making for the integration of autonomous vehicles into future transportation systems.
1. Introduction
The adaptive cruise control (ACC) system, considered as one of the pioneering Advanced Driving Assistance Systems (ADASs), plays a crucial role in overseeing the longitudinal movement of vehicles. As a testament to the continuous evolution of automotive technology, ACC systems vary across different commercial vehicles, yet they share a common goal of enhancing driving safety and convenience [1,2]. This technology represents a significant stride towards semi-autonomous driving by incorporating intelligent features that adapt to changing traffic conditions. While the specific functionalities of ACC systems may differ, they typically utilize radar, lidar, or vision-based sensors to monitor the surrounding environment, including their operation under adverse weather conditions [3,4], allowing the vehicle to automatically adjust its speed and maintain a safe following distance from the vehicle ahead [5,6,7]. This not only promotes a smoother driving experience but also contributes to overall road safety [8,9].
The potential impact of ACC systems extends beyond individual vehicles, as their widespread adoption holds promise for influencing traffic flow and capacity [10,11,12]. By optimizing speed and spacing between vehicles, ACC has the potential to mitigate traffic congestion and improve the overall efficiency of road networks [13]. However, in the field of vehicular dynamics, the dichotomy between traditional human-driven vehicles and those equipped with ACC systems signifies a pivotal shift in how we approach following distances and optimize traffic capacities. It is well-known that human drivers, with their inherently variable reaction times and subjective judgment, often manage following distances based on personal experience, perception, and real-time assessments. In contrast, ACC systems, a cornerstone of automated driving technology, meticulously calculate and maintain consistent following distances through the sensor technology provided by sophisticated algorithms [14]. Therefore, understanding the tiny details of these distinctions is essential as it unravels the potential of enhancing road safety, traffic flow, and overall transport efficiency.
1.1. Background
Researchers demonstrate a significant inclination to reduce time and space headway by AVs either through normal traffic pattern [15] or platooning traffic pattern [16,17,18]. While achieving enhanced capacities in light traffic seems advantageous, careful consideration of congestion avoidance becomes crucial in denser traffic to prevent delays and surpass traffic breakdowns [19]. In a large body of literature, ACC models are employed to simulate the longitudinal movement behavior of autonomous vehicles (AVs). The expected effect of ACC systems on traffic flow and stability is viewed as favorable. Kesting et al. [20] revealed that cars equipped with ACC resulted in significant decreases in traffic congestion. Similarly, Shi and Li [21], in their study, have shown that headway settings have a remarkable effect on the stability of traffic flow. The studies demonstrated that the shortest ACC headway setting can significantly improve road capacity compared with existing human-driven vehicle traffic. Furthermore, Arnaout and Arnaout [22] mentioned that extending ACC to the more developed CACCs allows for closer following distances, in which the advantages of the increase in traffic flow appear more clearly. It is worth mentioning that researchers have also considered the impact of AV penetration rate (percentage of ACC or other ADAS-equipped vehicles in mixed traffic), as it has significant influence on road capacities. For instance, Park et al. [23] revealed that an increase in traffic capacity of 40% was obtained when AV penetration rate reached 100%. Vander Werf et al. [24] stated that increasing ACC penetration from 20% to 40% results in a higher increase in traffic capacity than increasing ACC penetration from 0% to 20%. However, there are some other researchers who acknowledged the adverse effects of ACC on traffic capacity. Calvert et al. [25] demonstrate that a negative impact on traffic flow occurs at low penetration rates, while capacity enhancements are observed at autonomous vehicle (AV) rates exceeding 70%. In contrast, James et al. [26] reported that a proportion of less than 25% of ACC vehicles is beneficial to roadway capacity, while the wider deployment of ACC vehicles significantly harms capacity. Şentürk Berktaş and Tanyel [27] revealed that the capacity of the studied intersection decreased by using autonomous vehicles without communication. In general, the divergent perspectives on the impact of adaptive cruise control (ACC) range from positive to negative evaluations. It is important to note that most insights into ACC’s effects stem from the validation of research conclusions employing simulation-based methodologies, rather than direct field testing. For this reason, field experiments yield more dependable conclusions, as they rely on observations in authentic, real-world conditions. However, conducting field tests presents challenges, demanding substantial resources and meticulous organization to ensure accurate testing. Refs. [28,29,30] have carried out a simultaneous empirical field experiments involving several cars to assess the real-world effects of ACC. This assessment involved measuring both the car-following space and time headways. Similarly, Makridis et al. [31] and Shi and Li [21] also conducted empirical field tests to explore the influence of various parameters, including the response time of controllers, available time headway settings, and time lag. The outcomes revealed notably extended time ranges and time lags, surpassing the values documented in existing literature. This discrepancy emphasizes the importance of practical field investigations in uncovering nuances and deviations that may not be adequately captured by theoretical or simulated studies.
1.2. Study Objectives and Overview
Our study aims to complement existing empirical research by investigating the impact of ACC systems on traffic flow and capacity. This is achieved through a comparative analysis of space headways, focusing on vehicles equipped with ACCs versus human-driven vehicles. The investigation involves field tests specifically designed to target driving at multiple constant speeds, with the goal of gaining a deeper understanding of car-following behavior in both types of vehicles. The remainder of this paper is organized as follows. Section 2 describes the empirical campaign and the study area. Section 3 outlines the methodology used to obtain field measurements and the equations employed for further analysis. Section 4 presents the results of the comparison between human-driven and ACC-equipped vehicles, focusing on the obtained following distances and the analysis of achieved capacities. In Section 5, we discuss the reported results and compare them to other relevant works. Section 6 concludes with some final remarks and a discussion of the future directions of this paper.
2. Experimental Campaign
An experimental campaign was conducted at the ZalaZONE proving ground in Hungary, with the primary objective of assessing the performance of vehicles equipped with ACC systems. The campaign utilized a two-lane motorway section spanning 1.5 km, providing sufficient length for a comprehensive study. The runs were carried out on the designated motorway section to facilitate a controlled and replicable environment for testing ACC-equipped vehicles. This setup allowed researchers to collect valuable data on the behavior and effectiveness of ACC systems under various conditions. During the experiment, three distinct vehicles were selected with the basic information shown in Table 1, each equipped with different ACC sensor types:

Table 1.
Basic information of the tested vehicles.
- Subaru Levorg: The Subaru Levorg was selected to represent a vehicle equipped with a camera-based ACC sensor (Eyesight). The front-mounted position of Eyesight allows the sensor to capture a wide range of visual information, including traffic conditions, lane markings, and potential obstacles, ensuring the ACC system’s ability to make informed decisions in real time.
- Volvo XC40: The Volvo XC40 was selected as a representative vehicle with a combined ACC sensor system, utilizing both camera and radar technologies. While cameras are adept at identifying visual cues, such as lane markings and traffic signs, radar excels in measuring the distance and speed of objects. This dual-sensor setup aims to provide a more robust and comprehensive approach to ACC.
- VW e-Golf: The VW e-Golf was included in the experiment to showcase a vehicle relying solely on radar-based ACC sensor technology. Choosing the electric VW E-Golf for this experiment not only diversifies the pool of ACC-equipped vehicles but also underscores the adaptability of ACC technology to electric platforms in which different sets of dynamics are presented.
The utilization of human-driven vehicles in comparison to those above-mentioned vehicles equipped with ACC systems is considered as a focal point of the research. To conduct a comprehensive analysis, data collection took place across diverse roadways within Gyor City. In this study, the lead vehicle floated through the road network, serving as a data collection platform for observing and recording the behaviors of randomly following vehicles, which are considered to be exclusively human-driven, although distinguishing between purely human-driven vehicles and those equipped with ACC while on the road can be challenging, as modern vehicles often incorporate a variety of ADAS. However, there are certain visual cues and behavioral indicators that may help us make an educated guess. For example, human drivers may exhibit more erratic driving behavior, including sudden accelerations, abrupt lane changes, and less predictable speed variations. In addition, older vehicle models are less likely to be equipped with ACC systems. It is important to emphasize that these indicators are not conclusively definitive. To address this, comprehensive trials were conducted for the case of human driving and meticulously analyzed to attain accurate results and overcome potential uncertainties.
3. Methodology
In this study, data were collected for both ACC-equipped and human-driven vehicles to investigate the differences in traffic flow parameters between the two types of vehicles. The following distance was considered as the basis to generate other achievements, as explained in the following subsections.
3.1. Data Collection
Data collection at the ZalaZONE experimental area included a large number of driving runs performed by ACC-equipped vehicles. Each trial involved the driving of two vehicles consecutively on the motorway, with the first serving as the leader and the second as the follower, as depicted in Figure 1.
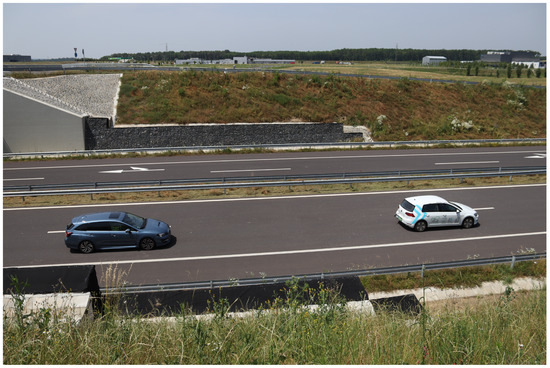
Figure 1.
Car following process at ZalaZONE Motorway section (source: own photo).
At this stage, our three testing vehicles equipped with ACC systems were involved in three distinct scenarios. First, the Subaru served as the following vehicle, followed by the Volvo in the second scenario, and lastly, the WV in the third scenario. The tests were conducted on the ZalaZONE motorway, where only the two vehicles under examination were present on the track, ensuring a precise evaluation of the ACC performance. The experiments took place under very suitable weather conditions to avoid any impact on the ACC sensors’ performance. It is worth mentioning that the driving task during these experiments was performed by three individuals of different ages. Colleagues accompanied them inside the vehicles to observe and facilitate the data collection process. Car-following distance data were meticulously collected using the RPLIDAR device to ensure precision throughout the experiment. This device was securely attached to the rear bumper of the leading vehicle, consistently recording the distance to the front bumper of the following vehicle. See Figure 2. The three vehicles equipped with ACC took turns acting as followers, providing a comprehensive examination of their ACC systems on the ZalaZONE Motorway.
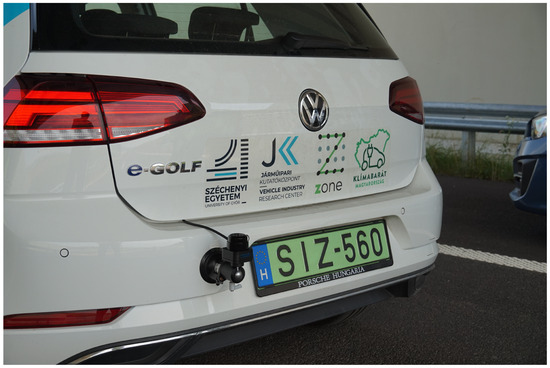
Figure 2.
RPLIDAR device fixed to rear bumber of the leading vehicle (source: own photo).
Concurrently, random human-driven vehicles were also tested as followers on the ordinary roads, and their following behavior was observed using the same device. The data collection process was initiated when a randomly driven human-operated vehicle closely approached the rear bumper of the preceding vehicle, capturing the necessary measurements. To maintain an unbiased comparison with ACC-equipped vehicles, instances of acceleration and deceleration were not taken into consideration during the recording. During this phase, the work team inside the leader vehicle engaged in continuous monitoring, observing a laptop screen connected to the RPLIDAR device, as illustrated in Figure 3.
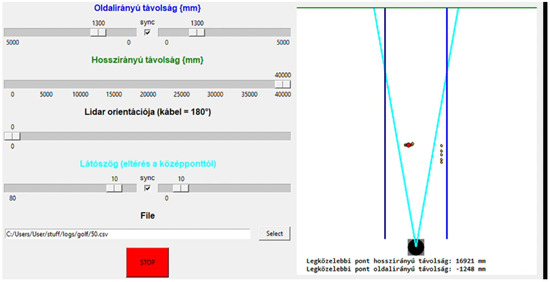
Figure 3.
Screenshot of the monitoring software at data recording.
3.2. Steady Speeds and Applied ACC Settings
The study intends to collect car-following distances between vehicles under controlled and constant driving speeds, ranging from 30 km/h to 110 km/h with 10 km/h incremental intervals. Incorporating nine constant driving speeds allowed for the isolated analysis of three scenarios involving ACC-equipped vehicles’ measurements, along with one scenario for human-driven measurements. This resulted in a minimum of 36 test runs along the ZalaZONE track and Győr roadways. It is important to note that the actual number of test runs exceeds this minimum due to initial test runs that lacked precision and reasonability at the start of each run. This extensive range of study speeds is expected to yield valuable insights into the efficiency of ACC systems. The experiment specifically focuses on the ACC’s shortest setting, denoted as setting 1. This setting represents the minimum time or distance recommended by the ACC manufacturer for the follower vehicle to maintain while following another vehicle. It is important to note that this minimum setting is applied throughout the experiment as the study aims to draw plausible comparisons with human-driven vehicles, particularly those driven by young individuals who are often assumed to drive aggressively and maintain shorter following distances.
3.3. Calculation of Traffic Flow Parameters
After obtaining the distances between two consecutive vehicles, hereafter referred to as “Clearances”, the analysis of data began by comparing ACC-equipped and human-driven vehicles through illustrative figures. The relationship between clearances and the corresponding driving speeds was also depicted to better investigate the differences. Subsequently, other traffic flow parameters such as space headway, time headway, density, and flow, as defined in ref. [32] and shown in Figure 4, were calculated using the relevant equations as follows:
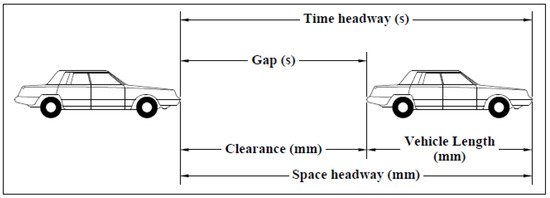
Figure 4.
Clearance, gap, space, and time headway.
Traffic flow and traffic capacity are distinct concepts in transportation engineering, where traffic flow refers to the actual movement of vehicles, and traffic capacity represents the maximum sustainable flow rate that a roadway or transportation facility can handle. It is important to note that, in our specific analysis, we have employed a unique perspective in which, as mentioned earlier, the shortest clearances using ACC setting 1 were considered in data collection with a multiple of controlled constant speed. Consequently, a maximum traffic flow was calculated under these specific conditions, and for the purpose of our study, this calculated maximum flow has been assumed to be synonymous with the term “traffic capacity”.
4. Results
The results obtained from the experimental work are analyzed and presented in this section. Calculation of the average clearance for both scenarios of human-driven and ACC vehicles is first presented, followed by an analysis of the other microscopic characteristics including space headway, time headway, and traffic density and capacity through driving at different constant speeds.
4.1. Average Clearance Analysis
The RPLIDAR device used in the field experiment directly recorded the clearances between every two following vehicles. Figure 5, Figure 6 and Figure 7 illustrate the clearances for all types of vehicles during driving at low constant speeds of 30, 40, and 50 km/h. The distribution of clearances for each vehicle category is interpreted using a Lollipop diagram. In this diagram, dots represent the mean clearances for the corresponding driving category, and each dot is connected by a vertical line, representing the average clearances for the entire dataset.
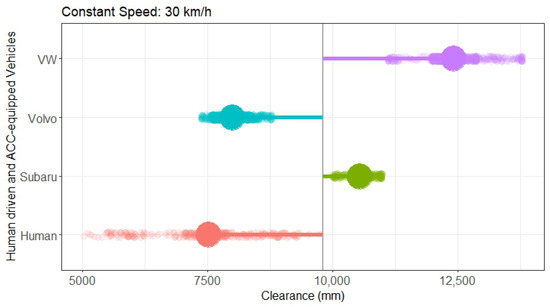
Figure 5.
Vehicle clearances at driving speed of 30 km/h.
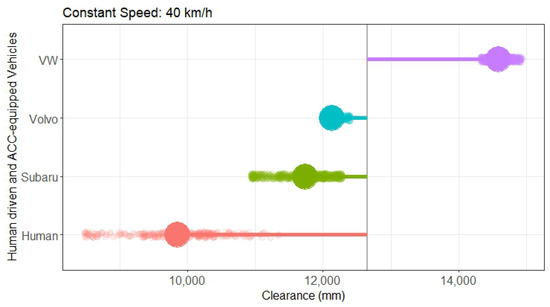
Figure 6.
Vehicle clearances at driving speed of 40 km/h.
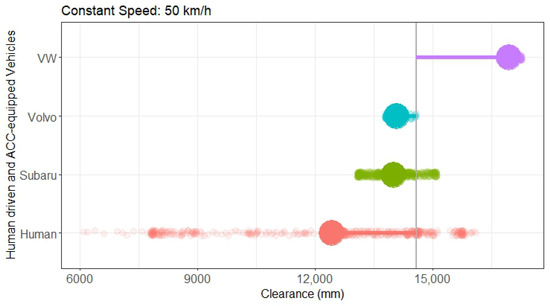
Figure 7.
Vehicle clearances at driving speed of 50 km/h.
From the above illustrative figures, it is evident that clearances obtained by human-driven vehicles (red) are shorter than those of all other ACC-equipped vehicles at this low range of constant speeds. The average clearances for human-driven vehicles were only 7514, 9846, and 12,420 mm, respectively. Vehicles equipped with Volvo’s combined camera and radar ACC sensor recorded the closest average clearance, measuring 7985 mm at 30 km/h. As the driving speed increased, Subaru achieved the second-shortest average clearance, measuring 10,537 mm at 40 km/h and 11,732 mm at 50 km/h, utilizing Eyesight technology. Conversely, VW demonstrated safer following distances using radar ACC during this phase of the experiment, with all individual average values falling below the overall average line.
In the next phase of the experiment, the vehicles’ performance was tested at medium constant driving speeds of 60, 70, and 80 km/h. The results showed a consistent pattern of shorter clearances, with the following order for the mentioned speeds: Human-driven, Subaru, Volvo, and then VW. The minimum differences in average clearance between the human-driven and the nearest ACC vehicle for the three speeds were 451, 1456, and 587 mm, respectively. Meanwhile, the maximum differences between the human-driven and the farthest vehicle were recorded as 3567, 3200, and 3588 mm, respectively. Figure 8, Figure 9 and Figure 10 illustrate the performance of vehicles to provide the shortest clearances during driving at medium speeds.
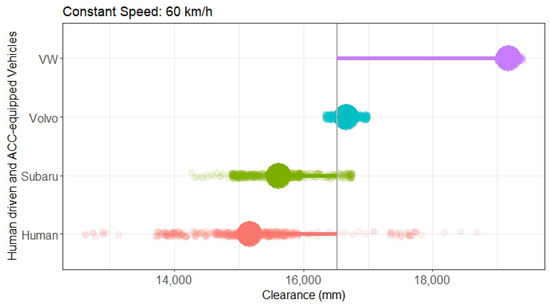
Figure 8.
Vehicle clearances at driving speed of 60 km/h.
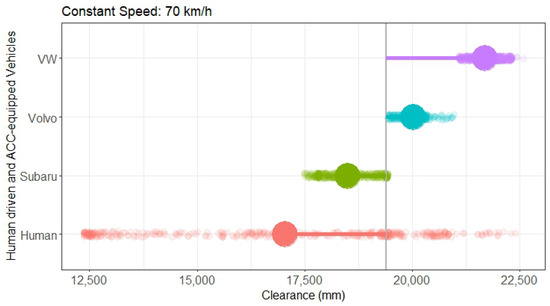
Figure 9.
Vehicle clearances at driving speed of 70 km/h.
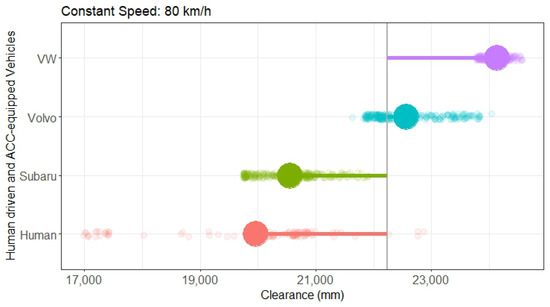
Figure 10.
Vehicle clearances at driving speed of 80 km/h.
Later, at high-speed ranges of 90, 100, and 110 km/h, human-driven vehicles continued to follow the leading vehicle at closer distances. In contrast, ACC vehicles exhibited varying following behavior. For example, at 90 km/h, Volvo was the second vehicle to generate the shortest distances ahead, while at 100 and 110 km/h, it provided the largest average clearance among the vehicles. Subaru, on the other hand, closely mirrored human-driven behavior at the maximum test driving speed of 110 km/h, with recorded average clearances of 27,247 mm for Subaru and 27,211 mm for the human-driven vehicle. The oscillation behavior exhibited by ACC vehicles at high speeds may become a limitation to their performance. Figure 11, Figure 12 and Figure 13 depict the distribution of the clearances at the high range of driving speeds.
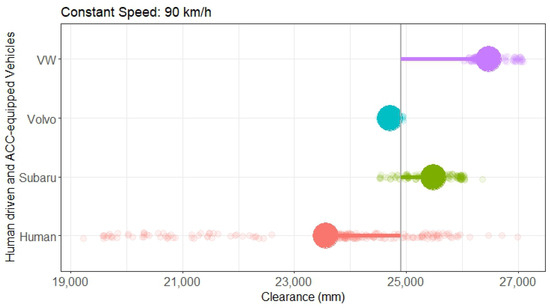
Figure 11.
Vehicle clearances at driving speed of 90 km/h.
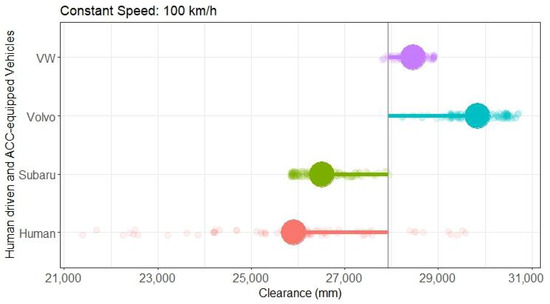
Figure 12.
Vehicle clearances at driving speed of 100 km/h.
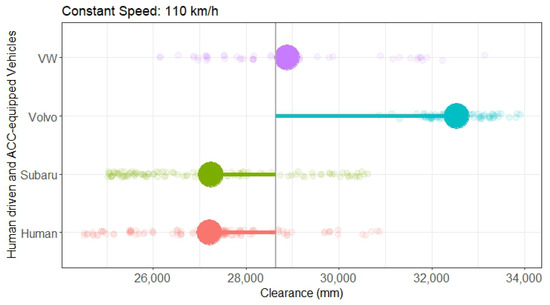
Figure 13.
Vehicle clearances at driving speed of 110 km/h.
Overall, the result emphasized the fact that humans tend to exhibit a more assertive driving style compared to the utilization of ADAS represented by driving using ACC tools. This characteristic is particularly evident in their ability to make dynamic decisions regarding the proximity to other vehicles based on the intricacies of the driving environment and spatial configurations. The discretionary nature of human decision making during the driving task emerges as a distinctive advantage, allowing for nuanced adjustments in following distances. An additional noteworthy observation pertains to the discernible dissimilarity in the distribution of data around the means for vehicles operated by humans across all tested speeds. This variance highlights the inherent variability in human driving behavior, showcasing a broader range of responses to diverse driving conditions. This diversity contrasts sharply with the more concentrated data generated by ACC systems, especially noticeable across various speeds, albeit with exceptions in the high-speed ranges. This can be noticed by observing the exceptional performance of VW. The data analysis reveals a remarkable degree of symmetry in the distribution, indicating a heightened level of consistency in performance. Notably, this consistency is reflected in the convergence of the three measures of central tendency towards nearly identical values. This convergence suggests a robust and uniform performance by VW’s ACC system, underlining its effectiveness in maintaining a steady and predictable driving pattern across different driving speeds. Table 2 and Figure 14 summarize the average clearance analysis for the studied vehicles.

Table 2.
Summary of average clearance for all tested vehicles.
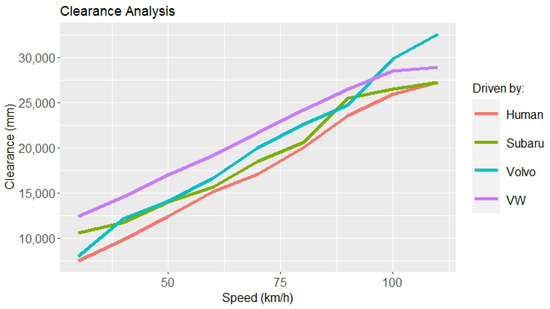
Figure 14.
Summary of average clearance of tested vehicles.
4.2. Space Headway, Time Headway, Density, and Capacity Analysis
The average space headways are calculated using Equation (1), as explained in the methodology section. The length of each vehicle presented in Table 1 is summed to the average clearance of the corresponding vehicle to obtain the average space headway. However, the human-driven data are collected from randomly selected vehicles detected by the lidar device while driving on roads. Therefore, it is assumed that the length of these vehicles equals the average of the selected ACC vehicles to ensure a fair comparison. One important reason behind this is that the detected human-driven vehicles were either sedans or SUVs, which are in the same category as the vehicles used in our experiment. Furthermore, the average time headways are calculated using Equation (2). In this equation, each average space headway is divided by the corresponding constant driving speed employed during the experiment. This derived parameter holds significant importance in our study, serving as a crucial metric for comparison with results documented in the existing literature. The incorporation of this normalized time headway allows us to contextualize and benchmark our findings against established research, providing a comprehensive understanding of how our experiment aligns with and contributes to the broader body of knowledge in the field. An example calculation of the average space headway and average time headway for Subaru at a speed of 30 km/h is illustrated below. The other experiment results are provided in Table 3.

Table 3.
Average space and time headway for tested vehicles.
The final phase of this study involves the calculation of traffic density and traffic capacity achieved by the tested vehicles by using Equations (3) and (4). The two indicators play a crucial role in understanding and managing traffic flow on roads and highways. The distribution of these indicators through multiple constant driving speeds performed by humans and AVs will certainly clarify the advantages of one driving method over the other. Additionally, it will differentiate the performance of ACC sensors used during the empirical test. The results presented in Table 4 indicate that ACC-equipped vehicles achieved lower percentages of densities and capacities than human-driven vehicles. Although, in a few cases, the ACC sensors might yield similar capacity values, they never fall below the capacities obtained by humans. The range between the minimum decrease and maximum decrease in capacity caused by using ACC systems is 0.8–28.2%, in which the minimum percentage is obtained at the highest driving speed, while the maximum percentage is obtained at the lowest speed. Sample calculations of traffic density and capacity for Subaru at 30 km/h are shown as follows:

Table 4.
Average traffic densities and capacities obtained by using test vehicles.
Figure 15 and Figure 16 summarize the results of the entire study, encompassing all analyzed measurements to facilitate a comprehensive comparison of relevant parameters. Figure 15 illustrates the relationship between clearance and density, demonstrating a smooth decrease in density with the gradual increase in clearances resulting from the incremental rise in speed for all tested vehicles. Conversely, Figure 16 depicts the impact of increasing clearances on capacity, indicating the time headway by the size of the dots in the graph.
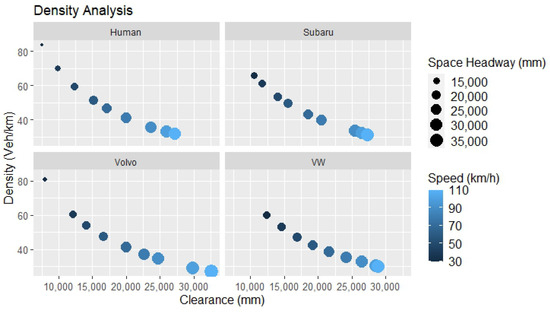
Figure 15.
Summary of average clearance, time headway, and capacity at all tested speeds.
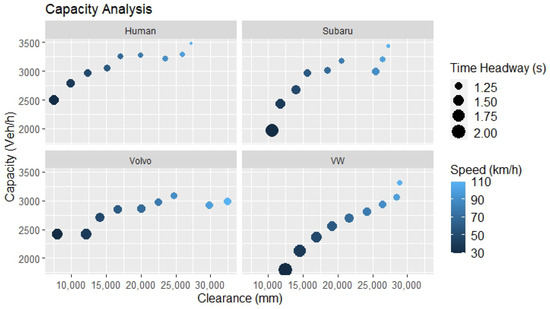
Figure 16.
Summary of average clearance, space headway, and density at all tested speeds.
The graph portrays an almost seamless increase in capacity with respect to the growing speed and subsequently increased clearances for both human-driven and VW vehicles. Subaru follows a similarly smooth trend in the graph, except at 90 km/h, where a sharp drop occurs. This can be attributed to the relatively high difference in time headway, when 1.136 s and 1.207 s were reported at driving speeds of 80 km/h and 90 km/h, respectively. In contrast, Volvo yielded more oscillated capacity results due to its reliance on time settings of ACC rather than distance settings as for Subaru and VW.
At the end of our analysis, Figure 17 provides a comprehensive depiction of the intricate relationship between capacity and density across all driving modes, examined under driving speeds. This visual representation serves to underscore and elucidate the assertions made earlier in our investigation, specifically focusing on the performance of vehicles with respect to car-following behavior. As discerned from the data presented in Figure 17, both human-driven vehicles and VW demonstrated notably superior values, attaining 0.94 and 0.97, respectively. In stark contrast, Subaru and Volvo vehicles exhibited lower values of 0.85 and 0.82, respectively. This discrepancy in values underscores the distinctive car-following behaviors exhibited by these vehicle types under the conditions of our study, with human-driven and VW vehicles outperforming their Subaru and Volvo counterparts. Such insights contribute to an understanding of the dynamics associated with different driving modes and vehicles in the context of field driving speeds and car-following behavior.
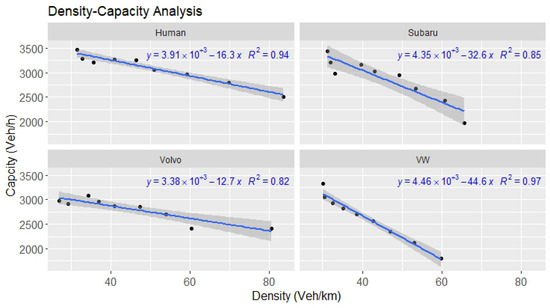
Figure 17.
Density and Capacity Relationship.
5. Discussion
This study investigated the impact of car-following behavior on traffic characteristics using both traditional human-driven vehicles and different ACC-equipped vehicles. Controlled empirical tests have been conducted to collect data through driving at multiple test steady speeds. The diverse selection of ACC sensors provides insights into the anticipated behavior of future promised AVs and their impact on traffic flow and capacity. During the experiment, the shortest setting of the ACC controller was used, which maintains the shortest following distance or following time as specified by the vehicle manufacturer. This setting yielded the maximum flow under controlled conditions, representing the capacity of the studied roads. The results indicate that human drivers exhibit the shortest following distances, resulting in higher capacities compared to the tested ACC systems across all driving speeds. However, variations in behavior among different ACC systems are evident. The study demonstrates the disadvantages of ACC technology, as evidenced by the percentage decrease in capacity compared to conventional driving. The results also show that although there was uncertainty at 30 km/h (especially for Volvo), this might have resulted from the very low speed applied to examine the systems. The Subaru ACC system, represented by the camera-based sensor ’Eyesight,’ outperformed other tested ACC systems, exhibiting a percentage decrease ranging from 3.2% to 12.9% at speeds between 40 km/h and 80 km/h. Following closely is the combined camera- and radar-based ACC in Volvo. Despite ranking last in terms of capacity increase linearity, as illustrated in Figure 17, it demonstrated a moderate decrease in capacity ranging from 9.5% to 13.5% at speeds from 40 km/h to 80 km/h. Conversely, VW showcased a uniform increase in capacity values corresponding to the rise in driving speed. This could be attributed to the efficiency of electric engines, renowned for their precise management of acceleration and deceleration owing to the instantaneous torque delivery of electric motors. This capability enables the radar-based ACC system to execute precise adjustments, ensuring the maintenance of a steady following distance. However, in comparison to human drivers, the VW ACC system results in a higher percentage decrease in capacity, ranging from 14.0% to 24.1% at driving speeds between 40 km/h and 80 km/h.
At higher speeds, while human-driven vehicles continued to provide higher capacities, there was an oscillation in capacity decrement percentages for ACC vehicles. However, there was an observed oscillation in the capacity decrement percentages for ACC-equipped vehicles. Specifically, the Subaru and VW systems exhibited notable decreases, particularly at 100 km/h and 110 km/h, with a range of 2.6% to 0.8% for Subaru and 7.2% to 4.4% for VW. In contrast, the performance of the Volvo ACC system was less satisfactory, displaying higher percentages of capacity decrement, reaching 14.3% at 110 km/h. This disparity could be attributed to the larger frontal area of the Volvo sport utility vehicle, which leads to increased aerodynamic resistance, as the vehicle encounters greater air resistance or drag.
Overall, when comparing our study’s results to those of other empirical studies in the literature, the average human-driven time headway in our investigation was found to be 1.175 s. This figure is lower than the measurements reported by Makridis et al. [31], where the ACCs’ minimum and maximum time headway ranged between 1.36 and 2.5 s in their empirical study. Additionally, the average time gap observed in our study for conventional vehicles was 0.903 s, which is less than the average time gap for Eco short drive (reported as 0.966 s for driving speeds of 50, 70, and 90 km/h) in ref. [30]. In terms of capacity mitigation resulting from the use of ACC systems, Shang and Stern [33] stated in their study that when commercially available ACC vehicles are simulated, the capacity decreases by 35%. Notably, this value was higher than the capacity mitigation values obtained in our study with the utilization of different ACC systems.
Finally, it is evident that the controlled environment of the ZalaZONE proving ground may differ from real-world driving conditions. Human behavior on public roads can be influenced by a myriad of factors, such as traffic congestion, road infrastructure, and unpredictable events. These factors may impact the comparison between measurements on the track and those on public roads. Nevertheless, the study provides a valuable benchmark for evaluating the performance and reliability of vehicles in controlled settings, enabling manufacturers to identify potential weaknesses and refine their technologies. Moreover, the insights gained from such analyses contribute to the ongoing development of autonomous and connected vehicles, fostering advancements that ultimately enhance safety and efficiency on the unpredictable terrain of public roads.
6. Conclusions
Extensive empirical testing was carried out at the ZalaZONE proving ground and in Győr City Road Networks, in Hungary, to delve into the dynamics of both ACC-equipped vehicles and conventional human-driven counterparts, scrutinizing their longitudinal driving effects on traffic flow and capacities. The experiment aimed to comprehensively explore the nuances of both driving scenarios through employing three distinct categories of ACC systems across various levels of driving speed. While the results underscored the ACC system’s ability to maintain more consistent car-following distances, thereby enhancing safety in comparison to human drivers, a notable downside emerged in terms of their adverse impact on road capacities. The results indicate a mitigation in capacity percentages of 7.6%, 9.3%, and 15.6% for the three types of ACC, respectively, in comparison to human drivers. This underscores the intricate dynamics involved in human decision making and adaptability, ultimately contributing to higher traffic capacities in real-world driving scenarios. However, this study focused on collecting data under favorable conditions and did not assess the performance of the vehicles under adverse conditions.
In general, while ACC systems can contribute to smoother traffic flow under certain conditions, human drivers’ adaptability and communication abilities may still provide advantages in handling complex and unpredictable situations. As we navigate the landscape of automated driving technologies, understanding and addressing these differences will be crucial for the successful integration of such systems into diverse traffic environments. In addition, enabling vehicles to communicate and collaborate with each other through the use of cooperative adaptive cruise control (CACC) will allow vehicles to travel in closer proximity, capitalizing on real-time data exchange to synchronize speeds and maintain a smoother, more efficient traffic flow. Ultimately, the integration of cooperative elements empowers CACC to outperform its predecessors, leading to increased road capacities and a more streamlined driving experience.
Author Contributions
Conceptualization, B.H. and D.M.; methodology, B.H.; formal analysis, D.M.; investigation, D.M. and B.H.; writing—original draft preparation, D.M.; writing—review and editing, B.H.; visualization, D.M.; All authors have read and agreed to the published version of the manuscript.
Funding
This research received no external funding.
Institutional Review Board Statement
Not applicable.
Informed Consent Statement
Not applicable.
Data Availability Statement
The data presented in this study are available on request from the corresponding author. The data are not publicly available due to the interests of those providing the location and conditions of the measurement.
Acknowledgments
We hereby thank the kind help and support of the staff members of the Vehicle Research Center at Széchenyi István University located at the ZalaZone proving ground and the staff members of the Department of Transport at Széchenyi István University for helping to perform the human-driven measures.
Conflicts of Interest
The authors declare no conflicts of interest.
Abbreviations
The following abbreviations are used in this manuscript:
| ACC | Adaptive Cruise Control |
References
- Li, Y.; Li, Z.; Wang, H.; Wang, W.; Xing, L. Evaluating the safety impact of adaptive cruise control in traffic oscillations on freeways. Accid. Anal. Prev. 2017, 104, 137–145. [Google Scholar] [CrossRef] [PubMed]
- Li, Y.; Wang, H.; Wang, W.; Xing, L.; Liu, S.; Wei, X. Evaluation of the impacts of cooperative adaptive cruise control on reducing rear-end collision risks on freeways. Accid. Anal. Prev. 2017, 98, 87–95. [Google Scholar] [CrossRef] [PubMed]
- Luo, L.; Liu, M.; Mei, J.; Chen, Y.; Bi, L. A Visual-Based Approach for Drivers Environment Perception and Quantification in Different Weather Conditions. Appl. Sci. 2023, 13, 176. [Google Scholar] [CrossRef]
- Aloufi, N.; Alnori, A.; Thayananthan, V.; Basuhail, A. Object Detection Performance Evaluation for Autonomous Vehicles in Sandy Weather Environments. Appl. Sci. 2023, 13, 10249. [Google Scholar] [CrossRef]
- He, Y.; Ciuffo, B.; Zhou, Q.; Makridis, M.; Mattas, K.; Li, J.; Li, Z.; Yan, F.; Xu, H. Adaptive Cruise Control Strategies Implemented on Experimental Vehicles: A Review. IFAC-PapersOnLine 2019, 52, 21–27. [Google Scholar] [CrossRef]
- Vlacic, L.; Parent, M.; Harashima, F. (Eds.) Intelligent Vehicle Technologies; Automotive Engineering Series; Butterworth-Heinemann: Oxford, UK, 2001. [Google Scholar] [CrossRef]
- Miyata, S.; Nakagami, T.; Kobayashi, S.; Izumi, T.; Naito, H.; Yanou, A.; Nakamura, H.; Takehara, S. Improvement of adaptive cruise control performance. Eurasip J. Adv. Signal Process. 2010, 2010, 295016. [Google Scholar] [CrossRef][Green Version]
- Rahman, R.; Hasan, S.; Zaki, M.H. Towards reducing the number of crashes during hurricane evacuation: Assessing the potential safety impact of adaptive cruise control systems. Transp. Res. Part C Emerg. Technol. 2021, 128, 103188. [Google Scholar] [CrossRef]
- Wang, J.; Rajamani, R. The impact of adaptive cruise control systems on highway safety and traffic flow. Proc. Theinstitution Mech. Eng. Part D J. Automob. Eng. 2004, 218, 111–130. [Google Scholar] [CrossRef]
- Shladover, S.E.; Su, D.; Lu, X.Y. Impacts of cooperative adaptive cruise control on freeway traffic flow. Transp. Res. Rec. 2012, 2324. [Google Scholar] [CrossRef]
- Aria, E.; Olstam, J.; Schwietering, C. Investigation of Automated Vehicle Effects on Driver’s Behavior and Traffic Performance. Transp. Res. Procedia 2016, 15, 761–770. [Google Scholar] [CrossRef]
- Lu, Q.; Tettamanti, T.; Hörcher, D.; Varga, I. The impact of autonomous vehicles on urban traffic network capacity: An experimental analysis by microscopic traffic simulation. Transp. Lett. 2020, 12, 540–549. [Google Scholar] [CrossRef]
- Masello, L.; Castignani, G.; Sheehan, B.; Murphy, F.; McDonnell, K. On the road safety benefits of advanced driver assistance systems in different driving contexts. Transp. Res. Interdiscip. Perspect. 2022, 15, 100670. [Google Scholar] [CrossRef]
- Ju, P.; Song, J. An Improved Advanced Driver-Assistance System: Model-Free Prescribed Performance Adaptive Cruise Control. Appl. Sci. 2023, 13, 11499. [Google Scholar] [CrossRef]
- Arem, B.V.; Driel, C.J.V.; Visser, R. The impact of cooperative adaptive cruise control on traffic-flow characteristics. IEEE Trans. Intell. Transp. Syst. 2006, 7, 429–436. [Google Scholar] [CrossRef]
- Fernandes, P.; Nunes, U. Multiplatooning leaders positioning and cooperative behavior algorithms of communicant automated vehicles for high traffic capacity. IEEE Trans. Intell. Transp. Syst. 2015, 16, 1172–1187. [Google Scholar] [CrossRef]
- Harwood, N.; Reed, N. Modelling the impact of platooning on motorway capacity. In Proceedings of the IET Conference, London, UK, 6–7 October 2014; Volume 2014. [Google Scholar] [CrossRef]
- Borneo, A.; Zerbato, L.; Miretti, F.; Tota, A.; Galvagno, E.; Misul, D.A. Platooning Cooperative Adaptive Cruise Control for Dynamic Performance and Energy Saving: A Comparative Study of Linear Quadratic and Reinforcement Learning-Based Controllers. Appl. Sci. 2023, 13, 10459. [Google Scholar] [CrossRef]
- Mohammed, D.; Horváth, B. Vehicle Automation Impact on Traffic Flow and Stability: A Review of Literature. Acta Polytech. Hung. 2023, 20. [Google Scholar] [CrossRef]
- Kesting, A.; Treiber, M.; Schönhof, M.; Kranke, F.; Helbing, D. Jam-Avoiding Adaptive Cruise Control (ACC) and its Impact on Traffic Dynamics. In Traffic and Granular Flow’05; Springer: Cham, Switzerland, 2007; pp. 633–643. [Google Scholar] [CrossRef]
- Shi, X.; Li, X. Empirical study on car-following characteristics of commercial automated vehicles with different headway settings. Transp. Res. Part C Emerg. Technol. 2021, 128, 103134. [Google Scholar] [CrossRef]
- Arnaout, G.M.; Arnaout, J.P. Exploring the effects of cooperative adaptive cruise control on highway traffic flow using microscopic traffic simulation. Transp. Plan. Technol. 2014, 37, 186–199. [Google Scholar] [CrossRef]
- Park, J.E.; Byun, W.; Kim, Y.; Ahn, H.; Shin, D.K. The Impact of Automated Vehicles on Traffic Flow and Road Capacity on Urban Road Networks. J. Adv. Transp. 2021, 2021, 8404951. [Google Scholar] [CrossRef]
- VanderWerf, J.; Shladover, S.E.; Miller, M.A.; Kourjanskaia, N. Effects of adaptive cruise control systems on highway traffic flow capacity. Transp. Res. Rec. 2002, 1800, 78–84. [Google Scholar] [CrossRef]
- Calvert, S.C.; Schakel, W.J.; van Lint, J.W. Will automated vehicles negatively impact traffic flow? J. Adv. Transp. 2017, 2017, 3082781. [Google Scholar] [CrossRef]
- James, R.M.; Melson, C.; Hu, J.; Bared, J. Characterizing the impact of production adaptive cruise control on traffic flow: An investigation. Transportmetrica B 2019, 7, 992–1012. [Google Scholar] [CrossRef]
- Şentürk Berktaş, E.; Tanyel, S. Effect of Autonomous Vehicles on Performance of Signalized Intersections. J. Transp. Eng. Part A Syst. 2020, 146, 04019061. [Google Scholar] [CrossRef]
- Ploeg, J.; Scheepers, B.T.; Nunen, E.V.; Wouw, N.V.D.; Nijmeijer, H. Design and experimental evaluation of cooperative adaptive cruise control. In Proceedings of the IEEE Conference on Intelligent Transportation Systems—ITSC, Washington, DC, USA, 5–7 October 2011. [Google Scholar] [CrossRef]
- Gunter, G.; Gloudemans, D.; Stern, R.E.; McQuade, S.; Bhadani, R.; Bunting, M.; Monache, M.L.D.; Lysecky, R.; Seibold, B.; Sprinkle, J.; et al. Are Commercially Implemented Adaptive Cruise Control Systems String Stable? IEEE Trans. Intell. Transp. Syst. 2021, 22, 6992–7003. [Google Scholar] [CrossRef]
- Raju, N.; Schakel, W.; Reddy, N.; Dong, Y.; Farah, H. Car-Following Properties of a Commercial Adaptive Cruise Control System: A Pilot Field Test. Transp. Res. Rec. 2022, 2676, 128–143. [Google Scholar] [CrossRef]
- Makridis, M.; Mattas, K.; Ciuffo, B.; Re, F.; Kriston, A.; Minarini, F.; Rognelund, G. Empirical Study on the Properties of Adaptive Cruise Control Systems and Their Impact on Traffic Flow and String Stability. Transp. Res. Rec. 2020, 2674, 471–484. [Google Scholar] [CrossRef]
- Garber, N.J.; Hoel, L.A. Traffic and Highway Engineering; Cengage Learning: Boston, MA, USA, 2014. [Google Scholar]
- Shang, M.; Stern, R.E. Impacts of commercially available adaptive cruise control vehicles on highway stability and throughput. Transp. Res. Part C Emerg. Technol. 2021, 122, 102897. [Google Scholar] [CrossRef]
Disclaimer/Publisher’s Note: The statements, opinions and data contained in all publications are solely those of the individual author(s) and contributor(s) and not of MDPI and/or the editor(s). MDPI and/or the editor(s) disclaim responsibility for any injury to people or property resulting from any ideas, methods, instructions or products referred to in the content. |
© 2023 by the authors. Licensee MDPI, Basel, Switzerland. This article is an open access article distributed under the terms and conditions of the Creative Commons Attribution (CC BY) license (https://creativecommons.org/licenses/by/4.0/).